Article

Hypercapnia Increases Influenza A Virus Infection of Bronchial Epithelial Cells by Augmenting Cellular Cholesterol via mTOR and Akt

by
Fei Chen
1,
Aiko Matsuda
1,
Peter H. S. Sporn
1,2,† and
S. Marina Casalino-Matsuda
1,*,†
1
Division of Pulmonary and Critical Care Medicine, Feinberg School of Medicine, Northwestern University, Chicago, IL 60611, USA
2
Research Service, Jesse Brown Veterans Affairs Medical Center, Chicago, IL 60612, USA
*
Author to whom correspondence should be addressed.
These authors contributed equally to this work.
Int. J. Mol. Sci. 2025, 26(9), 4133; https://doi.org/10.3390/ijms26094133
Submission received: 5 October 2024 / Revised: 21 April 2025 / Accepted: 23 April 2025 / Published: 26 April 2025
(This article belongs to the Special Issue New Advances in Hypercapnia)

Abstract

:
Hypercapnia, the elevation of CO2 in blood and tissue, is a risk factor for mortality in patients with severe lung disease and pulmonary infections. We previously showed that hypercapnia increases viral replication and mortality in mice infected with influenza A virus (IAV). Elevated CO2 also augmented cholesterol content and pseudo-SARS-CoV-2 entry in bronchial epithelial cells. Interestingly, cellular cholesterol facilitates IAV uptake, replication, assembly, and egress from cells. Here, we report that hypercapnia increases viral protein expression in airway epithelium of mice infected with IAV. Elevated CO2 also enhanced IAV adhesion and internalization, viral protein expression, and viral replication in bronchial epithelial cells. Hypercapnia increased the expression and activation of the transcription factor sterol-regulatory element binding protein 2 (SREBP2), resulting in elevated expression of cholesterol synthesis enzymes, decreased expression of a cholesterol efflux transporter, and augmented cellular cholesterol. Moreover, reducing cellular cholesterol with an SREBP2 inhibitor or statins blocked hypercapnia-induced increases in viral adhesion and internalization, viral protein expression, and IAV replication. Inhibitors of mTOR and Akt also blocked the effect of hypercapnia on viral growth. Our findings suggest that targeting cholesterol synthesis and/or mTOR/Akt signaling may hold promise for reducing susceptibility to influenza infection in patients with advanced lung disease and hypercapnia.

Graphical Abstract

1. Introduction

Hypercapnia, elevation of the partial pressure of carbon dioxide (CO2) in blood and tissue, commonly develops in severe acute and chronic lung diseases, including advanced chronic obstructive pulmonary disease (COPD) [1,2,3,4,5]. Importantly, these clinical scenarios associated with hypercapnia all carry a high risk of pulmonary infection, including community-acquired pneumonia [6]. Also, bacterial and viral pulmonary infections, especially influenza [7,8,9], are a principal cause of acute COPD exacerbations [10] and are linked to increased need for hospitalization and to mortality [11]. Moreover, hypercapnia is an independent risk factor for mortality in adults hospitalized with community-acquired pneumonia [6,12], children with adenoviral lung infections [13], and patients with cystic fibrosis awaiting lung transplantation [14]. In addition, in patients with acute respiratory failure due to severe COVID-19, hypercapnia was associated with prolonged time on mechanical ventilation and a greater length of stay in the intensive care unit [15]. We previously reported that hypercapnia increased expression of viral proteins, viral replication, lung injury, and mortality in mice infected with influenza A virus (IAV) [16,17]. Also, in a transcriptional profiling study of differentiated human bronchial epithelial (HBE) cells, we found that hypercapnia increased expression of cholesterol biosynthesis genes, including 3-hydroxy-3-methylglutaryl-CoA synthase 1 (HMGCS1), and decreased expression of ABC transporters, which promote cholesterol efflux [18]. These genes are regulated by the transcription factor sterol-regulatory element binding protein 2 (SREBP2), master regulator of cholesterol synthesis and transport gene expression [19]. Further, we reported that hypercapnia increases protein expression and activation of SREBP2, elevating cellular cholesterol and enhancing entry of SARS-CoV-2 pseudovirus into bronchial epithelial cells [20]. Previous findings that cellular cholesterol is also important for binding, internalization, and budding of influenza virus [21,22,23,24] suggested that hypercapnia might enhance IAV infection by this pathway as well. In another study, we showed that hypercapnia increases Akt phosphorylation and that inhibition of Akt blocks hypercapnia-induced IAV replication in alveolar macrophages [16]. Notably, Akt functions both upstream and downstream in the mTOR pathway, which plays a central role in regulating translation, lipid synthesis, nucleotide synthesis, lysosome biogenesis, nutrient sensing, and growth factor signaling [25]. mTOR signaling is mediated by two distinct multi-subunit complexes, mTOR complex 1 and 2 (mTORC1 and mTORC2), which incorporate the proteins Raptor and Rictor, respectively, as well as other binding partners. Akt activates mTORC1 by phosphorylating and deactivating its negative regulator, Tsc2 [26]. Activated mTORC1, in turn, phosphorylates and activates ribosomal S6 kinases S6K1 and S6K2, while mTORC2 phosphorylates and activates Akt [25,26]. Whether hypercapnia activates Akt in epithelial cells, and the possibility that mTOR and Akt mediate effects of elevated CO2 in bronchial epithelium, has not previously been investigated.
In the current study, we explored the effects of hypercapnia on IAV infection in airway epithelial cells. We found that hypercapnia increases viral protein expression in mouse airway epithelium and human bronchial epithelial cells. Elevated CO2 also augmented cellular cholesterol content, and decreasing cellular cholesterol with statins or an SREBP2 inhibitor blocked the hypercapnia-induced elevation in IAV adhesion and internalization, viral protein expression, and viral replication in epithelial cells. These effects of hypercapnia were dependent on CO2-induced signaling via mTOR and Akt, which, in turn, increased expression and activation of SREBP2. Our data suggest that targeting cholesterol synthesis and/or mTOR/Akt signaling may hold promise for ameliorating hypercapnia-induced immunosuppression and improving resistance to viral infection in patients with advanced lung disease and hypercapnia.

2. Results

2.1. Hypercapnia Increases Viral Protein Expression in Mouse Bronchial Epithelium Following IAV Infection In Vivo and in Human Bronchial Epithelial Cells Infected with IAV In Vitro

To investigate the effects of elevated CO2 on IAV infection in vivo, we exposed mice to normoxic hypercapnia (10% CO2/21% O2) for 3 days prior to virus infection. We previously reported that exposure of mice to 10% CO2 for 3 days increases arterial PCO2 to ~75 mm Hg, as compared to ~40 mm Hg in air-breathing animals, and allows for maximal renal compensation of respiratory acidosis, resulting in an arterial pH of ~7.3 [27]. Mice were then infected with 30 plaque-forming units (pfus) IAV (A/WSN/1933), after which expression of viral proteins in lung tissue was assessed by immunofluorescence (IF) microscopy. As shown in Figure 1A–C, expression of IAV non-structural protein 1 (NS1), which inhibits the host antiviral response and regulates viral replication [28], and matrix-2 protein (M2), a proton channel essential for the virus to replicate [29], was elevated in bronchial epithelium of mice breathing 10% CO2, as compared to air, at 4 days postinfection (dpi). Similarly, NS1 protein expression was elevated in HBE (Figure 1D,E) and BEAS-2B (Figure 1F,G) cells infected with IAV when cultured under hypercapnic (15% CO2/21% O2/64% N2) as compared to normocapnic (5% CO2/95% air) conditions. These results corroborate our previous finding that hypercapnia increases IAV infection of mouse bronchial epithelium in vivo [16] and demonstrate that elevated CO2 increases IAV protein expression and replication in human bronchial epithelial cells infected with IAV in vitro.

2.2. Hypercapnia Increases Cellular Cholesterol, and Inhibition of the Transcription Factor SREBP2 Blocks Hypercapnia-Induced Changes in Expression of the Cholesterol Synthesis Enzyme HMGCS1 and Efflux Transporter ABCA1

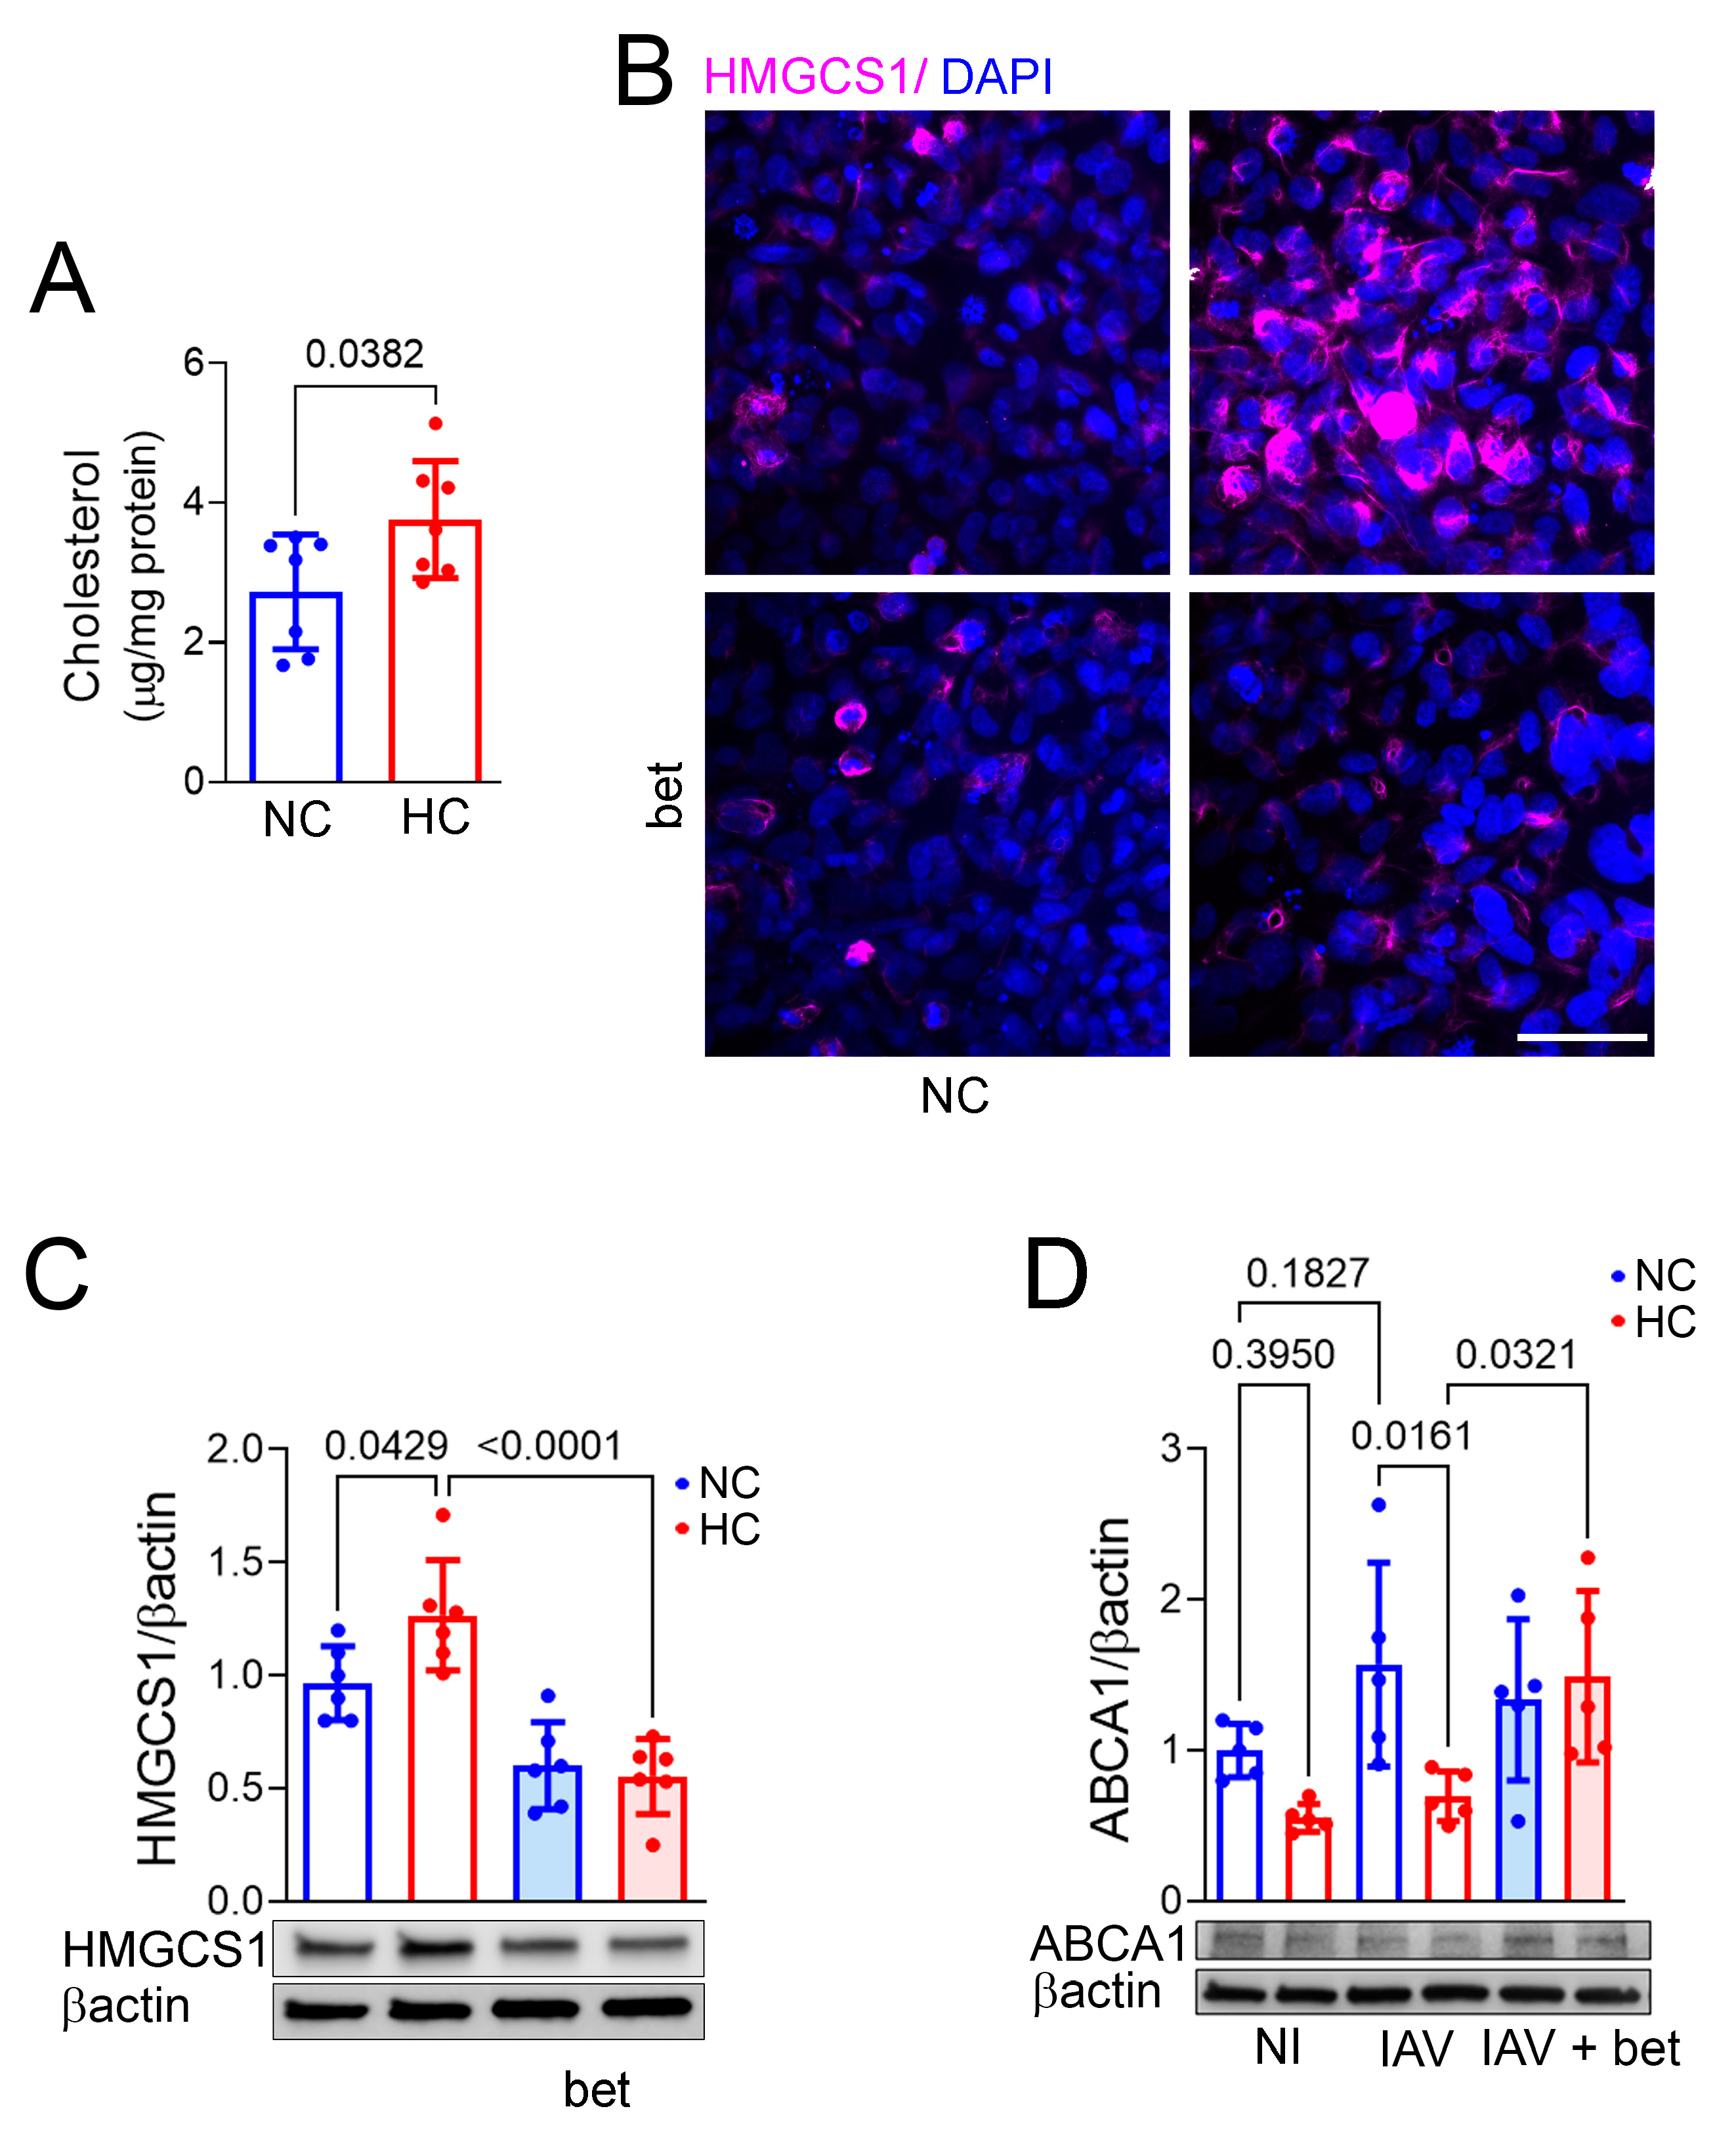
Cholesterol in the cell membrane and intracellular compartments plays a key role in influenza virus binding, internalization, and budding [21,22,23,24]. We previously showed that hypercapnia increases expression and activation of SREBP2, which regulates transcription of cholesterol synthesis and transport genes, concomitantly increasing expression of the key cholesterol synthesis enzyme HMGCS1, and decreased cholesterol efflux transporter ABCA1, in mouse bronchial epithelium [20]. Here we show that culture under hypercapnic conditions augmented the cholesterol content of BEAS-2B cells (Figure 2A). In addition, we found that the SREBP2 inhibitor betulin blocked the CO2-induced elevation in HMGCS1 protein expression in these cells (Figure 2B,C). Moreover, betulin blocked the decrease in ABCA1 caused by hypercapnia in BEAS-2B cells infected with IAV (Figure 2D). Thus, hypercapnia increases the cholesterol content of epithelial cells, which enhances their susceptibility to infection by IAV. The CO2-induced increase in cholesterol is accompanied by augmented expression of the cholesterol synthesis enzyme HMGCS1 and decreased expression of the efflux transporter ABCA1 ([20] and Figure 2B–D). Hypercapnia also increases expression of SREBP2, and an inhibitor of the transcription factor blocks the hypercapnia-induced changes in expression of both HMGCS1 and ABCA1.

2.3. Inhibiting Cellular Cholesterol Accumulation Blocks Hypercapnia-Induced Increases in IAV Adhesion and Internalization, NS1 Expression, and Viral Replication in Bronchial Epithelial Cells

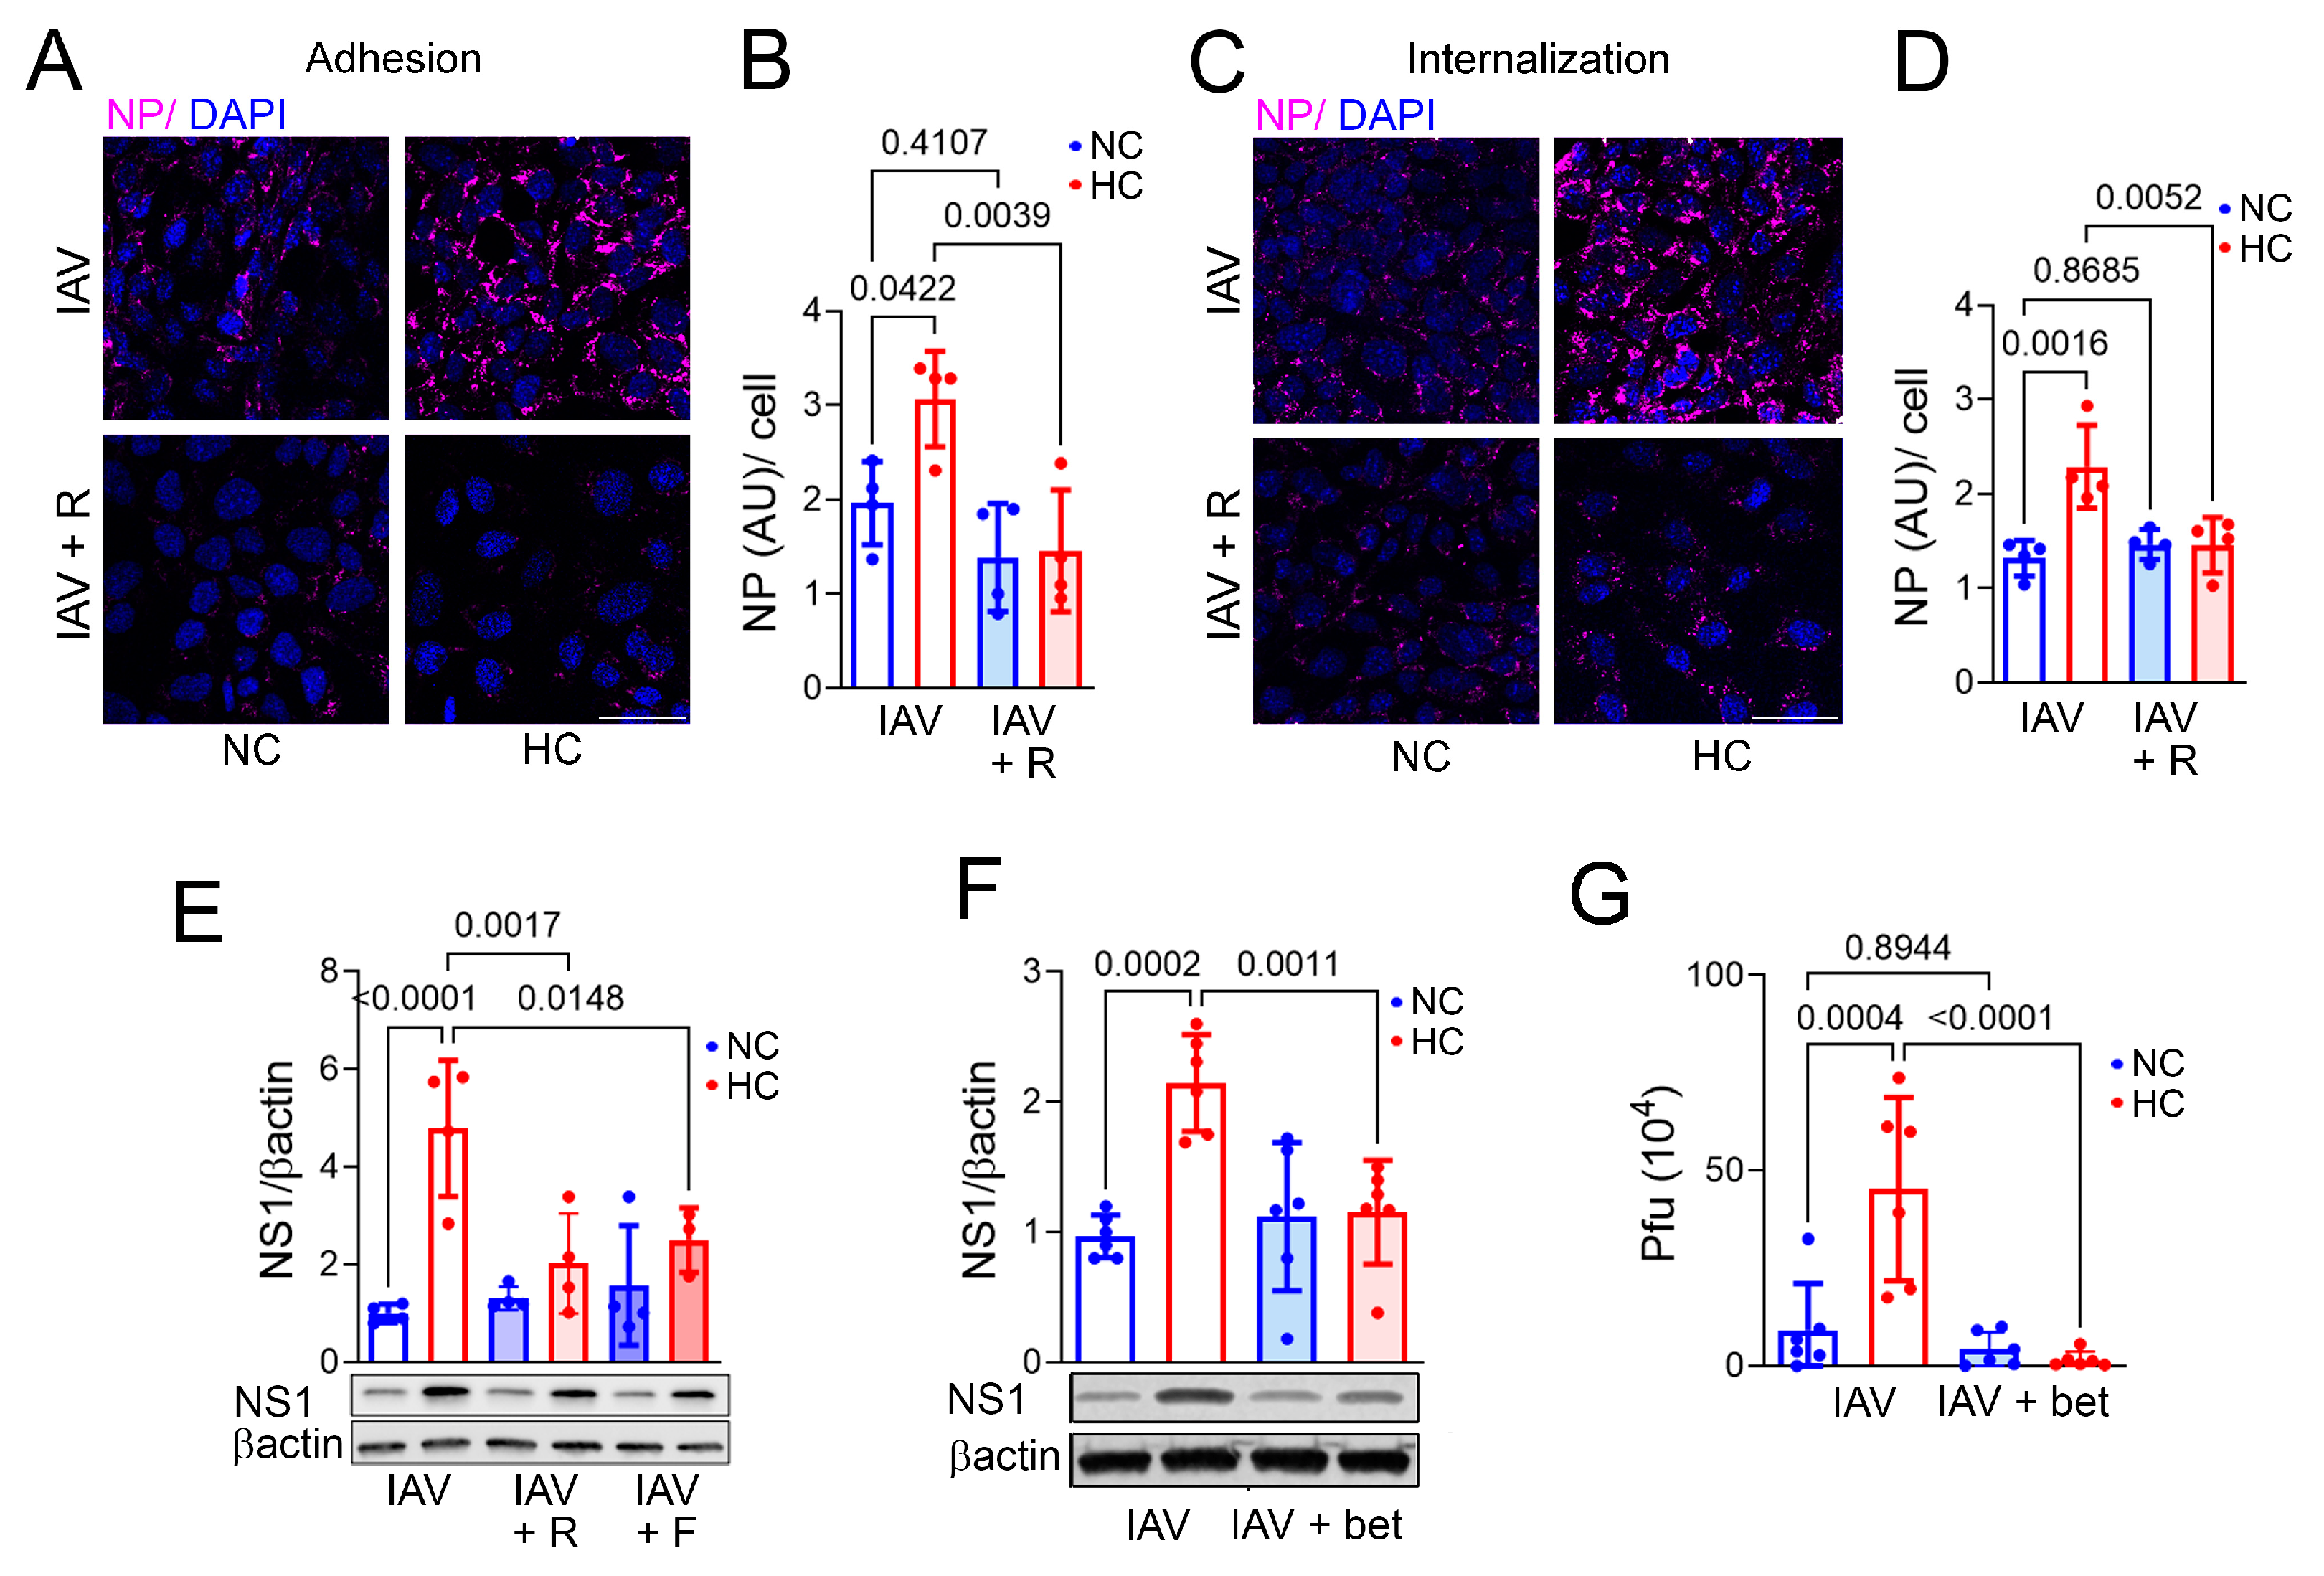
The initial steps in IAV infection include binding to the surface of a target cell, internalization, and trafficking of the virus within the cell. Cholesterol in the target cell membrane plays a critical role in each of these processes [23,30]. Therefore, we assessed the impact of hypercapnia on IAV adhesion and internalization in BEAS-2B cells. We found that hypercapnia increased both IAV adhesion (Figure 3A,B) and internalization (Figure 3C,D), assessed by quantitative analysis of cells immunostained for viral nucleoprotein (NP), which is critical for IAV nuclear import, genome transcription, and assembly [31]. To evaluate the possibility that hypercapnia enhanced viral adhesion and entry by increasing cholesterol in the cell membrane, we used statins which inhibit the rate-limiting cholesterol synthesis enzyme 3-hydroxy-3-methyl glutaryl-CoA reductase (HMGCR) [32,33] and the SREPB2 inhibitor betulin. We found that rosuvastatin blocked the increases in IAV adhesion (Figure 3A,B) and internalization (Figure 3C,D) induced by elevated CO2. In addition, rosuvastatin and fluvastatin blocked the hypercapnia-induced elevation in NS1 expression in BEAS-2B cells (Figure 3E). Betulin also blocked the CO2-induced increase in NS1 expression (Figure 3F) and the increase in IAV viral titer (Figure 3G) induced by hypercapnia. Thus, blocking the CO2-induced increase in cellular cholesterol prevents enhanced IAV adhesion and internalization, NS1 expression, and viral replication in bronchial epithelial cells cultured in hypercapnia.

2.4. Inhibition of mTOR Signaling Blocks the Hypercapnia-Induced Increase in Activation of SREBP2, Viral Protein Expression, and IAV Replication

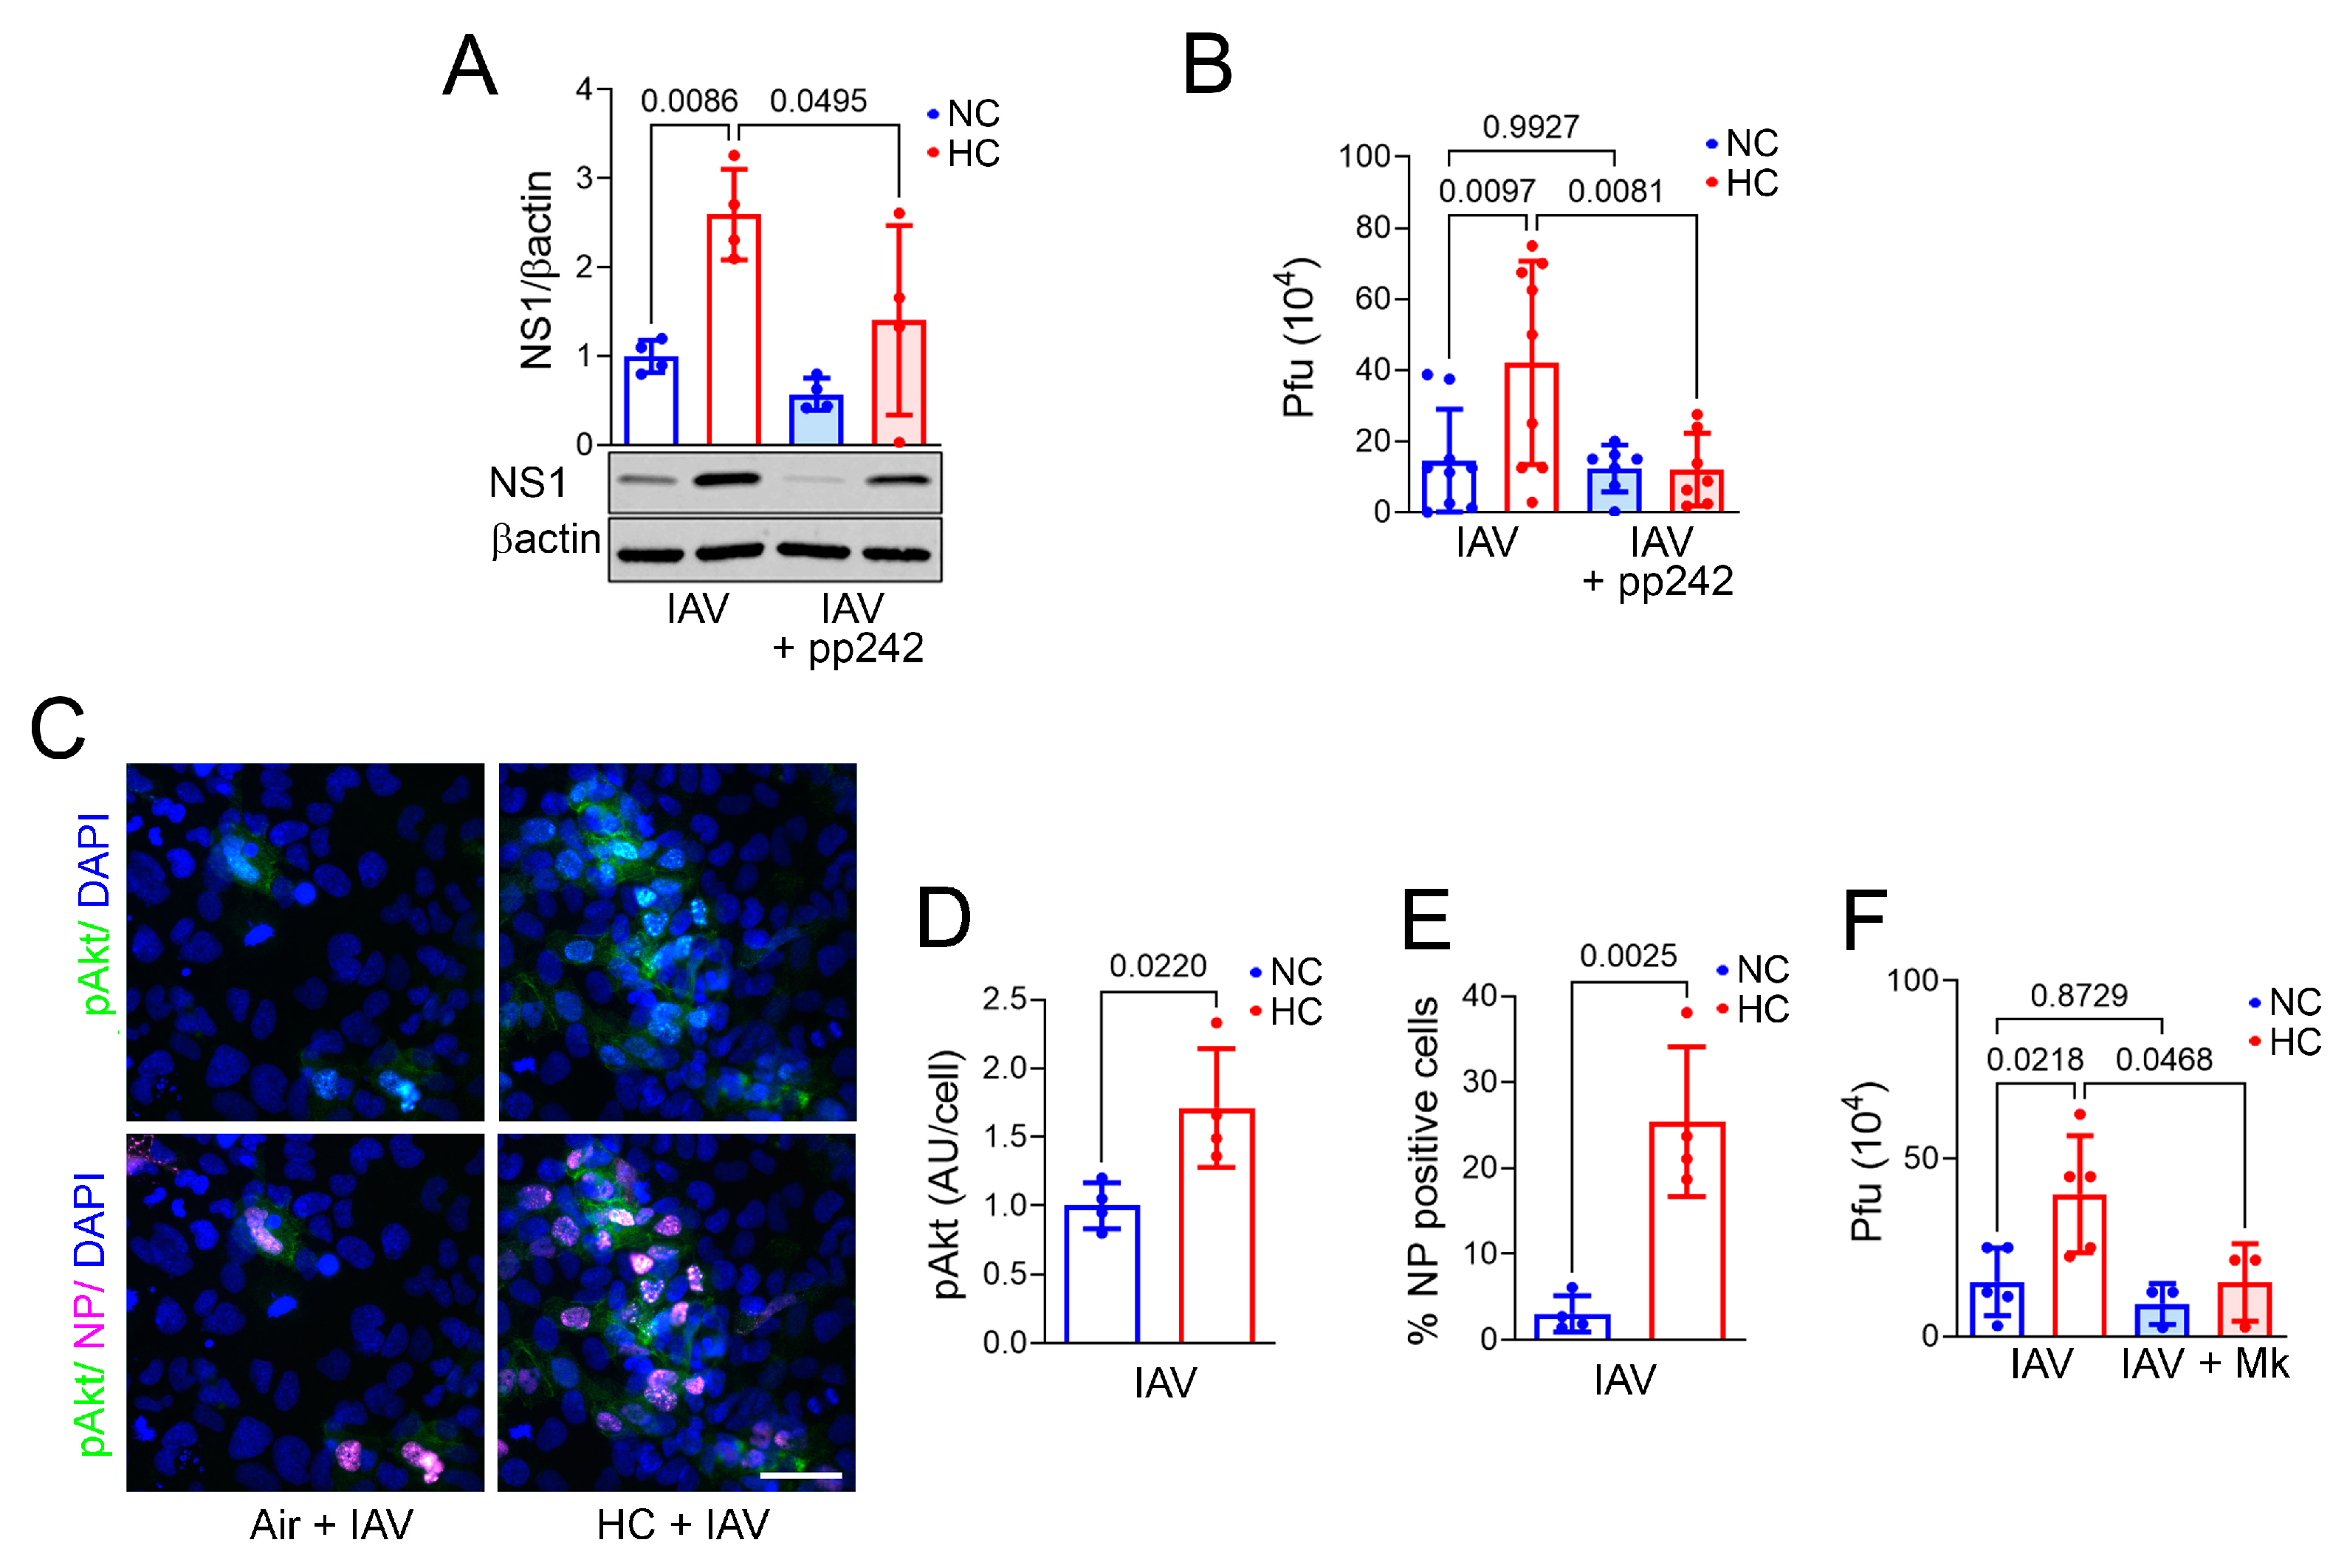
As noted, we previously showed that hypercapnia activates Akt in macrophages and that inhibition of Akt blocks hypercapnia-induced viral replication in alveolar macrophages [16]. mTOR plays a central role in regulating translation, lipid synthesis, nucleotide synthesis, biogenesis of lysosomes, nutrient sensing, and growth factor signaling [34]. mTOR signaling is mediated by two distinct multi-subunit complexes, mTOR complex 1 and 2 (mTORC1 and mTORC2), which incorporate the proteins Raptor and Rictor, respectively, as well as other binding partners. Major downstream targets activated by mTORC1 include ribosomal S6 kinases S6K1 and S6K2, while mTORC2 activates Akt [34]. In turn, S6K1 and Akt each activate SREBP2 [35,36,37]. In addition, we have previously published the finding that hypercapnia increases SREBP2 activation in BEAS2B cells [20]. Thus, we investigated the effect of the dual mTORC1/mTORC2 inhibitor pp242 [25,38] on SREPB2 activation in IAV-infected BEAS-2B cells. We found that pp242 blocked the hypercapnia-induced increase in the cleaved SREBP2 isoform (Figure S1), which is released from the endoplasmic reticulum and translocates to the nucleus. In addition, pp242 blocked hypercapnia-induced increases in cellular cholesterol (Figure S2), viral NS1 protein (Figure 4A), and viral replication (Figure 4B). Thus, blocking signaling via mTORC1 and mTORC2 inhibits activation of SREBP2, which decreases cellular cholesterol, thereby preventing the increase in IAV replication induced by elevated CO2.

2.5. Hypercapnia Triggers mTOR Signaling, Which Activates S6K1 and Akt in IAV-Infected Bronchial Epithelial Cells

We previously showed that hypercapnia increases Akt phosphorylation and that inhibition of Akt blocks CO2-induced viral replication in alveolar macrophages [16]. Notably, Akt is known to function both upstream and downstream in the mTOR pathway, in that it can activate mTORC1 and is, in turn, activated by both mTORC1 and mTORC2 [34]. Thus, we investigated the impact of the Akt inhibitor Mk2206 and the mTORC1/mTORC2 inhibitor pp242 on phosphorylation of the mTORC1 downstream substrate S6K1 and the mTORC2 target Akt [39]. First, we showed that hypercapnia increased activation of both S6K1 (Figure S3A) and Akt in IAV-infected BEAS-2B cells (Figure S3A and Figure 4C,D). CO2-induced activation of S6K1 phosphorylation in IAV infected cells was blocked by pp242 but not MK2206 (Figure S3A). On the other hand, Akt phosphorylation induced by hypercapnia in infected cells was blocked by both pp242 and Mk2206 (Figure S3B). These results suggest that hypercapnia activates mTORC1 and mTORC2, that activation of mTORC1 is independent of Akt, and that CO2-induced activation of Akt t is mediated by mTOR signaling via mTORC2.

2.6. Inhibition of Akt Blocks Hypercapnia-Induced Increases in IAV Replication and HMGCS1 Expression in BEAS-2B Cells and Blocks HMGCS1 and SREBP2 Expression in Mouse Bronchial Epithelium

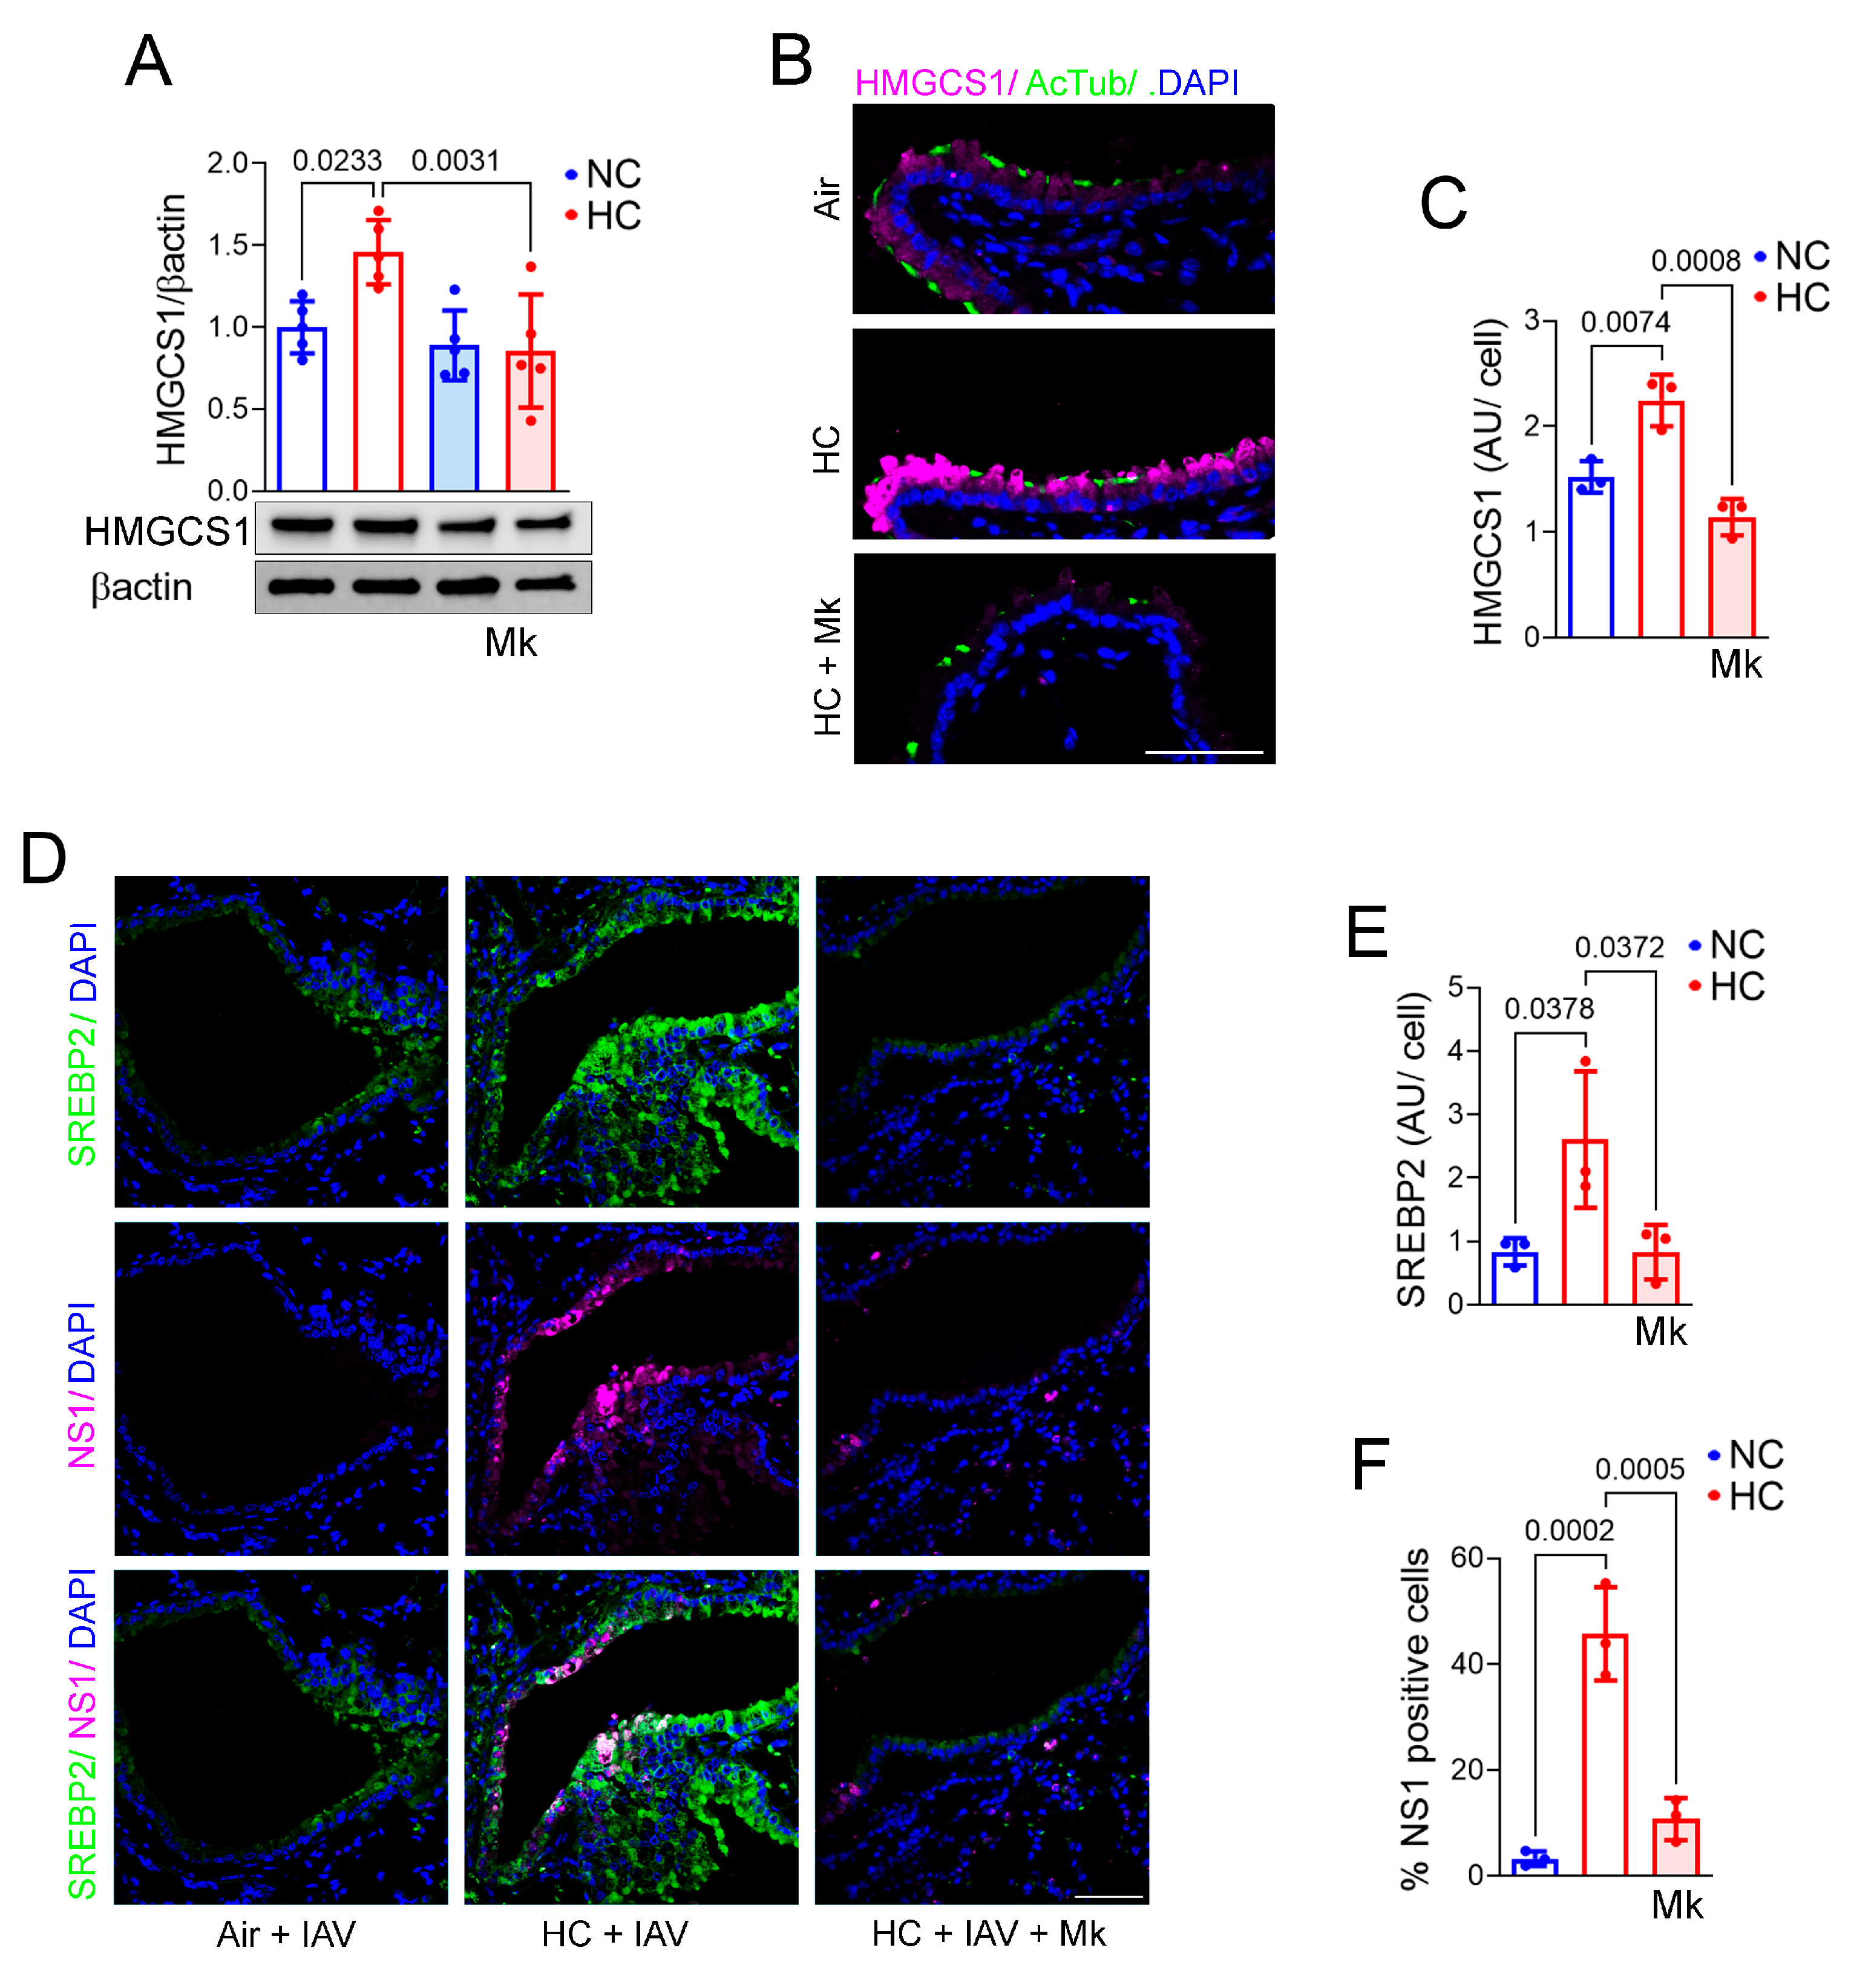
In addition to showing that hypercapnia activates Akt in IAV-infected BEAS-2B cells, we confirmed that this was associated with increased expression of viral NP protein in the setting of elevated CO2 (Figure 4C,E). Furthermore, the Akt inhibitor Mk2206 [40] blocked the hypercapnia-induced elevation in IAV replication (Figure 4F) and expression of HMGCS1 (Figure 5A) in BEAS-2B cells. This result parallels our previous finding that Mk2206 inhibited IAV replication in macrophages cultured in hypercapnia [16]. To determine the in vivo relevance of our findings in cultured BEAS-2B cells, we assessed expression of HMGCS1 and SREBP2 in the bronchial epithelium of mice exposed to air or 10% CO2 and dosed with Mk2206 by oral gavage. We found that Mk2206 blocked a robust hypercapnia-induced increase in bronchial epithelial HMGCS1 expression in the absence of infection (Figure 5B,C) and prevented increases in expression of SREBP2 and viral NS1 expression in IAV-infected mice breathing elevated CO2 (Figure 5D–F). These results suggest that activation of Akt by hypercapnia drives augmented expression of SREBP2 and HMGCS1, which increases cellular cholesterol, thereby facilitating IAV infection and increasing viral replication in bronchial epithelium.

3. Discussion

In the current study, we show for the first time that hypercapnia increases IAV infection in mouse and human bronchial epithelium, where influenza viruses first interact with the respiratory system and replicate [41]. We found that hypercapnia augmented viral adhesion and internalization, viral protein expression, and viral replication in bronchial epithelial cells. Hypercapnia also increased cellular cholesterol content, which occurred in association with elevated expression and activation of the transcription factor SREPB2 and the cholesterol synthesis enzyme HMGCS1 and with decreased expression of the cholesterol efflux transporter ABCA1. Moreover, pharmacological inhibition of cholesterol accumulation using betulin to inhibit SREBP2 or statins to inhibit HMGCR blocked the CO2-induced increases in IAV adhesion and internalization, viral proteins expression, and viral replication. In addition, we found that hypercapnia activates both mTOR signaling and Akt, that the dual mTORC1/mTORC2 inhibitor pp242 and the Akt inhibitor Mk2206 block increased expression and activation of SREBP2 (thereby preventing the elevation in cellular cholesterol), and that Mk2206 blocks NS1 protein expression (a correlate of IAV replication) in bronchial epithelial cells. Taken together, these results establish a causal role for mTOR and Akt signaling leading to an SREBP2-mediated increase in cellular cholesterol as the mechanism underlying the hypercapnia-induced elevation in IAV infection in bronchial epithelial cells.
Our observation that hypercapnia increased expression and activation of SREBP2, augmented HMGCS1, decreased ABCA1 expression, and increased cellular cholesterol content recapitulates similar findings in our previous study of hypercapnia’s effect on uptake of pseudo-SARS-CoV-2 in human bronchial epithelial cells [20]. By regulating cholesterol metabolism genes and increasing cellular cholesterol [19,42], SREBP2 had previously been shown to promote replication of IAV and other viruses [43,44,45]. Entry of influenza virus into host cells, virion assembly, and viral budding are dependent on the presence of cholesterol and lipid rafts in the host cells’ membranes [23,46]. Through its outer surface protein hemagglutinin, IAV binds sialic acid residues in glycolipids that concentrate with cholesterol in lipid rafts [47,48]. Moreover, cholesterol in the target membrane enhances viral binding avidity in a concentration-dependent manner [21]. These mechanisms likely contribute to the CO2-induced increase in viral replication in bronchial epithelial cells infected with IAV in hypercapnia. The elevation in viral growth was accompanied by increased expression of the IAV-encoded proteins NS1, NP, and M2 in epithelial cells exposed to elevated CO2 in vitro or in vivo; each of these proteins plays a critical role in the ability of the virus to replicate [28,29,31,49].
Given the importance of cholesterol in IAV adhesion and internalization, our finding that pharmacological inhibition of SREBP2 with betulin or HMGCR with statins blocks the hypercapnia-induced increase in IAV growth in bronchial epithelial cells strongly suggests that the increase in cellular cholesterol induced by elevated CO2 is central to the effect of hypercapnia on worsening outcomes of IAV infection in mice. However, our previous observation that hypercapnia suppresses the interferon-mediated antiviral host response to IAV without affecting virus adhesion or internalization in macrophages [16] indicates that elevated CO2 augments viral replication by more than one mechanism and that the pathways involved may differ depending on cell type.
Independent of hypercapnia, some reports indicate that pharmacologic inhibition or genetic silencing of SREBP2 [43,44,50,51] or statins suppresses viral infection [52], while others show no benefit of statins on IAV infection [53,54]. Here we show that betulin and statins inhibit IAV infection in bronchial epithelial cells under hypercapnia but not normocapnia. This suggest that conflicting results of clinical studies of statins on influenza outcomes [54,55] might, in part, be explained by the fact that none of these studies stratified patients according to whether or not they were hypercapnic.
SREBP2 is activated by several pathways, including the mTOR signaling pathway [37]. Activation of SREBP2 is mediated by mTORC1, which directly phosphorylates the ribosomal protein S6K1 [37,56]. Interestingly, the SREBP2 inhibitor betulin, which blocked the hypercapnia-induced increases in viral protein expression and IAV replication, has also been known to inhibit the mTOR pathway [57]. In addition, the PI3K/Akt/mTORC1 pathway is involved in SREBP2 transport to the Golgi, where it undergoes cleavage and activation [36,58]. It has also been reported that IAV activates mTORC1 and mTORC2 signaling and that the viral NS1 protein specifically promotes phosphorylation of Akt at a distinct site via mTORC2 [59]. In our study, the hypercapnia-induced increase in SREPB2 activation in IAV-infected bronchial epithelial cells was blocked by pp242, which inhibits both mTORC1 and mTORC2 [38]. This inhibitor also blocked increases in NS1 expression and IAV proliferation under conditions of elevated CO2. On the other hand, the Akt inhibitor Mk2206 did not block hypercapnia-induced activation of the mTORC1-target S6K1 in IAV-infected cells. This suggests that mTORC1 is activated independently of Akt in our system, possibly by the viral M2 protein, which was augmented by hypercapnia, and is known to promote mTORC1 activity [59]. The mTORC1/mTORC2 inhibitor pp242 also blocked Akt activation in IAV-infected cells, suggesting that hypercapnia-induced Akt activation is mediated by mTORC2, which is known to phosphorylate Akt [60]. Further, Mk2206 blocked the hypercapnia-induced increases in expression of SREBP2, HMGCS1, and viral NP, and IAV replication as well, indicating that effects of elevated CO2 on cholesterol accumulation and viral proliferation in bronchial epithelial cells are linked to Akt. It is also notable that statins can inhibit the Akt/mTOR pathway [61], so in addition to blocking hypercapnia-induced IAV replication by decreasing cholesterol synthesis, statins may also inhibit CO2 effects by interfering with Akt and mTOR signaling.
In conclusion, our findings suggest that pharmacologic inhibition of SREBP2, enzymes required for cholesterol biosynthesis, or the mTOR/Akt signaling pathway, may hold promise for reducing susceptibility to and/or improving outcomes of influenza infection in patients with advanced lung disease and hypercapnia.

4. Materials and Methods

4.1. Materials

All materials were purchased from Sigma-Aldrich, St. Louis, MO, USA; unless otherwise specified.

4.2. Mice

C57Bl/6 mice of 6 to 10 weeks of age and from Jackson Laboratories were used. Experiments were performed according to protocols approved by the Institutional Animal Care and Use Committee of Northwestern University and according to National Institutes of Health guidelines for the use of rodents.

Exposure of Mice to Hypercapnia and Influenza A Virus Infection

Mice were exposed to normoxic hypercapnia (10% CO2/21% O2/69% N2) in a BioSpherix A environmental chamber (BioSpherix, Lacona, NY, USA). O2 and CO2 concentrations in the chamber were maintained at the indicated levels using ProOx C21 O2 and CO2 controllers (BioSpherix). As controls in all experiments, age-matched mice, simultaneously maintained in air, were used. Mice pre-exposed to air or hypercapnia for 3 days were anesthetized with isoflurane and intubated with a 20-gauge Angiocath™ catheter (Becton, Dickinson and Company, Franklin Lakes, NJ, USA). Mice were inoculated intratracheally with IAV (A/WSN/33 [H1N1]), a mouse-adapted strain, kindly provided by Robert Lamb, Ph.D., Sc.D., Northwestern University, Evanston, IL, or with PBS as control, as previously described [16], and returned to their previous air or hypercapnia exposure. Mice were infected with 30 pfu/mouse in 50 μL of PBS. Animals were sacrificed at 1 and 4 dpi (Figure 1A). MK2206 (120 mg/kg body weight), or the drug vehicle captisol (MedChemExpress, Monmouth Junction, NJ USA) was administrated by oral gavage at 1 d before HC exposure and 2 days after HC exposure. Mice were sacrificed after 7 days of HC exposure (Figure 5B) or infected with IAV, as before, after 3 days of HC exposure and sacrificed at 7 dpi (Figure 5D). Mice infected with IAV were weighed daily and monitored every 8 h for development of severe distress (slowed respiration, failure to respond to cage tapping, failure of grooming, and fur ruffling). We previously showed that air-breathing mice infected with IAV at 30 pfu all survived, while those exposed to 10% CO2 exhibited 100% mortality by 10 dpi [16]. In addition, after IAV infection, mice lost weight at the same rate in air and 10% CO2, but IAV-induced inflammatory lung injury was greater in hypercapnic mice than in air-breathing mice [16].

4.3. Cells

Primary HBE cells (LONZA, Bend, OR, USA) were cultured on PneumaCult-Ex Plus media (StemCell, Cambridge, MA, USA). After 70–80% confluency, cells were dissociated with Animal Component-Free Cell Dissociation Kit (StemCell) and seeded on Transwells (Corning, Corning, NY, USA) coated with Collagen type IV (0.3 mg/mL, Sigma-Aldrich). When cells reached confluency, they were exposed to ALI, and the basal media was replaced with PneumaCult-ALI medium (StemCell). Experiments were performed upon full cell differentiation (∼3–4 wk on air) as assessed by visual confirmation of beating cilia and mucus [62]. BEAS-2B cells, a SV-40-transformed human bronchial epithelial cell line (ATCC CRL-9609), were cultured in DMEM: F12, 5% FBS media. Cells were incubated at 37 °C, 5% CO2, and all media contain penicillin (100 U/mL) and streptomycin (100 μg/mL).

Exposure of Cells to Normocapnia and Hypercapnia and Infection with IAV

Cells were exposed to normocapnia (5% CO2, PCO2 36 mmHg/95% air) or normoxic hypercapnia (15% CO2, PCO2 108 mmHg)/21% O2/64% N2, in a C-174, Biospherix environmental chamber). This chamber was contained within the same incubator where control cultures were simultaneously exposed to normocapnia. Before addition to cultures, media were pre-saturated with 5% or 15% CO2. Cells were pre-exposed to normocapnia or hypercapnia for 2 days, and IAV (MOI 1) was added for 1 h. Then, the cells were washed and cultured for an additional day in normocapnia or hypercapnia, respectively.

4.4. Immunofluorescence Microscopy in Tissue Sections and Cell Cultures

Mice were euthanized, lungs were HBSS perfused via the right ventricle, and a 20-gauge angiocath was sutured into the trachea. Lungs and heart were removed en bloc, and lungs were inflated with 0.8 mL of formalin at a pressure of 16 cm H2O. Tissue was embedded in paraffin, and 5-μm sections were then deparaffinized with xylene, rehydrated by using graded ethanol, and subjected to antigen retrieval using sodium citrate buffer (10 mM, pH 6.0), as before [16]. Tissues were labeled with anti-NS1 (GeneTex, Irvine, CA, USA; GTX125990), anti-M2 (Invitrogen, Irvine, CA, USA; MA1-082), anti-ABCA1 (Thermo Fisher Scientific, Waltham, MA, USA; MA5-16026), anti-SREBP2 (Novus, Centennial CO, USA; NBP1-54446SS), or anti HMGCS1 (Abcam, Waltham, MA, USA; ab87246) antibodies followed by Alexa-conjugated secondary antibodies (1 μg/mL). Cells were fixed with 4% PFA for 15 min, permeabilized with 0.1% Triton X100 for 5 min, and labeled with anti-NS1, anti NP (Abcam, ab128193), or anti-anti-pS473Akt (CellSignal, 4060S) antibodies followed by Alexa-conjugated secondary antibodies. Cells were co-labeled with acetylated tubulin (cilliated cell marker) using anti-acetylated-tubulin (T7451) antibody, followed by Alexa-conjugated antibody (1 μg/mL). DAPI was used to visualize nuclei in all cases, and Gel/Mount (Biomeda, San Jose, CA, USA) was used to mount the slides. Of note, mouse or rabbit IgGs were used as a nonimmune staining control that was negative for all protocols. Images were obtained using the same exposure time for all samples from a given experimental set using Axiovert 200M Fluorescence Microscope (Zeiss, Buffalo Grove, IL, USA). Exposure time was selected based on the brightest stained sample to avoid saturation and used for all other samples in the set, resulting in equal subtraction of background autofluorescence from all sets. NS1- and M2-positive cells and nuclei in the airways were assessed in at least 3 airways from 3 to 4 different lungs from mice from 2 to 3 independent experiments using a pipeline adapted from the IdentifyPrimaryObjects module of CellProfiler 4.2.6 cell image analysis software (Broad Institute Inc., Cambridge, MA, USA) [63]. Adaptive threshold strategy and Otsu thresholding method were applied. Results were expressed as percentage of NS1- or-M2 positive cells. HMGCS1 and SREBP2 fluorescence intensity was quantified using NIH ImageJ software version 1.54g from selected airways. Nuclei/field were assessed with CellProfiler. HMGCS1 and SREBP2 fluorescence intensity was expressed in arbitrary units (AUs)/cell. Cultured HBE and BEAS-2B cells labeled for NS1, acetylated tubulin, HMGCS1, pAKt, and NP protein were also imaged using IF microscopy (3 fields/condition from 4 independent experiments). pAkt fluorescence intensity was quantified using NIH ImageJ software. Nuclei/field were assessed with CellProfiler cell image analysis software. pAkt fluorescence intensity was expressed in arbitrary units (AU)/cell. NP-positive cells were assessed using CellProfiler as above.

4.5. Immunoblotting

The presence of indicated proteins in cell homogenates was assessed by immunoblotting using the following Abs: anti-NS1, anti-ABCA1, anti-SREBP2, anti-pS473Akt, anti-p Thr389-p70 S6 Kinase (Cell Signal, 9234T), or anti-βactin (Abcam, ab8226). Signals were detected following incubation with IRDye (1:10,000, LI-COR, Lincoln, NE, USA) Biosciences or HRP-conjugated (1:5000) secondary Abs for 1 h at room temperature using the LI-COR Odyssey Fc Imaging System. Membranes were developed and densitometry was performed using ImageStudio™ software version 5.2 (LI-COR).

4.6. Viral Adhesion and Internalization

Viral adhesion and internalization were determined as before [64]. Briefly, to monitor viral adhesion, IAV (20 MOI) was bound on ice for 90 min to cells pre-exposed to normocapnia or hypercapnia. The cells were washed, fixed, and processed as described above for NP IF. To measure virus internalization, cells pre-exposed to normocapnia or hypercapnia were incubated with IAV on ice during 90 min and either fixed immediately or maintained at 37 °C for 30 min. The cells were then washed with 0.1 M glycine-0.1 M NaCl, pH 3.0, buffer for 2 min to remove non-internalized virus; fixed; and permeabilized. IAV localization was assessed using anti-nucleoprotein (NP) antibodies. Cell images (3 fields per condition from at least 4 independent experiments) were obtained using the same exposure time for all samples from a given experimental set using Axiovert 200M Fluorescence Microscope (Zeiss). Exposure time was selected based on the brightest stained sample to avoid saturation and used for all other samples in the set, resulting in equal subtraction of background autofluorescence from all sets. NP fluorescence intensity was quantified using NIH ImageJ software. Nuclei/field were assessed with CellProfiler cell image analysis software. NP fluorescence intensity was expressed in arbitrary units (AU)/cell.

4.7. Cell Cholesterol

Cells were lysed using RIPA buffer, and cholesterol was measured using Amplex red assay following manufacturer’s protocol. Cholesterol concentration was expressed as µg/mg protein.

4.8. Viral Plaque Assay

Quantification of infectious virions was performed by viral plaque assay. Briefly, cell supernatants were centrifuged (4 °C, 2000 rpm for 10 min). MDCK cells were grown in 6-well plates to 100% confluence and then incubated with serial 10-fold dilutions of lung homogenate in DMEM and 1% bovine serum albumin (BSA) for 1 h (37 °C). Supernatants were then aspirated, the cells were washed with PBS, 3 mL of replacement media [2.4% Avicel (IMCD, Harrington Park, NJ, USA), 2× DMEM, and 1.5 μg of N-acetyl trypsin] was added to each well, and the plates were incubated for 3 days. The overlay was then removed, and viral plaques were visualized using naphthalene black dye solution (0.1% naphthalene black, 6% glacial acetic acid, 1.36% anhydrous sodium acetate). Results were expressed as pfu.

4.9. Statistics

Statistical analyses were carried out using Prism software (GraphPad Prism 10.4.0). Data are presented as means ± SD. Differences between two groups were assessed using a Student’s t-test. Levene’s test was used to analyze the homogeneity of variances. Differences between multiple groups were assessed by ANOVA followed by Sidak’s multiple comparisons test.

Supplementary Materials

The following supporting information can be downloaded at: https://www.mdpi.com/article/10.3390/ijms26094133/s1.

Author Contributions

S.M.C.-M. and P.H.S.S. conceived and designed the experiments. F.C., A.M. and S.M.C.-M. performed the experiments. A.M., P.H.S.S. and S.M.C.-M. analyzed and interpreted the data. P.H.S.S. and S.M.C.-M. wrote the original draft. All authors contributed to the article and approved the submitted version. All authors have read and agreed to the published version of the manuscript.

Funding

This work was supported by R01HL131745 from the National Institutes of Health and Merit Review I01 CX002350 from the Department of Veterans Affairs to P.H.S.S.

Institutional Review Board Statement

Experiments were performed according to a protocol approved by the Institutional Animal Care and Use Committee of Northwestern University and according to National Institutes of Health guidelines for the use of rodents (protocol IS00004576, approved on 14 November 2023).

Informed Consent Statement

Not applicable.

Data Availability Statement

The original contributions presented in the study are included in the article/Supplementary Materials; further inquiries can be directed to the corresponding author.

Acknowledgments

Histology services were provided by the Northwestern University Mouse Histology and Phenotyping Laboratory, which is supported by NCI P30-CA060553. Some of the imaging work was performed at the Northwestern University Center for Advanced Microscopy, generously supported by NCI CCSG P30CA060553.

Conflicts of Interest

The authors declare no conflicts of interest.

References

  1. Goel, A.; Pinckney, R.G.; Littenberg, B. APACHE II predicts long-term survival in COPD patients admitted to a general medical ward. J. Gen. Intern. Med. 2003, 18, 824–830. [Google Scholar] [CrossRef]
  2. Groenewegen, K.H.; Schols, A.M.; Wouters, E.F. Mortality and mortality-related factors after hospitalization for acute exacerbation of COPD. Chest 2003, 124, 459–467. [Google Scholar] [CrossRef] [PubMed]
  3. Martin, T.R.; Lewis, S.W.; Albert, R.K. The prognosis of patients with chronic obstructive pulmonary disease after hospitalization for acute respiratory failure. Chest 1982, 82, 310–314. [Google Scholar] [CrossRef]
  4. Mohan, A.; Premanand, R.; Reddy, L.N.; Rao, M.H.; Sharma, S.K.; Kamity, R.; Bollineni, S. Clinical presentation and predictors of outcome in patients with severe acute exacerbation of chronic obstructive pulmonary disease requiring admission to intensive care unit. BMC Pulm. Med. 2006, 6, 27. [Google Scholar] [CrossRef]
  5. Moser, K.M.; Shibel, E.M.; Beamon, A.J. Acute respiratory failure in obstructive lung disease. Long-term survival after treatment in an intensive care unit. JAMA 1973, 225, 705–707. [Google Scholar] [CrossRef] [PubMed]
  6. Sin, D.D.; Man, S.F.; Marrie, T.J. Arterial carbon dioxide tension on admission as a marker of in-hospital mortality in community-acquired pneumonia. Am. J. Med. 2005, 118, 145–150. [Google Scholar] [CrossRef] [PubMed]
  7. Mallia, P.; Johnston, S.L. Influenza infection and COPD. Int. J. Chronic Obstr. Pulm. Dis. 2007, 2, 55–64. [Google Scholar] [CrossRef]
  8. De Serres, G.; Lampron, N.; La Forge, J.; Rouleau, I.; Bourbeau, J.; Weiss, K.; Barret, B.; Boivin, G. Importance of viral and bacterial infections in chronic obstructive pulmonary disease exacerbations. J. Clin. Virol. 2009, 46, 129–133. [Google Scholar] [CrossRef]
  9. Gerke, A.K.; Tang, F.; Yang, M.; Foster, E.D.; Cavanaugh, J.E.; Polgreen, P.M. Predicting chronic obstructive pulmonary disease hospitalizations based on concurrent influenza activity. COPD J. Chronic Obstr. Pulm. Dis. 2013, 10, 573–580. [Google Scholar] [CrossRef]
  10. Sethi, S.; Murphy, T.F. Infection in the pathogenesis and course of chronic obstructive pulmonary disease. N. Engl. J. Med. 2008, 359, 2355–2365. [Google Scholar] [CrossRef]
  11. Global-Initiative-for-Chronic-Obstructive-Lung-Disease. Global Strategy for the Diagnosis, Management, and Prevention of Chronic Obstructive Pulmonary Disease, Updated 2025. 2025. Available online: https://goldcopd.org/ (accessed on 22 April 2025).
  12. Laserna, E.; Sibila, O.; Aguilar, P.R.; Mortensen, E.M.; Anzueto, A.; Blanquer, J.M.; Sanz, F.; Rello, J.; Marcos, P.J.; Velez, M.I.; et al. Hypocapnia and hypercapnia are predictors for ICU admission and mortality in hospitalized patients with community-acquired pneumonia. Chest 2012, 142, 1193–1199. [Google Scholar] [CrossRef] [PubMed]
  13. Murtagh, P.; Giubergia, V.; Viale, D.; Bauer, G.; Pena, H.G. Lower respiratory infections by adenovirus in children. Clinical features and risk factors for bronchiolitis obliterans and mortality. Pediatr. Pulmonol. 2009, 44, 450–456. [Google Scholar] [CrossRef] [PubMed]
  14. Belkin, R.A.; Henig, N.R.; Singer, L.G.; Chaparro, C.; Rubenstein, R.C.; Xie, S.X.; Yee, J.Y.; Kotloff, R.M.; Lipson, D.A.; Bunin, G.R. Risk factors for death of patients with cystic fibrosis awaiting lung transplantation. Am. J. Respir. Crit. Care Med. 2006, 173, 659–666. [Google Scholar] [CrossRef]
  15. Tsonas, A.M.; Botta, M.; Horn, J.; Morales-Quinteros, L.; Artigas, A.; Schultz, M.J.; Paulus, F.; Neto, A.S.; PRoVENT-COVID Collaborative Group. Clinical characteristics, physiological features, and outcomes associated with hypercapnia in patients with acute hypoxemic respiratory failure due to COVID-19—insights from the PRoVENT-COVID study. J. Crit. Care 2022, 69, 154022. [Google Scholar] [CrossRef]
  16. Casalino-Matsuda, S.M.; Chen, F.; Gonzalez-Gonzalez, F.J.; Nair, A.; Dib, S.; Yemelyanov, A.; Gates, K.L.; Budinger, G.R.S.; Beitel, G.J.; Sporn, P.H.S. Hypercapnia Suppresses Macrophage Antiviral Activity and Increases Mortality of Influenza A Infection via Akt1. J. Immunol. 2020, 205, 489–501. [Google Scholar] [CrossRef]
  17. Casalino-Matsuda, S.M.; Chen, F.; Gonzalez-Gonzalez, F.J.; Matsuda, H.; Nair, A.; Abdala-Valencia, H.; Budinger, G.R.S.; Dong, J.T.; Beitel, G.J.; Sporn, P.H. Myeloid Zfhx3 deficiency protects against hypercapnia-induced suppression of host defense against influenza A virus. JCI Insight 2024, 9, e170316. [Google Scholar] [CrossRef]
  18. Casalino-Matsuda, S.M.; Wang, N.; Ruhoff, P.T.; Matsuda, H.; Nlend, M.C.; Nair, A.; Szleifer, I.; Beitel, G.J.; Sznajder, J.I.; Sporn, P.H.S. Hypercapnia Alters Expression of Immune Response, Nucleosome Assembly and Lipid Metabolism Genes in Differentiated Human Bronchial Epithelial Cells. Sci. Rep. 2018, 8, 13508. [Google Scholar] [CrossRef]
  19. Horton, J.D.; Goldstein, J.L.; Brown, M.S. SREBPs: Activators of the complete program of cholesterol and fatty acid synthesis in the liver. J. Clin. Investig 2002, 109, 1125–1131. [Google Scholar] [CrossRef] [PubMed]
  20. Chen, F.; Matsuda, A.; Budinger, G.R.S.; Sporn, P.H.S.; Casalino-Matsuda, S.M. Hypercapnia increases ACE2 expression and pseudo-SARS-CoV-2 entry in bronchial epithelial cells by augmenting cellular cholesterol. Front. Immunol. 2023, 14, 1251120. [Google Scholar] [CrossRef]
  21. Goronzy, I.N.; Rawle, R.J.; Boxer, S.G.; Kasson, P.M. Cholesterol enhances influenza binding avidity by controlling nanoscale receptor clustering. Chem. Sci. 2018, 9, 2340–2347. [Google Scholar] [CrossRef]
  22. Scheiffele, P.; Roth, M.G.; Simons, K. Interaction of influenza virus haemagglutinin with sphingolipid-cholesterol membrane domains via its transmembrane domain. EMBO J. 1997, 16, 5501–5508. [Google Scholar] [CrossRef] [PubMed]
  23. Li, Y.J.; Chen, C.Y.; Yang, J.H.; Chiu, Y.F. Modulating cholesterol-rich lipid rafts to disrupt influenza A virus infection. Front. Immunol. 2022, 13, 982264. [Google Scholar] [CrossRef]
  24. Bajimaya, S.; Frankl, T.; Hayashi, T.; Takimoto, T. Cholesterol is required for stability and infectivity of influenza A and respiratory syncytial viruses. Virology 2017, 510, 234–241. [Google Scholar] [CrossRef]
  25. Wang, B.T.; Ducker, G.S.; Barczak, A.J.; Barbeau, R.; Erle, D.J.; Shokat, K.M. The mammalian target of rapamycin regulates cholesterol biosynthetic gene expression and exhibits a rapamycin-resistant transcriptional profile. Proc. Natl. Acad. Sci. USA 2011, 108, 15201–15206. [Google Scholar] [CrossRef] [PubMed]
  26. Huang, J.; Manning, B.D. A complex interplay between Akt, TSC2 and the two mTOR complexes. Biochem. Soc. Trans. 2009, 3 Pt 1, 217–222. [Google Scholar] [CrossRef]
  27. Gates, K.L.; Howell, H.A.; Nair, A.; Vohwinkel, C.U.; Welch, L.C.; Beitel, G.J.; Hauser, A.R.; Sznajder, J.I.; Sporn, P.H. Hypercapnia impairs lung neutrophil function and increases mortality in murine pseudomonas pneumonia. Am. J. Respir. Cell Mol. Biol. 2013, 49, 821–828. [Google Scholar] [CrossRef]
  28. Hale, B.G.; Randall, R.E.; Ortin, J.; Jackson, D. The multifunctional NS1 protein of influenza A viruses. J. Gen. Virol. 2008, 89 Pt 10, 2359–2376. [Google Scholar] [CrossRef] [PubMed]
  29. Schnell, J.R.; Chou, J.J. Structure and mechanism of the M2 proton channel of influenza A virus. Nature 2008, 451, 591–595. [Google Scholar] [CrossRef]
  30. Liu, K.N.; Boxer, S.G. Target Membrane Cholesterol Modulates Single Influenza Virus Membrane Fusion Efficiency but Not Rate. Biophys. J. 2020, 118, 2426–2433. [Google Scholar] [CrossRef]
  31. Eisfeld, A.J.; Neumann, G.; Kawaoka, Y. At the centre: Influenza A virus ribonucleoproteins. Nat. Rev. Microbiol. 2015, 13, 28–41. [Google Scholar] [CrossRef]
  32. Endo, A.; Kuroda, M.; Tsujita, Y. ML-236A, ML-236B, and ML-236C, new inhibitors of cholesterogenesis produced by Penicillium citrinium. J. Antibiot. 1976, 29, 1346–1348. [Google Scholar] [CrossRef] [PubMed]
  33. Istvan, E.S.; Deisenhofer, J. Structural mechanism for statin inhibition of HMG-CoA reductase. Science 2001, 292, 1160–1164. [Google Scholar] [CrossRef] [PubMed]
  34. Panwar, V.; Singh, A.; Bhatt, M.; Tonk, R.K.; Azizov, S.; Raza, A.S.; Sengupta, S.; Kumar, D.; Garg, M. Multifaceted role of mTOR (mammalian target of rapamycin) signaling pathway in human health and disease. Signal Transduct. Target. Ther. 2023, 8, 375. [Google Scholar] [CrossRef] [PubMed]
  35. Düvel, K.; Yecies, J.L.; Menon, S.; Raman, P.; Lipovsky, A.I.; Souza, A.L.; Triantafellow, E.; Ma, Q.; Gorski, R.; Cleaver, S.; et al. Activation of a metabolic gene regulatory network downstream of mTOR complex 1. Mol. Cell 2010, 39, 171–183. [Google Scholar] [CrossRef]
  36. Luu, W.; Sharpe, L.J.; Stevenson, J.; Brown, A.J. Akt acutely activates the cholesterogenic transcription factor SREBP-2. Biochim. Biophys. Acta (BBA)-Mol. Cell Res. 2012, 1823, 458–464. [Google Scholar] [CrossRef]
  37. Eid, W.; Dauner, K.; Courtney, K.C.; Gagnon, A.; Parks, R.J.; Sorisky, A.; Zha, X. mTORC1 activates SREBP-2 by suppressing cholesterol trafficking to lysosomes in mammalian cells. Proc. Natl. Acad. Sci. USA 2017, 114, 7999–8004. [Google Scholar] [CrossRef]
  38. Apsel, B.; Blair, J.A.; Gonzalez, B.; Nazif, T.M.; Feldman, M.E.; Aizenstein, B.; Hoffman, R.; Williams, R.L.; Shokat, K.M.; Knight, Z.A. Targeted polypharmacology: Discovery of dual inhibitors of tyrosine and phosphoinositide kinases. Nat. Chem. Biol. 2008, 4, 691–699. [Google Scholar] [CrossRef]
  39. Vadlakonda, L.; Dash, A.; Pasupuleti, M.; Anil Kumar, K.; Reddanna, P. The Paradox of Akt-mTOR Interactions. Front. Oncol. 2013, 3, 165. [Google Scholar] [CrossRef]
  40. Denisova, O.V.; Söderholm, S.; Virtanen, S.; Von Schantz, C.; Bychkov, D.; Vashchinkina, E.; Desloovere, J.; Tynell, J.; Ikonen, N.; Theisen, L.L.; et al. Akt inhibitor MK2206 prevents influenza pH1N1 virus infection in vitro. Antimicrob. Agents Chemother. 2014, 58, 3689–3696. [Google Scholar] [CrossRef]
  41. Denney, L.; Ho, L.P. The role of respiratory epithelium in host defence against influenza virus infection. Biomed. J. 2018, 41, 218–233. [Google Scholar] [CrossRef]
  42. Fernández-Hernando, C.; Moore, K.J. MicroRNA modulation of cholesterol homeostasis. Arter. Thromb. Vasc. Biol. 2011, 31, 2378–2382. [Google Scholar] [CrossRef] [PubMed]
  43. Yuan, S.; Chu, H.; Chan, J.F.; Ye, Z.W.; Wen, L.; Yan, B.; Lai, P.M.; Tee, K.M.; Huang, J.; Chen, D.; et al. SREBP-dependent lipidomic reprogramming as a broad-spectrum antiviral target. Nat. Commun. 2019, 10, 120. [Google Scholar] [CrossRef] [PubMed]
  44. Branche, E.; Wang, Y.T.; Viramontes, K.M.; Valls Cuevas, J.M.; Xie, J.; Ana-Sosa-Batiz, F.; Shafee, N.; Duttke, S.H.; McMillan, R.E.; Clark, A.E.; et al. SREBP2-dependent lipid gene transcription enhances the infection of human dendritic cells by Zika virus. Nat. Commun. 2022, 13, 5341. [Google Scholar] [CrossRef] [PubMed]
  45. Zhang, J.; Wu, Y.; Wang, Y.; Liu, P.; Liu, K.; Sun, J.; Zhang, P.; Wang, X.; Liu, X.; Xu, X. Influenza A virus infection activates STAT3 to enhance SREBP2 expression, cholesterol biosynthesis, and virus replication. iScience 2024, 27, 110424. [Google Scholar] [CrossRef]
  46. Zhang, J.; Pekosz, A.; Lamb, R.A. Influenza virus assembly and lipid raft microdomains: A role for the cytoplasmic tails of the spike glycoproteins. J. Virol. 2000, 74, 4634–4644. [Google Scholar] [CrossRef]
  47. Biswas, S.; Yin, S.R.; Blank, P.S.; Zimmerberg, J. Cholesterol promotes hemifusion and pore widening in membrane fusion induced by influenza hemagglutinin. J. Gen. Physiol. 2008, 131, 503–513. [Google Scholar] [CrossRef]
  48. Verma, D.K.; Gupta, D.; Lal, S.K. Host Lipid Rafts Play a Major Role in Binding and Endocytosis of Influenza A Virus. Viruses 2018, 10, 650. [Google Scholar] [CrossRef]
  49. Yang, Q.; Elz, A.E.; Panis, M.; Liu, T.; Nilsson-Payant, B.E.; Blanco-Melo, D. Modulation of Influenza A virus NS1 expression reveals prioritization of host response antagonism at single-cell resolution. Front. Microbiol. 2023, 14, 1267078. [Google Scholar] [CrossRef]
  50. Pavlova, N.I.; Savinova, O.V.; Nikolaeva, S.N.; Boreko, E.I.; Flekhter, O.B. Antiviral activity of betulin, betulinic and betulonic acids against some enveloped and non-enveloped viruses. Fitoterapia 2003, 74, 489–492. [Google Scholar] [CrossRef]
  51. Hong, E.H.; Song, J.H.; Kang, K.B.; Sung, S.H.; Ko, H.J.; Yang, H. Anti-Influenza Activity of Betulinic Acid from Zizyphus jujuba on Influenza A/PR/8 Virus. Biomol. Ther. 2015, 23, 345–349. [Google Scholar] [CrossRef]
  52. Mehrbod, P.; Hair-Bejo, M.; Tengku Ibrahim, T.A.; Omar, A.R.; El Zowalaty, M.; Ajdari, Z.; Ideris, A. Simvastatin modulates cellular components in influenza A virus-infected cells. Int. J. Mol. Med. 2014, 34, 61–73. [Google Scholar] [CrossRef] [PubMed]
  53. Radigan, K.A.; Urich, D.; Misharin, A.V.; Chiarella, S.E.; Soberanes, S.; Gonzalez, A.; Perlman, H.; Wunderink, R.G.; Budinger, G.R.; Mutlu, G.M. The effect of rosuvastatin in a murine model of influenza A infection. PLoS ONE 2012, 7, e35788. [Google Scholar] [CrossRef]
  54. Mehrbod, P.; Omar, A.R.; Hair-Bejo, M.; Haghani, A.; Ideris, A. Mechanisms of action and efficacy of statins against influenza. Biomed Res. Int. 2014, 2014, 872370. [Google Scholar] [CrossRef] [PubMed]
  55. Vahedian-Azimi, A.; Mannarino, M.R.; Shojaie, S.; Rahimibashar, F.; Galeh, H.E.G.; Banach, M.; Bianconi, V.; Pirro, M.; Sahebkar, A. The effect of statins on the prevalence and mortality of influenza virus infection: A systematic review and meta-analysis. Arch. Med. Sci. 2022, 18, 1513–1524. [Google Scholar] [CrossRef]
  56. Ma, K.L.; Liu, J.; Wang, C.X.; Ni, J.; Zhang, Y.; Wu, Y.; Lv, L.L.; Ruan, X.Z.; Liu, B.C. Activation of mTOR modulates SREBP-2 to induce foam cell formation through increased retinoblastoma protein phosphorylation. Cardiovasc. Res. 2013, 100, 450–460. [Google Scholar] [CrossRef]
  57. Fan, M.; Chen, Z.; Shao, W.; Chen, Y.; Lin, Z.; Yi, C.; Li, Y.; Lu, L.; Zhou, Y.; Lin, J. SREBP2 inhibitor betulin sensitizes hepatocellular carcinoma to lenvatinib by inhibiting the mTOR/IL-1β pathway. Acta Biochim. Biophys. Sin. 2023, 55, 1479–1486. [Google Scholar] [CrossRef] [PubMed]
  58. Du, X.; Kristiana, I.; Wong, J.; Brown, A.J. Involvement of Akt in ER-to-Golgi transport of SCAP/SREBP: A link between a key cell proliferative pathway and membrane synthesis. Mol. Biol. Cell 2006, 17, 2735–2745. [Google Scholar] [CrossRef]
  59. Kuss-Duerkop, S.K.; Wang, J.; Mena, I.; White, K.; Metreveli, G.; Sakthivel, R.; Mata, M.A.; Muñoz-Moreno, R.; Chen, X.; Krammer, F.; et al. Influenza virus differentially activates mTORC1 and mTORC2 signaling to maximize late stage replication. PLoS Pathog. 2017, 13, e1006635. [Google Scholar] [CrossRef]
  60. Baffi, T.R.; Lordén, G.; Wozniak, J.M.; Feichtner, A.; Yeung, W.; Kornev, A.P.; King, C.C.; Del Rio, J.C.; Limaye, A.J.; Bogomolovas, J.; et al. mTORC2 controls the activity of PKC and Akt by phosphorylating a conserved TOR interaction motif. Sci. Signal. 2021, 14, eabe4509. [Google Scholar] [CrossRef]
  61. Woodard, J.; Sassano, A.; Hay, N.; Platanias, L.C. Statin-dependent suppression of the Akt/mammalian target of rapamycin signaling cascade and programmed cell death 4 up-regulation in renal cell carcinoma. Clin. Cancer Res. 2008, 14, 4640–4649. [Google Scholar] [CrossRef]
  62. Casalino-Matsuda, S.M.; Monzón, M.E.; Forteza, R.M. Epidermal growth factor receptor activation by epidermal growth factor mediates oxidant-induced goblet cell metaplasia in human airway epithelium. Am. J. Respir. Cell Mol. Biol. 2006, 34, 581–591. [Google Scholar] [CrossRef] [PubMed]
  63. Stirling, D.R.; Swain-Bowden, M.J.; Lucas, A.M.; Carpenter, A.E.; Cimini, B.A.; Goodman, A. CellProfiler 4: Improvements in speed, utility and usability. BMC Bioinform. 2021, 22, 433. [Google Scholar] [CrossRef] [PubMed]
  64. Sun, X.; Whittaker, G.R. Role for influenza virus envelope cholesterol in virus entry and infection. J. Virol. 2003, 77, 12543–12551. [Google Scholar] [CrossRef] [PubMed]
Figure 1. Hypercapnia increases viral protein expression in mouse bronchial epithelium, human bronchial epithelial (HBE), and BEAS-2B cells infected with IAV. Mice breathing 10% CO2/21% O2 (hypercapnia, HC), or air as control, were infected with 30 pfu IAV and then sacrificed 1 and 4 dpi. Expression of viral NS1 (magenta) and M2 in lung tissue was assessed by IF microscopy (A). NS1 (B) and M2 (C) were quantified as percentage of NS1- or M2-positive cells. Airways (3–4) from lungs of 4 different mice from 2 independent experiments were analyzed. p-values from ANOVA followed by Sidak’s multiple comparisons test (B,C) are shown. HBE cells differentiated at air–liquid interface (ALI) and BEAS-2B cells were cultured under normocapnic (NC, 5% CO2/95% air) or hypercapnic (HC, 15% CO2/21% O2/64% N2) conditions for 2 days, infected with IAV (MOI 1) cultured for an additional day in NC or HC, respectively, and then fixed. Expression of viral NS1 (D,F) and acetylated tubulin (a-Tub, marker of airway ciliated cells) were assessed by IF. Scale bars = 50 µm (A,D,F). NS1 expression was also assessed by immunoblot, with βactin as loading control (E,G); individual data points, means ± SEM of arbitrary density units from N = 4 (E) and N = 6 (G) independent experiments, and p-values for comparison of NC and HC using Student’s t-test (E,G) are shown.
Ijms 26 04133 g001
Figure 2. Hypercapnia increases cellular cholesterol, and inhibition of SREBP2 blocks hypercapnia-induced changes in expression of HMGCS1 and ABCA1 proteins. BEAS-2B cells were cultured in NC (5% CO2/95% air) or HC (15% CO2/21% O2/64% N2) for 4 days, after which cellular cholesterol was measured using Amplex Red assay (A). Alternatively, BEAS-2B cells pre-treated with the SREBP2 inhibitor betulin (bet, 7.5 µM) or vehicle were cultured in NC or HC for 3 days and then immunostained and assessed for HMGCS1 (magenta) by IF microscopy (B) or immunoblot, N = 4 independent experiments (C). Nuclei were stained with DAPI; scale bar = 50 µm (B). BEAS-2B cells pre-treated with betulin or vehicle and cultured in NC or HC were also infected with IAV (MOI 1) or not infected as control (NI), and 1 day later, cells were lysed and immunoblotted for ABCA1 with βactin as loading control, N = 5 independent experiments (D). p-values from Student’s t-test (A) or ANOVA followed by Sidak’s multiple comparisons test (C,D) are shown.
Ijms 26 04133 g002
Figure 3. Inhibition of cellular cholesterol accumulation blocks hypercapnia-induced increases in adhesion, internalization, NS1 expression, and replication of IAV in bronchial epithelial cells. BEAS-2B cells cultured in NC (5% CO2/95% air) or HC (15% CO2/21% O2/64% N2) were pre-treated with rosuvastatin (R, 0.5 µM), fluvastatin (F, 50 nM), betulin (bet, 7.5 µM), or vehicle prior to addition of IAV. To assess viral adhesion, cells were placed on ice before adding IAV (MOI 20); after 90 min on ice, cells were washed with ice-cold media and fixed. To assess viral internalization, cells were placed on ice before adding IAV (MOI 20); after 90 min on ice, cells were returned to NC or HC at 37 °C for 30 min and then washed and fixed. Adhesion (A) and internalization (C) were assessed by IF microscopy of cells stained for NP (magenta); nuclei were stained with DAPI. Scale bars = 50 µm (A,C). NP was quantified as corrected total cell fluorescence and expressed in arbitrary units (AU)/cell, for adhesion (B) and internalization (D), N = 4 independent experiments. In other experiments, BEAS-2B cells cultured in NC or HC and maintained at 37 °C throughout were infected with IAV (MOI 1), and 1 day later, cells were lysed for immunoblotting, or culture supernatants were removed for plaque assay. NS1 expression was assessed by immunoblot with βactin as loading control, N = 4 independent experiments (E), and N = 6 independent experiments (F). Viral titers in culture supernatants were determined by plaque assay and expressed as pfu, N = 6 independent experiments (G). Individual data points from independent experiments, means ± SEM, and p-values for comparison of NC or HC using ANOVA followed by Sidak’s multiple comparisons test are shown (B,DG).
Ijms 26 04133 g003
Figure 4. Inhibition of mTOR signaling and Akt blocks hypercapnia-induced increases in NS1 protein expression and IAV replication. BEAS-2B cells cultured in NC (5% CO2/95% air) or HC (15% CO2/21% O2/64% N2) were pre-exposed to the dual mTORC1/mTORC2 inhibitor pp242 (1 µM), the Akt inhibitor Mk2206 (Mk, 5 µM), vehicle (A,B,F), or no inhibitor (CE) and then infected with IAV (MOI 1) and cultured for an additional day. Cells were then lysed for immunoblotting, fixed for IF microscopy, or supernatants were removed for plaque assay. NS1 protein was assessed by immunoblot with βactin as loading control, N = 4 independent experiments (A). Phosphorylated Akt (pAkt, green) and viral NP (magenta) were assessed by IF microscopy, scale bar = 50 µm (C). pAkt was quantified as corrected total cell fluorescence and expressed in arbitrary units (AUs)/cell (D) and NP as a percentage of NP-positive cells (E), N = 4 independent experiments. Viral titers in culture supernatants were determined by plaque assay and expressed as pfu, N = 8 (B) and N = 5 independent experiments (F). Individual data points, means ± SEM, and p-values using ANOVA followed by Sidak’s multiple comparisons test (A,B,F) or Student’s t-test (D,E) are shown.
Ijms 26 04133 g004
Figure 5. Inhibition of Akt blocks hypercapnia-induced increases in expression of HMGCS1 in BEAS-2B cells and HMGCS1, SREBP2, and viral NS1 in bronchial epithelium of IAV-infected mice. BEAS-2B cells cultured in NC (5% CO2/95% air) or HC (15% CO2/21% O2/64% N2) were pre-exposed to the Akt inhibitor Mk2206 (Mk, 5 µM) or vehicle for 2 h. One day later, cells were lysed and immunoblotted for HMGCS1 with βactin as loading control (A). Mice were exposed to 10% CO2/21% O2 or air as control. MK2206 (120 mg/kg body weight) or the drug vehicle captisol was administrated by oral gavage at 1 d before HC exposure and at 2 days after HC exposure. Mice were sacrificed after 7 days of HC exposure (B) or infected with IAV, as before, after 3 days of HC exposure and sacrificed at 7 dpi (D). Expression of HMGCS1 (magenta) and acetylated tubulin (B); SREBP2 and viral NS1 (magenta) (D) were assessed using IF microscopy; nuclei were stained with DAPI (blue); scale bars = 50 µm. HMGCS1 (C) and SREBP2 (E) protein expression was quantified and expressed as AU/cell. NS1 (F) was quantified as percentage of NS1-positive cells. Airways (3–4) from lungs of 3 different mice from 3 independent experiments were analyzed. Individual data points, means ± SEM, and p values for comparisons of NC or HC using ANOVA followed by Sidak’s multiple comparisons test (C,E,F) are shown.
Ijms 26 04133 g005
Disclaimer/Publisher’s Note: The statements, opinions and data contained in all publications are solely those of the individual author(s) and contributor(s) and not of MDPI and/or the editor(s). MDPI and/or the editor(s) disclaim responsibility for any injury to people or property resulting from any ideas, methods, instructions or products referred to in the content.