Abstract
The Mediterranean region has a high but unevenly studied level of invertebrate diversity. Genetic-based methods, such as DNA barcoding and metabarcoding, are proposed for biodiversity assessment; however, their application is not always straightforward. The current state of data available in genetic databases limits species identification, especially in the case of certain invertebrate groups. The aim of the study was (1) to assess the diversity of seven invertebrate groups, which are potential prey for predatory arthropods, in order to facilitate the analysis of the metabarcoding of trophic interactions and, thus, expand our knowledge on biocontrol potential, and (2) to estimate the representation of local species in BOLD and NCBI GenBank databases. The DNA barcoding results consisting of sequences for 269 specimens, collected in Zadar County, within Mediterranean part of Croatia, were used for species identification and species richness assessment through the comparison of our data with the data available in BOLD and NCBI databases, and by applying species delimitation methods. Previous barcode records enabled Lepidopteran, Hemipteran, Dipteran, and Hymenopteran species identification, while Collembolan and Oligochaetes species numbers were assessed using species delimitation. Our results showed that a high number of species were unique to the study area, especially in the case of Collembolans and Oligochaetes. We confirmed that the studied area is under-researched, which was particularly evident in taxonomically demanding groups, such as Collembolans and Oligochaetes, which are rich in rare endemic species.
1. Introduction
DNA barcoding is considered to be a valuable tool for rapid species identification, as it is based on molecular data and does not require specific expertise in morphological taxonomy [1,2]. The most common molecular marker used in the DNA barcoding of animals is the mitochondrial gene coding for cytochrome oxidase subunit one (COI). From 2003, when the DNA barcoding method was suggested [3], up to now, it has been used for taxonomic, phylogenetic, biodiversity, and monitoring purposes [2,4,5,6,7,8], and numerous barcode projects have been undertaken to support species identification [7,8,9,10,11,12]. In extensively studied regions, the DNA barcoding method has been successful in detecting unrecorded species, as well as in highlighting biodiversity, as shown with the example of dipteran fauna in Bavaria, Germany [13]. The use of DNA barcoding in diversity assessments has shown its usefulness in different regions and for different groups [14,15,16]. However, despite the extensive efforts being invested in submitting data to the National Center for Biotechnology Information’s (NCBI) GenBank library and the Barcode of Life Database (BOLD), there are still huge gaps concerning some animal groups and geographical regions in these genetic databases [17,18]. This suggests that there is a difference between the pace at which new or neglected species are being identified and the pace at which they are being sequenced [19].
Information gathered from DNA barcodes can be used across many fields of biology, especially in ecology, for studying species interactions, the connection of different life stages, or trophic interactions [20]. In particular, trophic interactions can be studied through the metabarcoding of gut contents [17,21]. Many studies have been based on the sequencing of prey fragments’ COI gene detected in the predator’s gut and the subsequent identification of prey species by comparing the resulting sequences with those in reference databases [21,22,23]. In these and similar environmental DNA (eDNA) studies, the efficiency and accuracy of species identification strictly depend on the data available in the DNA databases [12,17]. This poses a problem when eDNA studies are conducted in geographical regions which are scarcely investigated and/or underrepresented in barcode libraries, especially if the regions are abundant in rare and endemic species, such as the Mediterranean.
Croatia’s coastline is a part of the Mediterranean region in the west of the Balkan peninsula, and its invertebrate fauna is quite diversified [24,25]. This part of the country has a long tradition of olive oil and wine production, and olive orchards and vineyards are a common part of the landscape. Despite its high diversity, the region, including the agricultural land, is still under-researched, resulting in the underrepresentation of local fauna data. Oligochaetes (Lumbricidae) have a high level of diversity in the western part of the Balkan, and the Mediterranean zone, especially, is considered to be one of the biodiversity hotspots for the group [24]. However, a complete taxonomic resolution for the species present in the area has not been achieved. The Mediterranean lands harbour Europe’s richest ant fauna, and half of Croatia’s ant species can be found in its coastal zone [25]. Due to this diversity, the list of ant species present in Croatia is incomplete [25]. As with the species composition for the groups such as Hemipterans [26] and Lepidopterans [27], in agricultural areas, composition is related to the type of crop, given that these are mainly plant feeders and are related to certain plant species. Hemipterans especially have been extensively studied within the agricultural area due to various pests pertaining to this group [26]. Furthermore, Collembolan fauna is continuously being discovered, particularly in under-studied areas [28]. The local diversity of Collembolans, ants and all of the abovementioned groups has been negatively impacted by the agricultural land use and landscape changes [29,30,31].
Given that the species richness of the area is still understudied for many invertebrates, and given the land use pressures of agriculture, in the present study we implemented the DNA barcoding method to analyze species composition for Hemipterans, Dipterans, Lepidopterans, Hymenopterans, Collembolans, Oligochaetes, and Isopods, all groups important for assessing trophic interactions among invertebrates within Mediterranean agricultural lands [32,33,34,35]. Their selection was based on their potential as prey for common predatory arthropods, such as spiders and carabid beetles. Groups such as Hemipterans, Dipterans, and Lepidopterans include numerous species (e.g., Scaphoideus titanus, Bactrocera oleae, Prays oleae) that are frequent pests in vineyards and olive orchards. Other invertebrates, such as Oligochaetes, Collembolans, Hymenopterans, and Isopods, may serve as alternative prey to maintain predator populations during periods when pests are not present [35,36].
The aim of this research was to: (i) assess the diversity and genetic diversity of selected invertebrate groups in sampled Mediterranean vineyards, olive groves, and surrounding natural habitats; (ii) analyze the potential of the DNA barcoding method to determine species in Mediterranean vineyards, olive groves, and surrounding natural habitats in Zadar County in Croatia through available global data deposited in two databases, BOLD and NCBI; (iii) evaluate if the current state of the data available in global barcode databases is sufficient for conducting eDNA studies in Mediterranean terrestrial ecosystems and, if not, to detect the invertebrate groups that are part of the data gap.
Thus, additional data on species diversity and the genetic diversity of these groups can provide valuable information that can be implemented in subsequent ecological studies on biocontrol, diversity conservation in agricultural land, and sustainable management.
2. Materials and Methods
2.1. Sampling
Sampling was conducted in five sites within Zadar County, in the Mediterranean part of Croatia (Figure 1). A list with geographical coordinates, size of the agricultural land, and altitude is provided for the sampling sites (Supplementary Table S1). Sampling sites were located within two vineyards and two olive orchards, targeting fauna typical for such agricultural habitats in the Mediterranean part of Croatia, and within the surrounding natural habitat, with maquis and garrigue formed by the natural vegetation of the region.
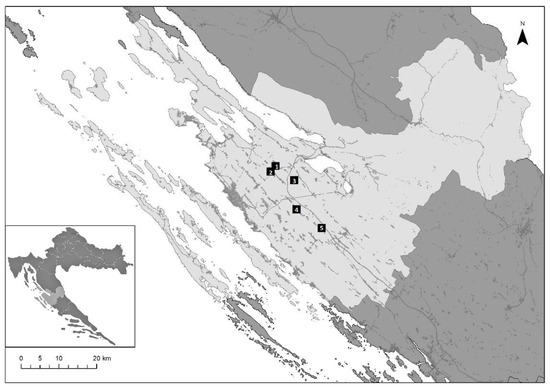
Figure 1.
Map showing five sites (black squares), in Zadar County in the Mediterranean part of Croatia, selected for field research and sampling. The site within the natural habitat is located near Poličnik (C) (1), the olive orchards are located in Poličnik (OE) (2) and Škabrnja (OI) (5), the vineyards in Baštica (VI) (2) and Nadin (VE) (4).
Samples were collected during field research in 2018 and 2019. In 2018, sampling was conducted five times in the spring season, from April to July, and four times in the autumn season, from September to November. In 2018, three methods were applied: the beating method for tree canopy fauna [37], the Tullgren funnel method [38] for soil fauna, and additional sampling by hand where for anecic earthworms we used the electricity power as described below in more detailes. In 2019, sampling was performed by hand only, in the spring season from April to July, and in the autumn season from September to November. Specimens belonging to the Hemipterans, Dipterans, and Lepidopterans were collected using the beating method and handpicking, while Hymenopterans were collected with all methods. Collembolans and Isopods were sampled with the Tullgren method and by hand, as they are part of soil fauna. Oligochaetes were collected by adding water to selected soil patches (surface approximately 1 m2) on which a current (10–100 Ah), with an adjustable frequency (20–120 Hz), was applied using a portable power generator to make them come to the surface. When on the surface, Oligochaetes were picked by hand and placed in tubes.
In the field, all collected samples were placed in absolute ethanol, except for Oligochaetes, which were, to preserve their morphological characters, firstly placed in 30% ethanol, then in 70%, to be finally stored in 100% ethanol. All the collected samples were sorted in the laboratory, divided into taxonomic groups, and processed further accordingly. They were stored at −20 °C prior to the application of molecular techniques.
2.2. DNA Extraction and PCR Reaction
DNA was extracted, depending on the invertebrate group and body size, from the entire body, abdomen, or leg in the case of arthropods, and a patch of epithelial tissue in case of earthworms. DNA was extracted using Chelex polymer (Sigma Aldrich, Merck, Darmstadt, Germany) following the protocol taken from Casquet et al. [39]. Another method of DNA extraction involved using the GenElute Mammalian Genomic DNA kit (Sigma Aldrich, Merck, Darmstadt, Germany) according to the manufacturer’s instructions. Specimens’ vouchers were stored at −20 °C at the research group laboratory.
The PCR analysis was performed using DreamTaq 2× (ThermoFisher Scientific, Waltham, MA, USA) or Emerald 2× (Takara, Kusatsu, Shiga, Japan) polymerase in a total volume of 10 µL using standard DNA barcode primers LCO1490/HCO2198 [40] in the final concentration of 0.2 µM. PCR analyses were optimized for all studied groups of invertebrates using gradient PCR. Annealing temperatures were adapted for all investigated groups: for Oligochaetes, Isopods, Dipterans, and Lepidopterans at 51 °C, Hymenopterans and Hemipterans at 47 °C, and Collembolans at 50 °C. Conditions for the DreamTaq polymerase were as follows: initial denaturation at 95 °C for 3 min, denaturation at 95 °C for 30 s and annealing temperatures as listed above for 30 s, extension at 72 °C for 60 s, and final extension at 72 °C for 10 min. The number of cycles for denaturation, annealing, and extension was 40. For Emerald polymerase, denaturation was at 94 °C for 30 s and extension at 72 °C for 60 s, annealing again depending on the group as listed above for 30 s, and the number of cycles was 40.
To screen for successful amplification and to measure the concentration of multiplied amplicons, we used gel electrophoresis with 1% agarose gel. To enable the sequencing of amplicons, we removed the remaining primers and dNTPs through the enzymatic purification of PCR products. The enzymes used in the reaction were exonuclease 1 (Exo1) and alkaline phosphatase (AP) (New England Biolabs, Ipswich, MA, USA) and for 10 µL reaction volume, 0.0025 µL of Exo1 and 0.005 µL of AP were added. Cycling conditions for the enzymatic PCR reaction were the following: 37 °C for 60 min, 80 °C for 20 min, and 4 °C for 10 min.
2.3. Morphological Analysis
Due to prior knowledge about the insufficiency of BOLD and NCBI GenBank data on Oligochaetes from Croatia and the need for further metabarcoding of this group, an especially careful morphological examination of the Oligochaete specimens was carried out, which revealed that they belong to the genus Octodrilus Omodeo, 1956. This genus has a main distribution center in the Balkan Peninsula and the identification of the species has been attempted using regional checklists and identification keys (e.g., Mršić, 1991; Szederjesi, 2017) [41,42]. Only sexually mature specimens were considered, because species diagnoses are mainly based on the position of the clitellar structures and the arrangement of internal reproductive structures. Unfortunately, a thorough examination of the taxonomic literature and comparisons with reference collection material revealed confusion and ambiguity in the nomenclature of the local Octodrilus taxa. Therefore, no species could be positively identified, and the morphologically based species identification provided herein remains provisional.
A key to the Collembola (Springtails) of Britain and Ireland [43] was used for Collembola specimen identification at family or genus level. For Formicidae species determination, two keys were used, Seifert (2018) [44] and Lebas et al. (2019) [45].
2.4. Sequencing and DNA Barcode Data Analysis
The sequencing of purified DNA amplicons was performed by Macrogen Inc. (Amsterdam, The Netherlands) using the LCO1490 amplification primer. Altogether, 56 sequences were obtained for Hymenopterans, 36 for Oligochaetes, 17 for Collembolans, 47 for Hemipterans, 60 for Dipterans, 16 for Lepidopterans, and 37 for Isopoda (Supplementary Table S2). Sequences were edited using BIOEDIT v.7.2. (Gene Codes Corporation, Ann Arbor, MI, USA) [46]. Chromatograms were manually checked for ambiguous nucleotides, stop codons, and indels in BIOEDIT v.7.2. Sequences were passed through databases to identify individuals at the species level, in BOLD using the BOLD Identification System (IDS) [5] and in NCBI using the Basic Local Alignment Search Tool (BLAST) [47]. We assigned Barcode Index Numbers (BINs) to our sequenced specimens in order to analyze diversity among our samples using the BOLD database algorithm [6]. For all analyzed specimens, specimen and collection data, as well as obtained sequences, were uploaded to BOLD (http://boldsystems.org, accessed on 15 February 2022) [6]. Besides our data set, for phylogenetic and species delimitation analysis, we included publicly available sequences of Collembolans (Supplementary File S1a,b) and Octodrilus (Oligochaeta) specimens reported for Europe (sequences available for specimens collected in France, Italy, Slovenia, and Croatia) (Supplementary File S2). Sequences of specimens from the same genus, including sequences from BOLD, were grouped and aligned in MEGA X [48] using MUSCLE [49]. Subsequently, aligned sequences were collapsed to unique haplotypes (haploid genotype) using FaBox (1.5) [50]. The DNA sequence alignments were checked for stop codons using Mesquite ver. 3.5 [51]. The Maximum Likelihood (ML) analysis was conducted using RAxML-HPC ver. 8.2.12 (https://www.phylo.org accessed on 14 February 2022) [52] on the CIPRES Gateway [53] using a GTRGAMMA model. A rapid bootstrap analysis with 1000 replicates [52] was used to search for the ML tree. The DNA barcoding and sequence alignment to current barcodes in DNA databases did not provide us with species-level identification and species numbers for Collembolans and Oligochaetes. We approached phylogenetic analyses with an awareness of the constraints of our data set, and our goal was to estimate the number of MOTUs and the diversity for these two groups, rather than solve phylogenetic relations. FigTree v1.4.4 (http://tree.bio.ed.ac.uk/software/figtree/ accessed on 14 February 2022) [54] was used for the visualization of the ML tree. Several species delimitation methods were applied to determine the number of MOTUs among studied samples. Species delimitation in the cases of Octodrilus (Oligochaeta, Lumbricidae), Lepidocrytus (Collembola, Entomobryidae), and Orchesella (Collembola, Entomobryidae) specimens was conducted using the Automatic Barcode Gap Discovery (ABGD) method [55], Bayesian implementation of the Poisson Tree Processes (bPTP) method [56], and multi-rate Poisson Tree Process (mPTP) method [57]. Aligned haplotype sequences served as input data for the ABGD method, which was executed with relative gap width = one and the Kimura 2 parameter (K2P) model. ML trees plotted in RAxML [52] using the above-listed parameters were input data for the bPTP and mPTP methods. P-distances for Oligochaete’s haplotypes were calculated in MEGA X and compared to average p-distances between MOTU groups, identified using the mPTP method.
2.5. Rarefaction Curves
Rarefaction curves were analyzed for samples regularly collected across seasons using beating method and plotted in order to predict the expected number of BINs as a function of the sampling event’s number. Plotting was performed using Microsoft Excel. If the curve reached the plateau, the number of sampled BINs was considered suitable for species richness estimation [58].
2.6. Jaccard Similarity
The Jaccard similarity index was used for comparing the absence/presence of species and morphospecies between study sites. The Jaccard indices were calculated and plotted in PAST 4.03 [59].
3. Results
3.1. DNA Barcoding Performance, Species Identification, and BIN Assignment
The alignment of obtained DNA sequences with those available in NCBI and BOLD, for the seven analyzed invertebrate groups, resulted in species-level identification for 142 out of 269 specimens (Supplementary Table S2). For Hymenopterans, the result was 83.93% (47 out of 56), for Hemipterans, 70.21% (33 out of 47), for Dipterans, 58.33% (35 out of 60), for Lepidopterans, 100% (16 out of 16), and for Isopods, 29.73% (11 out of 37). Such identification was not possible for Oligochaete and Collembolan specimens. Out of 269 obtained sequences, 244 sequences were arranged in 119 BINs, where 74 BINs (62.18%) were previously recorded in BOLD, and 45 BINs (37.82%) were unique BINs that were, until now, not reported in BOLD (Figure 2). Among the previously reported BINs, twenty contained up to ten sequences, including sequences from this research, nine of them pertaining to Hemipterans. This is a relatively low sequence number compared to other BINs in this database. For example, in the case of the Lepidoptera species Prays oleae (Praydidae), the formed BIN contained 173 reported sequences, and for Yponomeuta evonymellus (Yponomeutidae), the BIN contained 395 reported sequences. A higher number was detected for the Diptera species Psilopa obscuripes (Ephydridae) and Scaptomyza pallida (Drosophilidae), where both BIN clusters contained 2043 sequences. The highest number of BINs was observed for Hemipterans (35), Dipterans (27), and Hymenopterans (19). On the other hand, the lowest number of unique BINs was observed in earthworms (six) and Collembolans (five). Most of the recorded species were assigned at least one specific BIN. The exceptions were Tetramorium semilaevae (Hymenoptera, Formicidae), Armadillidium vulgare (Isopoda, Armadillidiidae), and Prays oleae (Lepidoptera, Praydidae), which were assigned two or more BINs.
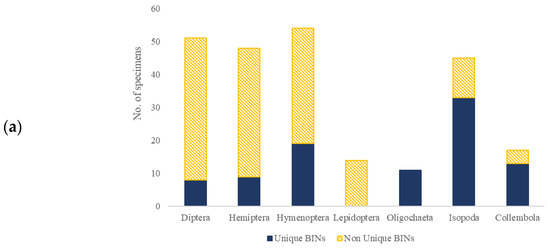
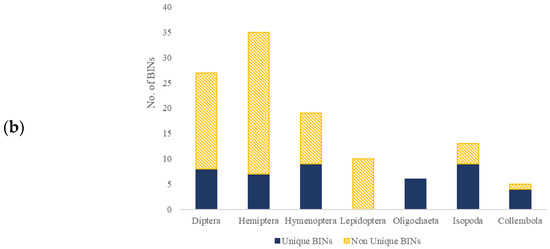
Figure 2.
Observed BINs, shown as a ratio between Non-Unique BINs (yellow pattern) and Unique BINs (blue) within different groups: Diptera, Hemiptera, Lepidoptera, Hymenoptera, Isopoda, Collembola, and Oligochaeta, represented as a number of specimens belonging to each BIN type (a) or as a number of each BIN type (b).
3.2. Rarefaction Curves
Rarefaction curves showed that for some groups the number of recorded BINs did not reach the plateau and that further sampling efforts would provide us with a higher BIN (Figure 3).
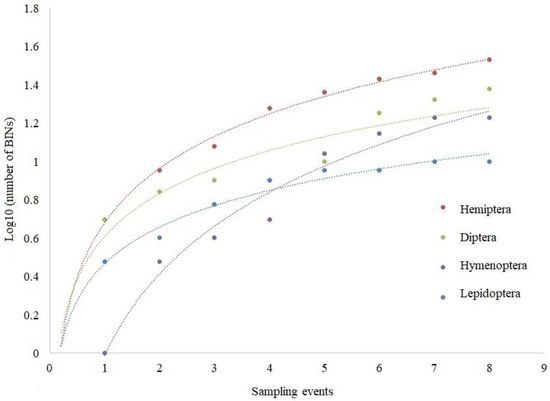
Figure 3.
Rarefaction curves of the number of different BINs for selected groups shown as a function of the number of sampling events.
3.3. Species Delimitation for Oligochaetes and Collembolans
Oligochaeta sequences obtained from our study were grouped in six unique BINs and were all reported for the first time in BOLD. The obtained 36 sequences collapsed to 21 unique haplotypes, which were grouped in three MOTUs using species delimitation methods (ABGD, bPTP, and mPTP). The first MOTU aggregated the majority of BINs (four out of six) and haplotypes (17 out of 21). BINs clustered to the first MOTU were the following: BOLD:AEH4576, BOLD:AEJ1183, BOLD:AEJ1182, and BOLD:AEH3543. The remaining BINs were split into two MOTUs. The second MOTU was formed by the BIN BOLD:AEH3542 (MOTU 2). The third MOTU was the BIN BOLD:AEI1132 (MOTU3). The first two MOTUs were the most closely related to the species Octodrilus complanatus (Dugès, 1828), whereas MOTU3 was more genetically distant. The phylogenetic ML tree result is shown in Figure 4. The first and the second MOTU were present in the two vineyards and the integrated olive orchard from the studied area. The third MOTU was found in one of the studied vineyards. The calculated p-distance between MOTU groups 1 and 2 was 6.68% (0.0668 +/− SD 0.004283), between MOTU groups 1 and 3 was 11.59% (0.1159 +/− SD 0.098806), and between groups 2 and 3 was 19.28% (0.1928 +/− SD 0.00133) (Supplementary Table S3).
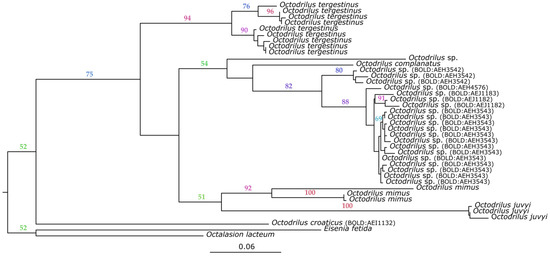
Figure 4.
Maximum likelihood phylogram inferred for specimens of the genus Octodrilus. Numbers on the branches represent the nonparametric bootstrap support (≥50). The tree is rooted on Octolasion lacteum (BOLD:ACF5848) and Eisenia fetida (BOLD:AAB2558) as outgroups.
Morphologically, the single Octodrilus individual (MOTU3) belongs to a group of small-sized, red-pigmented Octodrilus species, which includes O. croaticus (Rosa, 1895), O. juvyi Zicsi & Cuendet, 2005, O. bretscheri (Zicsi, 1969), O. lissaensis (Michaelsen, 1891), and O. argoviensis (Bretscher, 1899) [60], and possibly a few other nominal species (cf. Mršić, 1991) [41]. Several members of this group have been recorded as present in the Balkan peninsula [41,42]. Our finding locality is very close to the Croatian locality given for O. croaticus by Mršić (1991), whereas O. bretscheri (like O. juvyi in France) seems to be confined to mountain habitats. Therefore, we identified this specimen provisionally as O. croaticus.
Other examined specimens had an abundant overlap in many aspects of morphology and anatomy, without any separation in classical diagnostic characters. Accordingly, they were assorted in the same morpho group. Their general morphology would suggest a relationship with O. complanatus. This relation was also observed in the genetic analyses.
Collembolan specimens from our sites were divided into five MOTUs using the BIN assignment method. Two of the recorded BINs (BOLD:AEH5984 and BOLD:AEE1997) were morphologically identified as genus Orchesella Templeton, 1835 (Entomobryomorpha, Entomobryidae). The BOLD:AEH5615 BIN was morphologically identified as belonging to genus Lepidocyrtus Bourlet, 1839 (Entomobryomorpha, Entomobryidae), and BIN BOLD:AEH9402 as genus Heteromurus Wankel, 1860 (Entomobryomorpha, Entomobryidae). The remaining BIN (BOLD:AEJ0895) morphologically belongs to the family Sminthuridae (Symphypleona).
Our Lepidocyrtus specimens were shown to be most closely related to the species Lepidocyrtus pallidus, according to the phylogenetic analysis (Figure 5a). In Europe, the genus Lepidocyrtus has an increasing number of species, with the Lepidocyrtus pallidus species group consisting of six species [61]. By using the mPTP species delimitation approach, both BINs (BOLD:AEH5984 and BOLD:AEE1997) belonging to the genus Orchesella were clustered into one MOTU. Orchesella cincta and the aforementioned MOTU are genetically and morphologically related (Figure 5b). The remaining BINS (BOLD:AEH9402 and BOLD:AEJ0895) were not subjected to maximum likelihood analysis, since they were only represented by one specimen.
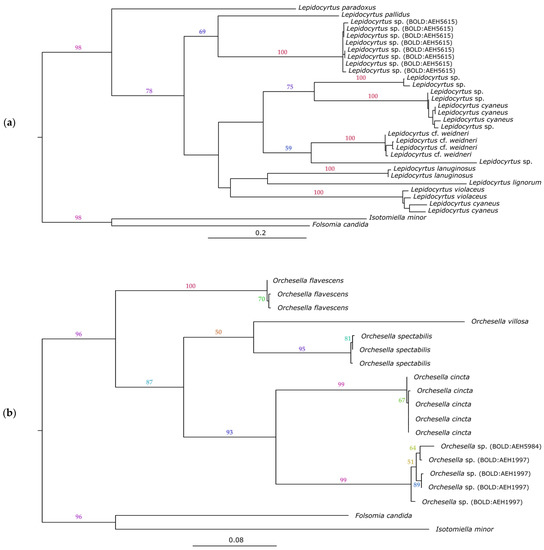
Figure 5.
Maximum likelihood phylogram inferred for specimens of the genus Lepidocyrtus (a) and the genus Orchesella (b). Numbers on the branches represent the nonparametric bootstrap support (≥50). The trees are rooted on Folsomia candida (BOLD:AAB6463) and Isotomiella minor (BOLD:ACQ1061) as outgroups.
3.4. Similarity Measures
The Jaccard similarity index was compared between the five sites. The lowest values were found between all of the sites in the case of Lepidopteran species, where there was no overlap in species present between the sites. The result was probably affected by the low species number. The highest index values were found in the case of Isopoda morphospecies between integrated olive orchard and natural habitat, as well as in the ecological olive orchard. Between the integrated olive orchard and the integrated vineyard, as well as the ecological vineyard and natural habitat, high index values were recorded for the Hymenopteran species. High index values were also observed for the Collembolan morphospecies in the case of the two vineyards and the integrated olive orchard. On the other hand, low index values were observed between all sites for the Hemipteran as well as Dipteran species. The results are shown on Figure 6. Oligochaeta were not included in the analysis due to low species number (two).
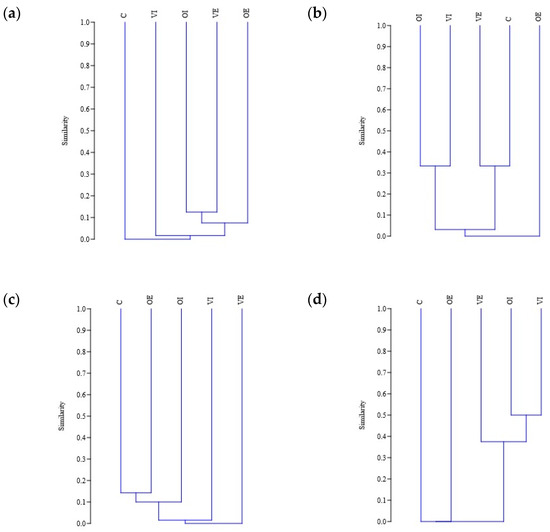
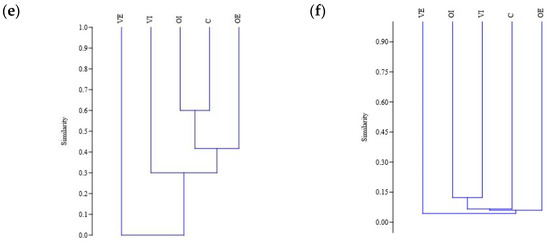
Figure 6.
Jaccard similarity between the study sites for Hemipteran (a), Hymenopteran (b), Dipteran (c), Collembolan (d), and Isopods (e) species, and for all the groups combined (f). Study sites are annotated with abbreviations as follows: OE, olive orchard with ecological pest management; OI, olive orchard with integrated pest management; VE, vineyard with ecological pest management; VI, vineyard with integrated pest management, C, natural habitat.
4. Discussion
Our results revealed a lower coverage of sequences in databases for Collembolans and Oligochaetes, and a better coverage for Lepidopterans, Hemipterans, Dipterans, and Hymenopterans. As expected, the highest number of species and morphospecies was observed for Hemipterans and Dipterans, due to their high abundance in agricultural areas. As mentioned above, most species were grouped to one specific BIN, with the exception of three species, Tetramorium semilaevae (Hymenoptera, Formicidae), Armadillidium vulgare (Isopoda, Armadillidiidae), and Prays oleae (Lepidoptera, Praydidae), which were sorted into two or more BINs. This can point to an intraspecific genetic divergence higher than 2.2% [6,62], leading to the conclusion that COI marker is not ideal for the genetic distinction of these species. The application of species delimitation methods used to estimate species number for Collembolans and Oligochaetes, as well as the overall results obtained for these two groups, suggest that there is an underestimated species richness in the Mediterranean area.
The analysis of the species composition for the recorded species/morphospecies suggested that there was more similarity in the overall species composition for the soil-dwelling organisms compared to the canopy fauna. The potential explanation can be found in the strong effect of the surrounding agricultural landscape on the canopy fauna. It is worth mentioning that Formicidae, making up the majority of our Hymenoptera species, have similar compositions depending on the management type, indicating that they are strong bio-indicators of land use effects, which is in accordance with the earlier research [63].
As was expected, the majority of Hemipterans were identified at the species level, seeing as this group was studied in numerous DNA barcoding efforts [64,65,66,67]. From this group, the highest number of unidentified species belonged to the family Cicadellidae, which is widely present at agricultural sites, and the species from this family are often vectors of various plant diseases. Some members of the family are invasive species, such as Scaphoideus titanus (Hemiptera, Cicadellidae), a species that causes agronomical damage throughout Europe as a “Flavescence dorée” vector [68]. While this insect family is highly diverse with more than 20,000 described species, only 2000 species are present with sequence records in the BOLD database. This makes the identification of Cicadellidae species through DNA barcodes challenging.
The identification of Oligochaete specimens also presented a challenge due to the low sequence coverage in the databases. This group is genetically understudied in Croatia, with only 10 available sequences (out a total of 7532 available sequences representing 218 species) according to the BOLD database. Moreover, high species diversity in Mediterranean and the existence of many cryptic species also make species identification, morphologically as well as genetically, more demanding [69,70]. We did not identify any of the 36 specimens at species level through pre-existing sequences, but we confirmed that all specimens belong to the genus Octodrilus. The Balkans are among the main centers of diversification of the genus Octodrilus, and the phenomena of morphological convergence between unrelated species is frequent, possibly caused by ecological adaptations [41,71]. In addition, the morphological diagnostic characters of many species of Octodrilus do not consider the variations between populations (within a population there is more generally uniformity). Therefore, the definition of taxonomic boundaries (and synonymies) is quite problematic, and discrimination using morphological characters is highly complex. The DNA barcoding of specimens appears to be useful for assessing the biodiversity of this genus in the Balkans, including the Mediterranean part. Species delimitation methods revealed that specimens from our sample could be divided into three MOTUs. Considering the results of Huang et al. [72], where interspecific distance was in some cases greater than 15% and intraspecific difference was up to 7.8%, in analyzing genetic distances for our dataset, earthworms were grouped into two MOTUs. That was consistent with the morphological results that placed our specimens into two morphospecies, Octodrilus croaticus and an unidentified species. The unidentified species was most closely related to O. complanatus, which was also confirmed by the examination of morphological characters. A sexually mature specimen identified as O. croaticus was genetically distant compared to other specimens from our sample and from the database. The distribution of O. croaticus encompasses the Balkan Peninsula, including the Mediterranean part of Croatia [24]. This complex group is not only underrepresented in two main databases, BOLD and NCBI, but also contains a high number of endemic species. Importantly, for better understanding their taxonomy, more systematic sampling and barcoding efforts are necessary.
The number of described Collembolan species is only a part of the total number, as earlier research shows, due to the lack of data for many geographical regions, including parts of southern Europe [73]. Due to the abovementioned, and the fact that described species are not present with a sequence in databases, difficulties with identification at species level were expected. Our results showed that Collembolans are underrepresented in the databases. Specimens included in our research were most likely endemic species, and their species identification could not be carried out with global sequence data. Similar results have been reported in Shaw and Benefer [74], where they have found that 25 out of 48 species do not correspond to a known BIN. The comparison of morphological with genetic data and the species delimitation placement of our specimens grouped them into four MOTUs. The highest number of specimens belonged to the genus Lepidocyrtus which among the Collembola genera comprises the highest number of species [75]. Because of the prevalence of cryptic species and species groups that cannot be resolved using solely morphological criteria, some authors report that the real number of Lepidocyrtus species could be significantly higher than the species number currently recognizes [76,77,78,79], which is probably also the case with the Lepidocyrtus specimens collected at our research sites. Specimens of the genus Orchesella were grouped into two BINs that finally formed one MOTU. A morphological difference between the two BINs was also evident in the different pigmentation levels, but this intraspecific variability, which affects pigmentation, is sometimes linked to their life cycle [80,81]. The Orchesella species from the Mediterranean area have a high genetic divergence, which is probably the reason why our specimens differ compared to the other Orchesella species [80].
The species delimitation conducted on our dataset showed discordance among the methods used for species assignment, suggesting a different number of potential species, in the case of both Oligochaetes and Collembolans. Likewise, even though species delimitation and BIN assignment proved to be a valuable tool in various species identification [81,82], a number of papers reported taxa incongruence among implemented methods [83].
Contrary to earthworms and springtails, all of the Lepidopteran specimens were identified at the species level due to the high number of available sequences in DNA barcode databases [84,85,86]. Our results indicated that the DNA barcoding method could be used as a reliable tool for Lepidopteran species identification because there is a DNA sequence available in BOLD for 73% of European Lepidopterans [8].
With regard to Formicidae (Hymenoptera), there are DNA barcode records for more than half of the described species. Earlier studies also report good DNA sequence coverage in databases [87], with many research projects providing numerous DNA barcode sequences for the Mediterranean area [88]. However, the high divergence of ant species in the Mediterranean area, from the mainland to the islands [89], complicates species identification. Namely, species identification through DNA barcodes can be affected by high intraspecific divergence, as in the case of Pheidole pallidula. Different species exhibit different levels of intraspecific divergence, and it is important to keep this in mind while analyzing ant species composition through DNA barcode data.
In the case of Isopods, only 1300 species were presented with DNA barcodes. These were mainly marine species. We observed that some species could be identified only to the genus level or lower, mostly because there are not enough DNA barcode data on this group.
There are not many papers focusing on the DNA barcoding of the whole Diptera fauna for a specific geographical region [90]; however, most studies have been focused on specific families or genera from this insect order. As noticed in Morinière et al. [91], many of so called “dark taxa” of Dipteran, or species without records in databases, are small in size. Families with the smallest body size often have a higher number of overlooked species, either taxonomically or genetically. We observed a similar pattern, where small-sized specimens could not be identified at the species level. In numerous studies, such specimens have been overlooked and, thus, their identification through DNA barcoding is made more difficult. Authors in Morinière et al. [91] have concluded that sequences which were not joined with species names, but classified only as OTUs, are equally important, as they can be used to compare the diversity of samples collected at different sites. It is also important to add that such DNA sequences are indicators of what we have missed in our barcoding efforts, and that many species are still waiting not just to be barcoded, but also discovered.
Through our experiment, we identified, using DNA barcode tools, an invasive species Drosophila suzukii (Diptera, Drosophilidae) in the olive orchard in Škabrnja. This species has already been recorded for the Zadar County in different plantations [92], but not in olive orchards. However, our sampling site was surrounded by cherry orchards, suggesting that Drosophila suzukii spread in the area even between different cultivars. This species, native of eastern and south-eastern Asia, represents an economical problem in Europe, given that it is easily distributed. This only reinforces the fact that a rapid biodiversity assessment using DNA barcoding can be valuable in detecting non-native invasive species, and among native species, especially rare and locally distributed ones. It is necessary to gain more biodiversity information on natural and also agricultural habitats to be able to solely rely on the DNA barcode ID tool.
The efficiency of DNA barcoding in Mediterranean agricultural areas of Croatia differs between groups of organisms depending on several factors: firstly, on the availability of the data for the different groups of organisms in the two largest databases (NCBI and BOLD), and secondly, on the level of taxonomy relationship resolution and the association of molecular data with the morphospecies concept for the particular group [93]. Some groups, such as Collembola and Oligochaeta, were more difficult to identify through previous data, as their fauna seemed to be more endemic to the area. On the other hand, the identified species of Dipterans, Hemipterans, and Lepidopterans showed geographically wide distribution and presence in agricultural habitats. Consequently, their identification was facilitated through a great amount of data available in the databases. Ant fauna in the studied area showed a similar species composition with other Mediterranean areas previously barcoded and available in the BOLD database [88,89], which facilitated their identification using the DNA barcoding method. This method proved suitable for biodiversity analysis in this part of the Mediterranean. However, it is important to keep in mind that, especially for some groups, such as Collembolans and Oligochaetes, DNA barcode sequencing is not sufficient for species identification, and it should be supplemented with classical morphological analysis. Nevertheless, this does not reduce the value of DNA barcode data, as databases are continuously appended with different species’ sequences. It is, thus, expected that, at some point, DNA barcodes will be able to make species-level determinations for the vast majority of groups.
Supplementary Materials
The following supporting information can be downloaded at: https://www.mdpi.com/article/10.3390/d14030182/s1, Table S1. For each sampling site, a list of geographical coordinates, altitude, and surface area is provided. Table S2. List of specimens included in the research. Table S3. Calculated p-distances between Octodrilus MOTU groups. Minimum and maximum values and calculated standard deviation and standard error are listed. Supplementary File S1a. Supplementary File S1b. Supplementary File S2.
Author Contributions
Conceptualization, L.Š.J., B.A.D. and M.J.; methodology, L.Š.J., B.A.D. and M.J.; validation, L.Š.J., M.J. and E.R.; formal analysis, B.A.D.; resources, L.Š.J.; data curation, B.A.D. and E.R.; writing—original draft preparation, L.Š.J. and B.A.D.; writing—review and editing, L.Š.J., M.J. and E.R.; visualization, B.A.D.; supervision, L.Š.J.; project administration, L.Š.J.; funding acquisition, L.Š.J. All authors have read and agreed to the published version of the manuscript.
Funding
This research was funded by The Croatian Science Foundation under the MEDITERATRI Project (UIP-2017-05-1046), granted to Lucija Šerić Jelaska, and co-funded by the Department of Biology, Faculty of Science at the University of Zagreb and the Croatian Academy of Sciences and Art.
Institutional Review Board Statement
Not applicable.
Data Availability Statement
Data supporting reported results can be found in Barcode of Life Database under the DOI: dx.doi.org/10.5883/DS-070222, and Mendeley Data public depository under the DOI: 10.17632/3gpfzz9rzv.1.
Acknowledgments
We are thankful to Lara Ivanković Tatalović and Tomislav Kos for their help in the field and sample photographing, Petra Furčić for creating the map of the study sites, Ľubomír Kováč for help with Collembolan species identification, Josip Primorac for sorting ant samples in the laboratory. We are also thankful to the Croatian Academy of Sciences and Art for co-funding the research within the Croatian CryoEntoArk project.
Conflicts of Interest
The authors declare no conflict of interest.
References
- Hebert, P.D.N.; Gregory, T.R. The promise of DNA barcoding for taxonomy. Syst. Biol. 2005, 54, 852–859. [Google Scholar] [CrossRef]
- Jung, S.; Duwal, R.K.; Lee, S. COI barcoding of true bugs (Insecta, Heteroptera). Mol. Ecol. Resour. 2011, 11, 266–270. [Google Scholar] [CrossRef]
- Hebert, P.D.N.; Cywinska, A.; Ball, S.L.; de Waard, J.R. Biological identifications through DNA barcodes. Proc. R. Soc. B Biol. Sci. 2003, 270, 313–321. [Google Scholar] [CrossRef] [Green Version]
- Greenstone, M.H.; Rowley, D.L.; Heimbach, U.; Lundgren, J.G.; Pfannenstiel, R.S.; Rehner, S.A. Barcoding generalist predators by polymerase chain reaction: Carabids and spiders. Mol. Ecol. 2005, 14, 3247–3266. [Google Scholar] [CrossRef]
- Ratnasingham, S.; Hebert, P.D.N. BOLD: The Barcode of Life Data System. Mol. Ecol. Notes 2007, 7, 355–364. [Google Scholar] [CrossRef] [Green Version]
- Ratnasingham, S.; Hebert, P.D.N. A DNA-based registry for all animal species: The barcode index number (BIN) system. PLoS ONE 2013, 8, e66213. [Google Scholar] [CrossRef] [Green Version]
- Pentinsaari, M.; Blagoev, G.A.; Hogg, I.D.; Levesque-Beaudin, V.; Perez, K.; Sobel, C.N.; Vandenbrink, B.; Borisenko, A. A DNA Barcoding Survey of an Arctic Arthropod Community: Implications for Future Monitoring. Insects 2020, 11, 46. [Google Scholar] [CrossRef] [PubMed] [Green Version]
- Lopez-Vaamonde, C.; Kirichenko, N.; Cama, A.; Doorenweerd, C.; Godfray, H.C.J.; Guiguet, A.; Gomboc, S.; Huemer, P.; Landry, J.F.; Laštůvka, A.; et al. Evaluating DNA Barcoding for Species Identification and Discovery in European Gracillariid Moths. Front. Ecol. Evol. 2021, 9, 66. [Google Scholar] [CrossRef]
- Gregory, T. DNA barcoding does not compete with taxonomy. Nature 2005, 434, 1067. [Google Scholar] [CrossRef] [PubMed] [Green Version]
- Costa, F.; Dewaard, J.R.; Boutillier, J.; Ratnasingham, S.; Dooh, R.T.; Hajibabaei, M.; Hebert, P. Biological identifications through DNA barcodes: The case of the Crustacea. Can. J. Fish. Aquat. Sci. 2007, 64, 272–295. [Google Scholar] [CrossRef]
- Hendrich, L.; Morinière, J.; Haszprunar, G.; Hebert, P.D.N.; Hausmann, A.; Köhler, F.; Balke, M. A comprehensive DNA barcode database for Central European beetles with a focus on Germany: Adding more than 3500 identified species to BOLD. Mol. Ecol. Resour. 2015, 15, 795–818. [Google Scholar] [CrossRef] [PubMed]
- Villalta, I.; Ledet, R.; Baude, M.; Genoud, D.; Bouget, C.; Cornillon, M.; Moreau, S.; Courtial, B.; Lopez-Vaamonde, C. A DNA barcode-based survey of wild urban bees in the Loire Valley, France. Sci. Rep. 2021, 11, 4770. [Google Scholar] [CrossRef] [PubMed]
- Chimeno, C.; Hausmann, A.; Schmidt, S.; Raupach, M.J.; Doczkal, D.; Baranov, V.; Hübner, J.; Höcherl, A.; Albrecht, R.; Jaschhof, M.; et al. Peering into the Darkness: DNA Barcoding Reveals Surprisingly High Diversity of Unknown Species of Diptera (Insecta) in Germany. Insects 2022, 13, 82. [Google Scholar] [CrossRef] [PubMed]
- Smith, M.A.; Fisher, B.L.; Hebert, P.D.N. DNA barcoding for effective biodiversity assessment of a hyperdiverse arthropod group: The ants of Madagascar. Philos. Trans. R. Soc. Lond. Ser. B 2005, 360, 1825–1834. [Google Scholar] [CrossRef] [Green Version]
- De Leon, L.F.; Cornejo, A.; Gavilan, R.G.; Aguilar, C. Hidden biodiversity in Neotropical streams: DNA barcoding uncovers high endemicity of freshwater macroinvertebrates at small spatial scales. PLoS ONE 2020, 15, e0231683. [Google Scholar] [CrossRef]
- Nneji, L.M.; Adeola, A.C.; Wang, Y.Y.; Ajao, A.M.; Anyaele, O.; Malann, Y.; Olatunde, O.; Nneji, I.C.; Ayoola, A.O.; Rahman, M.M.; et al. Testing the Effectiveness of DNA Barcoding for Biodiversity Assessment of Moths from Nigeria. Diversity 2020, 12, 85. [Google Scholar] [CrossRef] [Green Version]
- Kennedy, S.R.; Prost, S.; Overcast, I.; Rominger, A.J.; Gillespie, R.G.; Krehenwinkel, H. High-throughput sequencing for community analysis: The promise of DNA barcoding to uncover diversity, relatedness, abundances and interactions in spider communities. Dev. Genes Evol. 2020, 230, 185–201. [Google Scholar] [CrossRef] [Green Version]
- Meiklejohn, K.A.; Damaso, N.; Robertson, J.M. Assessment of BOLD and GenBank—Their accuracy and reliability for the identification of biological materials. PLoS ONE 2019, 14, e0217084. [Google Scholar] [CrossRef] [Green Version]
- Page, R.D. DNA barcoding and taxonomy: Dark taxa and dark texts. Philos. Trans. R. Soc. Lond. Ser. B 2016, 371, 20150334. [Google Scholar] [CrossRef] [Green Version]
- Jinbo, U.; Kato, T.; Ito, M. Current progress in DNA barcoding and future implications for entomology. Entomol. Sci. 2011, 14, 107–124. [Google Scholar] [CrossRef]
- Cuff, J.P.; Drake, L.E.; Tercel, M.P.; Stockdale, J.E.; Orozco-ter Wengel, P.; Bell, J.R.; Vaughan, I.P.; Müller, C.T.; Symondson, W.O. Money spider dietary choice in pre- and post-harvest cereal crops using metabarcoding. Ecol. Entomol. 2021, 46, 249–261. [Google Scholar] [CrossRef]
- Lafage, D.; Elbrecht, V.; Cuff, J.P.; Steinke, D.; Hambäck, P.A.; Erlandsson, A. A new primer for metabarcoding of spider gut contents. Environ. DNA 2020, 2, 234–243. [Google Scholar] [CrossRef]
- O’Rourke, D.R.; Mangan, M.T.; Mangan, K.E.; Bokulich, N.A.; MacManes, M.D.; Foster, J.T. Lord of the Diptera (and Moths and a Spider): Molecular Diet Analyses and Foraging Ecology of Indiana Bats in Illinois. Front. Ecol. Evol. 2021, 9, 12. [Google Scholar] [CrossRef]
- Kutuzović, D.H.; Kutuzović, B.H. Checklist of the earthworm fauna of Croatia (Oligochaeta: Lumbricidae). Zootaxa 2013, 3710, 1–30. [Google Scholar] [CrossRef]
- Bračko, G. Review of the ant fauna (Hymenoptera: Formicidae) of Croatia. Acta Entomol. Slov. 2006, 14, 131–156. [Google Scholar]
- Franin, K.; Franin, G.K.; Maričić, B.; Marcelić, Š.; Pavlović, M.; Kos, T.; Laznik, Ž. True bugs (Heteroptera) assemblage and diversity in the ecological infrastructures around the Mediterranean vineyards. Bull. Insectol. 2021, 74, 65–78. [Google Scholar]
- Botham, M.S.; Fernandez-Ploquin, E.C.; Brereton, T.; Harrower, C.A.; Roy, D.B.; Heard, M.S. Lepidoptera communities across an agricultural gradient: How important are habitat area and habitat diversity in supporting high diversity? J. Insect Conserv. 2015, 19, 403–420. [Google Scholar] [CrossRef]
- Porco, D.; Bedos, A.; Greenslade, P.; Janion, C.; Skarżyński, D.; Stevens, M.I.; Deharveng, L. Challenging species delimitation in Collembola: Cryptic diversity among common springtails unveiled by DNA barcoding. Invertebr. Syst. 2012, 26, 470–477. [Google Scholar] [CrossRef]
- Ponge, J.F.; Gillet, S.; Dubs, F.; Fedoroff, E.; Haese, L.; Sousa, J.P.; Lavelle, P. Collembolan communities as bioindicators of land use intensification. Soil Biol. Biochem. 2003, 35, 813–826. [Google Scholar] [CrossRef] [Green Version]
- Hendrickx, F.; Maelfait, J.P.; Van Wingerden, W.; Schweiger, O.; Speelmans, M.; Aviron, S.; Augenstein, I.; Billeter, R.; Bailey, D.; Bukacek, R.; et al. How landscape structure, land-use intensity and habitat diversity affect components of total arthropod diversity in agricultural landscapes. J. Appl. Ecol. 2007, 44, 340–351. [Google Scholar] [CrossRef]
- Hevia, V.; Ortega, J.; Azcárate, F.M.; López, C.A.; González, J.A. Exploring the effect of soil management intensity on taxonomic and functional diversity of ants in Mediterranean olive groves. Agric. For. Entomol. 2019, 21, 109–118. [Google Scholar] [CrossRef]
- McNabb, D.M.; Halaj, J.; Wise, D.H. Inferring trophic positions of generalist predators and their linkage to the detrital food web in agroecosystems: A stable isotope analysis. Pedobiologia 2001, 45, 289–297. [Google Scholar] [CrossRef]
- King, R.A.; Vaughan, I.P.; Bell, J.R.; Bohan, D.A.; Symondson, W.O. Prey choice by carabid beetles feeding on an earthworm community analysed using species- and lineage-specific PCR primers. Mol. Ecol. 2010, 19, 1721–1732. [Google Scholar] [CrossRef] [PubMed]
- Šerić Jelaska, L.; Franjević, D.; Jelaska, S.D.; Symondson, W.O.C. Prey detection in carabid beetles (Coleoptera: Carabidae) in woodland ecosystems by PCR analysis of gut contents. Eurpean J. Entomol. 2014, 111, 631–638. [Google Scholar] [CrossRef] [Green Version]
- Šerić Jelaska, L.; Symondson, O.C.W. Predation on epigeic, endogeic and anecic earthworms by carabids active in spring and autumn. Period. Biol. 2016, 118, 281–289. [Google Scholar] [CrossRef]
- Sanders, D.; Platner, C. Intraguild interactions between spiders and ants and top-down control in a grassland food web. Oecologia 2007, 150, 611–624. [Google Scholar] [CrossRef]
- Schowalter, T.; Chao, J.T. Canopy Insect Sampling. In Measuring Arthropod Biodiversity; Santos, J.C., Fernandes, G.W., Eds.; Springer: Berlin/Heidelberg, Germany, 2021. [Google Scholar] [CrossRef]
- Macfadyen, A. Notes on methods for the extraction of small arthropods. J. Anim. Ecol. 1953, 21, 65–77. [Google Scholar] [CrossRef]
- Casquet, J.; Thebaud, C.; Gillespie, R.G. Chelex without boiling, a rapid and easy technique to obtain stable amplifiable DNA from small amounts of ethanol-stored spiders. Mol. Ecol. Resour. 2012, 12, 136–141. [Google Scholar] [CrossRef]
- Folmer, O.; Black, M.; Hoeh, W.; Lutz, R.; Vrijenhoek, R. DNA primers for amplification of mitochondrial cytochrome c oxidase subunit I from diverse metazoan invertebrates. Mol. Mar. Biol. Biotechnol. 1994, 3, 294–299. [Google Scholar]
- Mršić, N. Monograph on earthworms (Lumbricidae) of the Balkans. Acad. Sci. Et Artium Slov. Cl. IV Hist. Nat. 1991, 30, 1–757. [Google Scholar]
- Szederjesi, T. The first combined checklist of earthworms of the Northeastern Mediterranean region (Clitellata: Megadrili). Opusc. Zool. Bp. 2017, 48, 77–116. [Google Scholar] [CrossRef]
- Hopkin, S.P. A key to the Collembola (springtails) of Britain and Ireland; Field Studies Council Publ.: Telford, Shropshire, UK, 2007. [Google Scholar]
- Seifert, B. The ants of Central and North Europe; Lutra Verlags und Vertriebsgesellschaft: Tauer, Germany, 2018. [Google Scholar]
- Lebas, C.; Galkowski, C.; Blatrix, R.; Wegnet, P. Ants of Britain and Europe; Bloomsbury Publishing PLC.: London, UK, 2019. [Google Scholar]
- Hall, T.A. BioEdit: A User-Friendly Biological Sequence Alignment Editor and Analysis Program for Windows 95/98/NT. Nucleic Acids Symp. Ser. 1999, 41, 95–98. [Google Scholar]
- Altschul, S.F.; Gish, W.; Miller, W.; Myers, E.W.; Lipman, D.J. Basic local alignment search tool. J. Mol. Biol. 1990, 215, 403–410. [Google Scholar] [CrossRef]
- Kumar, S.; Stecher, G.; Li, M.; Knyaz, C.; Tamura, K. MEGA X: Molecular Evolutionary Genetics Analysis across computing platforms. Mol. Biol. Evol. 2018, 35, 1547–1549. [Google Scholar] [CrossRef]
- Edgar, R.C. MUSCLE: A multiple sequence alignment method with reduced time and space complexity. BMC Bioinform. 2004, 5, 113. [Google Scholar] [CrossRef] [Green Version]
- Villesen, P. FaBox: An online toolbox for fasta sequences. Mol. Ecol. Notes 2007, 7, 965–968. [Google Scholar] [CrossRef]
- Maddison, W.P.; Maddison, D.R. Mesquite: A Modular System for Evolutionary Analysis. Version 3.50. 2019. Available online: http://www.mesquiteproject.org (accessed on 9 February 2022).
- Stamatakis, A. RAxML version 8: A tool for phylogenetic analysis and post-analysis of large phylogenies. Bioinformatics 2014, 30, 1312–1313. [Google Scholar] [CrossRef]
- Miller, M.A.; Pfeiffer, W.; Schwartz, T. Creating the CIPRES Science Gateway for inference of large phylogenetic trees. In 2010 Gateway Computing Environments Workshop (GCE), Proceedings of the Gateway Computing Environments Workshop (GCE), New Orleans, LA, USA, 14 November 2010; Institute of Electrical and Electronics Engineers (IEEE): Manhattan, NY, USA, 2010; pp. 1–8. [Google Scholar]
- Rambaut, A. FigTree, Version 1.4.4. (Computer Program). 2014. Available online: http://tree.bio.ed.ac.uk/software/figtree/ (accessed on 14 February 2022).
- Puillandre, N.; Lambert, A.; Brouillet, S.; Achaz, G. ABGD, Automatic Barcode Gap Discovery for primary species delimitation. Mol. Ecol. 2011, 21, 1864–1877. [Google Scholar] [CrossRef]
- Zhang, J.; Kapli, P.; Pavlidis, P.; Stamatakis, A.A. General Species Delimitation Method with Applications to Phylogenetic Placements. Bioinformatics 2013, 29, 2869–2876. [Google Scholar] [CrossRef] [Green Version]
- Kapli, P.; Lutteropp, S.; Zhang, J.; Kobert, K.; Pavlidis, P.; Stamatakis, A.; Flouri, T. Multi-rate Poisson tree processes for single-locus species delimitation under maximum likelihood and Markov chain Monte Carlo. Bioinformatics 2017, 33, 1630–1638. [Google Scholar] [CrossRef] [Green Version]
- Albertini, A.; Pizzolotto, R.; Petacchi, R. Carabid patterns in olive orchards and woody semi-natural habitats: First implications for conservation biological control against Bactrocera oleae. BioControl 2017, 62, 71–83. [Google Scholar] [CrossRef]
- Hammer, Ø.; Harper, D.A.T.; Ryan, P.D. PAST: Paleontological statistics software package for education and data analysis. Palaeontol. Electron. 2001, 4, 9. [Google Scholar]
- Zicsi, A.; Cuendet, G. Über eine neue Octodrilus-Art aus Frankreich (Oligochaeta: Lumbricidae). Rev. Suisse Zool. 2005, 112, 329–331. [Google Scholar] [CrossRef]
- Winkler, D.; Traser, G. Explanation of the European Lepidocyrtus pallidus–serbicus group (Collembola, Entomobryidae), with description of new species from Hungary. Zootaxa 2012, 3394, 35–47. [Google Scholar] [CrossRef] [Green Version]
- Raupach, M.J.; Hannig, K.; Morinière, J.; Hendrich, L. A DNA barcode library for ground beetles (Insecta, Coleoptera, Carabidae) of Germany: The genus Bembidion Latreille, 1802 and allied taxa. ZooKeys 2016, 592, 121–141. [Google Scholar] [CrossRef] [Green Version]
- Andersen, A.N.; Hoffmann, B.D.; Müller, W.J.; Griffiths, A.D. Using ants as bioindicators in land management: Simplifying assessment of ant community responses. J. Appl. Ecol. 2002, 39, 8–17. [Google Scholar] [CrossRef]
- Coeur d’acier, A.; Cruaud, A.; Artige, E.; Genson, G.; Clamens, A.L.; Pierre, E.; Hudaverdian, S.; Simon, J.-C.; Jousselin, E.; Rasplus, J.-Y. DNA Barcoding and the Associated PhylAphidB@se Website for the Identification of European Aphids (Insecta: Hemiptera: Aphididae). PLoS ONE 2014, 9, e97620. [Google Scholar] [CrossRef]
- Foottit, R.G.; Maw, H.E.L.; Von Dohlen, C.D.; Hebert, P.D.N. Species identification of aphids (Insecta: Hemiptera: Aphididae) through DNA barcodes. Mol. Ecol. Resour. 2008, 8, 1189–1201. [Google Scholar] [CrossRef]
- Gwiazdowski, R.A.; Foottit, R.G.; Maw, H.E.L.; Hebert, P.D.N. The Hemiptera (Insecta) of Canada: Constructing a Reference Library of DNABarcodes. PLoS ONE 2015, 4, e0125635. [Google Scholar] [CrossRef] [Green Version]
- Park, D.; Suh, S.; Hebert, P.; Oh, H.; Hong, K. DNA barcodes for two scale insect families, mealybugs (Hemiptera: Pseudococcidae) and armored scales (Hemiptera: Diaspididae). Bull. Entomol. Res. 2011, 101, 429–434. [Google Scholar] [CrossRef] [Green Version]
- Chuche, J.; Thiéry, D. Biology and ecology of the Flavescence dorée vector Scaphoideus titanus: A review. Agron. Sustain. Dev. 2014, 34, 381–403. [Google Scholar] [CrossRef] [Green Version]
- Csuzdi, C.; Szederjesi, T.; Marchán, D.F.; Sosa, I.D.; Gavinelli, F.; Dorigo, L.; Pamio, A.; Dreon, A.L.; Fusaro, S.; Moretto, E.; et al. DNA barcoding of the Italian anecic Octodrilus species in rural (vineyard) and forested areas with description of Octodrilus zicsiniello sp. nov.(Clitellata, Megadrili). Zootaxa 2018, 4496, 43–64. [Google Scholar] [CrossRef] [PubMed]
- Novo, M.; Almodóvar, A.; Fernández, R.; Trigo, D.; Cosín, D.J.D. Cryptic speciation of hormogastrid earthworms revealed by mitochondrial and nuclear data. Mol. Phylogenetics Evol. 2010, 56, 507–512. [Google Scholar] [CrossRef] [PubMed]
- Mršić, N. Allolobophora oculata (Hoffmeister 1845) new Earthworms species (Lumbricidae) in the Fauna of Yugoslavia. Biolški Vestn. 1987, 35, 67–77. [Google Scholar]
- Huang, J.; Xu, Q.; Sun, Z.J.; Tang, G.L.; Su, Z.Y. Identifying earthworms through DNA barcodes. Pedobiologia 2007, 51, 301–309. [Google Scholar] [CrossRef]
- Rusek, J. Biodiversity of Collembola and their functional role in the ecosystem. Biodivers. Conserv. 1998, 7, 1207–1219. [Google Scholar] [CrossRef]
- Shaw, P.; Benefer, C.M. Development of a barcoding database for the UK Collembola: Early results. Soil Org. 2015, 87, 197–202. [Google Scholar]
- Mateos, E.; Lukić, M. New European Lepidocyrtus Bourlet, 1839 (Collembola, Entomobryidae) with the first description of feeding-related dancing behaviour in Collembola. Zootaxa 2019, 4550, 221–235. [Google Scholar] [CrossRef]
- Mateos, E.; Escuer, P.; Buşmachiu, G.; Riutort, M.; Álvarez-Presas, M. Untangling Lepidocyrtus (Collembola, Entomobryidae): New molecular data shed light on the relationships of the European groups. Invertebr. Syst. 2018, 32, 639–651. [Google Scholar] [CrossRef]
- Soto-Adames, F.N. Phylogeny of Neotropical Lepidocyrtus (Collembola: Entomobryidae): First assessment of patterns of speciation in Puerto Rico and phylogenetic relevance of some subgeneric diagnostic characters. Syst. Entomol. 2020, 25, 485–502. [Google Scholar] [CrossRef]
- Cicconardi, F.; Nardi, F.; Emerson, B.C.; Frati, F.; Fanciulli, P.P. Deep phylogeographic divisions and long-term persistence of forest invertebrates (Hexapoda: Collembola) in the north-western Mediterranean basin. Mol. Ecol. 2010, 19, 386–400. [Google Scholar] [CrossRef] [PubMed]
- Frati, F.; Dell’Ampio, E.; Casasanta, S.; Carapelli, A.; Paolo Fanciulli, P. Large Amounts of Genetic Divergence among Italian Species of the Genus Orchesella (Insecta, Collembola) and the Relationships of Two New Species. Mol. Phylogenetics Evol. 2020, 17, 456–461. [Google Scholar] [CrossRef] [PubMed]
- Parisi, V. Ricerche sui Collemboli: Dati morfometrici sullo sviluppo della livrea della Orchesella villosa (L.) e descrizione di una nuova specie. Boll. Di Zool. Agrar. E Di Bachic. 1960, 3, 117–126. [Google Scholar]
- Galimberti, A.; Spada, M.; Russo, D.; Mucedda, M.; Agnelli, P.; Crottini, A.; Ferri, E.; Martinoli, A.; Casiraghi, M. Integrated Operational Taxonomic Units (IOTUs) in Echolocating Bats: A Bridge between Molecular and Traditional Taxonomy. PLoS ONE 2012, 7, e40122. [Google Scholar] [CrossRef] [Green Version]
- Shen, Y.Y.; Chen, X.; Murphy, R.W. Assessing DNA Barcoding as a Tool for Species Identification and Data Quality Control. PLoS ONE 2013, 8, e57125. [Google Scholar] [CrossRef] [Green Version]
- Hartop, E.; Srivathsan, A.; Ronquist, F.; Meier, R. Large-scale Integrative Taxonomy (LIT): Resolving the data conundrum for dark taxa. bioRxiv 2021. [Google Scholar] [CrossRef]
- Ball, S.L.; Armstrong, K.F. DNA barcodes for insect pest identification: A test case with tussock moths (Lepidoptera: Lymantriidae). Can. J. For. Res. 2006, 36, 337–350. [Google Scholar] [CrossRef]
- Huemer, P.; Mutanen, M.; Sefc, K.M.; Hebert, P.D.N. Testing DNA barcode performance in 1000 species of European Lepidoptera: Large geographic distances have small genetic impacts. PLoS ONE 2014, 9, e115774. [Google Scholar] [CrossRef] [Green Version]
- Wilson, J.J. Assessing the value of DNA barcodes and other priority gene regions for molecular phylogenetics of Lepidoptera. PLoS ONE 2010, 5, e10525. [Google Scholar] [CrossRef] [Green Version]
- Surya, P.; Sebastian, C.D. Revisiting DNA barcoding of ants (Formicidae: Hymenoptera) from India. Int. J. Entomol. Res. 2020, 5, 161–169. [Google Scholar]
- Blatrix, R.; Aubert, C.; Decaens, T.; Berquier, C.; Andrei-Ruiz, M.C.; Galkowski, C. Contribution of a DNA barcode to an assessment of the specificity of ant taxa (Hymenoptera: Formicidae) on Corsica. Eur. J. Entomol. 2020, 117, 420–429. [Google Scholar] [CrossRef]
- Schär, S.; Menchetti, M.; Schifani, E.; Hinojosa, J.C.; Platania, L.; Dapporto, L.; Vila, R. Integrative biodiversity inventory of ants from a Sicilian archipelago reveals high diversity on young volcanic islands (Hymenoptera: Formicidae). Org. Divers. Evol. 2020, 20, 405–416. [Google Scholar] [CrossRef]
- Ferreira, S.A.; Andrade, R.; Gonçalves, A.R.; Sousa, P.; Paupério, J.; Fonseca, N.A.; Beja, P. The InBIO barcoding initiative database: DNA barcodes of Portuguese Diptera 01. Biodivers. Data J. 2020, 8, e49985. [Google Scholar] [CrossRef] [PubMed] [Green Version]
- Morinière, J.; Balke, M.; Doczkal, D.; Geiger, M.F.; Hardulak, L.A.; Haszprunar, G.; Hausmann, A.; Hendrich, L.; Regalado, L.; Rulik, B.; et al. A DNA barcode library for 5200 German flies and midges (Insecta: Diptera) and its implications for metabarcoding-based biomonitoring. Mol. Ecol. Resour. 2019, 19, 900–928. [Google Scholar] [CrossRef] [Green Version]
- Bjeliš, M.; Buljubašić, I.; Popović, L.; Masten Milek, T. Spread of the spotted wing drosophila—Drosophila suzukii (Diptera, Drosophlidae) and new distribution records in Dalmatia region of Croatia. EPPO Bull. 2015, 45, 214–217. [Google Scholar] [CrossRef]
- DeSalle, R.; Goldstein, P. Review and interpretation of trends in DNA barcoding. Front. Ecol. Evol. 2019, 7, 302. [Google Scholar] [CrossRef] [Green Version]
Publisher’s Note: MDPI stays neutral with regard to jurisdictional claims in published maps and institutional affiliations. |
© 2022 by the authors. Licensee MDPI, Basel, Switzerland. This article is an open access article distributed under the terms and conditions of the Creative Commons Attribution (CC BY) license (https://creativecommons.org/licenses/by/4.0/).