Article

The Effect of Rainfall on the Population Densities and Community Structure of Birds in an Urbanized Zambezi Riparian Forest

1
Department of Vertebrate Ecology, Wrocław University of Environmental & Life Sciences, ul. Kozuchowska 5b, 51-631 Wroclaw, Poland
2
Department of Integrated Environmental Science, Ogongo Campus, University of Namibia, Private Bag, Oshakati 5520, Namibia
Diversity 2023, 15(11), 1126; https://doi.org/10.3390/d15111126
Submission received: 24 July 2023 / Revised: 25 October 2023 / Accepted: 25 October 2023 / Published: 31 October 2023
(This article belongs to the Special Issue Avian Diversity in Forest and Grassland)

Abstract

:
The species which make up the avian community are governed by a multitude of environmental and internal influences, and the crucial role of community ecology is to discern and explain the patterns arising from these influences. Some such influences are habitat structure and seasonality. This study aimed to investigate the structure of the avian community and population densities of birds in relation to habitat changes made by man, and in relation to differential rainfall. The study was set up in an urbanized riparian forest on the Zambezi River, NE Namibia. The forest close to the river bank has been slightly altered by human activities, while the one laying further afield has been highly modified by human settlements. The avian community was quantified using the mapping method. Counts were conducted in two wet seasons in 2013/14 and 2015/16. The rainfall was higher in the 2013/14 (428 mm) than the 2014/15 (262 mm) rainy season. In both seasons, 113 bird species were recorded. However, in particular, 91 species were recorded in 2013/14 and 101 in 2015/16. The Sorensen Index of Similarity between those two seasons was I = 0.89. Also, the proportion of dominant species was similar in both seasons, and the group was composed of the Dark-capped Bulbul, Red-eyed Dove, Laughing Dove, Blue Waxbill, and Grey-headed Sparrow. The Community Dominance was identical in both seasons when compared. Also, the diversity indices were very similar in both seasons. Also, all three diversity indices were almost identical in both seasons. The overall density was only slightly higher in 2015/16 than in 2013/14. The proportions of particular nesting, feeding, habitat, and residency guilds were very similar in both seasons when compared. The overall density was slightly higher in 2015/16 than in 2013/14, but the difference was not statistically significant. Also, for any particular bird species, the differences in population density between the two seasons were not statistically significant. Several bird species showed, however, statistically significant differences in their population densities between the natural and transformed portions of the riparian forest. The avian assemblage is probably stable over the years in regard to the number of breeding species and their densities, irrespective of year-to-year differences in rainfall, as water is not a limiting factor in this habitat. Bird species classified as forest specialists appear to be negatively affected by habitat transformation, while generalists (ecotone species) probably benefit from this transformation.

1. Introduction

Avian community ecology is the study of avian species’ assemblages, especially their structure and distribution in ecosystems. The structures of avian communities are shaped by vegetation structure (e.g., dominant tree species and their average age), the abundance and availability of food resources, seasonality, nest predation, competition, diseases, and human disturbance [1,2]. The species which assemble to make up a community are, therefore, governed by a multitude of environmental and internal influences, and the crucial role of community ecology is to discern and explain the patterns arising from these influences [3].
One of these influences is seasonality. It has a tremendous impact on avian communities in polar and temperate regions of the world, where seasonal fluctuations in temperature greatly influence primary production, and this, in turn, influences food resources. These are abundant in summer, but scarce or non-existent in winter. In the tropical regions of the world, seasonal variations in temperature do not play such an important role. Instead, rainfall may greatly affect both the community structure and its special distribution. In the tropical regions of the world, environmental seasonality is caused by precipitation seasonality. In the wet season, precipitation is relatively high, while in the dry season, it is very low. This type of regular variation in rainfall does not markedly affect avian communities, as many food resources (e.g., seeds, fruits, and herbs) remain available throughout the year, so only a few species (so-called intra-African migrants) vacate their habitats in the dry season and re-occupy them in the wet season. However, in addition to these regular rainfall variations, there are also less predictable year-to-year variations in precipitation. These are characteristic for drier parts of subtropical regions, in biomes such as grasslands and savannas. These year-to-year variations in rainfall may greatly affect primary productivity, and this, in turn, may influence avian communities, their species diversity, dominance structure, and the population densities of particular species making up the community.
Among the different biomes in southern Africa, tropical riparian forests appear to be especially rich in terms of biodiversity. Characteristic for these forests is that about 30% of upper canopy tree species lose their leaves during the dry season, and their new leaves emerge about one month before the rainy season [4]. In southern Africa, tropical riparian forests [4] lay in Zambezi, Limpopo, Okavango, and other river valleys.
Unfortunately, little is known about the avian communities occupying African riparian forests. Their structure has been investigated in Tamarix vegetation in Karoo, South Africa [5]; acacia savanna in Eswatini [6,7]; and acacia savanna along the Vaal River in South Africa [8]. This showed the high bird species diversity and relatively high population densities of some species in this biome. Population density estimates were based on the line-transect method, which can only enable the calculation of relative population density or linear population densities. Accurate population density estimates for the bird species composing these communities are, therefore, lacking for this, as well as for many other African biomes [9,10]. Apparently, no data are available on the year-to-year variations (linked to differential rainfall) in the structures of avian assemblages, their species diversity, and their dominance and population densities in African riparian forests.
In other parts of the world, birds associated with tropical riparian forests are also understudied. The species diversity and community structure of birds was studied along the Paraiba do Sul River in Atlantic Forests, Sao Paulo State, Brazil [11]; in Alta Foresta, Mato Grosso, Brazil [12]; gallery forests in Costa Rica [13]; rainforests in New Guinea [14]; monsoonal forests in Hong Kong [15]; oil palm—forest mosaic in Malaysia [2,16]; savannas in Australia [17]; and forests in southwestern Australia [18]. In all these studies, the species diversity and community structure of birds were studied by the means of the point count method, supplemented sometimes by mist-netting [2,13]. These methods are, however, not suitable for estimating population densities. They may only provide indices of relative abundance [19].
The purpose of this study was to determine the structure of an avian community in an urbanized riparian forest, i.e., (1) species diversity, (2) dominance structure, (3) the population densities of the particular species making up the community, (4) the effect of differential rainfall on these parameters, and (5) human impact (habitat transformation) on the distributions and population densities of particular species. It should be emphasized that an accurate assessment of the population densities of particular bird species was the prime goal, while all the other goals, based on the primary one, were of secondary importance in this study.

2. Study Area

The study was conducted in the town Katima Mulilo (17°30′ S, 24°16′ E), Zambezi Region, Namibia. The study plot, 54 ha in surface area, was located on the right bank of the Zambezi River (Figure 1).
Before 1935, the study area consisted exclusively of pristine riparian forest. In 1935, a small regional office (the only brick-and-mortar building in the town) was founded in the center of this area. Until about 1970, only few other small alternations were made. More buildings were erected after the town became a South African Defense Force regional headquarter. The expansion of built-up area has continued until present. The population of the whole town increased from 575 in 1965, 5000 in 1978, 28,362 in 2011, and c. 32,000 in 2015.
The natural vegetation, which has now been modified by human settlements, comprises the urbanized Zambezi Riparian Forest [4]. It is dominated by the following tree species: African Teak Pterocarpus angolensis, Apple Leaves Lonchocarpus nelsii, Burkea Burkea africana, Combretum Combretum spp., Camel-thorn Acacia erioloba, Figs Ficus spp., Jackal Berry Diospyros mespiliformis, Knob-tree Acacia nigrensens, Mopane Colophospermum mopane, and Pod Mahogany Afzalia quanzensis. The natural vegetation is now altered with exotic trees and shrubs. The most common is the mango Mangifera indica. Other species include the banana Musa paradisiaca, papaya Carica papaya, and gum trees Eucalyptus spp. The northern part is more densely covered by trees (c. 80% of the surface is covered with tree crowns) than the southern part (c. 50% of the coverage). However, much higher is the contribution of tall trees in the southern compared to the northern part (Figure 1C). In the northern part, on the other hand, the undergrowth vegetation is much denser and more varied.
In 2015, about 47% of this area (southern part) was loosely built-up, with numerous indigenous and exotic trees growing around most buildings and sparse undergrowth. Unchanged dense natural vegetation occupied c. 10% in this part. The remaining (northern part) 43% of the study area, closer to the river bank, was covered both with relatively dense and unchanged vegetation and altered (mixed) vegetation with sparse undergrowth. There are 78 buildings in the southern part, whereas, in the northern part, there are only 23 buildings. Most buildings in the northern part are also much smaller than those in the southern part, and all are private, one-storied residential houses. In the southern part, beside the private residential houses, there are also some government buildings (a regional office, two larger police stations, and a few other minor offices), a church, soccer field, swimming pool, school, and crèche. There are, however, no shops or public services (Figure 2).
There are only unpaved roads and paths in the northern part, and the traffic is almost non-existent. In the southern part, there are paved roads with low traffic. None are, however, transient, except for the most northern one, which constitutes the border of the study area.
The northern side of the study area borders the Zambezi River, and the southern the town proper. The western and eastern sides border a similar urbanized riparian forest.
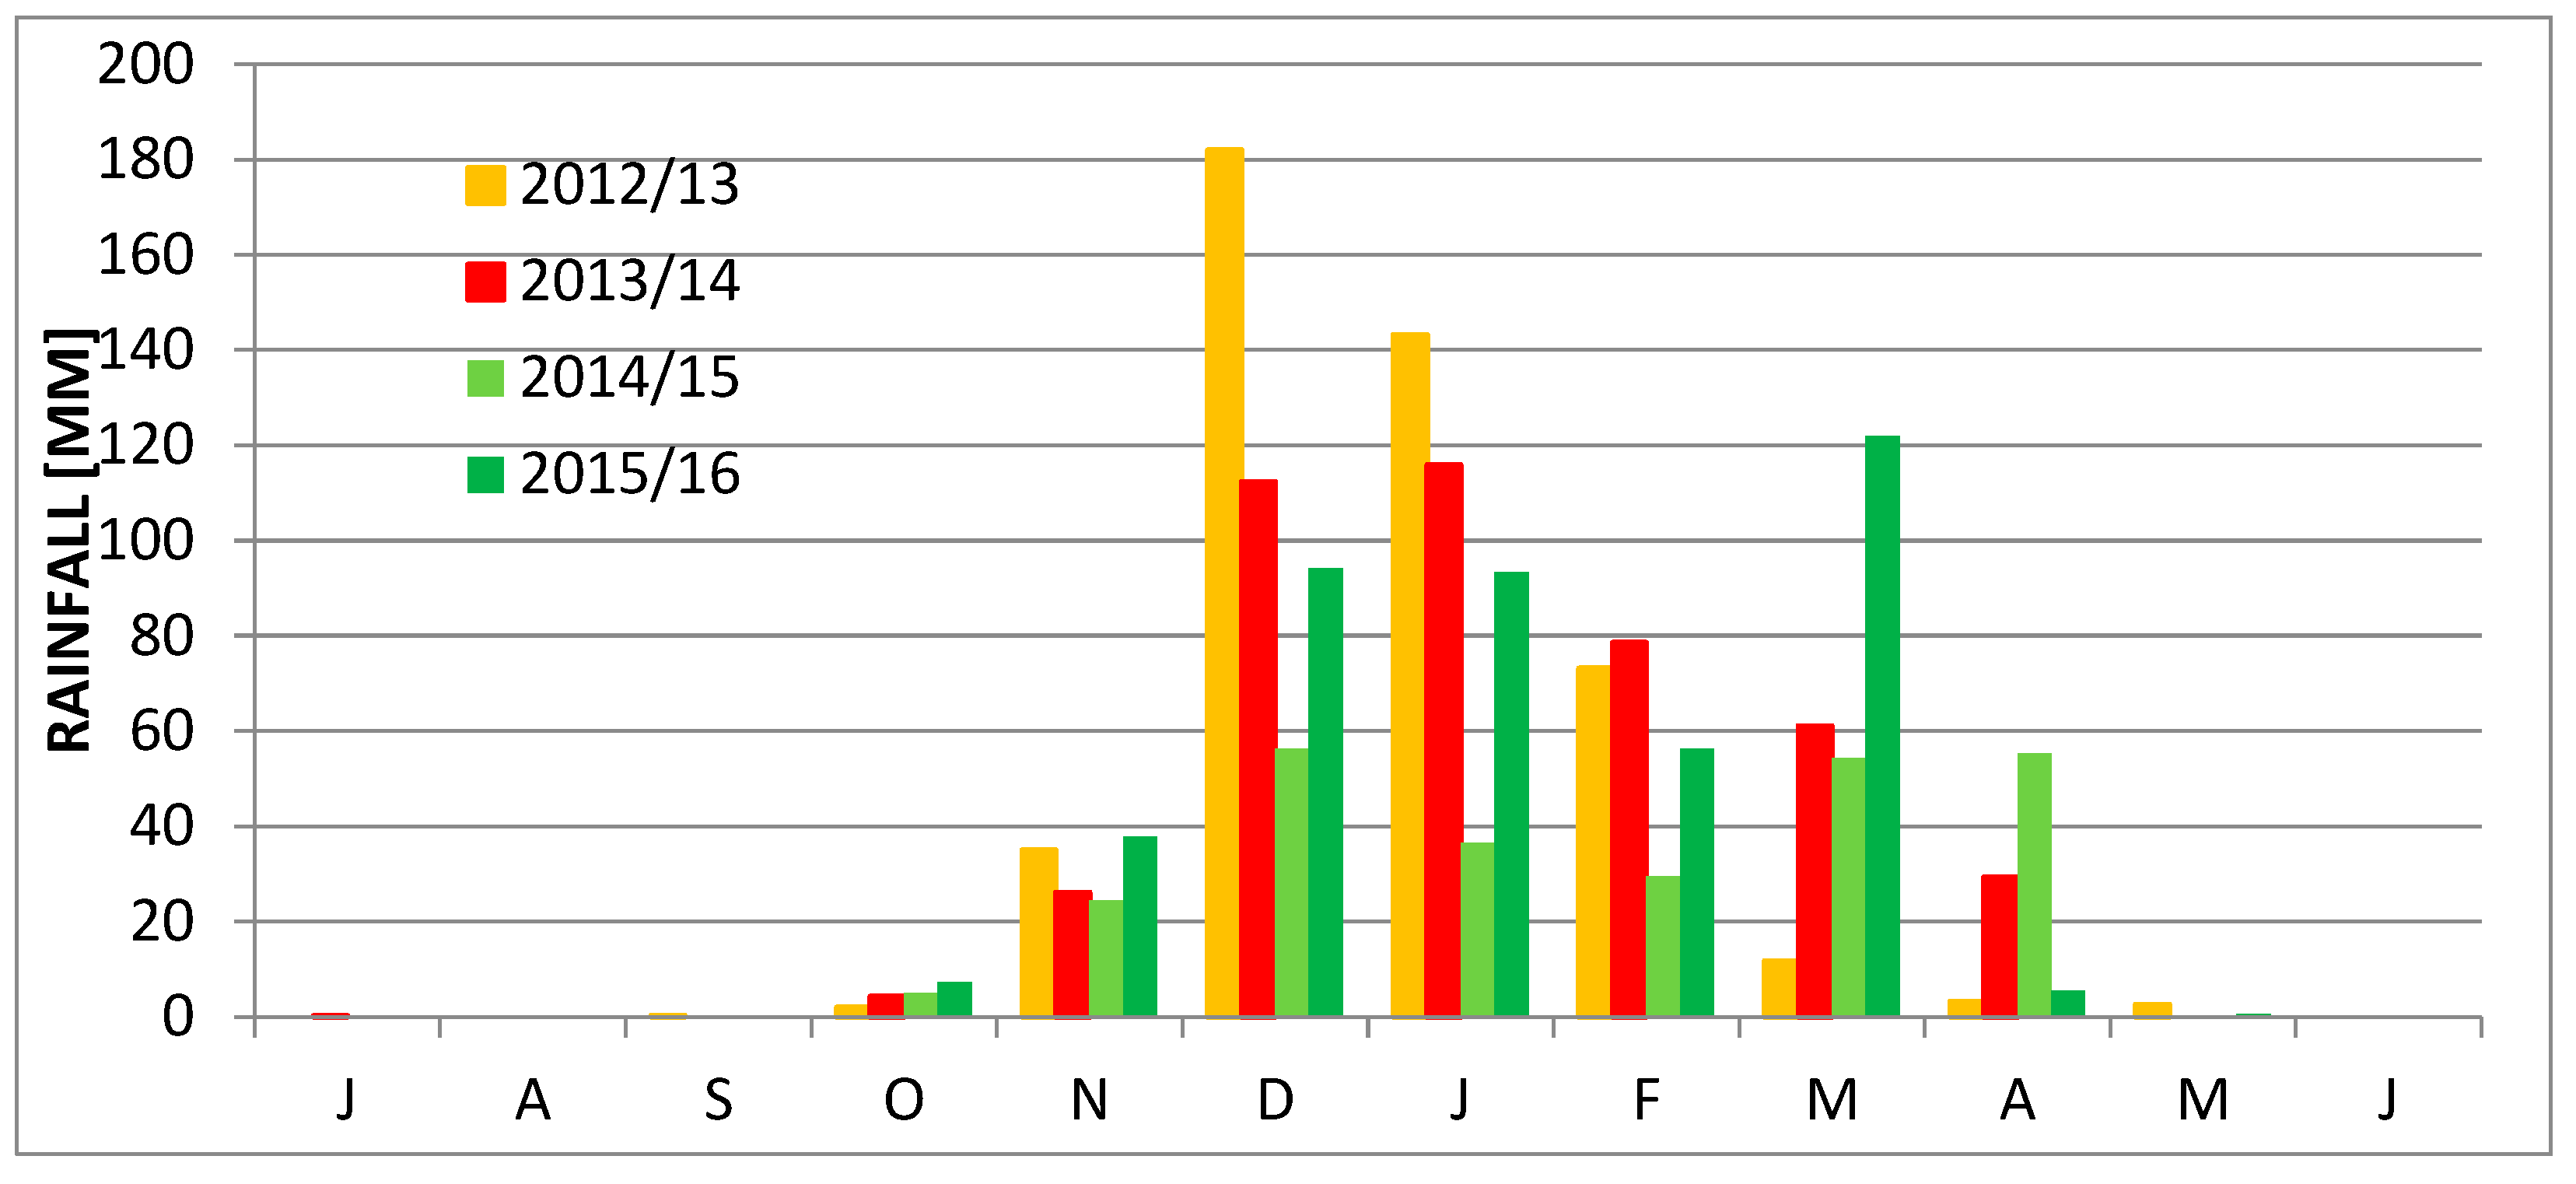
The mean annual temperature for Katima Mulilo is 21 °C. The mean maximum temperature during the hottest month (September) is 35 °C; the mean minimum temperature during the coldest month (July) is 3 °C. In the most humid month (February,) the humidity is 80–90%, and this is only 10–20% in the least humid month (September). The mean annual rainfall is 654 mm, the highest in Namibia. The median annual rainfall is 550–600 mm. Most of the rains fall between November and March [4]. Figure 3 shows the monthly rainfall in Katima Mulilo during the years of 2012–2016. The rainfall was higher in 2012/13 (453.2 mm), 2013/14 (428 mm), and 2015/16 (416.9 mm) than in the 2014/15 (262 mm) rainy season.

3. Methods

The mapping method was employed [19,20]. Birds were counted along roads and paths, arranged in such a way as to cover the whole study area. Each survey, during which the whole study area (54 ha) was covered, was conducted in the morning (between 5–6h00 and 9–10h00) under calm and cloudless weather. Observations were aided with binoculars 10 × 50.
Surveys were conducted in 2013/14 on: 7, 14, and 29 September, 5 and 20 October, 7 November, 7 December, 15 and 28 February, and 25 March; and in 2015/16 on: 22 and 28 July, 6, 15, and 21 September 7, 10, and 24 October, 23 January, and 14 February. As shown in Figure 2, the dry season lasts from May to October, whereas the rainy season from November to April. The breeding season extends from August to March for most species.
Birds were counted while walking slowly along all streets and paths. All records of birds showing breeding (e.g., transporting nesting material, constructing nests, and feeding chicks, etc.) or territorial (e.g., singing males) behavior were plotted directly (without GPS) on a map 1: 1000 in the form of symbols. Special attention was paid to simultaneously singing males, as they were important in determining the number of occupied territories [19,20]. Attention was also paid to not counting the same birds twice, as this could overestimate the number of territories. Maps showing the distribution of these territories were generated in Power Point.
At least two records of an individual showing territorial or breeding behavior at the same site were interpreted as an occupied territory [19,20]. Each occupied territory was treated as one breeding pair. Such a simplistic approach could, however, underestimate the number of breeding females of some polygamous species, specifically the Southern Masked Weaver Ploceus velatus or the co-operatively breeding Red-faced Mousebirds Urocolis indicus. In the case of the Green Wood Hoopoe Phoeniculus purpureus and Arrow-marked Babbler Turdoides jardineii, the number of breeding pairs was equal to a breeding unit consisting of the actually breeding pair and all the helpers of this pair (co-operatively breeding species), while in the case of polygynous species, the number of females was taken to estimate the population density.
Dominance is expressed as the percentage of the total number of pairs of a given species in relation to the total number of all the pairs of all the species recorded. Dominant species is defined as that comprising 5% or more of all the individuals of all the species recorded, while subdominant is that comprising 2–4.99%.
The following guilds were distinguished:
  • Diet: G—granivorous, I—insectivorous, F—frugivorous, N—nectarivorous, and R—carnivorous.
  • Nesting: T—in trees or shrubs, H—in holes, B—in/on buildings, and V—herbaceous vegetation.
  • Habitat: F—forest interior, E—ecotone (forest/open area), and O—‘open’ area (grassland/savanna).
  • Residency: R—resident throughout the year, A—intra-African migrant, and C—nomad.
The following indices were used to characterize the diversity and evenness of the communities:
(1) Shannon’s diversity index: H’ = −∑ pi ln pi
  • where: pi is the proportion of breeding pairs belonging to the ith species
(2) Simpson’s diversity index: D = ((∑n(n − 1))/N(N − 1)
  • where: n—the total number of breeding pairs belonging to a given species and N—the total number of breeding pairs of all species
(3) Pielou’s evenness index: J’ = (−∑ pi ln pi)/ln S,
  • where: pi is the proportion of breeding pairs belonging to the ith species and S is the total number of species. J’ varies between 0 and 1. The less variation between species in a community, the higher J’ is.
Two other indices were used to compare communities:
(1) Community dominance index: DI = (n1 + n2)/N
  • where: n1, n2—number of pairs of the two most abundant species and N—the total number of pairs of all species.
(2) Sörensen’s Coefficient: I = 2C/A + B
  • where: A—the number of bird species in one breeding season, B—the number of bird species in another breeding season, and C—the number of bird species common to both breeding seasons.
The ch2-test was used to test differences in the population densities between 2013/14 and 2015/16. For statistical testing, only those species with at least 10 breeding pairs in both seasons were included (expected value > 5).
The systematics and nomenclature of bird species follow [10].

4. Results

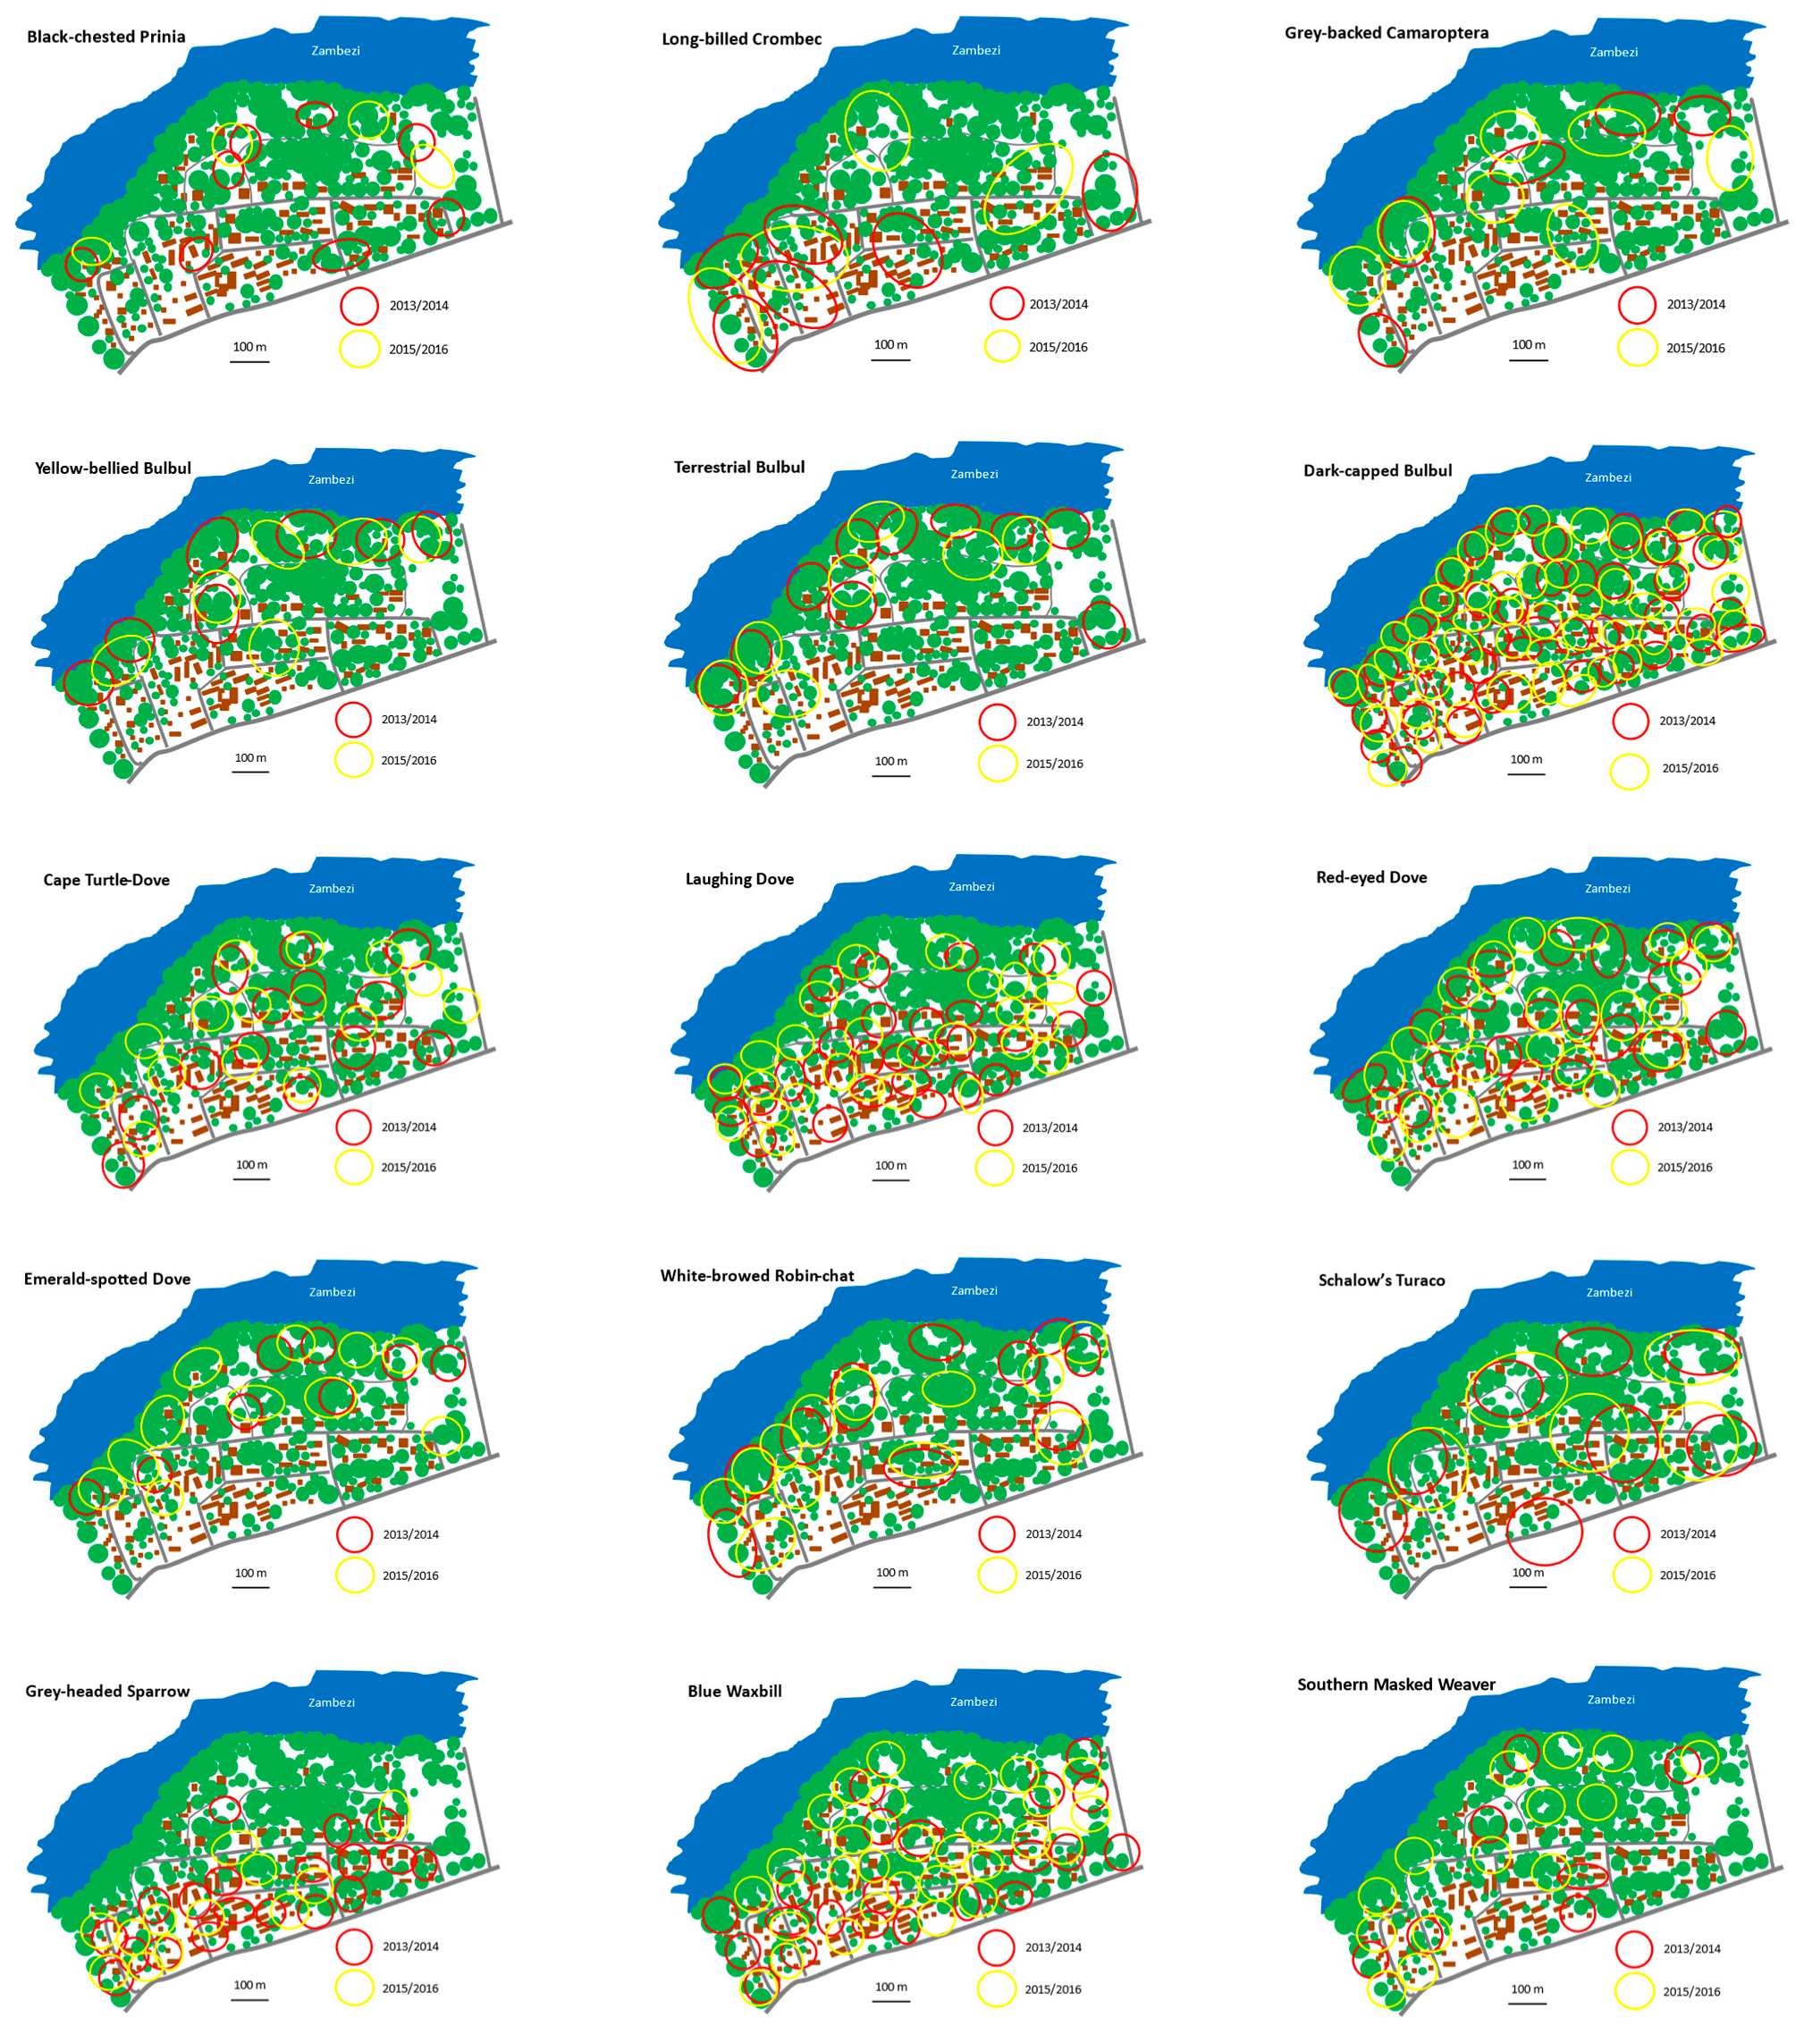
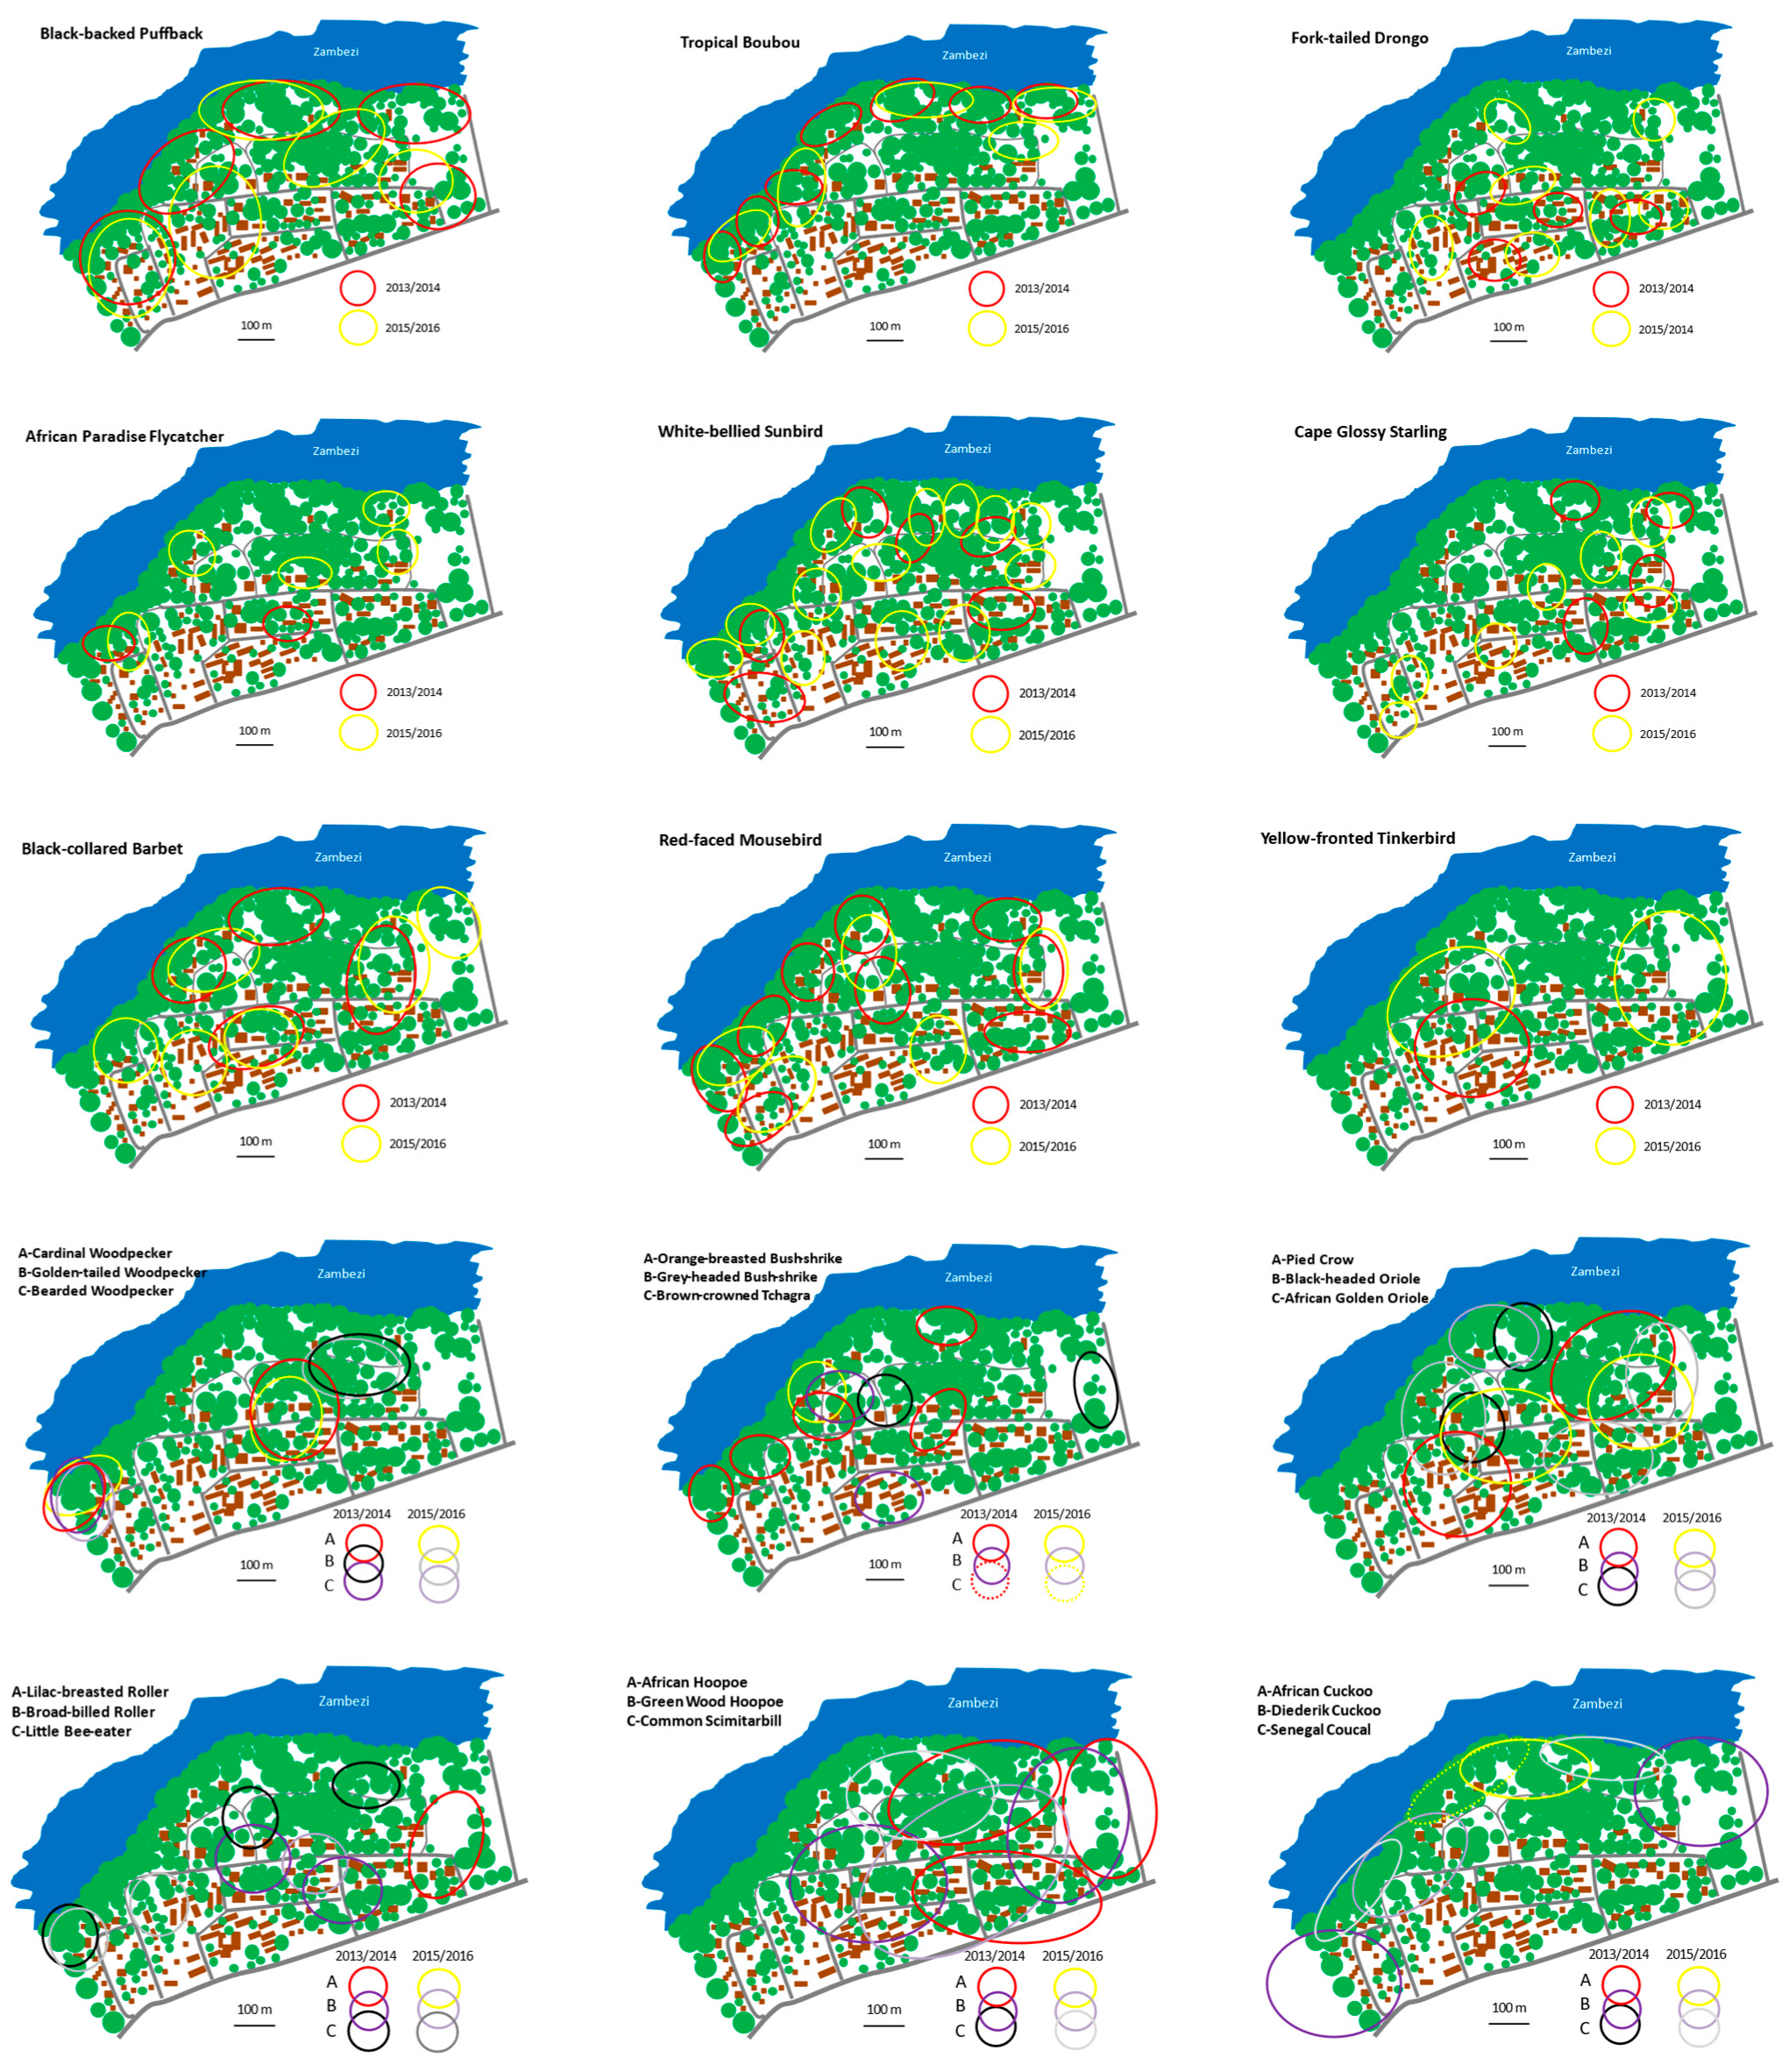
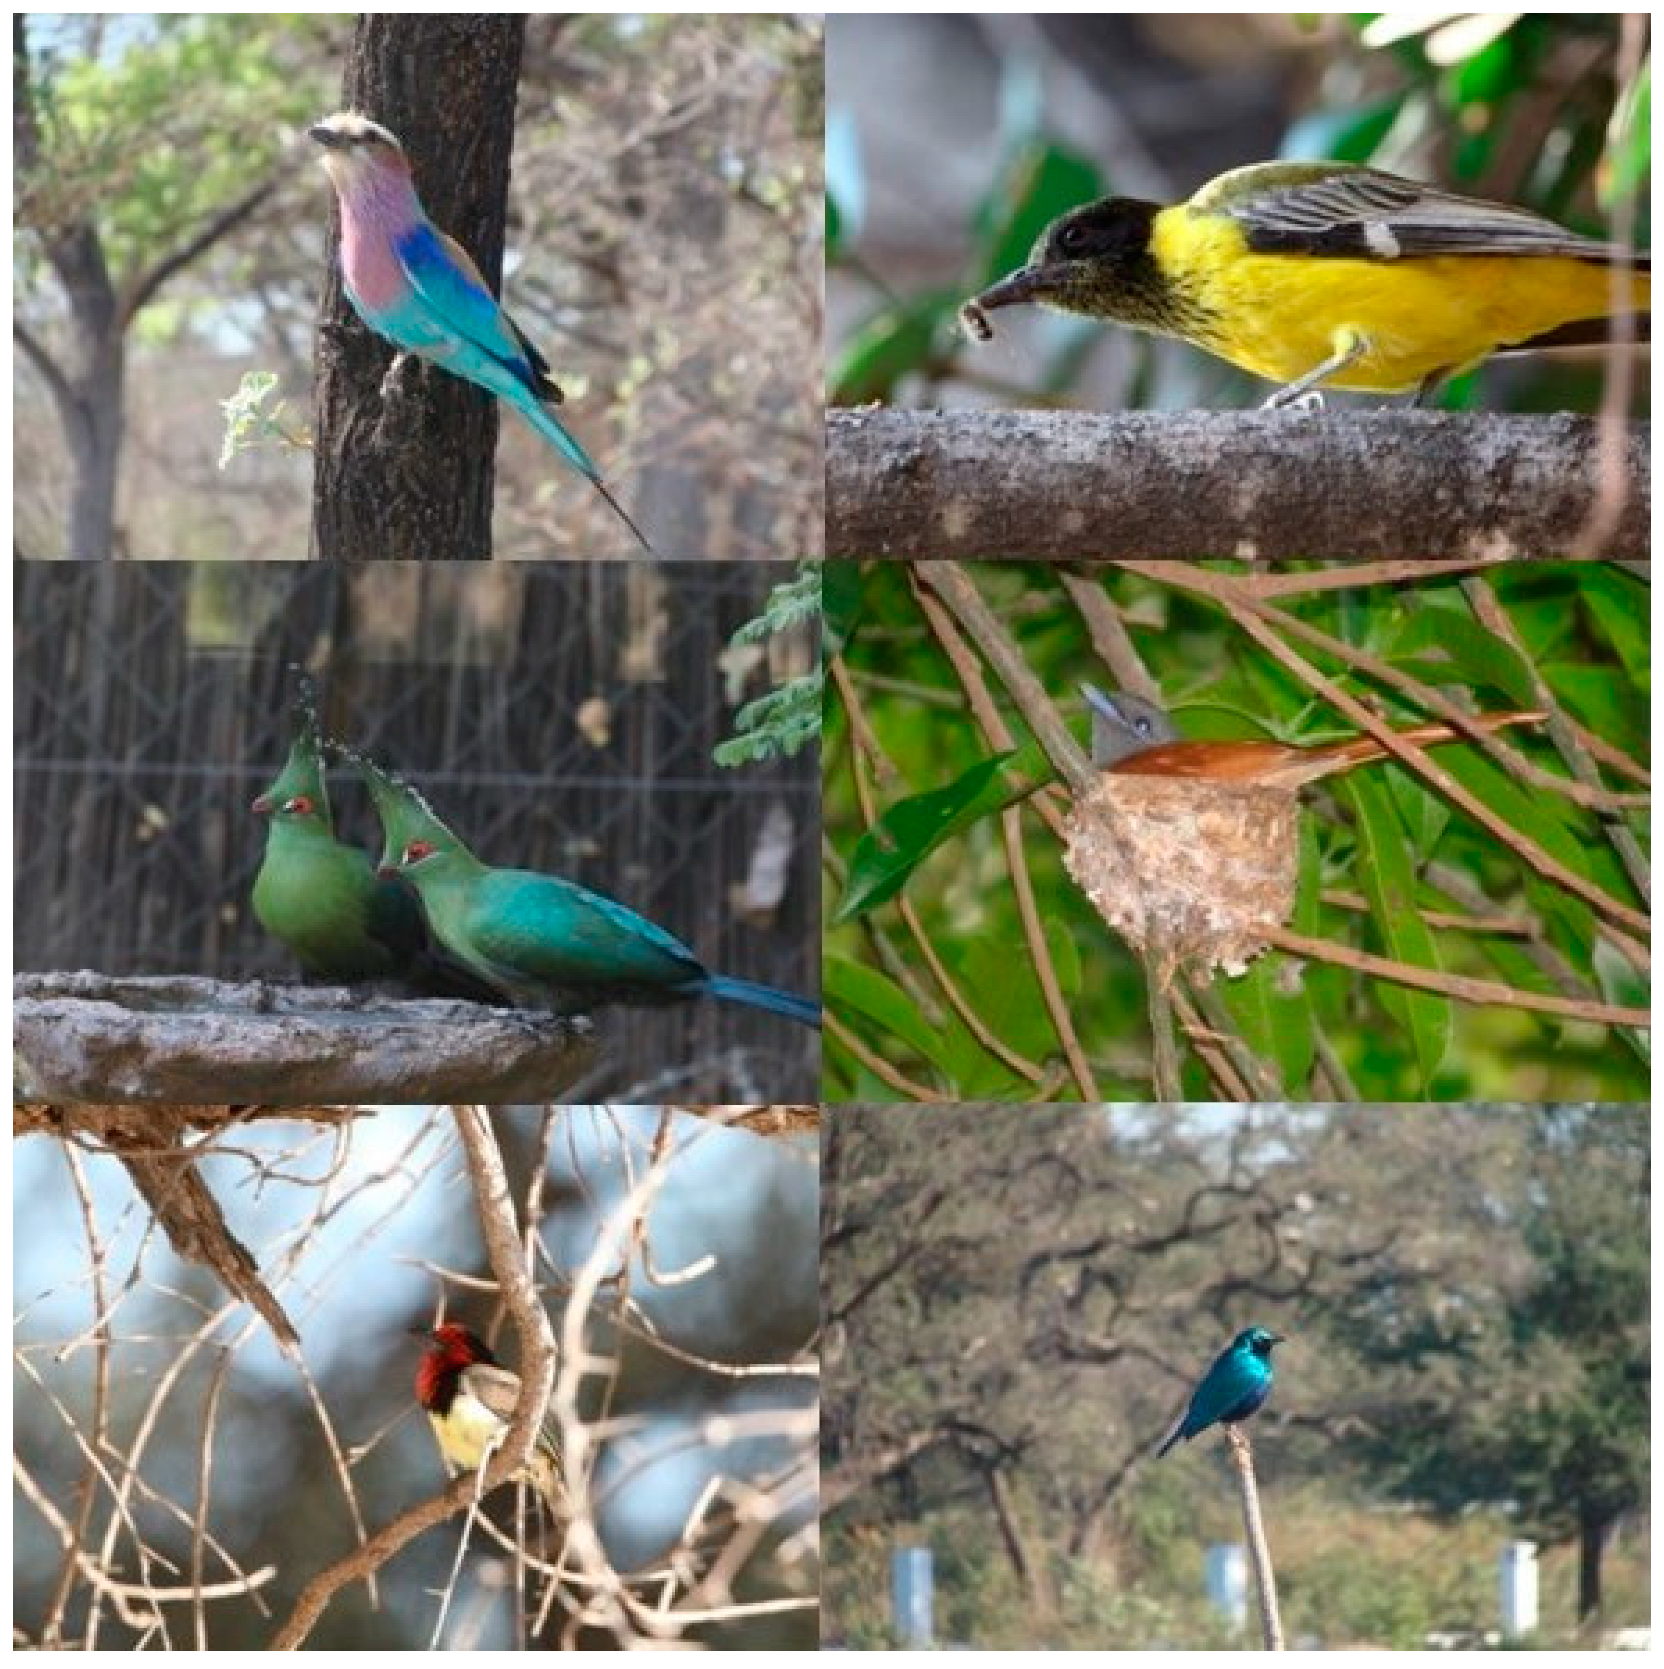
In both seasons, 113 bird species were recorded as breeding residents in the study plot (Appendix A, Figure 4 and Figure 5). However, in particular, 91 species were recorded in 2013/14 and 101 species in 2015/16 (Table 1). The Sörensen Index of Similarity was high (I = 0.89). Also, the proportion of dominant species was similar in both years, and the group was composed of the Dark-capped Bulbul Pycnonotus tricolor, Red-eyed Dove Streptopelia semitorquata, Laughing Dove Streptopelia senegalensis, Blue Waxbill Uraeginthus angolensis, and Southern Grey-headed Sparrow Passer diffusus. In both seasons, six species were subdominants, but only Cape Turtle-Dove Streptopelia capicola, Emerald-spotted Dove Turtur chalcospilos, and White-browed Robin-chat Cossypha heuglini were subdominants in both seasons. The Schalow’s Turaco Tauraco schalowi, Terrestrial Bulbul Phyllastrephus terrestris, Black-chested Prinia Prinia flavicans, and Red-faced Mousebird Urocolius indicus were subdominants only in 2013/14, while the White-bellied Sunbird Cinnyris talatala, Southern Grey-headed Sparrow, and Southern Masked Weaver were subdominants only in 2015/16. The Community Dominance was almost identical in both seasons when compared. Also, all three diversity indices were almost identical in both seasons (Table 1).
Relatively numerous were also species such as the Schalow’s Turaco, Grey-backed Camaroptera Camaroptera brevicaudata, Yellow-bellied Bulbul Chlorocichla flaviventris, Orange-breasted Bushshrike Chlorophoneus sulphureopectus, Black-backed Puffback Dryoscopus cubla, Tropical Boubou Laniarius major, Cape Glossy Starling Lamprotornis nitens, Black-collared Barbet Lybius torquatus, and Southern Brown-throated Weaver Ploceus xanthopterus (Figure 4).
Close to the study area, the following other breeding resident species were recorded: the Red-billed Francolin Francolinus adspersus, Crested Francolin Dendroperdix sephaena, Water Thick-knee Burhinus vermiculatus, Rock Pratincole Glareola nuchalis, Klass’s Cuckoo Chrysococcyx klaas, African Emerald Cuckoo Chrysococcyx cupreus, Greater Striped Swallow Hirundo cucculata, Lesser Striped Swallow Hirundo abyssinica, African Scops Owl Otus senegalensis, African Barred Owlet Glaucidium capense, Southern Carmine Bee-eater Merops nubicoides, White-fronted Bee-eater Merops bullockoides, Hartlaub’s Babbler Turdoides hartlaubii, Greater Blue-eared Starling Lamprotornis chalybaeus, Southern Red Bishop Euplectes orix, Fan-tailed Widowbird Euplectes axillaris, Cut-throat Finch Amedina fasciata, Violet-eared Waxbill Granatina granatina, Pin-tailed Whydah Vidua mactoura, Long-tailed Paradise Whydah Vidua paradisaea, and Shaft-tailed Whydah Vidua regia.
In the group of more numerous species, the following were recorded in both seasons as more numerous in the more natural than more transformed urbanized riparian forest (Figure 4): the Yellow-bellied Bulbul (13 vs. 1 pair; x2 = 23.1, p > 0.01), Terrestrial Bulbul (15 vs. 2; x2 = 26.1, p > 0.01), Red-eyed Dove (26 vs. 17; x2 = 11.1, p > 0.01), Emerald-spotted Dove (16 vs. 3; x2 = 25.6, p > 0.01), White-browed Robin-chat (14 vs. 7; x2 = 7.3, p > 0.01), Grey-backed Camaroptera (9 vs. 3; x2 = 6.0, p > 0.05), Tropical Boubou (12 vs. 0; x2 = 24.0; p > 0.01), and White-bellied Sunbird (14 vs. 5; x2 = 12.3, p > 0.01). On the other hand, there were only three species more numerous in the modified than natural parts of the urbanized riparian forest, viz. the Southern Grey-headed Sparrow (4 vs. 27; x2 = 74.7, p > 0.01), Blue Waxbill (19 vs. 31; x2 = 19.4, p > 0.01), and Laughing Dove (21 vs. 35; x2 = 26.3, p > 0.01). There were also a number of species which showed no preference for these two forest stages, viz. the Black-backed Puffback (5 vs. 5; x2 = 0, p < 0.01), Dark-capped Bulbul (47 vs. 45; x2 = 0.5, p < 0.01), Cape Turtle-Dove (14 vs. 15; x2 = 0.1, p < 0.01), Schalow’s Turaco (8 vs. 3.5; x2 = 3.4, p < 0.01), Black-collared Barbet (7 vs. 3; x2 = 2.8, p < 0.01), Southern Masked Weaver (11 vs. 10; x2 = 0.1, p < 0.01), Black-chested Prinia (8 vs. 4; x2 = 2.7, p < 0.01), Long-billed Crombec (4 vs. 6; x2 = 0.7, p < 0.01), Red-faced Mousebird (9 vs. 5; x2 = 2.6, p < 0.01), and Cape Glossy Starling (5 vs. 6; x2 = 0.2, p < 0.01).
The overall density was slightly higher in 2015/16 than in 2013/14, but the difference was not statistically significant (x2 = 1.93, p > 0.5). Also, for any particular bird species, the differences in population density between the two seasons were not statistically significant. Granivorous were almost equally as numerous as insectivorous birds, although there were almost three times more insectivorous than granivorous species (Table 2). These two guilds comprised around 2/3 of all the breeding birds. Also, frugivorous species were relatively numerous, but only low proportions of nectarivores and carnivorous birds were recorded (Table 2). Among nesting guilds, more than 70% of all the breeding pairs were tree/shrub nesters (Table 2). More than half of all the birds were classified as living both in forests and open habitats (ecotone); 1/3 of them were classified as forest dwellers; and about 15–20% as savanna/grassland/marshland inhabitants. More than 90% of the birds were resident in the riparian forest throughout the year. The remaining birds, represented by 11 species, were intra-African migrants. There were also few species representing non-breeding Palearctic migrants, viz. the Willow Warbler Phylloscopus trochilus, Spotted Flycatcher Muscicapa striata, Marsh Warbler Acrocephalus palustris, and Red-backed Shrike Lanius collurio. Together, they contributed (in terms of the number of individuals) merely 1–2% of the breeding assemblage. The proportions of particular guilds were similar in both seasons when compared (Table 2).

5. Discussion

A precise estimation of the population densities of birds is a challenging study. One of the most accurate methods employed in such studies, the mapping method, is too time-consuming and works well only with relatively common forest territorial species [19]. In the riparian forests of southern Africa, most bird species fall into this category, which makes the mapping method quite suitable for population density estimations in this habitat. However, some species (e.g., weavers and game fowl) are often polygamous, some may breed co-operatively (e.g., babblers, wood-hoopoes, or Trumpeter Hornbill), and others, like sparrows and Blue Waxbill, display a low level of territorial behavior. For all these species, population estimations may not be accurate enough, even using the mapping method. These species are not really territorial, so their detection in the field, mapping records, and results’ interpretation may pose some problems. Certain caution should be taken, therefore, in interpreting results regarding these species.
The precision of the estimation for these and all other species depends greatly on the number of counts conducted. For some vocal and conspicuous species, even one count may suffice for a precise estimation, provided that the count is conducted during the peak of their vocal activity. In the standard version of the mapping method, 10 such counts are recommended, because all the bird species are counted [19]. Also, in this study, 10 counts were conducted. Even so, some breeding pairs of more elusive and generally silent species, although territorial, still could have passed undetected.
In terms of species diversity, riparian forests are ones of the richest habitats in southern Africa. In this study, 113 species were recorded in the urbanized riparian forest. In the neighboring seasonal forests (Kalahari Woodland in the pristine stage) in the same Zambezi Region, NE Namibia, the number was lower (N = 88) [21]. In the Mopane Woodland, situated in north–central Namibia, the number was 85 [22], while in Kaokoland Savanna, in NW Namibia, it was 64 [23]. Therefore, the drier the biome, the lower the number of species residents (Table 3). In other parts of the world, riparian forests also harbor both rich and distinctive bird assemblages. Refs. [6,7] recorded 128 species in a riparian Acacia savanna in Eswatini; 132 species were recorded in Malaysia [2]; 90 species in Costa Rica [13]; and 88 species in the Atlantic Forest in Brazil [11].
Data on population densities are unavailable for most African species [9,10]; therefore, the population densities of a few species recorded in this study may be compared with those from the literature. For the Black-collared Barbet, a density of 0.9 pairs per 10 ha was recorded in a mixed woodland in Zimbabwe [10], which is similar to that recorded in the urbanized Zambezi riparian forest (0.7 p./10 ha). Fork-tailed Drongo nested at a density of 0.3 p./10 ha in Burkea woodlands, and 0.9 p./10 ha in Acacia woodland in Limpopo Province, South Africa [10], which is also similar to that recorded in the urbanized Zambezi riparian forest (0.7 p./10 ha). The Tropical Boubou nested at a density of 1.7 p./10 ha in a riparian forest in Krüger National Park, South Africa, which is similar to that in the urbanized Zambezi riparian forest (1.3 p./10 ha). The Terrestrial Bulbul reached a density of 1.7 p./10 ha in Knysna Forest, Eastern Cape, South Africa; it was higher in the urbanized Zambezi riparian forest (1.9 p./10 ha). However, the population densities of a few other bird species breeding in the urbanized Zambezi riparian forest were much higher than elsewhere. The Dark-capped Bulbul reached a density of 1.4 p./10 ha in suburban gardens in Eastern Cape, South Africa, and merely 1 p./10 ha in a mixed Brachystegia woodland in Zimbabwe [10]. In the urbanized Zambezi riparian forest, it nested in a density of 8 p./10 ha (this study). The Black-backed Puffback nested at density of 0.2 p./10 ha in a broad-leaved woodland in Limpopo Province, South Africa; in the urbanized Zambezi riparian forest, the density was 0.9 p./10 ha.
Species recorded in both seasons as being more numerous in the more natural than the more transformed urbanized Zambezi riparian forest, i.e., the Yellow-bellied Bulbul, Terrestrial Bulbul, Red-eyed Dove, Emerald-spotted Dove, White-browed Robin-chat, Grey-backed Camaroptera, Tropical Boubou, and White-bellied Sunbird (Figure 4), can be regarded as forest interior specialists and species prone to forest degradation. Species more numerous in the modified than natural parts of the urbanized Zambezi riparian forest, viz. the Southern Grey-headed Sparrow, Blue Waxbill, and Laughing Dove (Figure 4), can be regarded as forest avoiders. Species which showed no preference for those two forest statuses, viz. the Black-backed Puffback, Dark-capped Bulbul, Cape Turtle-Dove, Schalow’s Turaco, Black-collared Barbet, Southern Masked Weaver, Black-chested Prinia, Long-billed Crombec, Red-faced Mousebird, and Cape Glossy Starling, can be classified as ecotone species, living on the edges of forests and open habitats. They may benefit from the transformation of the urbanized Zambezi riparian forest.
The proportions of the three main feeding guilds, insectivores, granivores, and frugivores, were similar in the riparian forests, although, in terms of the number of species, insectivores comprised almost half of this assemblage. This feature distinguishes this community from others studied so far in southern Africa, where either granivores or insectivores were the dominant guild [24,25,26,27,28]. Even in the neighboring seasonal Kalahari Woodland, insectivores were much more important than other guilds [21]. In the riparian forests of Africa, fruit trees are usually abundant and may benefit frugivorous birds (especially bulbuls), while seeds may not be so abundant, as these are in more open savanna or grassland biomes. Typical granivores, such as doves and sparrows, may, therefore, breed in riparian forests at a lower density than in a neighboring more open habitats dominated by grasses.
In the riparian forests along Paraiba do Sul River in southeastern Brazil, the avian community structure, composed of 88 species, was, however, quite different from that on the Zambezi River (this study), where insectivores comprised 54% of all birds, frugivores 10.3%, granivores 5.7%, and nectarivores 4.6% [11]. In Costa Rica’s riparian forests (90 species), insectivores and granivores each comprised a dozen or so percentages of all birds, while nectarivores comprised c.20%, and omnivores (probably including frugivores) c. 40% [13]. The avian assemblages in riparian forests are, therefore, characterized by a high species diversity, but the structure of these assemblages appears to vary geographically and be distinct regionally.
The avian assemblage is probably stable over the years in regard to the number of breeding species and their densities. The differential rainfall does not affect it in a significant way. The species composition may only slightly differ from year to year. Also, the distribution of breeding pairs was not significantly affected by rainfall. In regard to the more numerous species (at least 10 breeding pairs in both seasons), a statistically significant difference between 2013/14 and 2015/16 was not recorded for any species. The amount of water/rainfall/precipitation is usually the main limiting factor governing both the distribution and population densities of most bird species in Africa [29]. Since water is always available in riparian forests, it is not a limiting factor. The water also does not change over the years and does not have much effect on the interannual differences in primary productivity. As a consequence, it does not affect interannual variations in the abundance of seeds, fruits, or insects, which constitute the main food of most birds breeding in this biome. There was also no shift in species diversity, nor in the community structure caused by the differential rainfall (Figure 2, Appendix A).
Both a high number of species and the high population densities of some species suggest that urbanized riparian forests play an important role as breeding and feeding habitats for birds, especially frugivores and nectarivores. For some forest species, urbanized riparian forests may play a role as corridors or stepping stones that allow for dispersal, migration, and free movements within a mosaic of natural and human modified environments [13]. In this way, corridors may also increase the level of biodiversity. Riparian forest corridors in urbanized environments may be viewed as a main instrument for offsetting the negative effects of habitat loss and fragmentation, such as reductions in population sizes, reductions in immigration rates, changes in community structures, or invasions of alien species [12,30].
For these reasons, urbanized riparian forests require special protection. They are of particular importance in arid environments, as they may play a role of refugia for some bird species during prolonged droughts.

Funding

This research received no external funding.

Institutional Review Board Statement

Not applicable.

Data Availability Statement

No new data were created.

Conflicts of Interest

The author declare no conflict of interest.

Appendix A

Structure of bird community in an urbanized Zambezi riparian forest (54 ha). N—number of breeding pairs, D—density (pairs/100 ha), and %D—dominance. Dominant species are indicated with bold case.
Species2013/142015/16
ND%DND%D
Accipiter badius11.90.3000.0
Accipiter minullus11.90.311.90.2
Accipiter tachiro11.90.311.90.2
Amaurornis flavirostris11.90.311.90.2
Amblyospiza albifrons59.31.447.41.0
Apalis flavida23.70.523.70.5
Apus affinis59.31.459.31.2
Batis molitor23.70.523.70.5
Bostrychia hagedash11.90.31.52.80.4
Bubo africanus11.90.311.90.2
Buphagus erythrorhynchus00.00.00.50.90.1
Butorides striata11.90.311.90.2
Bycanistes bucinator11.90.323.70.5
Camaroptera brevicaudata59.31.47131.7
Campethera abingoni11.90.311.90.2
Centropus senegalensis11.90.323.70.5
Centropus superciliosus11.90.300.00.0
Cercopis abyssinica00.00.047.41.0
Cercopis cucullata00.00.035.60.7
Ceryle rudis11.90.311.90.2
Chalcomitra senegalensis23.70.511.90.2
Chlorocichla flaviventris611.11.67131.7
Chlorophoneus sulfureopectus47.41.135.60.7
Chrysococcyx caprius1.52.80.41.52.80.4
Cinnyricinclus leucogaster47.41.135.60.7
Cinnyris mariquensis35.60.823.70.5
Cinnyris talatala611.11.61324.13.2
Circaetus cinerascens00.00.00.50.90.1
Cisticola cheniana00.00.035.60.7
Coracias caudatus11.90.311.90.2
Corvus albus23.70.523.70.5
Cossypha heuglini1018.52.71222.23.0
Crithagra atrogularis00.00.011.90.2
Cuculus clamosus11.90.300.00.0
Cuculus gularis00.00.011.90.2
Cuculus solitarius0.50.90.10.50.90.1
Cypsiurus parvus00.00.011.90.2
Dendropicos fuscescens2.54.60.723.70.5
Dendropicos namaquus00.00.00.50.90.1
Dicrurus adsimilis47.41.17131.7
Dryoscopus cubla59.31.459.31.2
Emberiza flaviventris11.90.300.00.0
Estrilda astrild000.035.60.7
Eurystomus glaucurus23.70.511.90.2
Falco dickinsoni11.90.300.00.0
Glaucidium perlatum11.90.311.90.2
Halcyon leucocephala23.70.53.56.50.9
Halcyon senegalensis00.00.00.50.90.1
Haliaeetus vocifer0.50.90.10.50.90.1
Hedydipna collaris35.60.835.60.7
Hirundo smithii23.70.535.60.7
Indicator indicator00.00.011.90.2
Ixobrychus minutus11.90.311.90.2
Ixobrychus sturmii00.00.011.90.2
Kaupifalco monogrammicus00.00.00.50.90.1
Lagonosticta nitidula00.00.023.70.5
Lamprotonis australis00.00.011.90.2
Lamprotornis nitens47.41.17131.7
Laniarius bicolor35.60.847.41.0
Laniarius major7131.959.31.2
Logonosticta senegala11.90.311.90.2
Lonchura cucculata23.70.523.70.5
Lybius torquatus47.41.1611.11.5
Malaconotus blanchoti11.90.311.90.2
Megaceryle maxima11.90.311.90.2
Melaniparus cinerascens11.90.300.00.0
Melaniparus niger11.90.311.90.2
Merops pusillus35.60.823.70.5
Micronisus gabar00.00.011.90.2
Microparra capensis00.00.00.50.90.1
Milvus aegyptius1.52.80.41.52.80.4
Motacilla aguimp23.70.523.70.5
Nilaus afer23.70.500.00.0
Oriolus auratus11.90.335.60.7
Oriolus larvatus23.70.511.90.2
Passer diffusus1935.25.21222.23.0
Phoeniculus purpureus23.70.523.70.5
Phyllastrephus terrestris1018.52.77131.7
Ploceus ocularis11.90.300.00.0
Ploceus velatus7131.91425.93.5
Ploceus xanthops35.60.800.00.0
Ploceus xanthopterus23.70.535.60.7
Podica senegalensis0.50.90.20.50.90.1
Pogoniulus chrysoconus23.70.511.90.2
Poicephalus meyeri11.90.311.90.2
Polyboroides typus0.50.90.10.50.90.1
Prinia flavicans814.82.247.41.0
Prionops retzii1?1.90.300.00.0
Pycnonotis tricolor4379.611.84990.712.2
Rhinopomastus cyanomelas00.00.00.50.90.1
Scopus umbretta11.90.311.90.2
Streptopelia capicola1324.13.61527.83.7
Streptopelia decipiens35.60.823.70.5
Streptopelia semitorquata20375.52342.65.7
Streptopelia senegalensis2648.17.12648.16.5
Strix woodfordii0.50.90.10.50.90.1
Sylvietta rufescens611.11.647.41.0
Tauraco schalowi7.513.92.159.31.2
Tchagra australis35.60.811.90.2
Terpsiphone viridis35.60.859.31.2
Trachyphonus vaillantii00.00.011.90.2
Treron calvus23.70.511.90.2
Turdoides jardineii11.90.335.60.7
Turdus libonyana11.90.311.90.2
Turtur afer00.00.01?1.90.0
Turtur chalcospilos814.82.21120.42.7
Tyto alba11.90.311.90.2
Upupa africana23.70.523.70.5
Uraeginthus angolensis2138.95.82953.77.2
Urocolius indicus916.72.559.31.2
Vanellus albiceps00023.70.5
Vidua chalybeata23.70.500.00.0
Zosterops senegalensis23.70.523.70.5
Total364.5678.699.9403750.2100.0

References

  1. Nsor, C.A.; Acquah, E.; Mensah, G.; Kusi-Kyei, V.; Boadi, S. Avian community structure as a function of season, habitat type, and disturbance, in Mole National Park, Northern Region (Ghana). Int. J. Ecol. 2018, 2018, 2045629. [Google Scholar] [CrossRef]
  2. Azman, N.M.; Latip, N.S.A.; Sah, S.A.M.; Akil, M.A.M.M.; Shafie, N.J.; Khairuddin, N.L. Avian diversity and feeding guilds in a secondary forest, an oil palm plantation and a paddy field in riparian areas of the Keran River Basin, Perak, Malaysia. Trop. Life Sci. Res. 2011, 22, 45–64. [Google Scholar] [PubMed]
  3. Begon, M.; Townsend, C.R.; Harper, J.L. Ecology. From Individuals to Ecosystems, 4th ed.; Blackwell Publishing: Hoboken, NJ, USA, 2006. [Google Scholar]
  4. Mendelsohn, J.; Jarvis, A.; Roberts, C.; Robertson, T. Atlas of Namibia. A Portrait of the Land and Its People; Sunbird Publishers: Cape Town, South Africa, 2009. [Google Scholar]
  5. Brooke, R.K. The bird community of Tamarix-clad drainages, northwestern Karoo, Cape Province. Ostrich 1992, 63, 42–43. [Google Scholar]
  6. Monadjem, A. Population Densities and Community Structure of Birds in Riverine Forest in the Lowveld of Swaziland. Ostrich 2003, 74, 173–180. [Google Scholar] [CrossRef]
  7. Monadjem, A. Associations between Avian Communities and Vegetation Structure in a Low-lying Woodland-savanna Ecosystem in Swaziland. Ostrich 2005, 76, 45–55. [Google Scholar] [CrossRef]
  8. Seymour, C.L.; Simmons, R.E. Can severely fragmented patches of riparian vegetation still be important for arid-land bird diversity. J. Arid. Environ. 2008, 72, 2275–2281. [Google Scholar] [CrossRef]
  9. Fry, C.H.; Stuart, K.; Urban, E. The Birds of Africa; Academic Press: Cambridge, MA, USA, 2004; Volumes 1–7. [Google Scholar]
  10. Hockey, P.A.R.; Dean, W.R.J.; Ryan, P.G.; Maree, S. (Eds.) Roberts’ Birds of Southern Africa; John Voelcker Bird Book Fund: Cape Town, South Africa, 2005. [Google Scholar]
  11. Laurenco, A.C.P.; Toledo, M.C.B. Effects of proximity to urban areas on a riparian bird community in remnant Atlantic Forest in southeastern Brazil. Rev. Ambient. Agua 2019, 7, 1018. [Google Scholar]
  12. Lee, A.C.; Peres, C.A. Conservation value of remnant riparian forest corridors of varying quality for Amazonian birds and mammals. Conserv. Biol. 2007, 22, 439–449. [Google Scholar]
  13. Seaman, B.C.; Schulze, C.H. The importance of gallery forests in the tropical lowlands of Costa Rica for understory forest birds. Biol. Conserv. 2010, 143, 391–398. [Google Scholar] [CrossRef]
  14. Korei, K.; Rigert, J.; Kigl, M.; Novotny, V. Differences in bird community structure between riparian and upland zones in a New Guinea rainforest. Aust. Field Ornithol. 2023, 40, 179–195. [Google Scholar]
  15. Chan, E.K.W.; Yat-Tung, Y.; Zhang, Y.; Dudgeon, D. Distribution patterns of birds and insect prey in a tropical riparian forest. Biotropica 2008, 40, 623–629. [Google Scholar] [CrossRef]
  16. Mitchell, S.L.; Edwards, D.P.; Bernard, H.; Coomes, D.; Jucker, T.; Davies, Z.G.; Struebig, M.J. Riparian reserves help protect forest bird communities in oil pal dominated landscapes. J. Appl. Ecol. 2018, 55, 2744–2755. [Google Scholar] [CrossRef]
  17. Woinarski, J.C.Z.; Brock, C.; Armstrong, M.; Hempel, C.; Cheal, D.; Brennan, K. Bird distribution in riparian vegetation in the extensive natural landscape of Australian’s tropical savanna: A broad-scale survey and analysis of a distributional base. J. Biogeogr. 2000, 27, 843–868. [Google Scholar] [CrossRef]
  18. Palmer, G.C.; Bennett, A.F. Riparian zones provide for distinct bird assemblages in forest mosaics of South-East Australia. Biol. Conserv. 2006, 130, 447–457. [Google Scholar] [CrossRef]
  19. Bibby, C.J.; Burgess, N.D.; Hill, D.A.; Mustoe, S. Bird Census Techniques, 2nd ed.; Academic Press: London, UK, 2012. [Google Scholar]
  20. Sutherland, W.J. Ecological Census Techniques: A Handbook; Cambridge University Press: Cambridge, UK, 1996. [Google Scholar]
  21. Kopij, G. Birds of Katima Mulilo town, Zambezi Region, Namibia. Int. Sci. Technol. J. Namib. 2016, 7, 85–102. [Google Scholar]
  22. Kopij, G. Avian Assemblages in Natural and Modified Kaokoland (Mopane) Savanna in the Cuvelai Drainage System, North-central Namibia. Lanioturdus 2013, 46, 22–33. [Google Scholar]
  23. Kopij, G. Avian diversity in an urbanized South African grassland. Zool. Ecol. 2015, 25, 87–100. [Google Scholar] [CrossRef]
  24. Kopij, G. The Structure of Assemblages and Dietary Relationships in Birds in South African Grasslands; Wydawnictwo Akademii Rolniczej We Wrocławiu: Wrocław, Poland, 2006. [Google Scholar]
  25. Kopij, G. Seasonal Changes in Avian Assemblages in Kaokoland (Mopane) Savanna in the Ogongo Game Reserve, North-central Namibia. Int. Sci. Technol. J. Namib. 2013, 2, 44–58. [Google Scholar]
  26. Kopij, G. Avian Assemblages in Urban Habitats in North-central Namibia. Int. Sci. Technol. J. Namib. 2014, 3, 64–81. [Google Scholar]
  27. Kopij, G. Avian Communities of a Mixed Mopane-Acacia Savanna in the Cuvelai Drainage System, North-central Namibia, during the Dry and Wet Season. Vestn. Zool. 2014, 48, 269–274. [Google Scholar] [CrossRef]
  28. Kopij, G. Structure of avian assemblages in Zambezian Baikiaeae woodlands, northern Namibia. Zool. Ecol. 2017, 27, 1–10. [Google Scholar] [CrossRef]
  29. Maclean, G.L. Ornithology for Africa; University of KwaZulu Natal Press: Pietermaritzburg, South Africa, 1990. [Google Scholar]
  30. Turner, I.M. Species loss in fragments of tropical rain forest: A review of the evidence. J. Appl. Ecol. 1996, 33, 200–209. [Google Scholar] [CrossRef]
Figure 1. The study plot. (A): Location of the study plot in Namibia; (B): location of the study plot in Katima Mulilo (a—built-up areas, b—open wetlands, c—remnant of Acacia savanna, d—riparian forest, e—Zambezi River, f—roads, and g—study plot); (C): the study plot (a—buildings, b—trees, c—roads, and d—a border between natural and transformed riparian forest); and (D): satellite image showing the vegetation coverage and land use in the study plot (red broken line—border of the study plot, yellow broken line—a border between natural and transformed riparian forest).
Diversity 15 01126 g001
Figure 2. Habitats within the study area. (Upper left): Mango trees in gardens, (upper right): the Zambezi River, (middle left): a grassy depression along Zambezi river, (middle right): Podocarpus trees along a street, (lower left): a mixture of indigenous and exotic trees, (lower right): shrubs on banks of Zambezi (all photos by G. Kopij).
Diversity 15 01126 g002
Figure 3. Monthly rainfall in Katima Mulilo during the years 2012–2016.
Diversity 15 01126 g003
Figure 4. Distribution of occupied territories (=breeding pairs) of selected bird species in an urbanized Zambezi riparian forest in 2013/14 (red circles) and 2015/16 wet seasons (yellow circles). Explanations: A—buildings, B—trees, C—roads.
Diversity 15 01126 g004aDiversity 15 01126 g004b
Figure 5. Selected bird species recorded as breeding in the study area. (Upper left): Lilac-breasted Roller, (upper right): Black-headed Oriole, (middle left): Schalow’s Turaco, (lower left): Black-collared Barbet, (middle right): African Paradise Flycatcher, (lower right): Cape Glossy Starling. (photos by G. Kopij and S. Haig).
Diversity 15 01126 g005
Table 1. Characterization of breeding bird community in an urbanized Zambezi riparian forest in two breeding seasons.
Parameter2013/142015/16
Numbers and density
Number of species91101
Number of breeding pairs364.5403.0
Overall population density (pairs/100 ha)678.6750.2
Dominance
Number of dominant species54
Cumulative dominance (%)35.431.6
Community dominance (DI)0.190.19
Indices
Shannon’s Diversity Index (H’)3.863.76
Simpson’s Diversity Index (D)0.970.96
Pielou’s Evenness Index (J’)0.850.82
Table 2. Feeding and nesting guilds in 2013/14 and 2015/16 season in the urbanized riparian forest.
GuildPercentage of PairsPercentage of Species
2013/142015/162013/142015/16
Feeding
Granivores37.135.017.216.3
Insectivores30.533.247.346.2
Frugivores26.925.617.217.3
Carnivores2.32.68.610.6
Other1.92.57.57.7
Nectarivores1.31.12.21.9
Nesting
Trees/shrubs76.675.869.259.8
Holes10.010.720.923.4
Buildings7.67.64.47.5
Herbaceous vegetation5.86.65.59.3
Ground000.00.0
Habitat
Forest34.034.430.832.7
Ecotone59.856.353.847.5
Open7.29.315.419.8
Residency
Resident96.295.390.189.1
Intra-African migrant 3.84.79.910.9
Table 3. Species richness recorded in different biomes in Namibia (each study was conducted both in dry and wet seasons; in all studies, the line transect method was used, except for the urbanized riparian forests, where the mapping method was employed).
HabitatRegionAnnual RainfallNo. of SpeciesStudy PeriodStudy SurfaceSource
Urbanized Riparian ForestZambezi550–6001132013–201654 haThis study
Kalahari WoodlandZambezi450–55088201512 km[21]
Mopane SavannaNorth-central400–500852011–201210 km[22]
Koakoland SavannaKunene300–350642011–201218 km[23]
Disclaimer/Publisher’s Note: The statements, opinions and data contained in all publications are solely those of the individual author(s) and contributor(s) and not of MDPI and/or the editor(s). MDPI and/or the editor(s) disclaim responsibility for any injury to people or property resulting from any ideas, methods, instructions or products referred to in the content.