Article

Habitat Selection of Three Neotropical Grassland Birds Is Dependent on Vegetation Structure and Resources

1
School of Environment and Natural Resources, The Ohio State University, Columbus, OH 43210, USA
2
School of Biological and Environmental Sciences, Liverpool John Moore’s University, Liverpool L3 3AF, UK
3
Asociación Armonía, Av. Lomas de Arena # 400, Zona Palmasola, Santa Cruz de la Sierra 400, Bolivia
*
Author to whom correspondence should be addressed.
Diversity 2024, 16(4), 229; https://doi.org/10.3390/d16040229
Submission received: 15 February 2024 / Revised: 27 March 2024 / Accepted: 4 April 2024 / Published: 10 April 2024
(This article belongs to the Special Issue Avian Diversity in Forest and Grassland)

Abstract

:
Grassland birds are globally imperiled. Those of endemic Neotropical savannas may be particularly threatened as knowledge of the ecology of many species is lacking, restricting our ability to take decisive conservation action. During the dry (non-breeding) season of 2010, we studied the population size, distribution, and habitat associations of the Cock-tailed Tyrant (Alectrurus tricolor), Black-masked Finch (Coryphaspiza melanotis), and Wedge-tailed Grass-finch (Emberiziodes herbicola) across a disturbance-mediated savanna–grassland gradient in Beni, Bolivia. We used distance sampling and surveyed structural and resource-specific habitat features at plots where birds were present versus random locations. Occupancy models identified fine-scale habitat associations. Cock-tailed Tyrant (7.1 ind./km2) specialized on open habitats in areas expected to be heavily inundated in the wet season, avoided trees, and selected tall grassy swards. Black-masked Finch (25.1 ind./km2) occurred across the gradient, associating with tall, forb-rich swards, sparse shrubs, and low levels of fruiting and seeding vegetation. Wedge-tailed Grass-finch (27.9 ind./km2) also occurred across the gradient, particularly associated with tall, forb-rich swards, abundant seeding grasses, and sparse shrubs. Our results offer the first quantitative abundance estimates for these species in Beni, provide vital baselines for future monitoring, and improve knowledge of the ecology and conservation management needs of these species. Importantly, our results suggest that populations of these three grassland birds may be best maintained in heterogenous, mosaic landscapes that can be produced by carefully managed burning and grazing. Further research in the breeding season would facilitate making stronger, more specific management recommendations.

1. Introduction

Grassland birds are one of the most rapidly declining and threatened avian groups [1,2,3]. Their plight parallels the global degradation of grassland ecosystems, which are being rapidly lost and converted for agriculture [4,5]. Neotropical grasslands and their avifauna are amongst the most imperiled. For example, over 50% of the Brazilian Cerrado has already been lost or degraded by agriculture through cropping, rangeland grazing, and afforestation [6]. Concurrently, numbers of IUCN Red List bird species in the Cerrado surpass those of any other South American biome, with the only exception being Brazil’s Atlantic Forest [7]. Despite this, agricultural expansion in the Cerrado, and across Neotropical grassland systems as a whole, is continuing at unprecedented speed [6,8].
Globally, grassland bird conservation is constrained by a critical lack of research on grassland ecology and insufficient knowledge of the natural history and habitat associations of many grassland bird species [2,9,10]. This is especially true in the Neotropics, and even more so for the remote Amazonian savannas, which are patchily distributed through Brazil and Northern Bolivia [11]. Despite being functionally distinct from their better-known African and Australian counterparts [12], the Amazonian savannas represent some of the most understudied grasslands on earth, with only a handful of papers exploring their unique ecology and diversity [11]. Research is urgently needed to inform conservation policy and sustainable land-use strategies to better protect these systems and their avifauna [11].
Tropical savannas occur as mosaics of woody and grassy habitats [13] that are strongly regulated by abiotic gradients (e.g., soils, nutrients, climate) and disturbance regimes (e.g., fire, flooding and grazing [13,14]). The dependence of tropical savannas on periodic disturbance makes them inherently dynamic over a variety of temporal and spatial scales [13]. Savanna birds have coevolved with disturbance and tend to be well adapted to the natural cycles and fluxes created by these processes [15]. Indeed, many species demonstrate associations with specific disturbance-mediated habitat formations [16], affiliations with certain ephemeral habitats or seral stages of succession [17], or dependencies on seasonally available or disturbance-mediated resources [18,19]. Given these relationships, savanna bird communities may be expected to be highly sensitive to the human-mediated alteration of disturbance regimes [15] and the potentially homogenizing impacts of large-scale agricultural management, such as intensive cattle grazing and the overuse and insufficient control of intentional fire.
Considered the largest of the remote Amazonian savannas, the Beni is a 128 000 km2 ecoregion in Bolivia [11]. It is dominated by expansive open grasslands and savannas interspersed with palm forest islands, wetlands, and river channels [20,21,22]. Habitats here are shaped by a multitude of abiotic conditions and disturbance factors including wildfires and seasonal flooding [21,22,23]. The Beni supports a great diversity of bird species, including many little-known, threatened and declining grassland birds [24], for which quantitative information required to assess population status and evaluate trends is severely lacking [11,25,26].
Although indigenous cultures have managed land in Beni for millennia [27,28], ranching has now replaced traditional agriculture to form the basis of the local economy [29]. Similarly to other Neotropical savannas, cattle grazing and associated land management, including intentional burning, are thought to be shifting historic disturbance patterns, including fire frequency, seasonality, extent, and severity [30,31], and driving habitat change and wildlife declines [11,30,32,33,34]. Climate change also threatens habitats and species in Beni, with shifts in temperature, rainfall, and atmospheric CO2 expected to alter fire regimes, flooding cycles, and patterns of woody growth [35,36,37,38]. Evidence to support conservation action and policy change for these species in Beni, and more widely, to benefit grassland birds is therefore urgently required.
Here, we examine the population size, distribution, and habitat preferences of three little-studied grassland birds across a disturbance-mediated savanna ecotone in Beni. Our study species have variable ranges across the Amazonian savannas and adjacent Brazilian Cerrado, and include two declining IUCN Red List grassland specialists classed as vulnerable, the Cock-tailed Tyrant (Alectrurus tricolor) and Black-masked Finch (Coryphaspiza melanotis) [26,39]. Although no published studies track long-term population trends for these species, declines are presumed sufficiently rapid to warrant their current Red List classification [26,39]. We also consider the Wedge-tailed Grass-finch (Emberiziodes herbicola), a grassland indicator that occurs sympatrically but is not experiencing declines of the same magnitude as the other species [40,41]. Written accounts from experts have anecdotally associated declines of these species with habitat loss and agricultural intensification across their range [26,39,40]. More specifically, within Beni, and in other areas where ranching is the dominant land use, declines have been attributed to cattle grazing/trampling and annual fires set by ranchers [26,39]. However, to our knowledge, there is little published evidence that directly investigates the impacts of these processes on bird populations, with the exception of one study that showed that the Cock-tailed Tyrant and Black-masked Finch may be intolerant to grazing [42].
The broad aim of our study was to provide indirect evidence of the potential effects of fire and grazing on our study species by assessing their relationships with disturbance-mediated resources and habitat structures. This will provide important initial evidence on how disturbance regimes may influence these species in order to guide future research and management. Our specific objectives were to (1) provide the first baseline estimates of density and abundance for these species across three grassland physiognomies; (2) establish broad-scale associations with ecological and disturbance-mediated habitat gradients; (3) evaluate if finer-scale structural or resource-specific microhabitat requirements shape species distributions; and (4) consider the conservation management implications of similarities and differences in the ecological requirements of these grassland specialists.

2. Materials and Methods

2.1. Study Site

Our study was carried out at Barba Azul Nature Reserve (hereafter: BANR), in Bolivia’s Beni Savanna Ecoregion (13.750 °S, 66.117 °W) between July and September 2010. The mean annual temperature in Beni ranges from 26 to 27 °C and mean precipitation from 1300 to 2000 mm, with most rain falling in a distinct wet season running from September to May [23,43]. In the wet season, drainage from high Andes watersheds combines with local rainfall to cause dramatic inundation of Beni’s plains [44]. Although topography rarely varies >1 m [23], the landscape can be delineated into broad, but distinct, micro-topographical units, within which vegetation is strongly influenced by flooding gradients and other disturbances like fire and grazing [20,21,45,46]. Alturas (high areas) sit a small height above the annual flood line, supporting gallery and deciduous forests. Bajios (low-laying areas) become heavily inundated in the wet season and support open grassland. On semi-alturas (intermediate elevations), wooded savanna occurs along a continuum, from densely wooded savanna to open grassland with scattered trees and shrubs. BANR is an 11,000 ha protected area dominated by hyper-seasonal savanna–grasslands [21]. At the time of study, cattle and agricultural fire had been largely excluded from BANR for one year.

2.2. Data Collection

2.2.1. Habitat Mapping

We mapped three savanna–grassland physiognomies (hereafter: habitats) across the semi-alturas and bajios of BANR using a Garmin eTrex H GPS receiver. Habitats were delineated visually according to homogeneity of structure, based on the cover and height of woody vegetation and shrubs (Table 1). We used a classification system associated with the structural division of the Brazilian Cerrado that is based on explicit vegetation measures [46,47,48]. Equivalent terms are not yet well defined for Beni [43], but the application of Cerrado nomenclature has been proposed to standardize the variable terminology applied to vegetation in this region [49].

2.2.2. Bird Surveys

We used distance sampling along line transects to estimate species density. Surveys were completed by a team of seven trained observers using 8 × 40 Bushnell binoculars. Our study design met key distance sampling assumptions [50]: (1) transects were placed randomly relative to bird distribution; (2) distances were measured accurately; (3) birds were recorded at their original location, prior to movement; and (4) birds on the transect line were always detected. We used a systematic approach [51], laying out parallel 1.3 km transects (n= 22) spaced 200 m apart. Transects were later stratified by habitat. To maintain independence, birds detected > 100 m from the transect line were not recorded. For pairs and flocks, the location was taken as the central point between individuals. Bird locations were recorded and flagged for later habitat assessment. All transects were sampled twice between sunrise (~06:30 h) and ~09.30 h when activity noticeably declined. Walking speed was slow (~0.5 km/h−1). The final sampling effort was 57.2 km (28.6 km of transects sampled twice).

2.2.3. Habitat Assessments

Habitat assessments were carried out at flagged locations where birds were observed during the survey (hereafter, bird plots) and at ten equidistant, prespecified distances along each transect (n = 220; hereafter, a random plot). At each plot, we recorded microhabitat attributes in three replicate 1 m2 quadrats. These included (1) three components of vegetation structure, a) grass height (cm), b) distance to the nearest tree (m), and c) frequency of three plant functional groups (forbs, woody shrubs, and trees); (2) occurrence of two plant-based food resources, a) seeding grasses, and b) seeding/fruiting forbs or shrubs; and finally 3) two flooding indices, a) surales (worm mound) height (cm), and b) the frequency of large (> 30 cm), small (< 30 cm), conical, and rounded termite mounds. The selected variables were hypothesized to influence habitat selection in the study species and/or relate to local disturbance dynamics. For example, vegetation structure and food availability can influence habitat selection in grassland birds, but these features can also shift significantly over short timescales in grasslands as a function of disturbance [15,52,53]. Other variables were linked to flooding dynamics. Specifically, surales are natural mounds created by earthworms and bunchgrass growth in flooded grasslands [45,54]. Taller mounds correspond with increasing flooding depth and duration [55]. The size and shape of termite mounds is also indicative of hydrology. Large, round mounds tend to occur in dry, infrequently inundated areas; small, conical mounds occur in regularly inundated locations [56,57].
Grass and surales heights were measured using a 2 m stick inserted vertically into the grass. Five measurements were taken in each quadrat, one at the center and one at each of the four mid-points between the center and each corner. Grass height was recorded as the tallest point where grass touched the stick. The height of the nearest surales mound was recorded within a 15 cm radius of the stick. Measurements were averaged for each quadrat and the average of the three quadrats was taken as the plot average. Distance to the nearest tree was estimated visually from the first sampled quadrat at each plot. As termite mounds and non-grassy plants had very low cover, these features, along with resource abundances, were recorded as ordinal variables representing the number of quadrats in which they occurred.

2.3. Statistical Analysis

2.3.1. Species Density, Abundance, and Distribution

We used Distance 7.0 [58] to assess the density and abundance of target species [50]. A separate analysis was completed for each species using the following protocol. Data from the two transect visits were pooled and treated as replicates with detections coded as clusters. We examined frequency histograms of detection data to determine truncation distances and look for “invasive movement”, “heaping”, or “rounding” [50]. Data were right-truncated where observation frequency dropped to ~5, adding 2.5 m to avoid rounding distances [50]. To avoid upward bias, we avoided the flexible hazard rate model if evidence of heaping was apparent [50]. Otherwise, models were parameterized with three key functions and appropriate adjustment terms: (i) a half-normal key with cosine/hermite polynomial adjustments; (ii) a uniform key with cosine/simple polynomial adjustments; and (iii) a hazard rate key with cosine/simple polynomial adjustments [50]. Final detection functions (Supplementary Materials Figure S1) were selected based on four factors, AIC values, visual inspection of QQ plots, goodness-of-fit (GOF) tests, and the shape criterion [50]. We used Kolmogorov–Smirnov (KS) and Cramer–von Mises (CVM) family test statistics for GOF, as data were analyzed as exact. We note here that, since the few existing studies assessing Cock-tailed Tyrant populations elsewhere in South America have not subdivided effort in campo sujo and campo limpo [59,60], we provide additional density estimates, combining efforts in these two habitats to make the results more comparable.

2.3.2. Associations with Ecological and Disturbance-Mediated Habitat Gradients

We used R (version 4.0.3, [61] for all further statistical analyses. Principal Component Analysis (PCA; prcomp function, base R) was used to reduce data dimensionality and allow graphical exploration of relationships between ecological gradients and species distributions. We standardized independent variables to a mean zero and unit variance to equalize weights in analyses and used the latent root criterion (eigenvalues > 1) to determine the number of interpretable axes [62]. We interpreted ecological and environmental gradients by examining the factor loadings of variables on each axis. Only variables with factor loadings >0.5 or <−0.5 were deemed to have a meaningful effect.
Species relationships with axes (and hence derived ecological gradients) were tested by extracting PCA axis scores and using these to run an additive multinomial logistic regression with a logit link function (mlogit function, mlogit package; [63]). Multinomial logistic regression compares parameter estimates to a baseline response category. We used “species identity” as the dependent response variable and PCA axes scores as independent predictors. Random plots were coded as pseudo-species and set as the reference level for the response; thus, species distributions were compared to the random category. The model was assessed for goodness of fit using the χ2 statistic. Alpha values of p ≤ 0.05 determined significance.

2.3.3. Microhabitat Associations

PCA results informed the parameterization of a global occupancy model to determine finer-scale microhabitat associations. We selected a subset of habitat variables from the PCA. All uncorrelated covariates with high factor loadings (> 0.5 or < −0.5) on at least one axis were included in a global species model to help tease apart finer-scale habitat associations confounded in the PCA. Where there was high correlation (> 50%) between variables with acceptable factor loadings, we selected the variable with the highest factor loading from the correlated group. For the Cock-tailed Tyrant, the limited number of observations constrained the number of parameters that could be fitted in the model. Based on the results of the multinomial regression, we did not include variables associated with seeding or fruiting resources as these were not expected to influence habitat selection significantly. For occupancy modeling, generalized linear models (GLMs) were used, with a binomial error distribution and logit link function (glm function, base-R; [61]). Separate analyses were completed for each species, comparing bird plots where the species was detected with random plots. We performed backward stepwise selection to reduce the full model and selected the top model based on Akaike’s Information Criterion (AIC; [64]). Where one or more competing models (Δ AIC < 2) existed, conditional model averaging was performed (model.avg function; MuMIn package; [65]). Top models were assessed for goodness of fit using McFadden’s pseudo-R2 (PseudoR2 function, DescTools package; [66]) and the Hosmer–Lemeshow test (Hoslem.test function, base R, [61]). Respectively, values of 0.2–0.4 and p > 0.05 were judged as representing an excellent fit for these tests [64]. Models were also checked for overdispersion with dispersion values close to 1 regarded as adequate [64].
For interpretation, parameter estimates from the conditional average were converted to odds ratios [67]. We generated effects plots to allow visual exploration of relationships between significant model variables and occupancy [64]. To compose these, we predicted occupancy (predict function, base R; [61]), keeping non-significant continuous variables at their mean and non-significant categorical variables at “medium” frequency. Where two continuous variables were compared, we set three levels for the second variable, the mean and the mean plus/minus one standard deviation. This allowed us to create pseudo-categories, for example, representing short, mean, and tall grass height.

3. Results

A total of 191 target species observations were made over this study, including 23 Cock-tailed Tyrant (31 individuals); 79 Black-masked Finch (113 individuals); and 89 Wedge-tailed Grass-finch (142 individuals).

3.1. Species Density, Abundance, and Distribution across Grassland Physiognomies

Cock-tailed Tyrant (7.1 ind. per km2; 95% CI 3–16.9) were only observed in campo limpo (Table 2). In contrast, Black-masked Finch (25.1 ind. per km2; 95% CI 14.4–43.7) and Wedge-tailed Grass-finch (27.9 ind. per km2; 95% CI 20.2–38.8) were observed in all sampled habitats. Black-masked Finch were found at relatively similar densities across the Cerrado–grassland gradient, although they appeared slightly less abundant in campo Cerrado (Table 2). Wedge-tailed Grass-finch appeared to be more abundant in campo Cerrado compared to other habitats (Table 2). Cock-tailed Tyrant occurred at lower densities and had the smallest estimated population size of our sampled species. Wedge-tailed Grass-finch had the highest densities overall and the largest estimated population size.

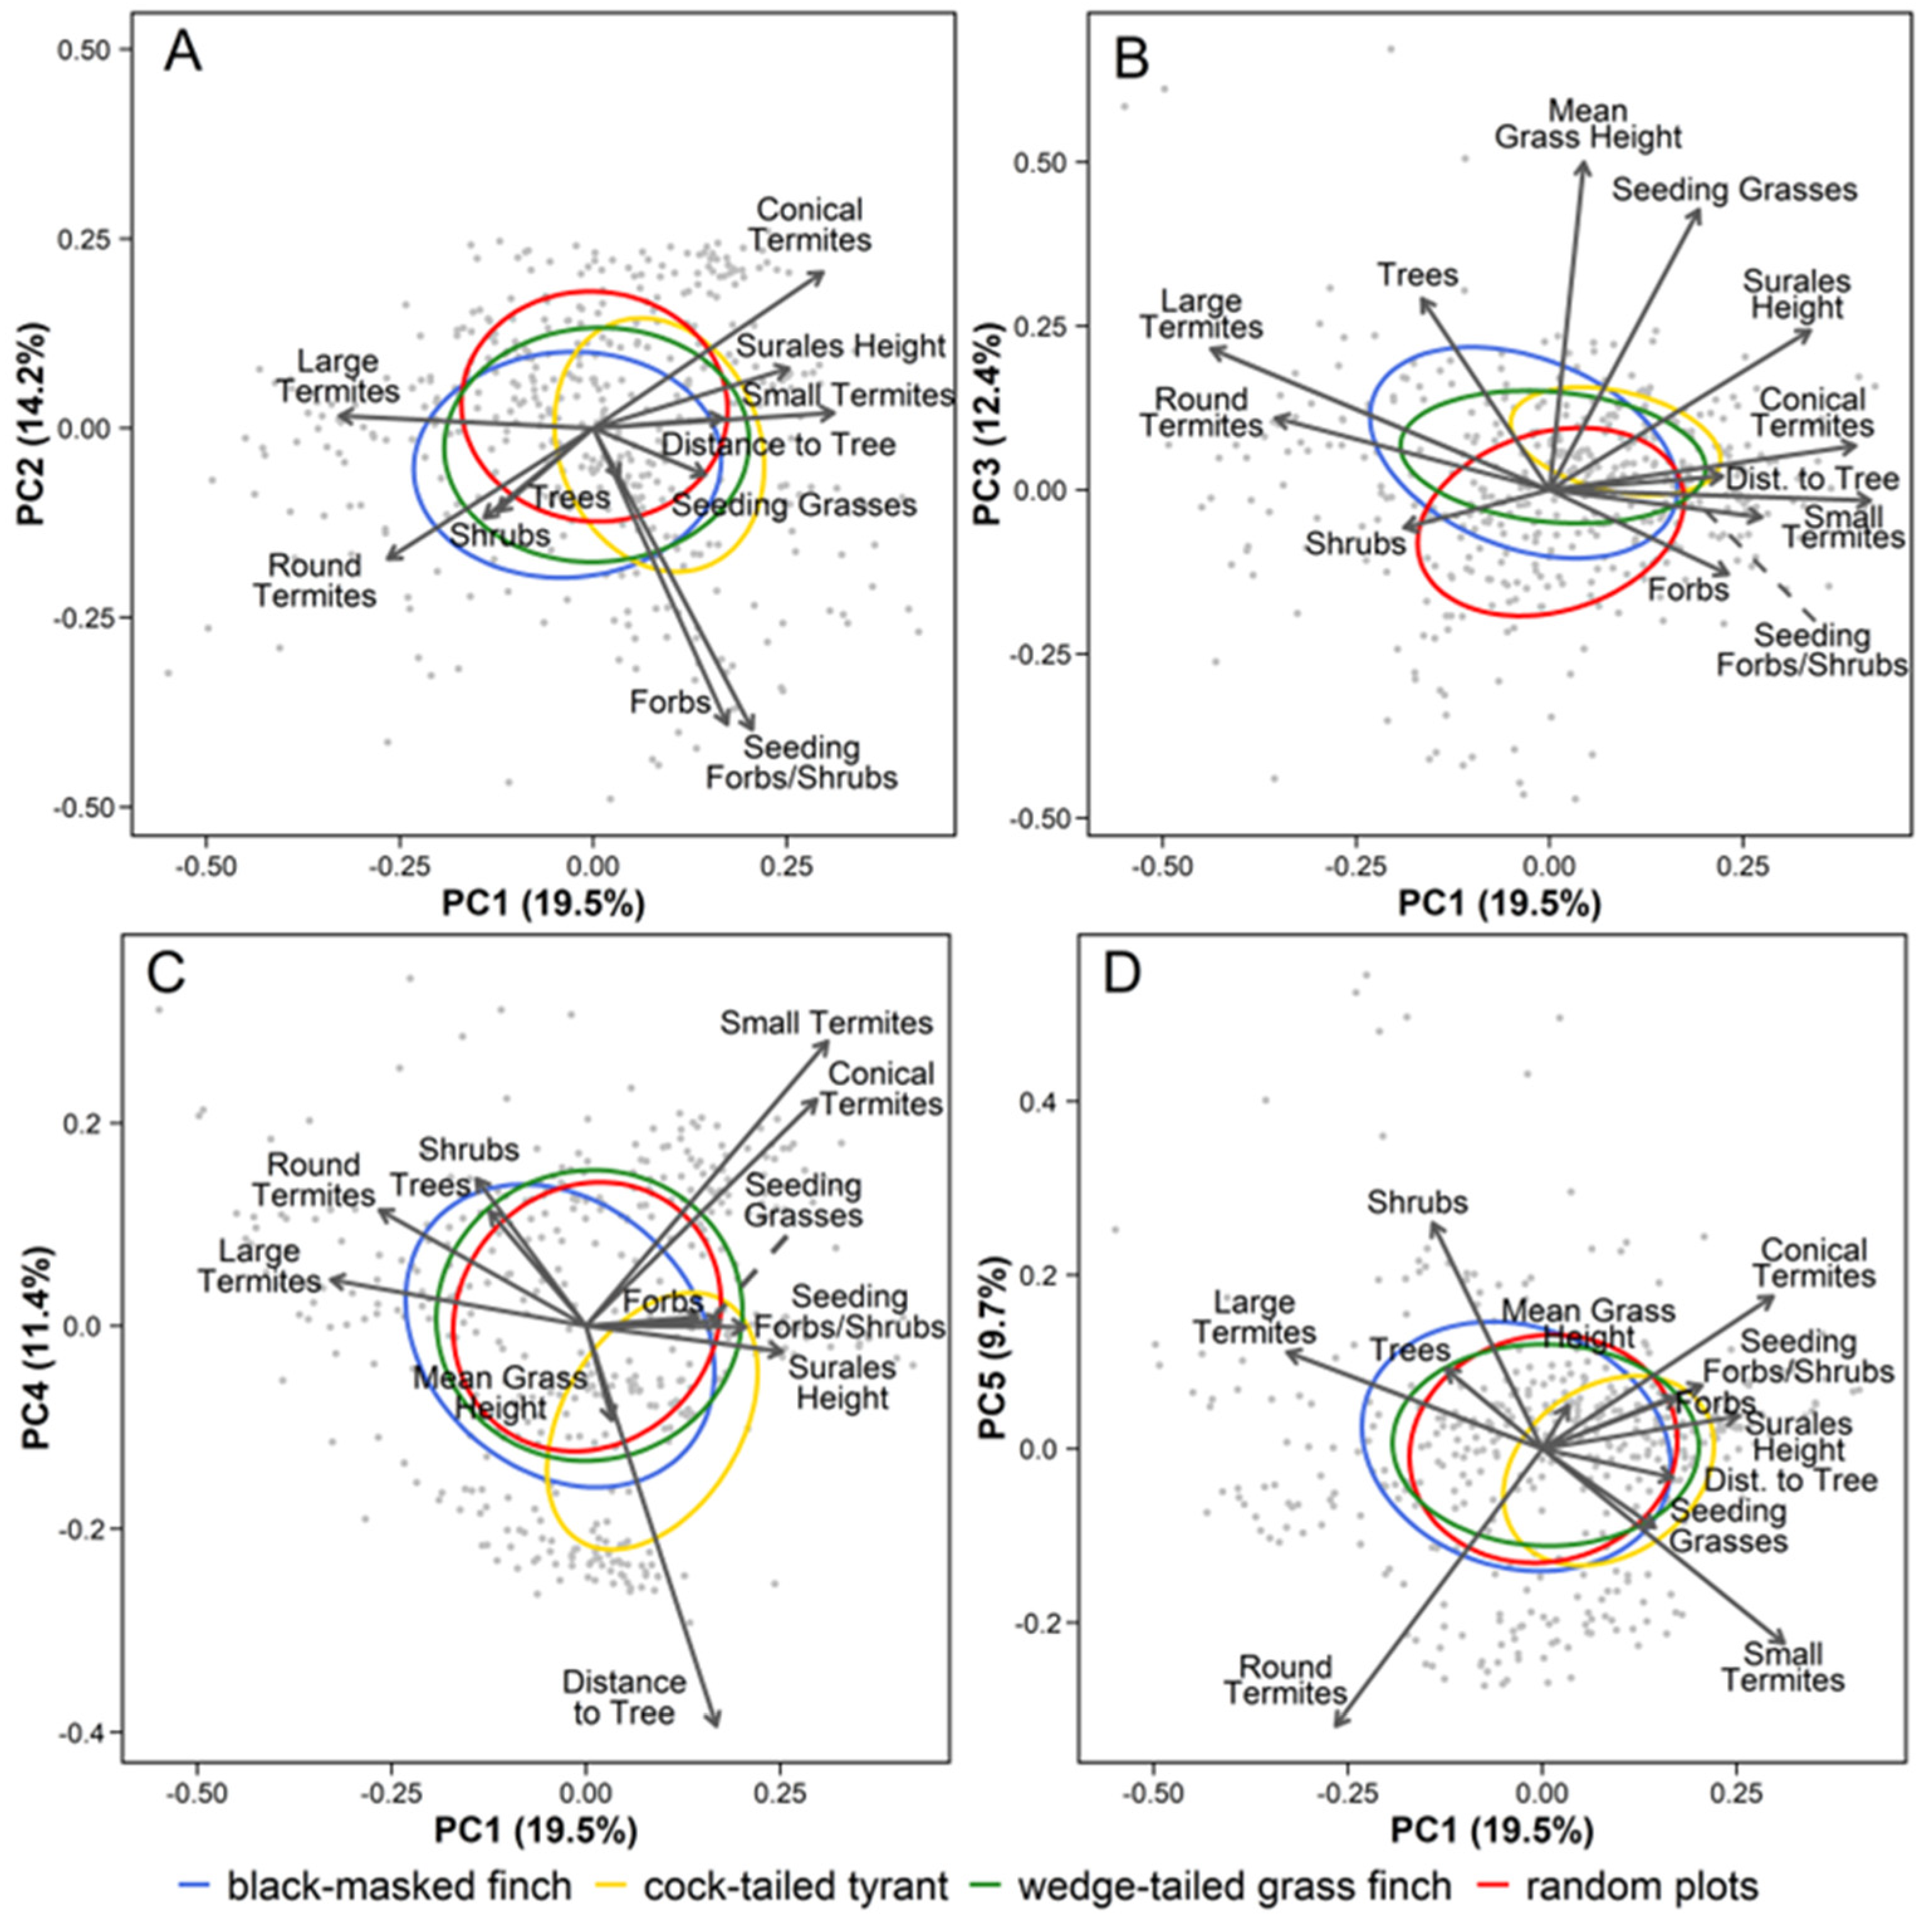
3.2. Broad-Scale Associations with Ecological and Disturbance-Mediated Habitat Gradients

The first five PCA axes (eigenvalues > 1) collectively explained 67% of the variance in the habitat data (Figure 1 and Table 3), suggesting that these PCA gradients can provide useful characterization of the habitat characteristics individual bird species associate with. Based on factor loadings for indicator variables (Table 3), PC1 related to a floodplain gradient, separating drier areas (lower PC1 score) from seasonally wet grassland (high PC1 score). PC2 represented a seeding forb-rich gradient. It separated grassland with high levels of forbs, and more seeding/fruiting forbs and shrubs (low PC2 score), from forb-poor grassland with fewer seeding/fruiting forbs and shrubs (high PC2 score). PC3 described a tall, seeding grassland gradient, separating shorter (lower PC3 score) and taller grassland with correspondingly more seeding grasses (higher PC3 score). PC4 represented a gradient of openness, separating open (low PC4 score) from more wooded grassland (high PC4 score). Finally, PC5 showed a shrub abundance gradient, separating shrub-less (low PC5 score) and shrub-rich grassland (high PC5 score).
Multinomial logistic regression revealed significant relationships between PCA gradients and species occurrence (χ2df = 3 = 106.91 at p < 0.001). Cock-tailed Tyrant were positively associated with heavily inundated areas (high PC1 scores; p < 0.05), tall, seeding grassland (high PC3 scores; p < 0.001), and tree-less grassland (high PC4 scores; p < 0.01) and trended to have negative associations with shrub cover (low PC5 scores; p = 0.11). Both finch species were positively associated with forb-rich seeding grassland (low PC2 scores; p < 0.001) and tall seeding grassland (high PC3 scores; p < 0.001).

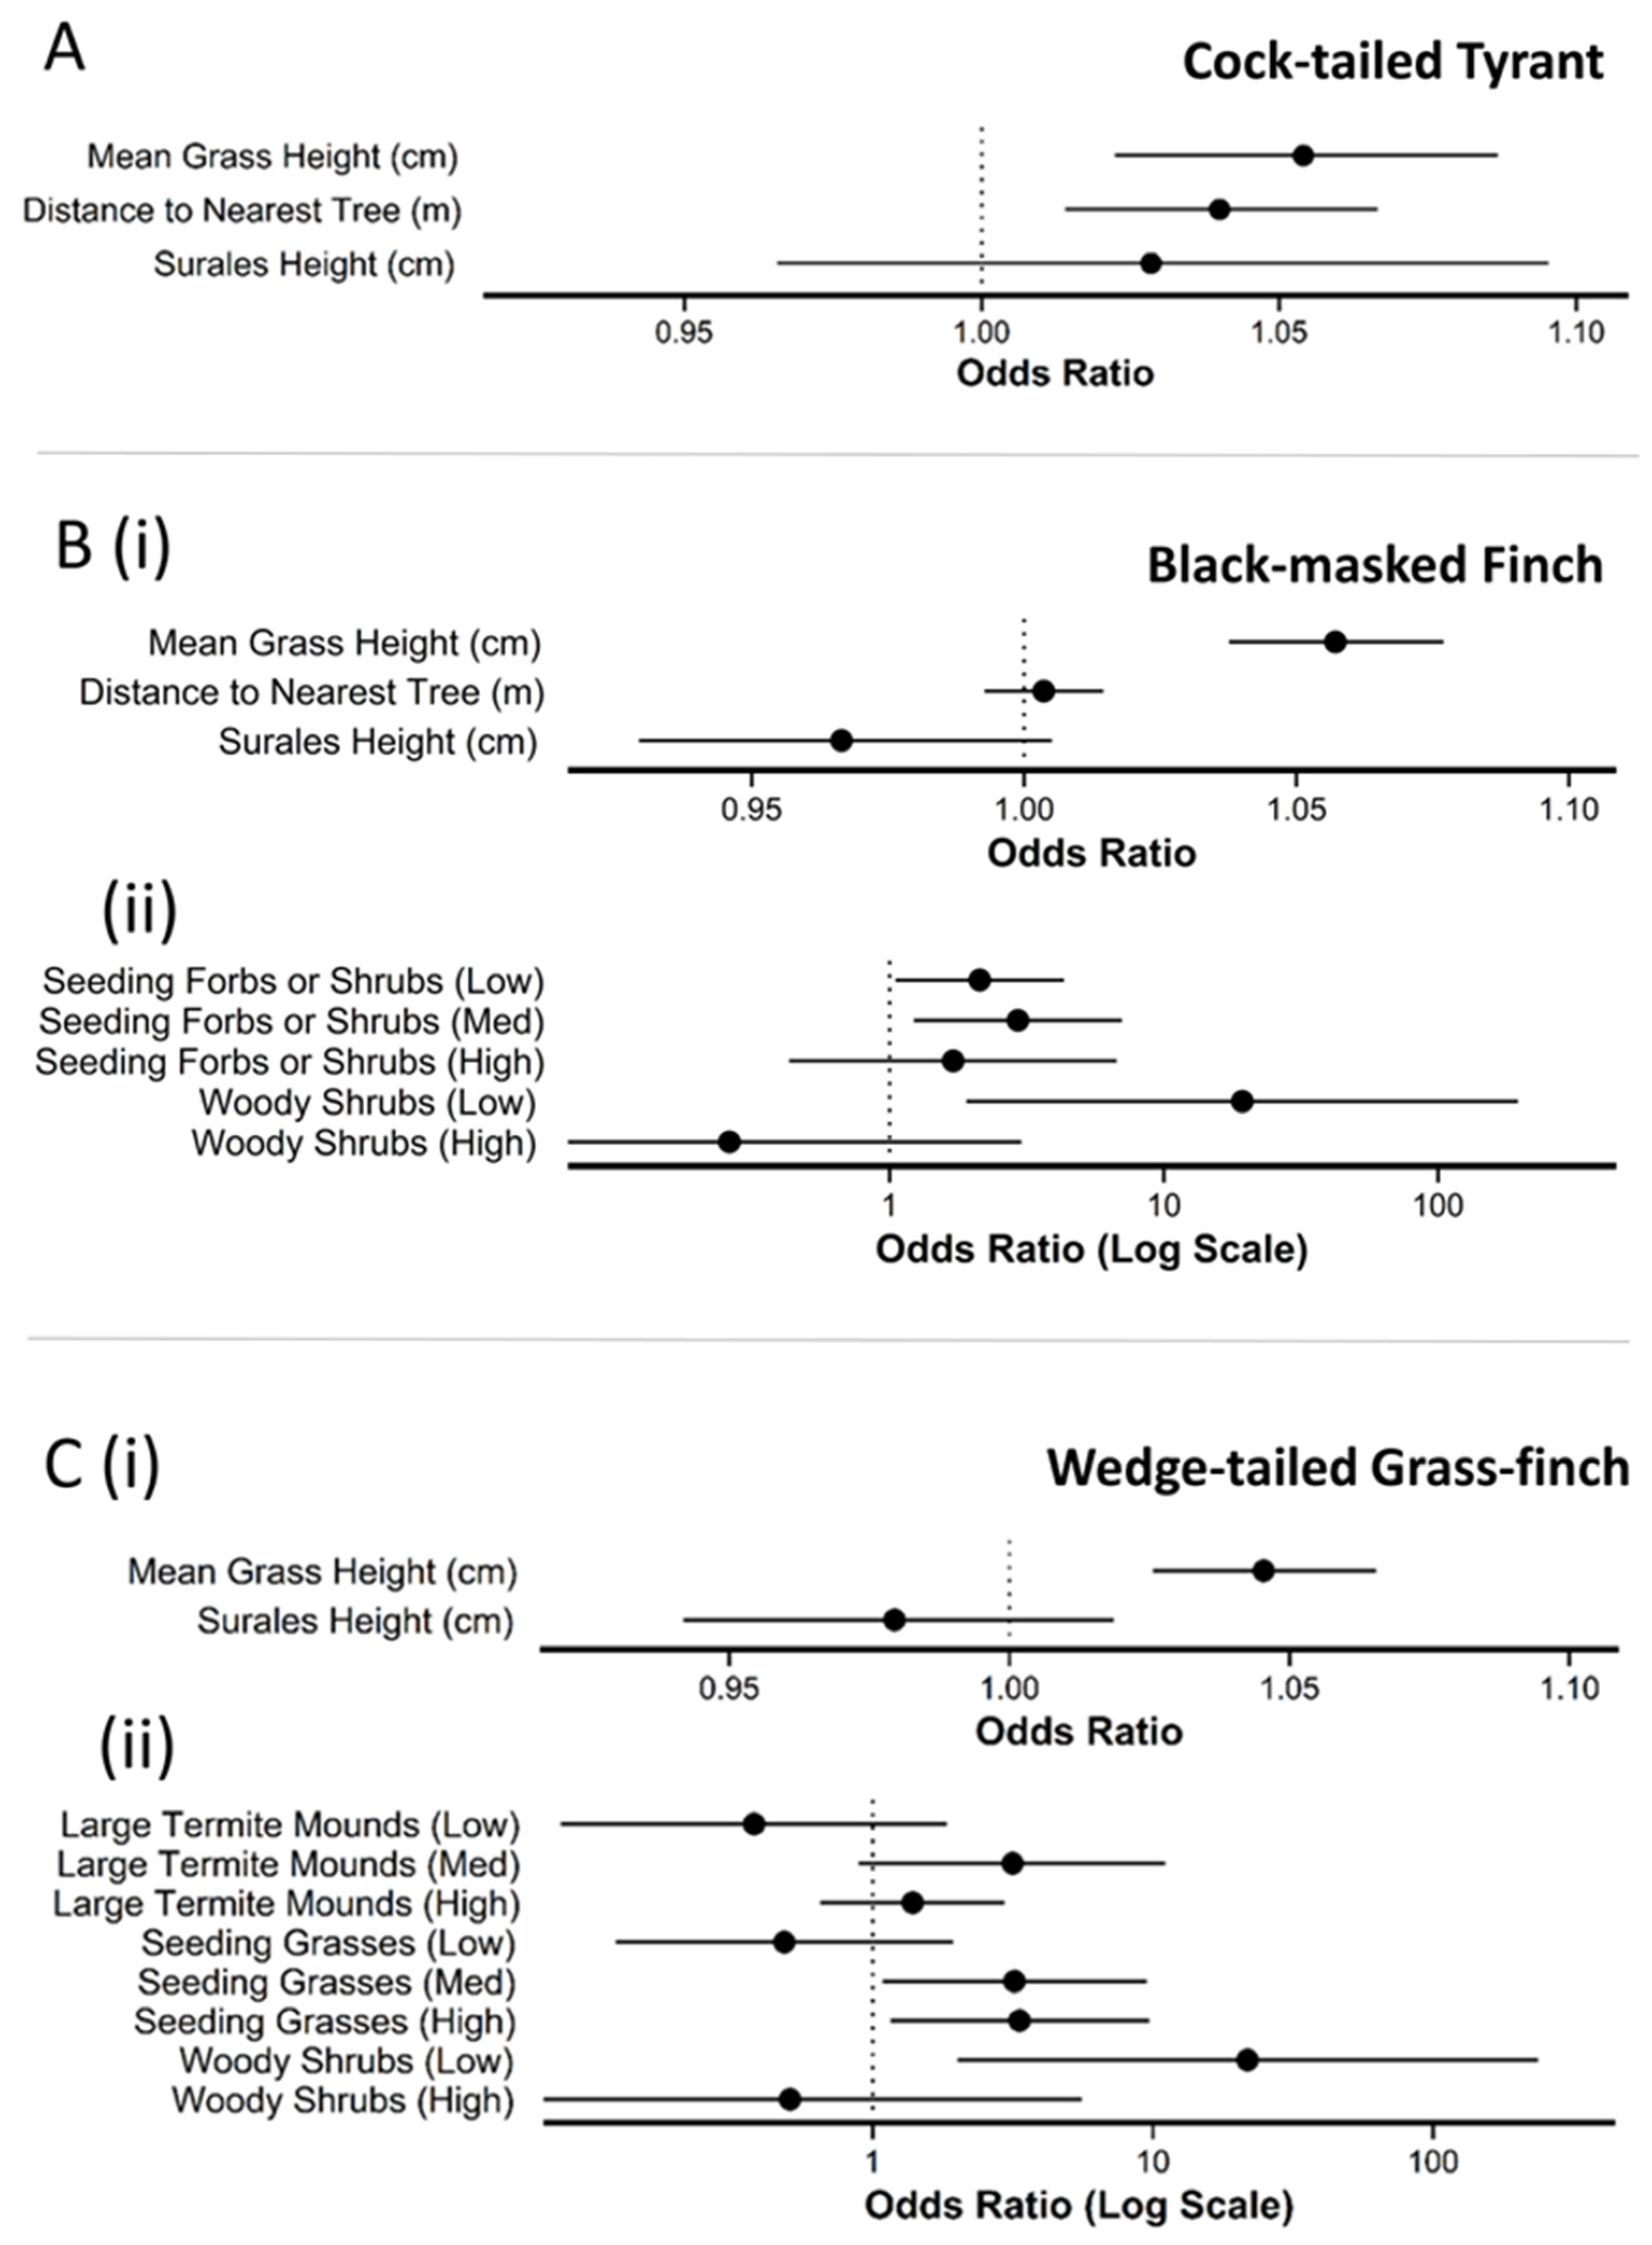
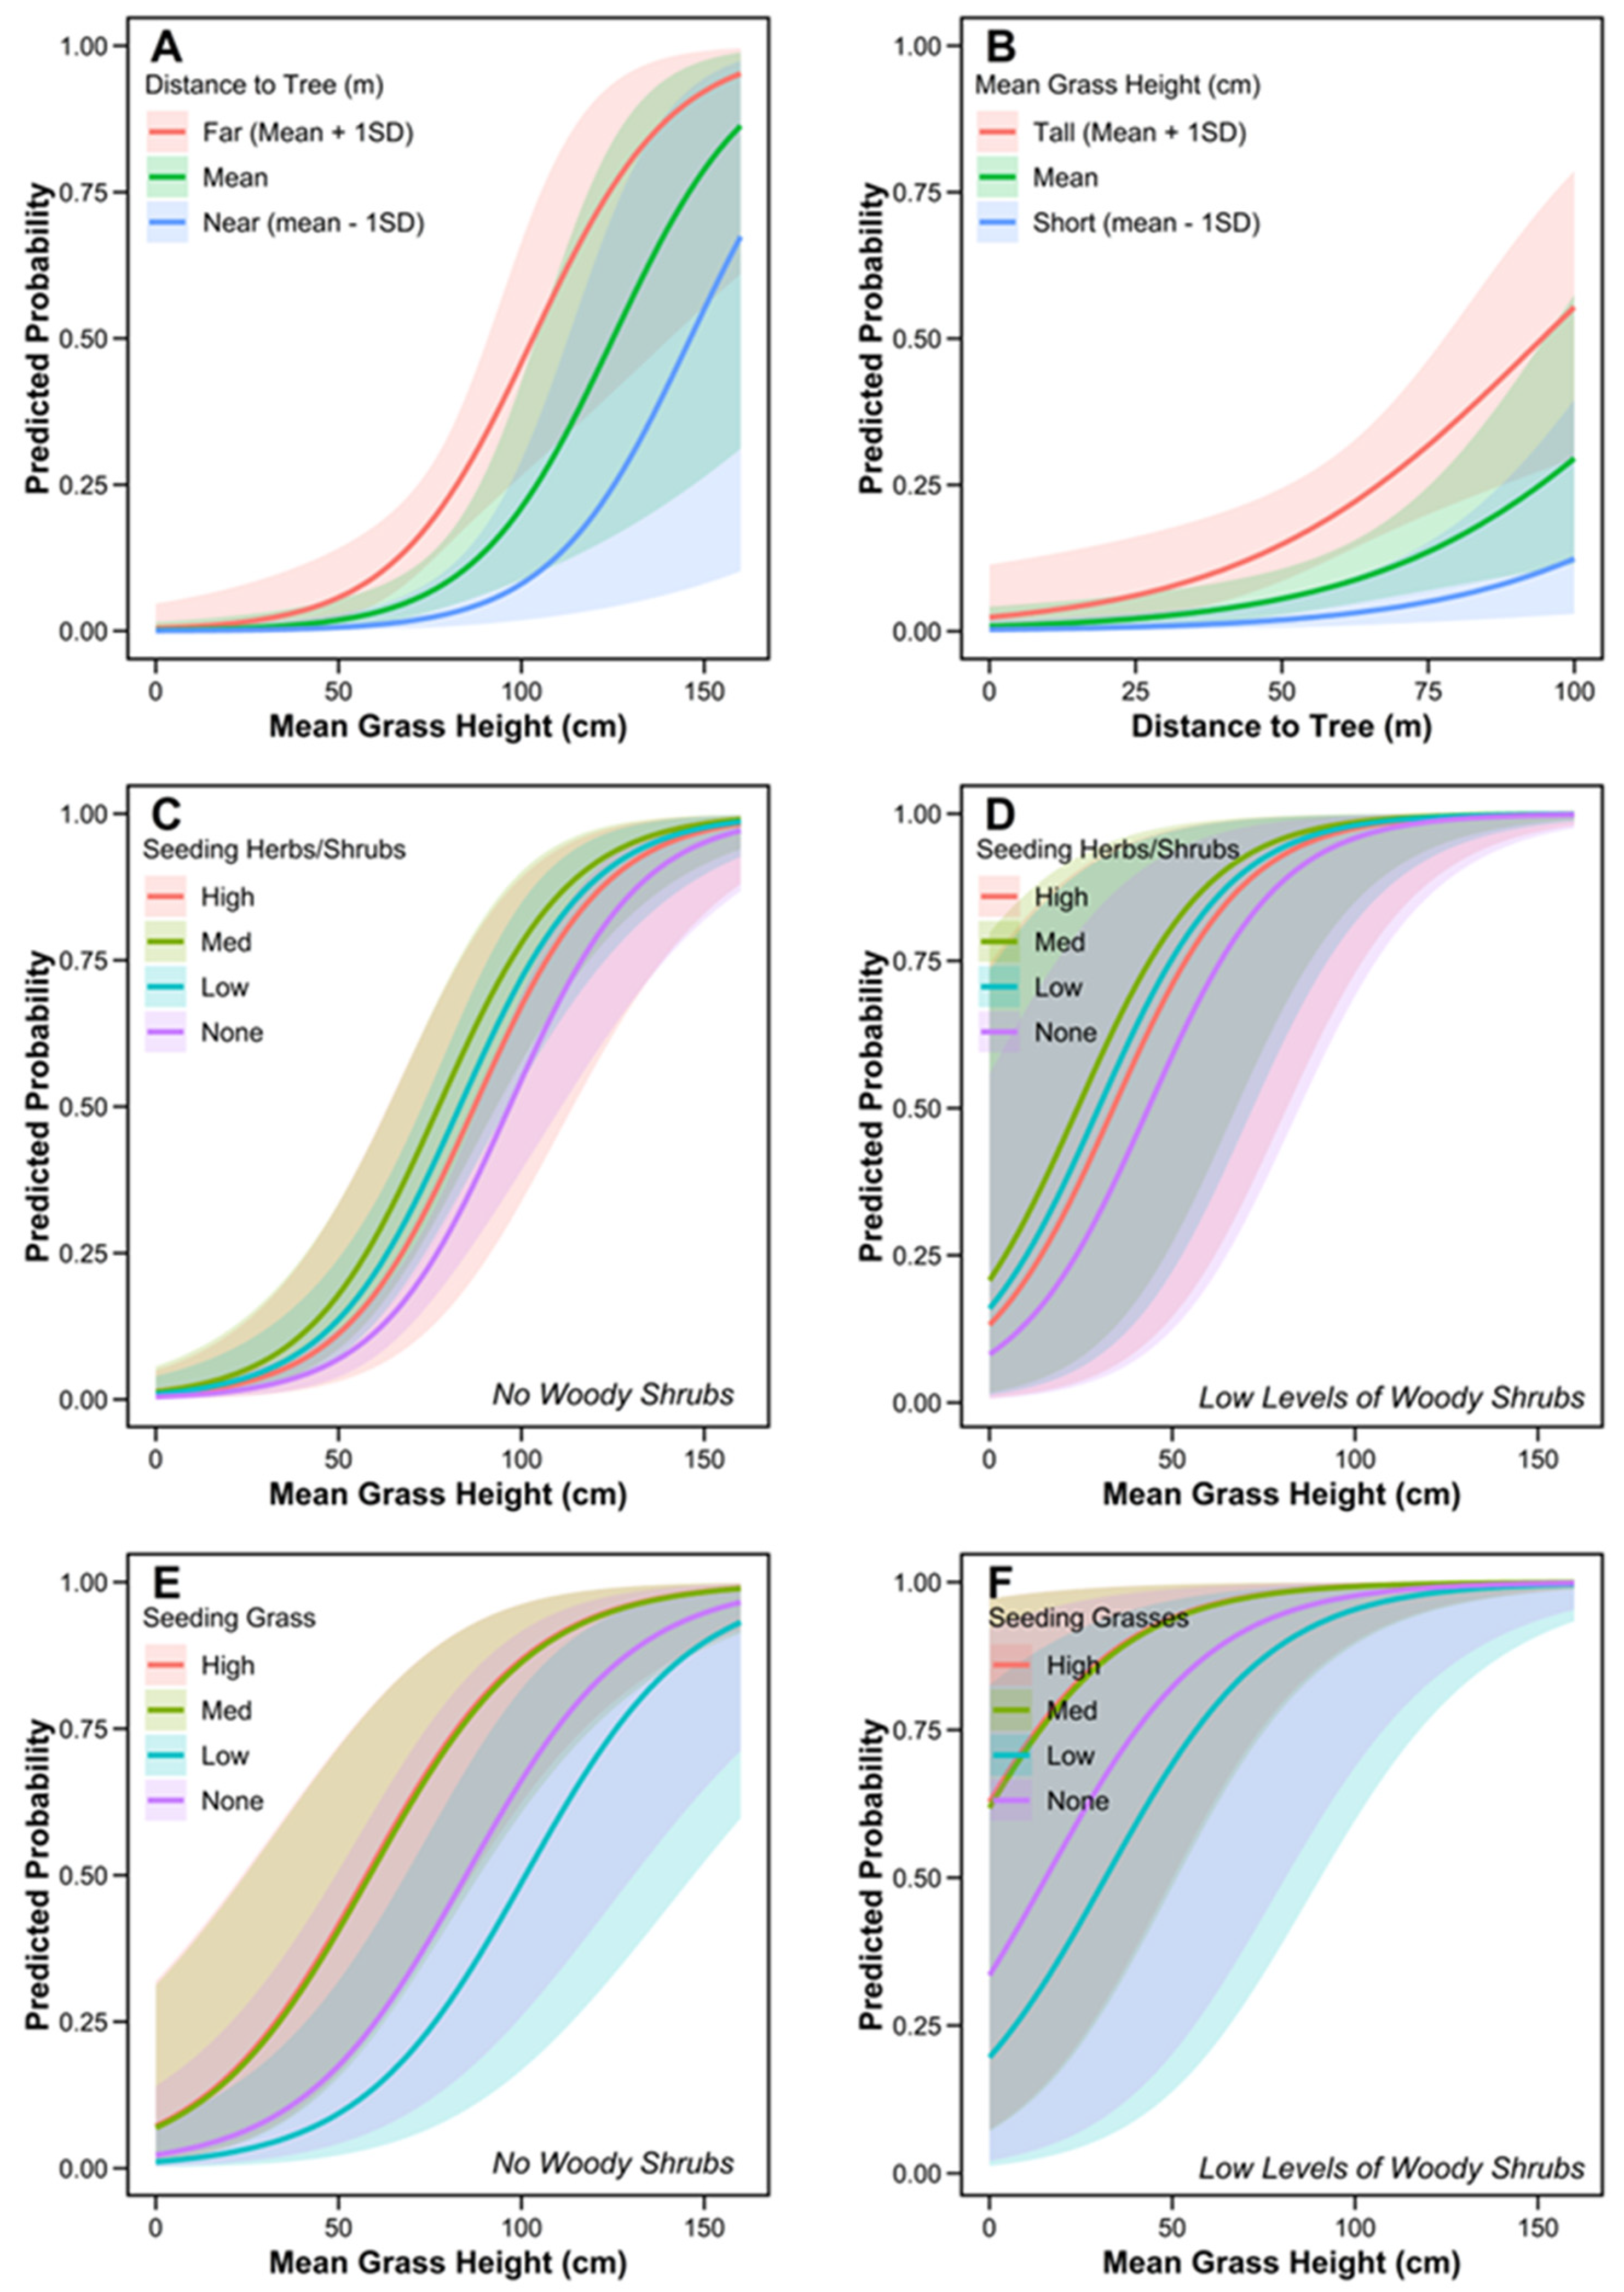
3.3. Finer-Scale Microhabitat Selection

For all species, conditional model averaging of top occupancy models was performed, and none of the averaged models showed evidence of poor fit or overdispersion (Table 4). For Cock-tailed Tyrant, probability of occupancy increased with mean grass height (p < 0.001) and increasing distance to trees (p < 0.01; Table 5, Figure 2 and Figure 3). For any given grass height, the chance of occupancy was reduced closer to trees, but even when trees were distant, the chance of occupancy only exceeded 50% when grass height was above ~100 cm (Figure 3). For Black-masked Finch, probability of occupancy increased with mean grass height (p < 0.001), in areas with low levels of woody shrubs (p < 0.05), and in areas with a low (p < 0.05) and moderate (p < 0.05) abundance of seeding/fruiting forbs and shrubs (Table 5, Figure 2 and Figure 3). For Wedge-tailed Grass-finch, the probability of occupancy increased with mean grass height (p < 0.001), in areas with low levels of woody shrubs (p < 0.05), and in areas with moderate (p <0.05) and high (p<0.05) levels of seeding grasses (Table 5, Figure 2 and Figure 3). For both Black-masked Finch and Wedge-tailed Grass-finch, the occurrence of low levels of woody shrubs had the effect of increasing the chance of occupancy at shorter grass heights (Figure 3).

4. Discussion

This study improves the knowledge of the status and ecology of three little-known, declining grassland birds, the Cock-tailed Tyrant, Black-masked Finch, and Wedge-tailed Grass-finch, by providing baseline estimates of their density and abundance, and a greater understanding of their habitat associations, within the endemic Beni savannas of Bolivia. Cock-tailed Tyrant were the least abundant study species. They specialized on open habitats (campo limpo) in areas expected to be heavily inundated in the wet season, avoided trees, and selected tall grassy swards. Black-masked Finch were found in all sampled Cerrado–grassland habitats. They occurred at higher densities compared to Cock-tailed Tyrant and were associated with tall, forb-rich swards, sparse woody shrubs, and grassland with low levels of fruiting or seeding forbs and shrubs. Wedge-tailed Grass-finch were marginally more abundant than Black-Masked Finch. Like the Black-masked Finch, they were also found across all sampled Cerrado–grassland habitats associated with tall, forb-rich swards and sparsely distributed woody shrubs, but their distribution was related to the occurrence of seeding grasses. The at times contrasting needs of study species, within and between adjacent habitat types, suggest that complex land management approaches will be needed to conserve communities of multiple grassland specialists such as these.
Cock-tailed Tyrant were absent in both shrubby (campo sujo) and woody (campo Cerrado) grassland. This species has also been noted to be absent from wooded grasslands in the Brazilian Cerrado [16,59], but it has been recorded at similar relative abundances in campo limpo and campo sujo habitats there [16]. Campo limpo and campo sujo are not distinguished in other studies of its distribution [59,60], but the Cock-tailed Tyrant reportedly uses campo sujo [16,42,68,69,70]. Compared to existing studies quantifying the abundance of this species, our density estimates are high compared to [59] (4.5 individuals per km2), but similar to [70] (6.9 individuals per km2).
As Cock-tailed Tyrant may be niche switchers, exhibit nomadism, and/or display variance in social behavior across the annual cycle [71], detectability and habitat use could vary seasonally. This could explain the avoidance of campo sujo habitats seen in our surveys which were constrained to the dry season. Since the timing of breeding in Beni is still ambiguous [71], it is worth highlighting that male displays were observed during our study in August. Breeding activity and juveniles have been noted elsewhere in Beni in the wet season [72]. Thus, if breeding occurs in the region, its timing likely aligns with the onset of seasonal rains, as in other parts of this species’ range [39].
Known aspects of the ecology of the Cock-tailed Tyrant could help to explain finer-scale patterns of habitat selection. Cock-tailed Tyrant are aerial insectivores that primarily hawk or sally for arthropods from the herbaceous stratum [73]. During breeding, males gather to demonstrate elaborate aerial displays to groups of females, with cup nests built on the ground to accommodate offspring [59,74]. Since trees in open areas can harbor avian and terrestrial woodland predators [75], their avoidance may be particularly critical for Cock-tailed Tyrant given the conspicuous nature of their foraging and breeding activities. Within open areas, tall grassy stands may provide additional benefits such as elevated areas to scan for prey/predators or prime arenas for breeding displays. Taller grasses may also provide greater cover than shorter swards, enhancing escape when under attack or protection from extreme weather. Although our surveys were restricted to the dry (non-breeding) season, maintaining territories in seasonally inundated areas could provide benefits during the breeding phase. Insect abundance is widely related to moisture availability in seasonally dry tropical ecosystems including the Neotropical savannas [76,77,78]. Hence, areas that flood first and hold water longer could provide enhanced foraging to support nestlings. Future research should seek to understand the relationship between invertebrate abundance and the distribution of insectivorous species such as Cock-tailed Tyrants. Raised surales (worm mounds) commonly found in these areas could also function to support nesting above the annual flood line during that time.
In contrast to Cock-tailed Tyrant, Black-masked Finch and Wedge-tailed Grass-finch were found in all sampled habitats. For Wedge-tailed Grass-finch, this is consistent with studies in Brazil (e.g., [16]). However, Black-masked Finch tend to be associated more with campo limpo and campo sujo formations and have been listed as absent from wooded grassland in multi-species studies in Brazil [16,42,59]. Our global density estimates for Black-masked Finch are comparable to those of [59] (23.2 ind. per km2). These high figures might be counterintuitive considering the species’ threatened status. However, its range is extremely restricted and its distribution tends to be very local at sites where it does occur [26]. Home range studies have also shown that it can occur at very high densities with significant territory overlap in both the winter and breeding seasons [79].
Tall grasses may provide similar benefits for Black-masked Finch and Wedge-tailed Grass-finch as those discussed for Cock-tailed Tyrant (e.g., cover from predation and extreme weather). Tall grasses and scattered shrubs may also be preferred perches; both species were frequently observed vocalizing from elevated locations in the herbaceous stratum during data collection. Black-masked Finch have been noted to disappear from grassland where the shrub component is very high [80]. This aligns with our results, which show a positive association with shrubs only when they are infrequent. High shrub cover can influence predator numbers and affect grassland bird productivity and breeding success [75,81]. As such, dense shrubby areas may be less attractive to grassland birds.
Associations of Black-masked Finch and Wedge-tailed Grass finch with forb-rich grassland are consistent with other studies relating to the ecology of these species [26,31,40,41,42,69,70]. Forb-rich areas may provide a greater diversity and abundance of foods, including a variety of insects, seeds, and small fruits [82]. It is notable that both finch species were associated with resource abundance. Although the diets of these two species are not well described, it is feasible that grass seeds and the seeds and fruits of non-grassy vegetation form an important component of the diet of the Wedge-tailed Grass-finch and Black-masked Finch, respectively. Resource tracking has been noted in grassland birds within savanna systems and may be an adaptive response to the inherent patchiness of resources [17,83,84,85].

5. Conclusions

Our results suggest that maintaining the co-occurrence of our study species within a landscape will require the maintenance of a mosaic of habitat structures and resources. It is likely that these can be promoted through land management approaches that encourage spatial heterogeneity. While the spatially extensive burning and largely uncontrolled cattle grazing that are currently widespread in Beni are likely incompatible with the conservation needs of these species, broad suppression of such disturbances may also be counterproductive. Patch burning and controlled grazing can help maintain habitat heterogeneity and resource availability within grassland systems [86,87,88]. For example, mosaic burning can simultaneously secure the persistence of open areas in combination with tall, mature tussocky perennial grasses [45,89], patches of low-density woody scrub [14,90], and rich herbaceous vegetation [42], a mix of features identified here as important in the habitat selection of our study species. Informed fire management and conservation grazing may thus represent key land management tools that could help to secure the varied requirements of grassland bird communities such as those within Neotropical savanna ecosystems. Given that our study was focused on the dry, non-breeding season, the next key research challenge for conservation management in the endemic Beni savannas will be to understand species distributions throughout the full annual cycle. Furthermore, we must identify the managed burning and grazing regimes and patterns that can best support the integration of conservation and agricultural production. This information will assist in the development of more wildlife-friendly land-use recommendations to guide both conservation and private land managers.

Supplementary Materials

The following supporting information can be downloaded at: https://www.mdpi.com/article/10.3390/d16040229/s1, Figure S1: Detection functions for (A) Cock-tailed Tyrant, (B) Black-masked Finch and (C) Wedge-tailed Grass-finch.

Author Contributions

Conceptualization, J.P. and R.M.; methodology, J.P., R.M., G.M.D. and C.M.T.; formal analysis, J.P., R.M., G.M.D. and C.M.T.; investigation, J.P.; data curation, J.P.; writing—original draft preparation, J.P.; writing—review and editing, J.P., R.M., G.M.D., C.M.T. and T.B.; visualization, J.P.; supervision, R.M., G.M.D. and C.M.T.; project administration, J.P. and R.M. All authors have read and agreed to the published version of the manuscript.

Funding

We thank the funders who supported this expedition, including the University of Glasgow, The Carnegie Trust for the Universities of Scotland, Glasgow Natural History Society, Thriplow Charitable Trust, Gilchrist Educational Trust, Chester Zoo, The Royal Institute of Chartered Surveyors Educational Trust, The Royal Geographical Society, and The Royal Scottish Geographical Society.

Institutional Review Board Statement

Not applicable.

Data Availability Statement

The data presented in this study are openly available in Dryad at https://datadryad.org/stash/share/jnf2G-v5v-IsT190eoRDfk2p1c_y5acg2OtfsNqpVd0 (accessed on 3 April 2024).

Acknowledgments

We are grateful for the support of our collaborators Asociación Civil Armonia, Bolivia, for their logistical support and assistance in improving this manuscript. Particularly, we thank Bennett Hennessey, Mauricio Herrera, Gustavo Sanchez Avila, Douglas Bruckner, and Hernan Vargas for facilitating and supporting our work in Barba Azul Nature Reserve. Thank you also to the Bolivian and Scottish scientists who provided assistance and advice, particularly Kevin Murphy, Aquilino Molina Olivera, and Miguel Angel Aponte Justiniano. We also thank the University of Glasgow Bolivia Expedition 2010 team, Duncan McNeil, Lydia Bach, Kirsty Godsman, Chris Long, Alwyn McKenna, and Gwynedd O’Neil, who aided in field data collection.

Conflicts of Interest

The authors declare no conflicts of interest.

References

  1. Rosenberg, K.V.; Kennedy, J.A.; Dettmers, R.; Ford, R.P.; Reynolds, D.; Alexander, J.D.; Beardmore, C.J.; Blancher, J.P.; Bogart, R.E.; Butcher, G.S.; et al. Partners in Flight Landbird Conservation Plan: 2016 Revision for Canada and Continental United States. Partners in Flight Science Committee. 119p. Available online: https://partnersinflight.org/wp-content/uploads/2016/08/pif-continental-plan-final-spread-single.pdf (accessed on 3 April 2024).
  2. Azpiroz, A.B.; Isacch, J.P.; Dias, R.A.; Di Giacomo, A.S.; Fontana, C.S.; Palarea, C.M. Ecology and Conservation of Grassland Birds in Southeastern South America: A Review. J. Field. Ornithol. 2012, 83, 217–246. [Google Scholar] [CrossRef]
  3. Reif, J. Long-Term Trends in Bird Populations: A Review of Patterns and Potential Drivers in North America and Europe. Acta Ornithol. 2013, 48, 1–16. [Google Scholar] [CrossRef]
  4. Sala, O.E.; Chapin, F.S.; Armesto, J.J.; Berlow, E.; Bloomfield, J.; Dirzo, R.; Huber-Sanwald, E.; Huenneke, L.F.; Jackson, R.B.; Kinzig, A.; et al. Global Biodiversity Scenarios for the Year 2100. Science 2000, 287, 1770–1774. [Google Scholar] [CrossRef]
  5. Hoekstra, J.M.; Boucher, T.M.; Ricketts, T.H.; Roberts, C. Confronting a Biome Crisis: Global Disparities of Habitat Loss and Protection. Ecol. Lett. 2005, 8, 23–29. [Google Scholar] [CrossRef]
  6. Klink, C.A.; Machado, R.B. Conservation of the Brazilian Cerrado. Conserv. Biol. 2005, 19, 707–713. [Google Scholar] [CrossRef]
  7. Marini, M.Â.; Garcia, F.I. Bird Conservation in Brazil. Conserv. Biol. 2005, 19, 665–671. [Google Scholar] [CrossRef]
  8. Overbeck, G.E.; Vélez-Martin, E.; Scarano, F.R.; Lewinsohn, T.M.; Fonseca, C.R.; Meyer, S.T.; Müller, S.C.; Ceotto, P.; Dadalt, L.; Durigan, G.; et al. Conservation in Brazil Needs to Include Non-forest Ecosystems. Divers. Distrib. 2015, 21, 1455–1460. [Google Scholar] [CrossRef]
  9. Koper, N.; Nudds, T.D. Progress in Research on Grassland Bird Conservation and Ecology. Avian Conserv. Ecol. 2011, 6. [Google Scholar] [CrossRef]
  10. Parr, C.L.; Lehmann, C.E.R.; Bond, W.J.; Hoffmann, W.A.; Andersen, A.N. Tropical Grassy Biomes: Misunderstood, Neglected, and under Threat. Trends Ecol. Evol. 2014, 29, 205–213. [Google Scholar] [CrossRef]
  11. De Carvalho, W.D.; Mustin, K. The Highly Threatened and Little Known Amazonian Savannahs. Nat. Ecol. Evol. 2017, 1, 100. [Google Scholar] [CrossRef]
  12. Lehmann, C.E.R.; Anderson, T.M.; Sankaran, M.; Higgins, S.I.; Archibald, S.; Hoffmann, W.A.; Hanan, N.P.; Williams, R.J.; Fensham, R.J.; Felfili, J.; et al. Savanna Vegetation-fire-Ccimate Relationships Differ among Continents. Science 2014, 343, 548–552. [Google Scholar] [CrossRef]
  13. Scholes, R.J.; Archer, S.R. Tree-grass Interactions in Savannas. Annu. Rev. Ecol. Syst. 1997, 28, 517–544. [Google Scholar] [CrossRef]
  14. Bond, W.J. What Limits Trees in C4 Grasslands and Savannas? Annu. Rev. Ecol. Evol. Syst. 2008, 39, 641–659. [Google Scholar] [CrossRef]
  15. Brawn, J.D.; Robinson, S.K.; Thompson, F.R., III. The Role of Disturbance in the Ecology and Conservation of Birds. Annu. Rev. Ecol. Syst. 2001, 32, 251–276. [Google Scholar] [CrossRef]
  16. Tubelis, D.; Cavalcanti, R. Community Similarity and Abundance of Bird Species in Open Habitats of a Central Brazilian Cerrado. Ornitol. Neotrop. 2001, 12, 57–73. [Google Scholar]
  17. Kutt, A.S.; Woinarski, J.C.Z. The Effects of Grazing and Fire on Vegetation and the Vertebrate Assemblage in a Tropical Savanna Woodland in North-Eastern Australia. J. Trop. Ecol. 2007, 23, 95–106. [Google Scholar] [CrossRef]
  18. Hovick, T.J.; Mcgranahan, D.A.; Elmore, R.D.; Weir, J.R.; Fuhlendorf, S.D. Pyric-Carnivory: Raptor Use of Prescribed Fires. Ecol. Evol. 2017, 9144–9150. [Google Scholar] [CrossRef]
  19. Weier, A.; Radford, I.J.; Woolley, L.-A.; Lawes, M.J. Fire Regime Effects on Annual Grass Seeds as Food for Threatened Grass-finch. Fire Ecol. 2018, 14. [Google Scholar] [CrossRef]
  20. Langstroth, R.P. Forest Islands in an Amazonian Savanna of Northeastern Bolivia. Ph.D. Thesis, University of Wisconsin, Madison, WI, USA, 1996. [Google Scholar]
  21. Langstroth, R. Biogeography of the Llanos de Moxos: Natural and Anthropogenic Determinants. Geogr. Helv. 2012, 66, 183–192. [Google Scholar] [CrossRef]
  22. Mayle, F.E.; Langstroth, R.P.; Fisher, R.A.; Meir, P. Long-term Forest-Savannah Dynamics in the Bolivian Amazon: Implications for Conservation. Philos. Trans. R. Soc. B Biol. Sci. 2007, 362, 291–307. [Google Scholar] [CrossRef]
  23. Hanagarth, W. Acerca de La Geoecología de Las Sabanas Del Beni En El Noreste de Bolivia; Instituto de Ecología: La Paz, Bolivia, 1993. [Google Scholar]
  24. Kingsbury, J.; McKenna, A.; Godsman, K.; McNeil, D. Bolivia Expedition Report 2010; Scotland, Glasgow, 2010, Unpublished Report. Available online: https://armoniabolivia.org/wp-content/uploads/2019/03/Glasgow-2010-Expedition-Report.pdf (accessed on 24 February 2024).
  25. BirdLife International Alectrurus tricolor. The IUCN Red List of Threatened Species 2017: E.T22700300A110738421. Available online: https://www.iucnredlist.org/species/22700300/110738421 (accessed on 24 February 2024).
  26. BirdLife International Coryphaspiza melanotis. The IUCN Red List of Threatened Species 2018: E.T22723039A132020897. Available online: https://www.iucnredlist.org/species/22723039/132020897 (accessed on 24 February 2024).
  27. Denevan, W.M. The Aboriginal Cultural Geography of the Llanos; University of California Press: Berkeley, CA, USA, 1966. [Google Scholar]
  28. Lombardo, U.; Iriarte, J.; Hilbert, L.; Ruiz-pérez, J.; Capriles, J.M.; Veit, H. Early Holocene Crop Cultivation and Landscape Modification in Amazonia. Nature 2020, 581, 190–195. [Google Scholar] [CrossRef]
  29. Aguilera, R. La Ganaderia Beniana En Cifras; Federacion de Ganaderos del Beni y Pando: Trinidad, Bolivia, 2004. [Google Scholar]
  30. Mercado Callau, L.N.; Boorsma, T. Guia Practica Parra Ganaderia de Armonizacion; La Ganaderia Sostenible Para El Beni; Armonia Bolivia: Santa Cruz de la Sierra, Bolivia, 2019. [Google Scholar]
  31. Parker, T., III; Willis, E. Notes on Three Tiny Grassland Flycatchers, with Comments on the Disappearance of South American Fire-diversified Savannas. Ornithol. Monogr. 1997, 549–555. [Google Scholar] [CrossRef]
  32. Hesse, A.J. The Blue-throated Macaw in the Wild: A Cause for Concern. Watchbird 1997, 24, 10–15. [Google Scholar]
  33. Hordijk, I.; Meijer, F.; Nissen, E.; Boorsma, T.; Poorter, L. Cattle Affect Regeneration of the Palm Species Attalea princeps in a Bolivian Forest–Savanna Mosaic. Biotropica 2019, 51, 28–38. [Google Scholar] [CrossRef]
  34. Peacock, J.; Tonra, C.M.; King, J.; Davies, G.M. Restoration of Gallery Forest Patches Improves Recruitment of Motacu Palms (Attalea princeps) While Diversifying and Increasing Wildlife Populations. PLoS ONE 2021, 16, 1–20. [Google Scholar] [CrossRef]
  35. Reddy, A.R.; Rasineni, G.K.; Raghavendra, A.S. The Impact of Global Elevated CO₂ Concentration on Photosynthesis and Plant Productivity. Curr. Sci. 2010, 99, 46–57. [Google Scholar]
  36. IPCC. Climate Change 2014: Synthesis Report. Contribution of Working Groups I, II and III to the Fifth Assessment Report of the Intergovernmental Panel on Climate Change; Core Writing Team, Pachauri, R.K., Meyer, L.A., Eds.; IPCC: Geneva, Switzerland, 2014; ISBN 9789291691432. [Google Scholar]
  37. Arieira, J.; Padovani, C.R.; Schuchmann, K.; Landeiro, V.L.; Santos, S.A. Modeling Climatic and Hydrological Suitability for an Encroaching Tree Species in a Neotropical Flooded Savanna. For. Ecol. Manag. 2018, 429, 244–255. [Google Scholar] [CrossRef]
  38. Levick, S.R.; Richards, A.E.; Cook, G.D.; Schatz, J.; Guderle, M.; Williams, R.J.; Subedi, P.; Trumbore, S.E.; Andersen, A.N. Rapid Response of Habitat Structure and Above-ground Carbon Storage to Altered Fire Regimes in Tropical Savanna. Biogeosciences 2019, 16, 1493–1503. [Google Scholar] [CrossRef]
  39. BirdLife International. Species Factsheet: Alectrurus tricolor. Available online: http://www.birdlife.org (accessed on 6 June 2022).
  40. BirdLife International. Emberizoides herbicola. The IUCN Red List of Threatened Species 2018: E.T22723370A132022146. Available online: https://doi.org/10.2305/IUCN.UK.2018-2.RLTS.T22723370A132022146.En (accessed on 3 April 2024).
  41. Stotz, D.; Fitzpatrick, J.; Parker, T., III; Moskovits, D. Neotropical Birds: Ecology and Conservation; The University of Chicago Press: Chicago, IL, USA, 1996. [Google Scholar]
  42. Tubelis, D.P.; Cavalcanti, R.B. A Comparison of Bird Communities in Natural and Disturbed Non-wetland Open Habitats in the Cerrado’s Central Region, Brazil. Bird Conserv. Int. 2000, 10, 331–350. [Google Scholar] [CrossRef]
  43. Borghetti, F.; Barbosa, E.; Ribiero, L.; Ribiero, J.F.; Machado Teles Walter, B. South American savannas. In Savanna Woody Plants and Large Herbivores; Scogings, P.F., Sankaran, M., Eds.; John Wiley and Sons Ltd.: Chichester, West Sussex, UK, 2019; pp. 77–122. [Google Scholar]
  44. Hamilton, S.K.; Sippel, S.J.; Melack, J.M. Seasonal Inundation Patterns in Two Large Savanna Floodplains of South America: The Llanos de Moxos (Bolivia) and the Llanos Del Orinoco (Venezuela and Colombia). Hydrol. Process. 2004, 18, 2103–2116. [Google Scholar] [CrossRef]
  45. Haase, R.; Beck, G. Structure and Composition of Savanna Vegetation in Northern Bolivia: A Preliminary Report. Brittonia 1989, 41, 80–100. [Google Scholar] [CrossRef]
  46. Sarmiento, G. The Ecology of Neotropical Savannas; Harvard University Press: Caimbridge, MA, USA, 1984. [Google Scholar]
  47. Eiten, G. The Cerrado Vegetation of Brazil. Bot. Rev. 1972, 38, 201–341. [Google Scholar] [CrossRef]
  48. Ratter, J.A.; Bridgewater, S.; Ribeiro, J.F. Biodiversity patterns of the woody vegetation of the Brazilian cerrado. In Neotropical Savannahs and Seasonally Dry Forests: Plant Diversity Biogeography and Conservation; Pennington, R., Lewis, G., Ratter, J., Eds.; CRC Press: Boca Raton, FL, USA, 2006; pp. 31–66. [Google Scholar]
  49. Villarroel, D.; Munhoz, C.B.R.; Proenca, C.E.B. Campos y Sabanas Del Cerrado En Bolivia: Delimitación, Síntesis Terminológica y Sus Caracteristicas Fisionómicas. Kempffiana 2016, 12, 47–80. [Google Scholar]
  50. Buckland, S.; Rexstad, E.; Marques, T.; Oedekoven, C. Distance Sampling: Methods and Applications; Springer: Berlin/Heidelberg, Germany, 2015; ISBN 9783319192185. [Google Scholar]
  51. Bibby, C.; Burgess, N.; Hill, D.; Mustoe, S. Bird Census Techniques, 2nd ed.; Academic Press Limited: London, UK, 2000. [Google Scholar]
  52. Askins, R.A.; Chávez-ramírez, F.; Dale, B.C.; Haas, C.A.; Herkert, R.; Knopf, F.L.; Vickery, P.D. Conservation of Grassland Birds in North America: Understanding Ecological Processes in Different Regions Report of the AOU Committee on Conser. Ornithol. Monogr. 2007, 64, 3–46. [Google Scholar] [CrossRef]
  53. Legge, S.; Garnett, S.; Maute, K.; Heathcote, J.; Murphy, S.; Woinarski, J.C.Z.; Astheimer, L. A Landscape-Scale, Applied Fire Management Experiment Promotes Recovery of a Population of the Threatened Gouldian Finch, Erythrura gouldiae, in Australia’s Tropical Savannas. PLoS ONE 2015, 10, e0137997. [Google Scholar] [CrossRef]
  54. Cunha, L.; Brown, G.G.; Stanton, D.W.G.; Da Silva, E.; Hansel, F.A.; Jorge, G.; McKey, D.; Vidal-Torrado, P.; Macedo, R.S.; Velasquez, E.; et al. Soil Animals and Pedogenesis: The Role of Earthworms in Anthropogenic Soils. Soil Sci. 2016, 181, 110–125. [Google Scholar] [CrossRef]
  55. Zangerlé, A.; Renard, D.; Iriarte, J.; Suarez Jimenez, L.E.; Adame Montoya, K.L.; Juilleret, J.; McKey, D. The Surales, Self-Organized Earth-Mound Landscapes Made by Earthworms in a Seasonal Tropical Wetland. PLoS ONE 2016, 11, e0154269. [Google Scholar] [CrossRef] [PubMed]
  56. Levick, S.R.; Asner, G.P.; Chadwick, O.A.; Khomo, L.M.; Rogers, K.H.; Hartshorn, A.S.; Kennedy-Bowdoin, T.; Knapp, D.E. Regional Insight into Savanna Hydrogeomorphology from Termite Mounds. Nat. Commun. 2010, 1, 65. [Google Scholar] [CrossRef] [PubMed]
  57. Ocko, S.A.; Heyde, A.; Mahadevan, L. Morphogenesis of Termite Mounds. Proc. Natl. Acad. Sci. USA 2019, 116, 3379–3384. [Google Scholar] [CrossRef]
  58. Thomas, L.; Buckland, S.T.; Rexstad, E.A.; Laake, J.L.; Strindberg, S.; Hedley, S.L.; Bishop, J.R.B.; Marques, T.A.; Burnham, K.P. Distance Software: Design and Analysis of Distance Sampling Surveys for Estimating Population Size. J. Appl. Ecol. 2010, 47, 5–14. [Google Scholar] [CrossRef]
  59. Braz, V.S. Ecologia e Conservação Das Aves Campestres Do Bioma Cerrado; Universidade de Brasilia: Brasilia, Brazil, 2008. [Google Scholar]
  60. Kanegae, M.F. Population Size of Threatened and Endemic Birds of the Cerrado in Estação Ecológica de Itirapina, a Fragmented Area in the State of São Paulo, Brazil. Bird Conserv. Int. 2012, 22, 144–154. [Google Scholar] [CrossRef]
  61. R Core Team. R: A Language and Environment for Statistical Computing 3.6.2; R Foundation for Statistical Computing: Vienna, Austria. Available online: https://www.R-Project.Org/2020 (accessed on 3 April 2024).
  62. McCune, B.; Grace, J.B. Analysis of Ecological Communities; MjM Software Design: Gleneden Beach, OR, USA, 2002. [Google Scholar]
  63. Croissant, Y. Mlogit: Multinomial Logit Models. R Package Version 1.1-0 2020. Available online: https://cran.r-project.org/web/packages/mlogit/index.html (accessed on 24 February 2024).
  64. Faraway, J.J. Extending the Linear Model with R—Generalized Linear, Mixed Effects and Nonparametric Regression; Chapman Hall: New York, NY, USA, 2006; ISBN 1584881658. [Google Scholar]
  65. Barton, K. MuMIn: Multi-model Inference. R Package. 2020. Available online: https://cran.r-project.org/web/packages/MuMIn/index.html (accessed on 24 February 2024).
  66. Signorell, A. DescTools: Tools for Descriptive Statistics. R Package Version 0.99.36. 2020. Available online: https://cran.r-project.org/web/packages/DescTools/index.html (accessed on 24 February 2024).
  67. Keating, K.; Cherry, S. Use and Interpretation of Logistic Regression in Habitat-selection Studies. J. Wildl. Manag. 2004, 68, 774–789. [Google Scholar] [CrossRef]
  68. Silveira, L.F. The Birds of Serra Da Canastra National Park and Adjacent Areas, Minas Gerais, Brazil. Cotinga 1998, 10, 55–63. [Google Scholar]
  69. Lopes, L.E.; Malacco, G.B.; Alteff, E.F.; De Vasconcelos, M.F.; Hoffmann, D.; Silveira, L.F. Range Extensions and Conservation of Some Threatened or Little Known Brazilian Grassland Birds. Bird Conserv. Int. 2010, 20, 84–94. [Google Scholar] [CrossRef]
  70. Kanegae, M.F.; Levy, G.; Freitas, S.R. Habitat Use by Sharp-Tailed Tyrant (Culicivora caudacuta), and Cock-Tailed Tyrant (Alectrurus tricolor) in the Cerrado of Southeastern Brazil. Rev. Bras. Ornitol. 2012, 20, 52–58. [Google Scholar]
  71. Marini, M.Â.; Barbet-Massin, M.; Lopes, L.E.; Jiguet, F. Geographic and Seasonal Distribution of the Cock-Tailed Tyrant (Alectrurus tricolor) Inferred from Niche Modeling. J. Ornithol. 2013, 154, 393–402. [Google Scholar] [CrossRef]
  72. Padial, J.M.; Heredia, J. Notes on Cock-Tailed Tyrant Alectrurus tricolor in Bolivia. Cotinga 2004, 79–80. [Google Scholar]
  73. Ferrari, A.; Motta-Junior, J.C.; Siqueira, J.D.O. Seasonal Variation in the Foraging Behavior of Neotropical Tyrant Flycatchers (Tyrannidae) in a Cerrado Fragment, Brazil. Ethol. Ecol. Evol. 2022, 35, 222–239. [Google Scholar] [CrossRef]
  74. Motta, J.C.; Num, T.; Limpo, C.; Estação, D.A.; Itirapina, E.D.E.; Martins, M.; Filho, D.; Ecologia, D.; Paulo, U.D.S. Taxa de Entrega de Almento Para Ninhego de Alectrurus tricolor Num Campo Limpo de Estacao Ecologica de Itirapina, SP. Poster Apresentado no XVIII Congr. Bras. Ornitol. 2011. Available online: https://www.researchgate.net/publication/283316318_TAXA_DE_ENTREGA_DE_ALIMENTO_PARA_NINHEGO_DE_ALECTRURUS_TRICOLOR_TYRANNIDAE_NUM_CAMPO_LIMPO_DA_ESTACAO_ECOLOGICA_DE_ITIRAPINA_SP (accessed on 24 February 2024).
  75. Bakker, K.K. The Effect of Woody Vegetation on Grassland Nesting Birds: An Annotated Bibliography. Proc. S. Dak. Acad. Sci. 2003, 82, 119–141. [Google Scholar]
  76. Da Silva, N.A.P.; Frizzas, M.R.; de Oliveira, C.M. Seasonality in Insect Abundance in the “Cerrado” of Goiás State, Brazil. Rev. Bras. Entomol. 2011, 55, 79–87. [Google Scholar] [CrossRef]
  77. Wolda, H. Seasonality of Tropical Insects. J. Anim. Ecol. 1980, 49, 277–290. [Google Scholar] [CrossRef]
  78. Kishimoto-Yamada, K.; Itioka, T. How Much Have We Learned about Seasonality in Tropical Insect Abundance since Wolda (1988)? Entomol. Sci. 2015, 18, 407–419. [Google Scholar] [CrossRef]
  79. Fujikawa, A.; Tubelis, D.P. Home Ranges and Aspects of the Natural History of the Black-Masked Finch Coryphaspiza melanotis (Gray, 1840) (Aves, Thraupidae) in Central Cerrado, Brazil. J. Nat. Hist. 2019, 53, 2379–2395. [Google Scholar] [CrossRef]
  80. Billerman, S.; Keeny, B.; Rodewald, P.; Schulenberg, T. (Eds.) Birds of the World; Cornell Laboratory of Ornithology: Ithaca, NY, USA, 2021; Available online: https://birdsoftheworld.org/bow/home (accessed on 3 April 2024).
  81. Andren, H. Effects of landscape composition on predation rates at habitat edges. In Mosaic Landscapes and Ecological Processes; Springer: Dordrecht, The Netherlands, 1995; pp. 225–255. ISBN 9788490225370. [Google Scholar]
  82. Siebert, F.; Morris, C.; Chamane, S.; Siebert, S. The Functional Importance of Forbs in Grassland Ecosystems. In Proceedings of the XXIV International Grassland Congress/XI International Rangeland Congress, Virtual, 25–29 October 2021; pp. 1–4. [Google Scholar]
  83. Brandt, M.J.; Cresswell, W. Breeding Behaviour, Home Range and Habitat Selection in Rock Firefinches Lagonosticta sanguinodorsalis in the Wet and Dry Season in Central Nigeria. IBIS 2008, 150, 495–507. [Google Scholar] [CrossRef]
  84. Dean, W.R.J. The Distribution and Biology of Nomadic Birds in the Karoo, South Africa. J. Biogeogr. 1997, 24, 769–779. [Google Scholar] [CrossRef]
  85. Morton, S.R.; Davies, P.H. Food of the Zebra Finch Poephila guttata, and an Examination of Granivory in Birds of the Australian Arid Zone. Aust. J. Ecol. 1983, 8, 235–243. [Google Scholar] [CrossRef]
  86. Fuhlendorf, S.D.; Harrell, W.C.; Engle, D.M.; Hamilton, R.G.; Davis, C.A.; Leslie, D.M. Should Heterogeneity Be the Basis for Conservation? Grassland Bird Response to Fire and Grazing. Ecol. Appl. 2006, 16, 1706–1716. [Google Scholar] [CrossRef] [PubMed]
  87. Fuhlendorf, S.D.; Engle, D.M. Restoring Heterogeneity on Rangelands: Ecosystem Management Based on Evolutionary Grazing Patterns. Bioscience 2001, 51, 625. [Google Scholar] [CrossRef]
  88. Hovick, T.J.; Dwayne Elmore, R.; Fuhlendorf, S.D. Structural Heterogeneity Increases Diversity of Non-Breeding Grassland Birds. Ecosphere 2014, 5, 1–13. [Google Scholar] [CrossRef]
  89. López-mársico, L.; Lezama, F.; Altesor, A. Heterogeneity Decreases as Time since Fire Increases in a South American Grassland. Appl. Veg. Sci. 2020, 24, e12521. [Google Scholar] [CrossRef]
  90. Bond, W.J.; Keeley, J.E. Fire as a Global “Herbivore”: The Ecology and Evolution of Flammable Ecosystems. Trends Ecol. Evol. 2005, 20, 387–394. [Google Scholar] [CrossRef] [PubMed]
Figure 1. Results of the Principal Component Analysis showing PC1: Floodplain gradient (a +ve score on this axis indicates a preference for areas of the floodplain that are heavily inundated during the wet season) plotted against (A) PC2: Forb-rich seeding gradient (a −ve score on this axis indicates a preference for forb-rich grassland with abundant seeding/fruiting forbs and shrubs); (B) PC3: Tall seeding grassland gradient (a +ve score on this axis indicates a preference for tall grassland or grassland with abundant seeding grasses); (C) PC4: Openness gradient (a +ve score on this axis indicates a preference for more densely wooded grassland); (D) PC5: Woody shrub gradient (a +ve score on this axis indicates a preference for grassland with abundant woody shrubs). See Results for detailed descriptions of each PC axis. Ellipses represent centroid values for each species and their standard deviation from the mean.
Diversity 16 00229 g001
Figure 2. Forest plots showing results from occupancy modeling for (A) Cock-tailed Tyrant; (B) Black-masked Finch; and (C) Wedge-tailed Grass-finch. For (B,C), (i) shows the continuous variables from the model and (ii) shows the categorical variables. Note differences in scale for odds ratios used in (i) versus (ii). Dots show point estimates for each variable. Lines are 95% confidence intervals (95% CI). Variables with 95% CIs overlapping 1 are non-significant; variables with 95% CIs that do overlap 0 are significant. Estimates > 1 represent a positive effect of the variable, and estimates < 1 a negative effect. The abundance of categorical variables is shown as low, medium, and high as data were ordinal (see Methods for details).
Diversity 16 00229 g002
Figure 3. Effects plots from occupancy modeling for Cock-tailed Tyrants (A,B), Black-masked Finch (C,D), and Wedge-tailed Grass-finch (E,F). Plots visualize the predicted probability of occupancy as a function of significant model variables. For Black-masked Finch and Wedge-tailed Grass-finch plots D and F are distinguished from C and E by the presence of low levels of woody shrubs.
Diversity 16 00229 g003
Table 1. Physiognomic divisions (habitats) mapped across the semi-alturas and bajios of Barba Azul Nature Reserve (BANR). The estimated area of each habitat is shown alongside the total length of transects walked in each habitat type. The final effort is double the length since all transects were walked twice.
HabitatArea (km2)Length (km)Effort (km)Description
campo cerrado0.762.344.68Lightly wooded grassland with shrubs and trees, ranging 2–5 m in height and not exceeding 15% cover
campo sujo3.2613.6627.32Grassland, with scattered shrubs and occasional small trees not exceeding 2% cover
campo limpo23.712.625.2Grassland with occasional shrubs that do not grow taller that the surrounding vegetation and in which tall woody plants are completely absent
Derived from [46,47,48].
Table 2. Estimated density (D) as individuals per km2 and population size (N) of study species within the grasslands of BANR stratified by habitat type. Sample size (n) as clusters is shown, in addition to standard error (SE), 95% lower and upper confidence intervals (LCLs and UCLs, respectively), the coefficient of variation (CV) for density and abundance estimates, and species encounter rates (ERs) per km2. Totals represent global density and abundance estimates for the site. The latter are based on the estimated area of available habitat on site.
Density Population Size
Habitatn D SELCLUCL NSELCLUCL CVER
Cock-tailed Tyrant
campo limpo23 14.95.96.932.0 353139164758 0.390.9
limpo + sujo23 7.13.2316.9 1938881458 0.450.4
Black-masked Finch
campo cerrado6 21.09.45.481.0 167462 0.451.1
campo sujo40 25.3417.8 35.8 821458117 0.171.5
campo limpo28 25.2813.4 47.5 5981903171127 0.321.1
Total74 25.1-14.443.7 696-4001212 0.331.3
Wedge-tailed Grass-finch
campo cerrado10 34.614.511111 2611884 0.422.1
campo sujo36 27.06.416.843.3 882155141 0.271.3
campo cimpo37 27.95.119.539.9 661120462946 0.181.5
Total83 27.9-20.238.8 776-5591076 0.171.5
Table 3. Results of the Principal Components Analysis (PCA), showing key variables identified as indicators for the interpretation of axes, alongside the direction of their relationship (Sign) and factor loading (FL) scores. For each individual axis, the correlation (Cor) between variables and the percent variance (% Var) explained are indicated. A shared letter indicates a correlation > 0.5. Independent variables selected to parameterize species occupancy models are indicated with an asterisk (*).
PCA AxisEcological DescriptionIndicator VariablesSignFLCor% Var
PC1Flooding gradientFreq. of large termite mounds *0.66a19.5%
Freq. of small termite mounds+0.62a
Freq. conical termite mounds *+0.59b
Freq. of round termite mounds0.53b
Surales height *+0.51c
PC2Forb-rich seedy gradientFreq. of seeding/fruiting forbs/shrubs *0.80d14.2%
Freq. of forbs0.78d
PC3Tall seedy grassland gradientMean grass height *+0.75e12.4%
Freq. of seeding grasses *+0.64f
PC4Openness gradientDistance to nearest tree *0.79g11.4%
Freq. of small termite mounds+0.56a
PC5Shrubby gradientFreq. of woody shrubs *+0.52h9.7%
Table 4. Results of model selection for binomial occupancy models. Model averaging was used to derive parameter estimates and confidence intervals from all models with a ΔAIC < 2. Relative model weights (AIC and ΔAIC) and model likelihood (MLik) are reported alongside pseudo-R2 (PR2), dispersion parameters (DPs), and results of the Hosmer–Lemeshow goodness-of-fit tests. The latter include the chi2 statistic (χ2) degrees of freedom (df) and p-value (p) for the test.
Hos–Lem
ModelAICΔAICMLikPR2DPχ2dfp
Cock-tailed Tyrant
Occupancy ~ mean grass height + distance to nearest tree120.20.01.000.250.866.680.58
Occupancy ~ surales height + mean grass height + distance to nearest tree121.41.30.530.260.813.880.91
Occupancy ~ surales height + conical termites + mean grass height + distance to nearest tree124.35.10.08-----
Occupancy ~ 1154.234.14.4e−8-----
Black-masked Finch
Occupancy ~ surales height + seeding forbs or shrubs + mean grass height + woody shrubs291.40.01.000.200.954.580.81
Occupancy ~ surales height + seeding forbs or shrubs + mean grass height+ distance to nearest tree + woody shrubs 293.11.70.430.210.957.980.45
Occupancy ~ surales height + large termites + seeding forbs or shrubs + mean grass height+ distance to nearest tree + woody shrubs297.66.20.04-----
Occupancy ~ 1347.355.97.1e−13-----
Wedge-tailed Grass-finch
Occupancy ~ large termites + mean grass height + seeding grass + woody shrubs311.30.01.000.220.981.480.99
Occupancy ~ surales height + large termites + mean grass height + seeding grass + woody shrubs312.41.10.590.220.972.780.95
Occupancy ~ surales height + large termites + mean grass height + seeding grass + distance to nearest tree + woody shrubs314.22.90.24-----
Occupancy ~ 1373.061.73.9e−14-----
Table 5. Parameter beta (β) estimates, standard errors (SEs), lower and upper confidence limits (LCLs and UCLs, respectively), z-scores (z), and p-values (p) for binomial occupancy models. Significance codes: ‘***’ p < 0.001, ‘**’ p < 0.01, ‘*’ p < 0.05, ‘.’ p < 0.1, ‘ ’ p > 0.1.
VariableβSELCLUCLzp
cock-tailed tyrant
Intercept−8.31.5−11.2−5.45.6***
Mean Grass Height5.3e−031.5e−032.2e−038.3e−033.4***
Distance to Nearest Tree3.9 e−021.3e−021.4e−026.5e−023.0**
Surales Height9.7e−042.3e−03−3.5e−039.1e−030.4
black-masked finch
Intercept−5.00.7−6.4−3.66.9***
Surales Height−3.4e−032.0e−03−7.3e−035.1e−041.7.
Seeding/Fruiting Forbs/Shrubs (Low)0.83.6e−014.9e−021.52.1*
Seeding/Fruiting Forbs/Shrubs (Med)1.10.40.22.02.4*
Seeding/Fruiting Forbs/Shrubs (High)0.50.7−0.82.00.8
Mean Grass Height5.6e−039.5e−043.7e−37.4e−035.8***
Woody Shrubs (Low)3.01.20.65.32.5*
Woody Shrubs (High)−1.3e1.2−3.81.11.1
Distance to Tree3.6e−035.5e−03−7.3e−031.4e−020.6
wedge-tailed grass finch
Intercept−4.80.8−6.4−3.25.9***
Large Termites (Low)−1.00.8−2.60.61.2
Large Termites (Med)1.20.6−0.12.41.8.
Large Termites (High)0.30.4−0.41.10.9
Mean Grass Height4.4e−039.6e−032.5e−036.3e−034.6***
Seeding Grass (Low)−0.70.7−2.10.71.0
Seeding Grass (Med)1.20.60.12.32.1*
Seeding Grass (High)1.20.50.12.32.2*
Woody Shrubs (Low)3.11.20.75.52.5*
Woody Shrubs (High)−0.71.2−3.11.70.6
Surales Height−2.1e−031.9e−03−6.0e−031.8e−031.0
Disclaimer/Publisher’s Note: The statements, opinions and data contained in all publications are solely those of the individual author(s) and contributor(s) and not of MDPI and/or the editor(s). MDPI and/or the editor(s) disclaim responsibility for any injury to people or property resulting from any ideas, methods, instructions or products referred to in the content.

