
The Effect of Rainfall on the Population Densities and Community Structure of Birds in an Urbanized Zambezi Riparian Forest

Abstract
:1. Introduction
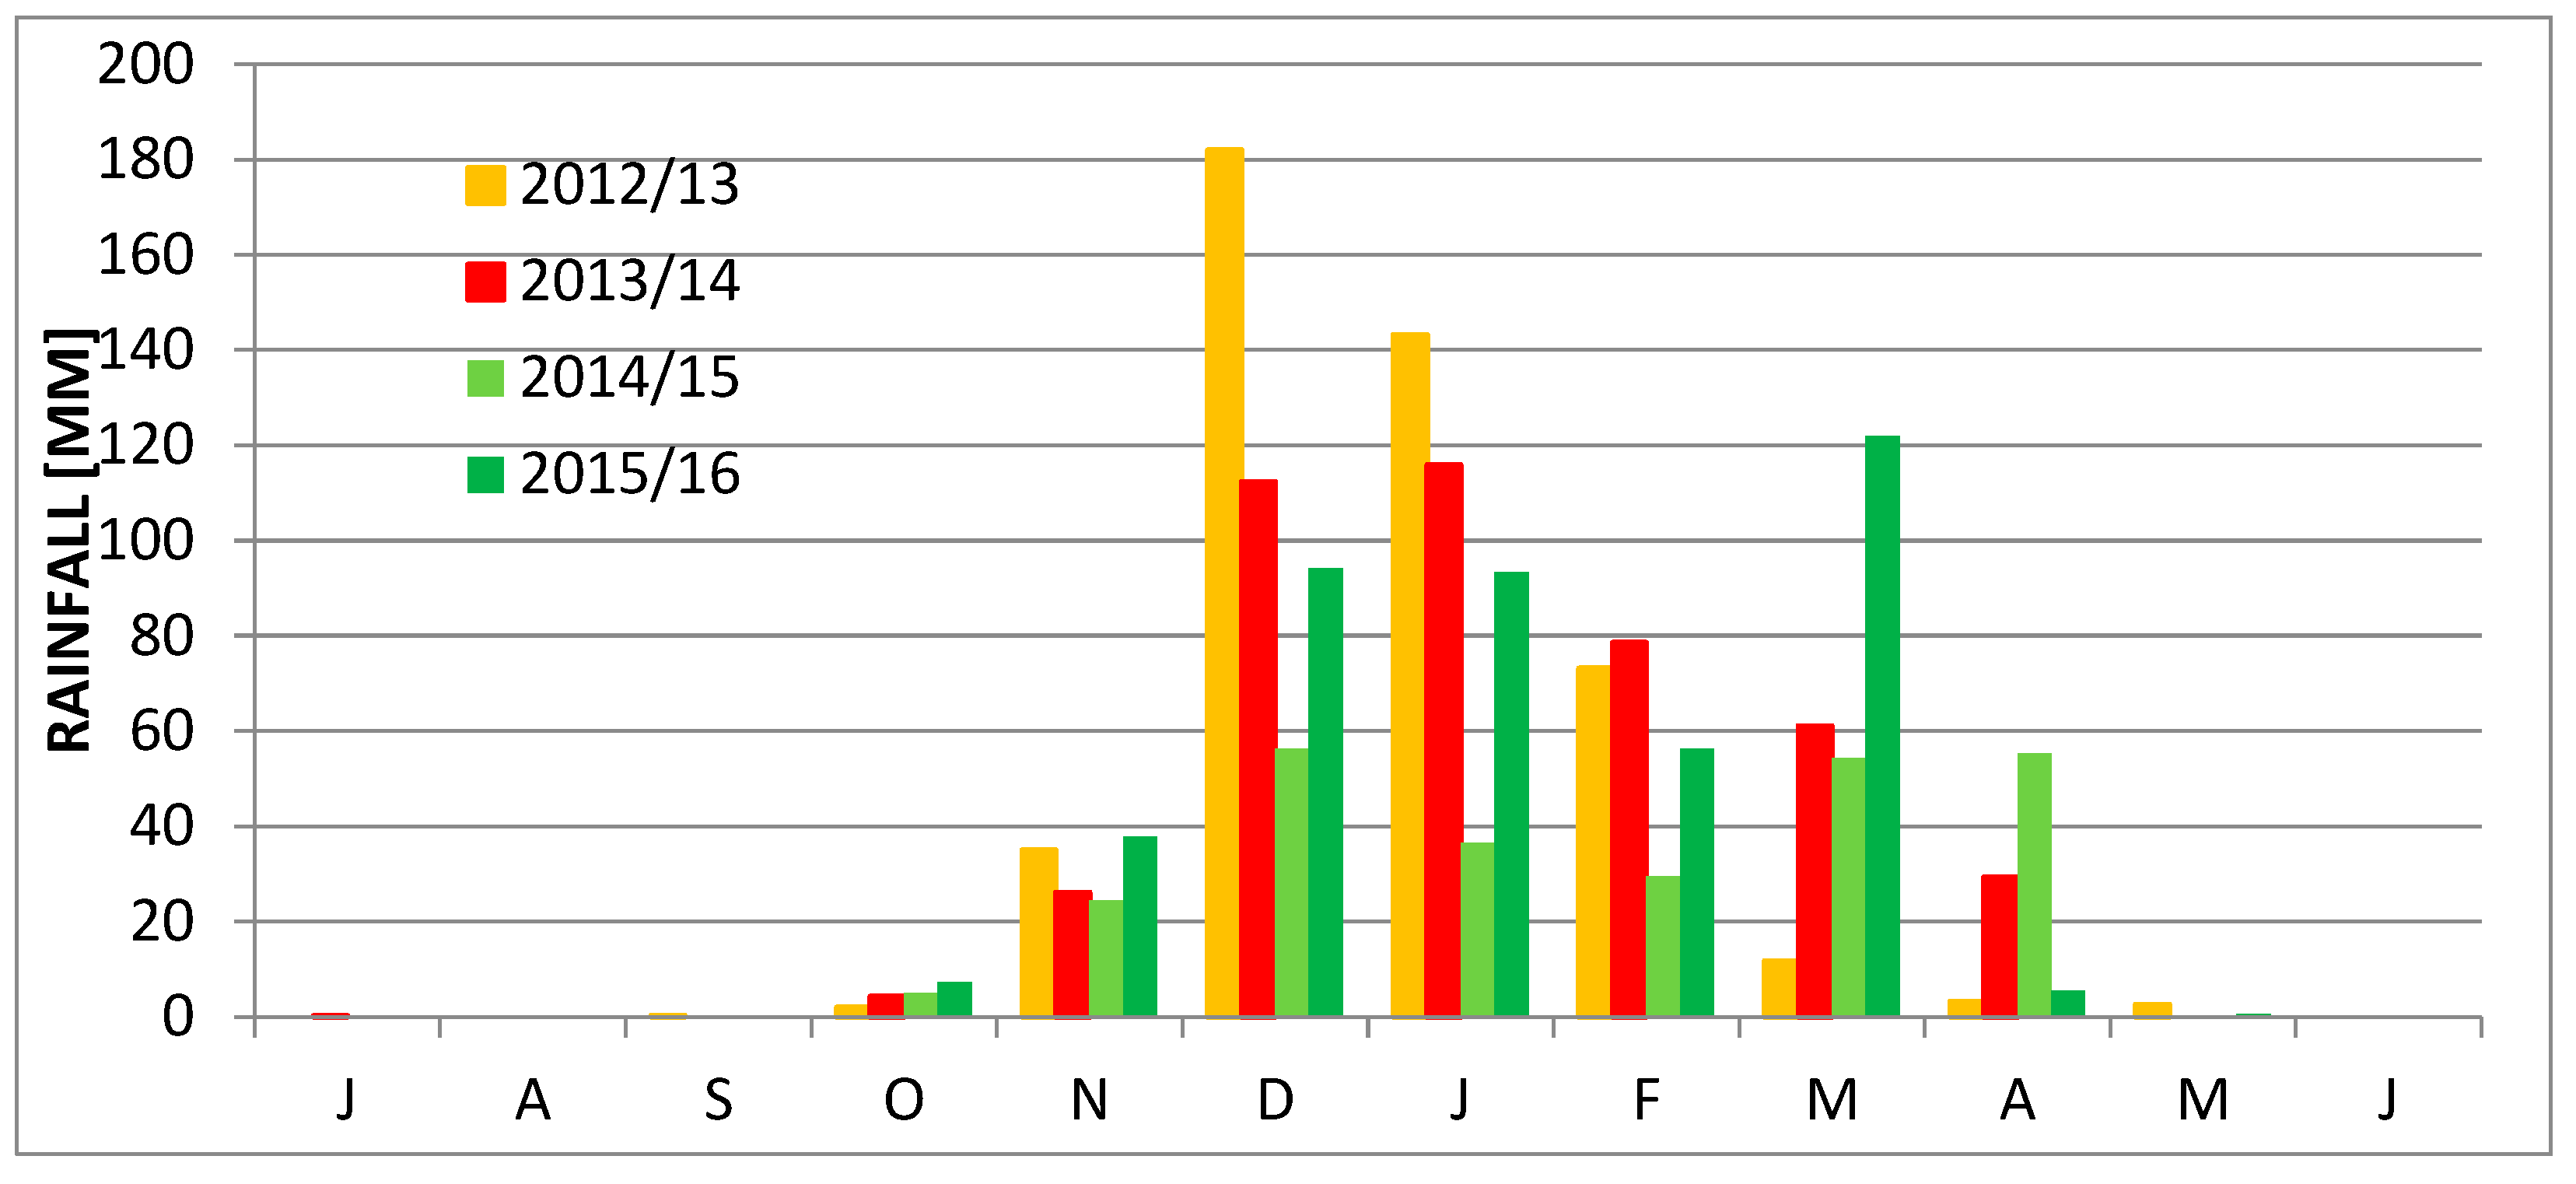
2. Study Area
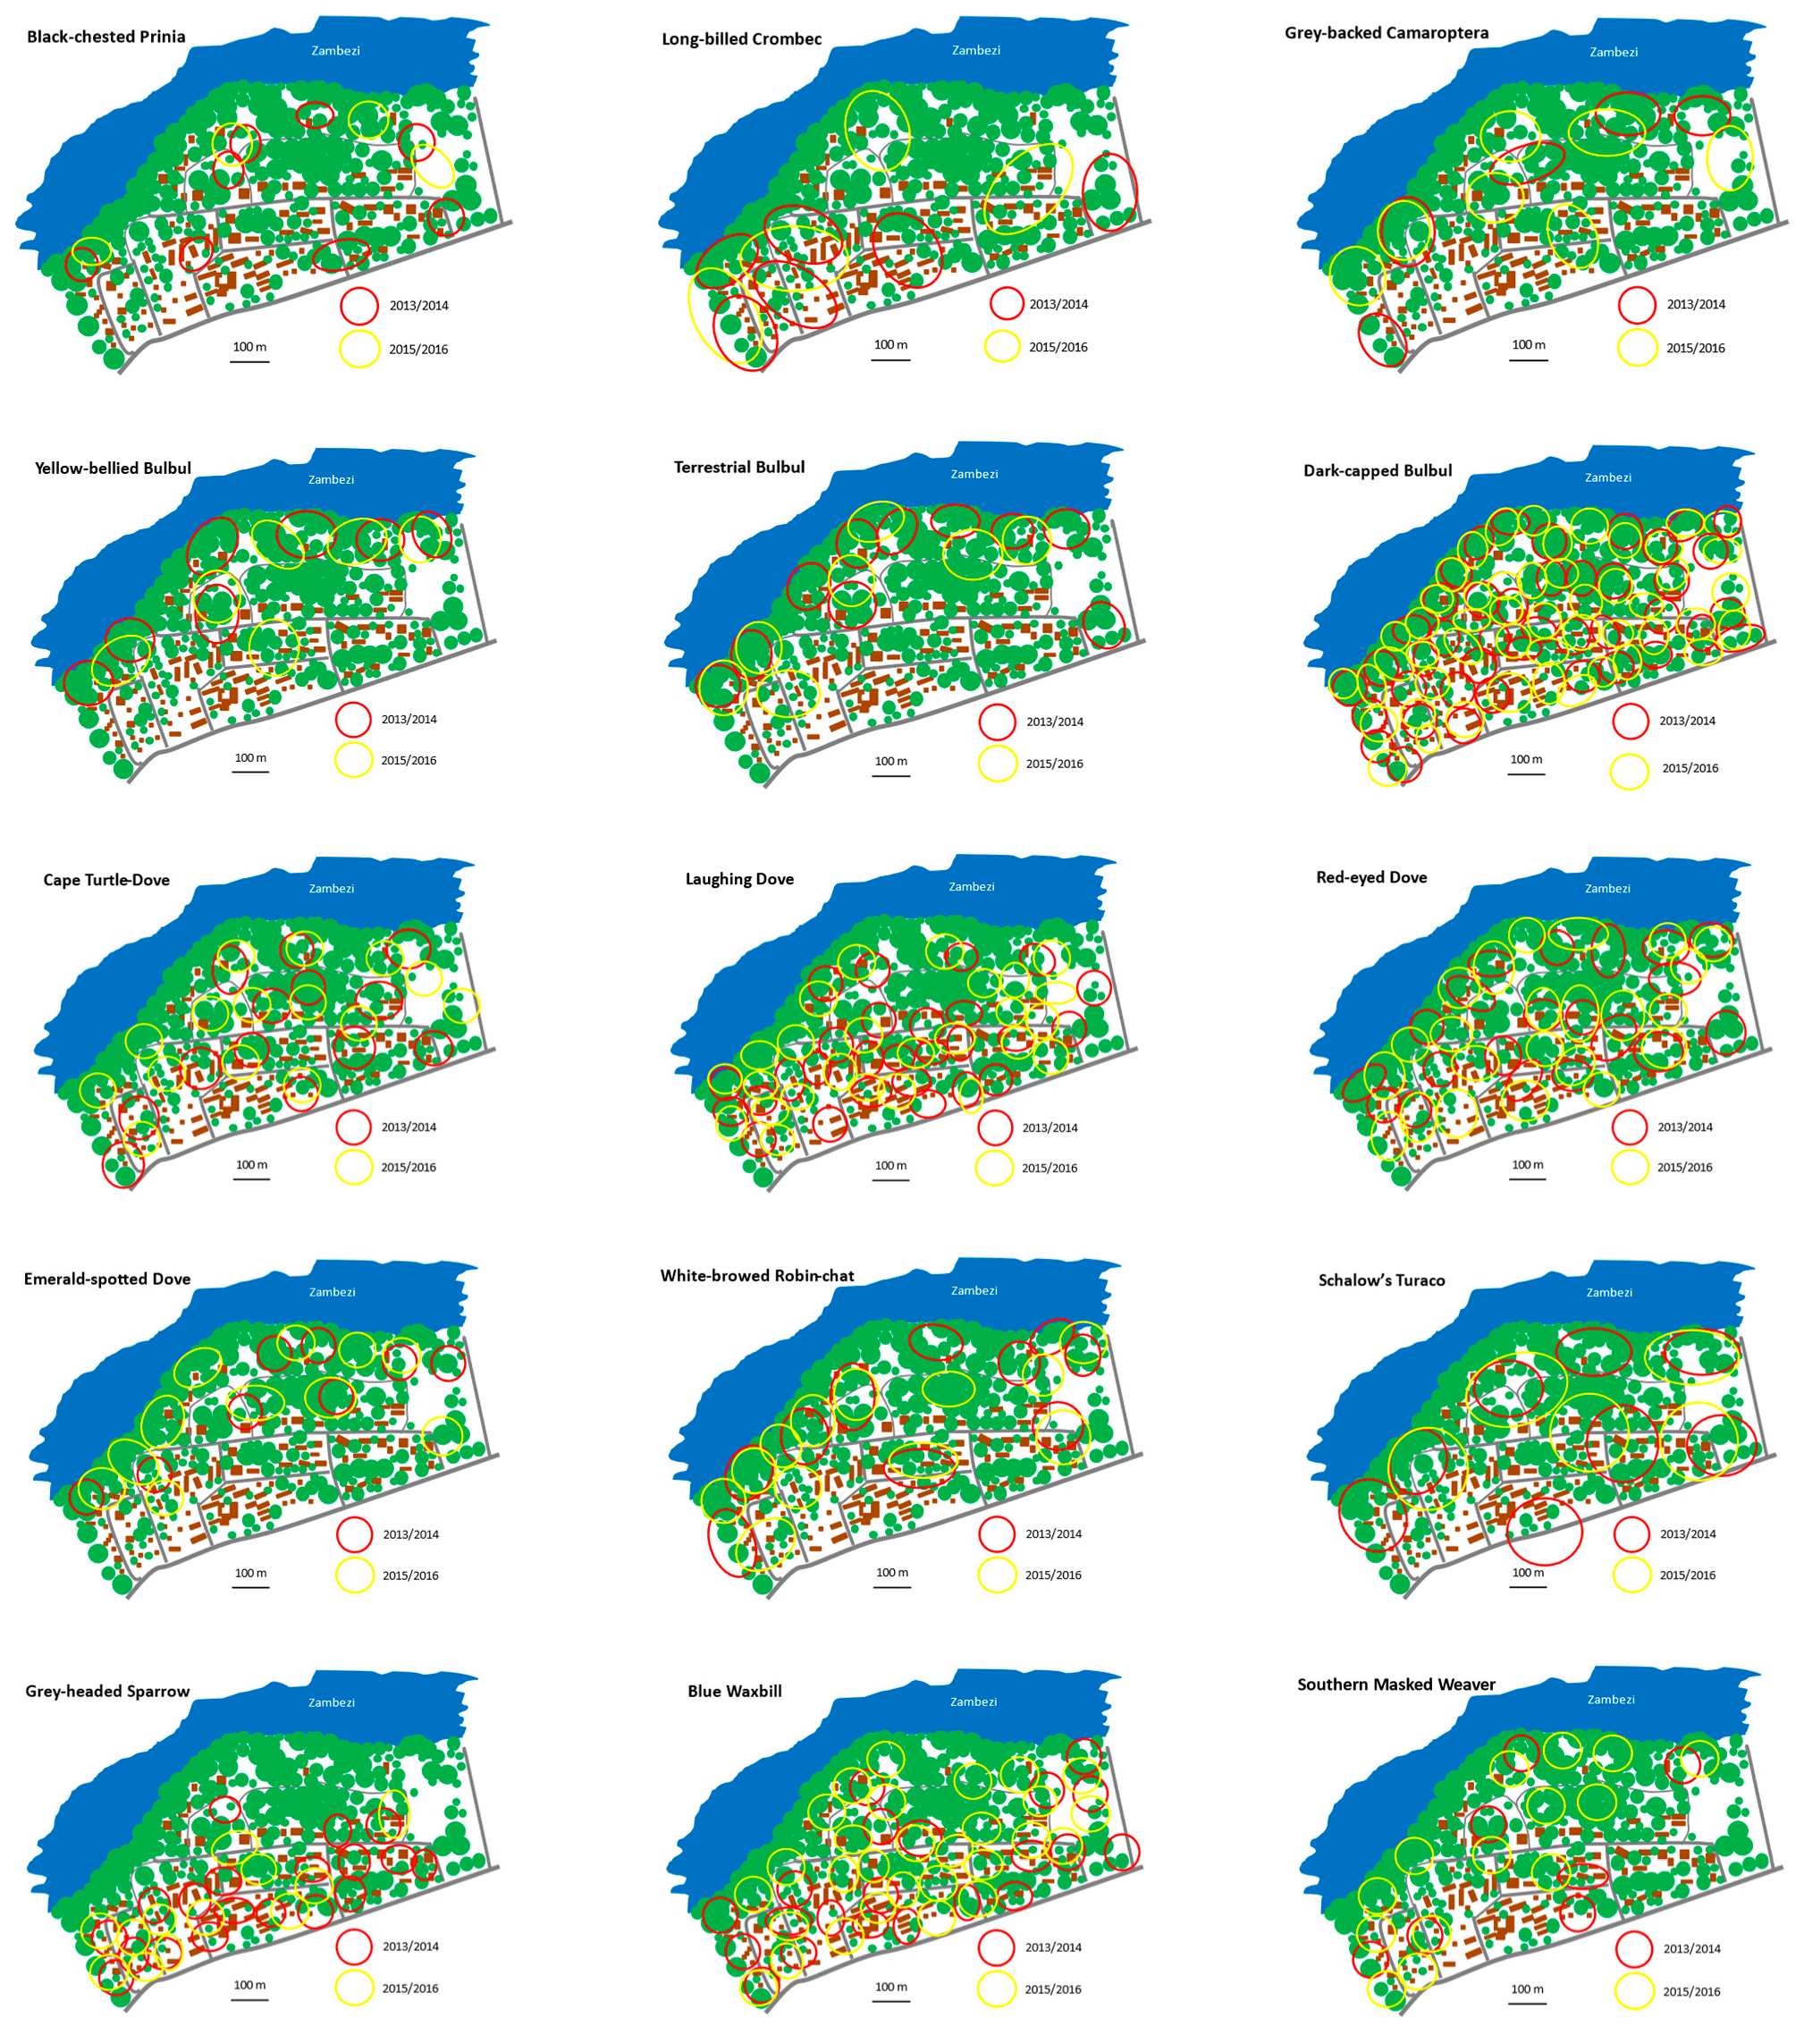
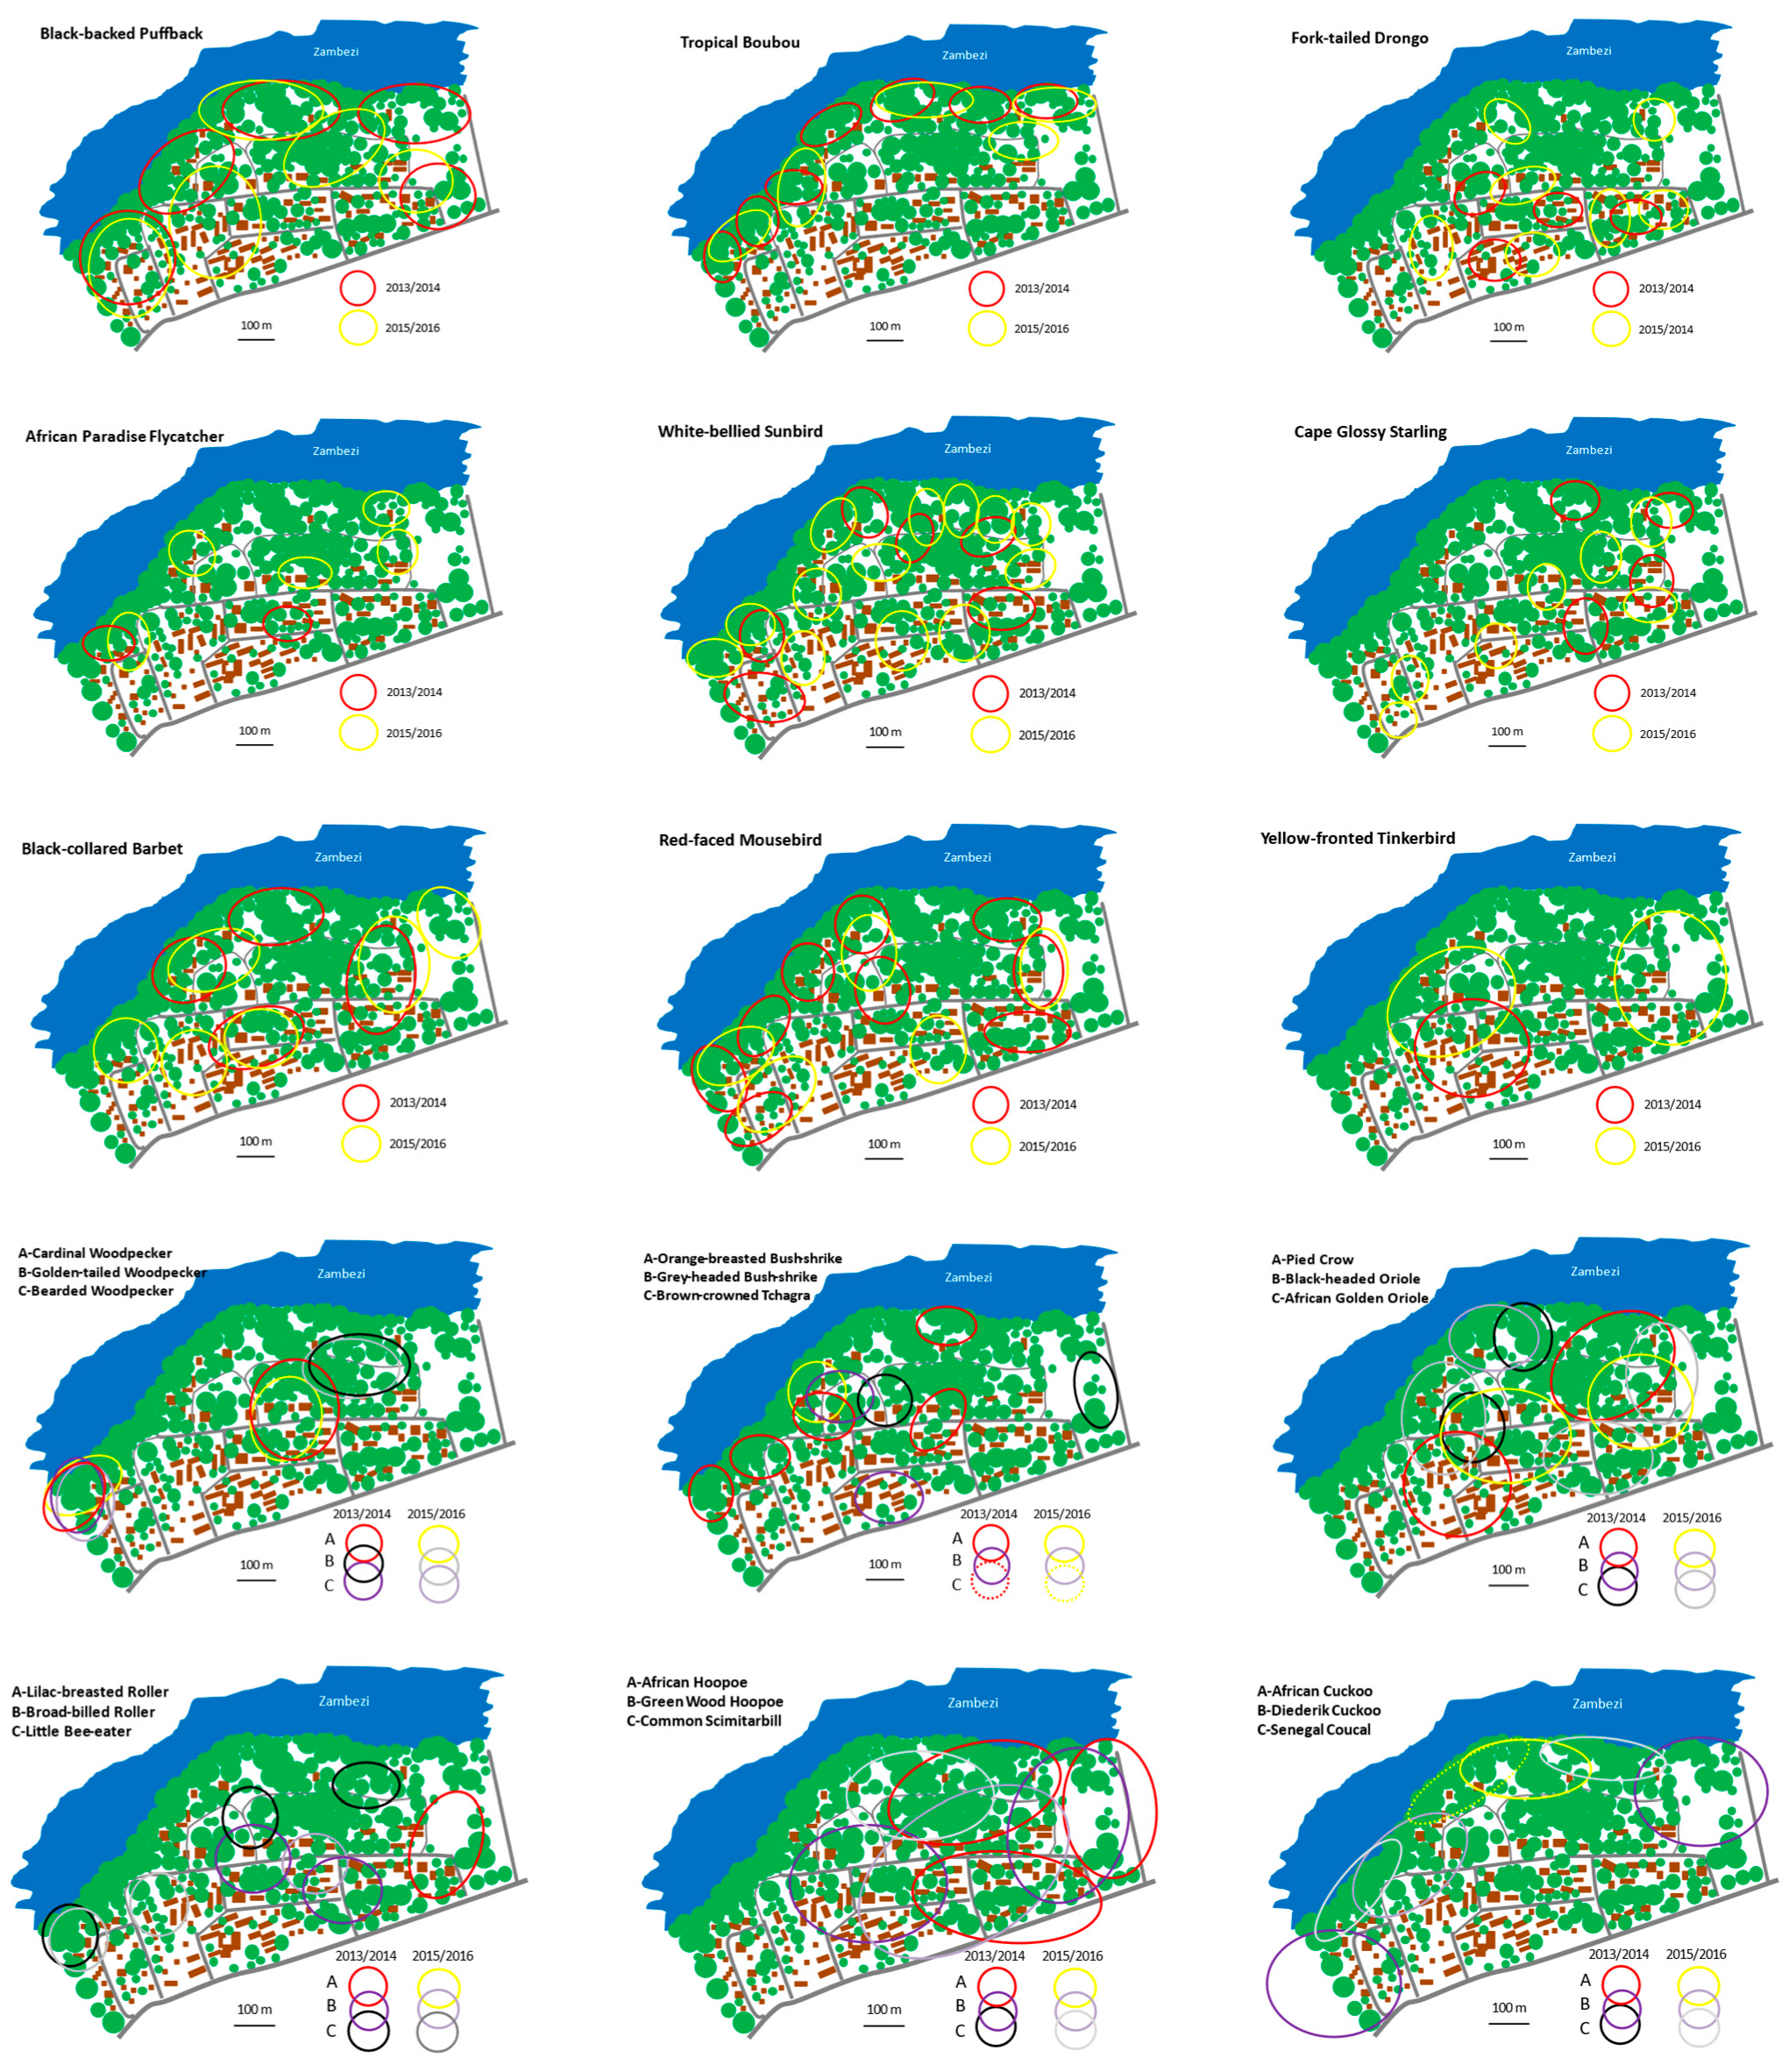
3. Methods
- Diet: G—granivorous, I—insectivorous, F—frugivorous, N—nectarivorous, and R—carnivorous.
- Nesting: T—in trees or shrubs, H—in holes, B—in/on buildings, and V—herbaceous vegetation.
- Habitat: F—forest interior, E—ecotone (forest/open area), and O—‘open’ area (grassland/savanna).
- Residency: R—resident throughout the year, A—intra-African migrant, and C—nomad.
- where: pi is the proportion of breeding pairs belonging to the ith species
- where: n—the total number of breeding pairs belonging to a given species and N—the total number of breeding pairs of all species
- where: pi is the proportion of breeding pairs belonging to the ith species and S is the total number of species. J’ varies between 0 and 1. The less variation between species in a community, the higher J’ is.
- where: n1, n2—number of pairs of the two most abundant species and N—the total number of pairs of all species.
- where: A—the number of bird species in one breeding season, B—the number of bird species in another breeding season, and C—the number of bird species common to both breeding seasons.
4. Results
5. Discussion
Funding
Institutional Review Board Statement
Data Availability Statement
Conflicts of Interest
Appendix A
| Species | 2013/14 | 2015/16 | ||||
| N | D | %D | N | D | %D | |
| Accipiter badius | 1 | 1.9 | 0.3 | 0 | 0 | 0.0 |
| Accipiter minullus | 1 | 1.9 | 0.3 | 1 | 1.9 | 0.2 |
| Accipiter tachiro | 1 | 1.9 | 0.3 | 1 | 1.9 | 0.2 |
| Amaurornis flavirostris | 1 | 1.9 | 0.3 | 1 | 1.9 | 0.2 |
| Amblyospiza albifrons | 5 | 9.3 | 1.4 | 4 | 7.4 | 1.0 |
| Apalis flavida | 2 | 3.7 | 0.5 | 2 | 3.7 | 0.5 |
| Apus affinis | 5 | 9.3 | 1.4 | 5 | 9.3 | 1.2 |
| Batis molitor | 2 | 3.7 | 0.5 | 2 | 3.7 | 0.5 |
| Bostrychia hagedash | 1 | 1.9 | 0.3 | 1.5 | 2.8 | 0.4 |
| Bubo africanus | 1 | 1.9 | 0.3 | 1 | 1.9 | 0.2 |
| Buphagus erythrorhynchus | 0 | 0.0 | 0.0 | 0.5 | 0.9 | 0.1 |
| Butorides striata | 1 | 1.9 | 0.3 | 1 | 1.9 | 0.2 |
| Bycanistes bucinator | 1 | 1.9 | 0.3 | 2 | 3.7 | 0.5 |
| Camaroptera brevicaudata | 5 | 9.3 | 1.4 | 7 | 13 | 1.7 |
| Campethera abingoni | 1 | 1.9 | 0.3 | 1 | 1.9 | 0.2 |
| Centropus senegalensis | 1 | 1.9 | 0.3 | 2 | 3.7 | 0.5 |
| Centropus superciliosus | 1 | 1.9 | 0.3 | 0 | 0.0 | 0.0 |
| Cercopis abyssinica | 0 | 0.0 | 0.0 | 4 | 7.4 | 1.0 |
| Cercopis cucullata | 0 | 0.0 | 0.0 | 3 | 5.6 | 0.7 |
| Ceryle rudis | 1 | 1.9 | 0.3 | 1 | 1.9 | 0.2 |
| Chalcomitra senegalensis | 2 | 3.7 | 0.5 | 1 | 1.9 | 0.2 |
| Chlorocichla flaviventris | 6 | 11.1 | 1.6 | 7 | 13 | 1.7 |
| Chlorophoneus sulfureopectus | 4 | 7.4 | 1.1 | 3 | 5.6 | 0.7 |
| Chrysococcyx caprius | 1.5 | 2.8 | 0.4 | 1.5 | 2.8 | 0.4 |
| Cinnyricinclus leucogaster | 4 | 7.4 | 1.1 | 3 | 5.6 | 0.7 |
| Cinnyris mariquensis | 3 | 5.6 | 0.8 | 2 | 3.7 | 0.5 |
| Cinnyris talatala | 6 | 11.1 | 1.6 | 13 | 24.1 | 3.2 |
| Circaetus cinerascens | 0 | 0.0 | 0.0 | 0.5 | 0.9 | 0.1 |
| Cisticola cheniana | 0 | 0.0 | 0.0 | 3 | 5.6 | 0.7 |
| Coracias caudatus | 1 | 1.9 | 0.3 | 1 | 1.9 | 0.2 |
| Corvus albus | 2 | 3.7 | 0.5 | 2 | 3.7 | 0.5 |
| Cossypha heuglini | 10 | 18.5 | 2.7 | 12 | 22.2 | 3.0 |
| Crithagra atrogularis | 0 | 0.0 | 0.0 | 1 | 1.9 | 0.2 |
| Cuculus clamosus | 1 | 1.9 | 0.3 | 0 | 0.0 | 0.0 |
| Cuculus gularis | 0 | 0.0 | 0.0 | 1 | 1.9 | 0.2 |
| Cuculus solitarius | 0.5 | 0.9 | 0.1 | 0.5 | 0.9 | 0.1 |
| Cypsiurus parvus | 0 | 0.0 | 0.0 | 1 | 1.9 | 0.2 |
| Dendropicos fuscescens | 2.5 | 4.6 | 0.7 | 2 | 3.7 | 0.5 |
| Dendropicos namaquus | 0 | 0.0 | 0.0 | 0.5 | 0.9 | 0.1 |
| Dicrurus adsimilis | 4 | 7.4 | 1.1 | 7 | 13 | 1.7 |
| Dryoscopus cubla | 5 | 9.3 | 1.4 | 5 | 9.3 | 1.2 |
| Emberiza flaviventris | 1 | 1.9 | 0.3 | 0 | 0.0 | 0.0 |
| Estrilda astrild | 0 | 0 | 0.0 | 3 | 5.6 | 0.7 |
| Eurystomus glaucurus | 2 | 3.7 | 0.5 | 1 | 1.9 | 0.2 |
| Falco dickinsoni | 1 | 1.9 | 0.3 | 0 | 0.0 | 0.0 |
| Glaucidium perlatum | 1 | 1.9 | 0.3 | 1 | 1.9 | 0.2 |
| Halcyon leucocephala | 2 | 3.7 | 0.5 | 3.5 | 6.5 | 0.9 |
| Halcyon senegalensis | 0 | 0.0 | 0.0 | 0.5 | 0.9 | 0.1 |
| Haliaeetus vocifer | 0.5 | 0.9 | 0.1 | 0.5 | 0.9 | 0.1 |
| Hedydipna collaris | 3 | 5.6 | 0.8 | 3 | 5.6 | 0.7 |
| Hirundo smithii | 2 | 3.7 | 0.5 | 3 | 5.6 | 0.7 |
| Indicator indicator | 0 | 0.0 | 0.0 | 1 | 1.9 | 0.2 |
| Ixobrychus minutus | 1 | 1.9 | 0.3 | 1 | 1.9 | 0.2 |
| Ixobrychus sturmii | 0 | 0.0 | 0.0 | 1 | 1.9 | 0.2 |
| Kaupifalco monogrammicus | 0 | 0.0 | 0.0 | 0.5 | 0.9 | 0.1 |
| Lagonosticta nitidula | 0 | 0.0 | 0.0 | 2 | 3.7 | 0.5 |
| Lamprotonis australis | 0 | 0.0 | 0.0 | 1 | 1.9 | 0.2 |
| Lamprotornis nitens | 4 | 7.4 | 1.1 | 7 | 13 | 1.7 |
| Laniarius bicolor | 3 | 5.6 | 0.8 | 4 | 7.4 | 1.0 |
| Laniarius major | 7 | 13 | 1.9 | 5 | 9.3 | 1.2 |
| Logonosticta senegala | 1 | 1.9 | 0.3 | 1 | 1.9 | 0.2 |
| Lonchura cucculata | 2 | 3.7 | 0.5 | 2 | 3.7 | 0.5 |
| Lybius torquatus | 4 | 7.4 | 1.1 | 6 | 11.1 | 1.5 |
| Malaconotus blanchoti | 1 | 1.9 | 0.3 | 1 | 1.9 | 0.2 |
| Megaceryle maxima | 1 | 1.9 | 0.3 | 1 | 1.9 | 0.2 |
| Melaniparus cinerascens | 1 | 1.9 | 0.3 | 0 | 0.0 | 0.0 |
| Melaniparus niger | 1 | 1.9 | 0.3 | 1 | 1.9 | 0.2 |
| Merops pusillus | 3 | 5.6 | 0.8 | 2 | 3.7 | 0.5 |
| Micronisus gabar | 0 | 0.0 | 0.0 | 1 | 1.9 | 0.2 |
| Microparra capensis | 0 | 0.0 | 0.0 | 0.5 | 0.9 | 0.1 |
| Milvus aegyptius | 1.5 | 2.8 | 0.4 | 1.5 | 2.8 | 0.4 |
| Motacilla aguimp | 2 | 3.7 | 0.5 | 2 | 3.7 | 0.5 |
| Nilaus afer | 2 | 3.7 | 0.5 | 0 | 0.0 | 0.0 |
| Oriolus auratus | 1 | 1.9 | 0.3 | 3 | 5.6 | 0.7 |
| Oriolus larvatus | 2 | 3.7 | 0.5 | 1 | 1.9 | 0.2 |
| Passer diffusus | 19 | 35.2 | 5.2 | 12 | 22.2 | 3.0 |
| Phoeniculus purpureus | 2 | 3.7 | 0.5 | 2 | 3.7 | 0.5 |
| Phyllastrephus terrestris | 10 | 18.5 | 2.7 | 7 | 13 | 1.7 |
| Ploceus ocularis | 1 | 1.9 | 0.3 | 0 | 0.0 | 0.0 |
| Ploceus velatus | 7 | 13 | 1.9 | 14 | 25.9 | 3.5 |
| Ploceus xanthops | 3 | 5.6 | 0.8 | 0 | 0.0 | 0.0 |
| Ploceus xanthopterus | 2 | 3.7 | 0.5 | 3 | 5.6 | 0.7 |
| Podica senegalensis | 0.5 | 0.9 | 0.2 | 0.5 | 0.9 | 0.1 |
| Pogoniulus chrysoconus | 2 | 3.7 | 0.5 | 1 | 1.9 | 0.2 |
| Poicephalus meyeri | 1 | 1.9 | 0.3 | 1 | 1.9 | 0.2 |
| Polyboroides typus | 0.5 | 0.9 | 0.1 | 0.5 | 0.9 | 0.1 |
| Prinia flavicans | 8 | 14.8 | 2.2 | 4 | 7.4 | 1.0 |
| Prionops retzii | 1? | 1.9 | 0.3 | 0 | 0.0 | 0.0 |
| Pycnonotis tricolor | 43 | 79.6 | 11.8 | 49 | 90.7 | 12.2 |
| Rhinopomastus cyanomelas | 0 | 0.0 | 0.0 | 0.5 | 0.9 | 0.1 |
| Scopus umbretta | 1 | 1.9 | 0.3 | 1 | 1.9 | 0.2 |
| Streptopelia capicola | 13 | 24.1 | 3.6 | 15 | 27.8 | 3.7 |
| Streptopelia decipiens | 3 | 5.6 | 0.8 | 2 | 3.7 | 0.5 |
| Streptopelia semitorquata | 20 | 37 | 5.5 | 23 | 42.6 | 5.7 |
| Streptopelia senegalensis | 26 | 48.1 | 7.1 | 26 | 48.1 | 6.5 |
| Strix woodfordii | 0.5 | 0.9 | 0.1 | 0.5 | 0.9 | 0.1 |
| Sylvietta rufescens | 6 | 11.1 | 1.6 | 4 | 7.4 | 1.0 |
| Tauraco schalowi | 7.5 | 13.9 | 2.1 | 5 | 9.3 | 1.2 |
| Tchagra australis | 3 | 5.6 | 0.8 | 1 | 1.9 | 0.2 |
| Terpsiphone viridis | 3 | 5.6 | 0.8 | 5 | 9.3 | 1.2 |
| Trachyphonus vaillantii | 0 | 0.0 | 0.0 | 1 | 1.9 | 0.2 |
| Treron calvus | 2 | 3.7 | 0.5 | 1 | 1.9 | 0.2 |
| Turdoides jardineii | 1 | 1.9 | 0.3 | 3 | 5.6 | 0.7 |
| Turdus libonyana | 1 | 1.9 | 0.3 | 1 | 1.9 | 0.2 |
| Turtur afer | 0 | 0.0 | 0.0 | 1? | 1.9 | 0.0 |
| Turtur chalcospilos | 8 | 14.8 | 2.2 | 11 | 20.4 | 2.7 |
| Tyto alba | 1 | 1.9 | 0.3 | 1 | 1.9 | 0.2 |
| Upupa africana | 2 | 3.7 | 0.5 | 2 | 3.7 | 0.5 |
| Uraeginthus angolensis | 21 | 38.9 | 5.8 | 29 | 53.7 | 7.2 |
| Urocolius indicus | 9 | 16.7 | 2.5 | 5 | 9.3 | 1.2 |
| Vanellus albiceps | 0 | 0 | 0 | 2 | 3.7 | 0.5 |
| Vidua chalybeata | 2 | 3.7 | 0.5 | 0 | 0.0 | 0.0 |
| Zosterops senegalensis | 2 | 3.7 | 0.5 | 2 | 3.7 | 0.5 |
| Total | 364.5 | 678.6 | 99.9 | 403 | 750.2 | 100.0 |
References
- Nsor, C.A.; Acquah, E.; Mensah, G.; Kusi-Kyei, V.; Boadi, S. Avian community structure as a function of season, habitat type, and disturbance, in Mole National Park, Northern Region (Ghana). Int. J. Ecol. 2018, 2018, 2045629. [Google Scholar] [CrossRef]
- Azman, N.M.; Latip, N.S.A.; Sah, S.A.M.; Akil, M.A.M.M.; Shafie, N.J.; Khairuddin, N.L. Avian diversity and feeding guilds in a secondary forest, an oil palm plantation and a paddy field in riparian areas of the Keran River Basin, Perak, Malaysia. Trop. Life Sci. Res. 2011, 22, 45–64. [Google Scholar] [PubMed]
- Begon, M.; Townsend, C.R.; Harper, J.L. Ecology. From Individuals to Ecosystems, 4th ed.; Blackwell Publishing: Hoboken, NJ, USA, 2006. [Google Scholar]
- Mendelsohn, J.; Jarvis, A.; Roberts, C.; Robertson, T. Atlas of Namibia. A Portrait of the Land and Its People; Sunbird Publishers: Cape Town, South Africa, 2009. [Google Scholar]
- Brooke, R.K. The bird community of Tamarix-clad drainages, northwestern Karoo, Cape Province. Ostrich 1992, 63, 42–43. [Google Scholar]
- Monadjem, A. Population Densities and Community Structure of Birds in Riverine Forest in the Lowveld of Swaziland. Ostrich 2003, 74, 173–180. [Google Scholar] [CrossRef]
- Monadjem, A. Associations between Avian Communities and Vegetation Structure in a Low-lying Woodland-savanna Ecosystem in Swaziland. Ostrich 2005, 76, 45–55. [Google Scholar] [CrossRef]
- Seymour, C.L.; Simmons, R.E. Can severely fragmented patches of riparian vegetation still be important for arid-land bird diversity. J. Arid. Environ. 2008, 72, 2275–2281. [Google Scholar] [CrossRef]
- Fry, C.H.; Stuart, K.; Urban, E. The Birds of Africa; Academic Press: Cambridge, MA, USA, 2004; Volumes 1–7. [Google Scholar]
- Hockey, P.A.R.; Dean, W.R.J.; Ryan, P.G.; Maree, S. (Eds.) Roberts’ Birds of Southern Africa; John Voelcker Bird Book Fund: Cape Town, South Africa, 2005. [Google Scholar]
- Laurenco, A.C.P.; Toledo, M.C.B. Effects of proximity to urban areas on a riparian bird community in remnant Atlantic Forest in southeastern Brazil. Rev. Ambient. Agua 2019, 7, 1018. [Google Scholar]
- Lee, A.C.; Peres, C.A. Conservation value of remnant riparian forest corridors of varying quality for Amazonian birds and mammals. Conserv. Biol. 2007, 22, 439–449. [Google Scholar]
- Seaman, B.C.; Schulze, C.H. The importance of gallery forests in the tropical lowlands of Costa Rica for understory forest birds. Biol. Conserv. 2010, 143, 391–398. [Google Scholar] [CrossRef]
- Korei, K.; Rigert, J.; Kigl, M.; Novotny, V. Differences in bird community structure between riparian and upland zones in a New Guinea rainforest. Aust. Field Ornithol. 2023, 40, 179–195. [Google Scholar]
- Chan, E.K.W.; Yat-Tung, Y.; Zhang, Y.; Dudgeon, D. Distribution patterns of birds and insect prey in a tropical riparian forest. Biotropica 2008, 40, 623–629. [Google Scholar] [CrossRef]
- Mitchell, S.L.; Edwards, D.P.; Bernard, H.; Coomes, D.; Jucker, T.; Davies, Z.G.; Struebig, M.J. Riparian reserves help protect forest bird communities in oil pal dominated landscapes. J. Appl. Ecol. 2018, 55, 2744–2755. [Google Scholar] [CrossRef]
- Woinarski, J.C.Z.; Brock, C.; Armstrong, M.; Hempel, C.; Cheal, D.; Brennan, K. Bird distribution in riparian vegetation in the extensive natural landscape of Australian’s tropical savanna: A broad-scale survey and analysis of a distributional base. J. Biogeogr. 2000, 27, 843–868. [Google Scholar] [CrossRef]
- Palmer, G.C.; Bennett, A.F. Riparian zones provide for distinct bird assemblages in forest mosaics of South-East Australia. Biol. Conserv. 2006, 130, 447–457. [Google Scholar] [CrossRef]
- Bibby, C.J.; Burgess, N.D.; Hill, D.A.; Mustoe, S. Bird Census Techniques, 2nd ed.; Academic Press: London, UK, 2012. [Google Scholar]
- Sutherland, W.J. Ecological Census Techniques: A Handbook; Cambridge University Press: Cambridge, UK, 1996. [Google Scholar]
- Kopij, G. Birds of Katima Mulilo town, Zambezi Region, Namibia. Int. Sci. Technol. J. Namib. 2016, 7, 85–102. [Google Scholar]
- Kopij, G. Avian Assemblages in Natural and Modified Kaokoland (Mopane) Savanna in the Cuvelai Drainage System, North-central Namibia. Lanioturdus 2013, 46, 22–33. [Google Scholar]
- Kopij, G. Avian diversity in an urbanized South African grassland. Zool. Ecol. 2015, 25, 87–100. [Google Scholar] [CrossRef]
- Kopij, G. The Structure of Assemblages and Dietary Relationships in Birds in South African Grasslands; Wydawnictwo Akademii Rolniczej We Wrocławiu: Wrocław, Poland, 2006. [Google Scholar]
- Kopij, G. Seasonal Changes in Avian Assemblages in Kaokoland (Mopane) Savanna in the Ogongo Game Reserve, North-central Namibia. Int. Sci. Technol. J. Namib. 2013, 2, 44–58. [Google Scholar]
- Kopij, G. Avian Assemblages in Urban Habitats in North-central Namibia. Int. Sci. Technol. J. Namib. 2014, 3, 64–81. [Google Scholar]
- Kopij, G. Avian Communities of a Mixed Mopane-Acacia Savanna in the Cuvelai Drainage System, North-central Namibia, during the Dry and Wet Season. Vestn. Zool. 2014, 48, 269–274. [Google Scholar] [CrossRef]
- Kopij, G. Structure of avian assemblages in Zambezian Baikiaeae woodlands, northern Namibia. Zool. Ecol. 2017, 27, 1–10. [Google Scholar] [CrossRef]
- Maclean, G.L. Ornithology for Africa; University of KwaZulu Natal Press: Pietermaritzburg, South Africa, 1990. [Google Scholar]
- Turner, I.M. Species loss in fragments of tropical rain forest: A review of the evidence. J. Appl. Ecol. 1996, 33, 200–209. [Google Scholar] [CrossRef]


| Parameter | 2013/14 | 2015/16 |
|---|---|---|
| Numbers and density | ||
| Number of species | 91 | 101 |
| Number of breeding pairs | 364.5 | 403.0 |
| Overall population density (pairs/100 ha) | 678.6 | 750.2 |
| Dominance | ||
| Number of dominant species | 5 | 4 |
| Cumulative dominance (%) | 35.4 | 31.6 |
| Community dominance (DI) | 0.19 | 0.19 |
| Indices | ||
| Shannon’s Diversity Index (H’) | 3.86 | 3.76 |
| Simpson’s Diversity Index (D) | 0.97 | 0.96 |
| Pielou’s Evenness Index (J’) | 0.85 | 0.82 |
| Guild | Percentage of Pairs | Percentage of Species | ||
|---|---|---|---|---|
| 2013/14 | 2015/16 | 2013/14 | 2015/16 | |
| Feeding | ||||
| Granivores | 37.1 | 35.0 | 17.2 | 16.3 |
| Insectivores | 30.5 | 33.2 | 47.3 | 46.2 |
| Frugivores | 26.9 | 25.6 | 17.2 | 17.3 |
| Carnivores | 2.3 | 2.6 | 8.6 | 10.6 |
| Other | 1.9 | 2.5 | 7.5 | 7.7 |
| Nectarivores | 1.3 | 1.1 | 2.2 | 1.9 |
| Nesting | ||||
| Trees/shrubs | 76.6 | 75.8 | 69.2 | 59.8 |
| Holes | 10.0 | 10.7 | 20.9 | 23.4 |
| Buildings | 7.6 | 7.6 | 4.4 | 7.5 |
| Herbaceous vegetation | 5.8 | 6.6 | 5.5 | 9.3 |
| Ground | 0 | 0 | 0.0 | 0.0 |
| Habitat | ||||
| Forest | 34.0 | 34.4 | 30.8 | 32.7 |
| Ecotone | 59.8 | 56.3 | 53.8 | 47.5 |
| Open | 7.2 | 9.3 | 15.4 | 19.8 |
| Residency | ||||
| Resident | 96.2 | 95.3 | 90.1 | 89.1 |
| Intra-African migrant | 3.8 | 4.7 | 9.9 | 10.9 |
| Habitat | Region | Annual Rainfall | No. of Species | Study Period | Study Surface | Source |
|---|---|---|---|---|---|---|
| Urbanized Riparian Forest | Zambezi | 550–600 | 113 | 2013–2016 | 54 ha | This study |
| Kalahari Woodland | Zambezi | 450–550 | 88 | 2015 | 12 km | [21] |
| Mopane Savanna | North-central | 400–500 | 85 | 2011–2012 | 10 km | [22] |
| Koakoland Savanna | Kunene | 300–350 | 64 | 2011–2012 | 18 km | [23] |
Disclaimer/Publisher’s Note: The statements, opinions and data contained in all publications are solely those of the individual author(s) and contributor(s) and not of MDPI and/or the editor(s). MDPI and/or the editor(s) disclaim responsibility for any injury to people or property resulting from any ideas, methods, instructions or products referred to in the content. |
© 2023 by the author. Licensee MDPI, Basel, Switzerland. This article is an open access article distributed under the terms and conditions of the Creative Commons Attribution (CC BY) license (https://creativecommons.org/licenses/by/4.0/).
Share and Cite
Kopij, G. The Effect of Rainfall on the Population Densities and Community Structure of Birds in an Urbanized Zambezi Riparian Forest. Diversity 2023, 15, 1126. https://doi.org/10.3390/d15111126
Kopij G. The Effect of Rainfall on the Population Densities and Community Structure of Birds in an Urbanized Zambezi Riparian Forest. Diversity. 2023; 15(11):1126. https://doi.org/10.3390/d15111126
Chicago/Turabian StyleKopij, Grzegorz. 2023. "The Effect of Rainfall on the Population Densities and Community Structure of Birds in an Urbanized Zambezi Riparian Forest" Diversity 15, no. 11: 1126. https://doi.org/10.3390/d15111126