Abstract
Plankton communities often consist of cosmopolitan species with an extensive gene flow between populations. Nevertheless, populations of some plankton species are genetically structured, owing to various barriers such as ocean currents, hydrological fronts, and continents. Drivers that could explain the genetic structures of most mesopelagic species remain unknown on an ocean-basin scale, and our study aims to analyze the genetic and morphological differences between populations of a cosmopolitan mesopelagic shrimp, Systellaspis debilis, from the Southern and Northern Atlantic Ocean, and the Southwest Indian Ocean. We analyzed the ITS-1 and COI markers of 75 specimens and assessed the genetic integrity and within-species variability of these genes. We also coded 32 morphological characteristics in 73 specimens, analyzed their variability, and assessed the correlation between morphological and genetic characteristics using a Redundancy analysis and Mantel test. Systellaspis debilis was genetically cohesive across the whole Atlantic and Southwest Indian Oceans, which is possibly a result of an intensive gene flow through ecological barriers, the resistance of species to hydrological gradients, a purifying selection of mitochondrial genes, etc. In contrast, we found significant morphological differences between populations from different regions, which mirrors morphological diversification and calls for further genomic approaches in order to understand the basis of these variations and uncover potential local adaptations.
1. Introduction
Oceans cover most of the Earth’s surface area and habitat volume; the vast deep-pelagic habitat between the sunlit layers (upper 200 m) and the seafloor is the largest and least-understood environment on our planet [1,2]. This habitat contains the mesopelagic (from 200 m to ca.1000 m depth) and the deeper bathy and abyssopelagic zones. Our limited knowledge of these ecosystems is increasingly problematic as they may be vulnerable to global issues such as climate warming, deoxygenation, acidification, commercial fishing, seabed mining, and other threats with an unknown potential for feedback to the climate system [3,4]. Albeit greatly underexplored, the mesopelagic zone provides a better chance for ecosystem analyses than deeper layers that require even more time- and cost-consuming efforts. Recent analyses, based mainly on an expert opinion on the distributional patterns of pelagic fauna relative to environmental proxies, allowed a global biogeographic classification of the mesopelagic zone [2]. The same authors declared that “work remains to be done to produce a comprehensive and robust mesopelagic biogeography,” and this work should be based on numerous empirical observations of the factors driving biodiversity of individual species within the mesopelagic zone. Attention should be paid to zooplankton, which are the key element in the mesopelagic zone because they are the basic trophic link primary producers with larger predators, and abundant enough to be representatively sampled (e.g., [5,6]).
Recent studies based on genetic approaches to biodiversity showed that abiotic factors, such as circulation including subtropical ocean gyres [7,8,9,10,11,12], oceanographic gradients [13,14,15], and continental land masses [7,16,17,18,19], greatly contribute to the biodiversity of holozooplankton. Biological factors including population density [20,21,22] and behavior [11] may also drive the biogeographic structure of populations.
Studies on genetic diversity are focus on finer and promising tools for a deeper insight into pelagic biogeography; this tool, however, has so far been applied to a limited number of zooplankton species and showed that the patterns of genetic structuring of populations are species-specific [17,18,23]. In other words, we need much more research on individual species for a proper understanding of drivers that explain the true (genetic and morphological) biodiversity of the mesopelagic zone.
In this paper, we make the next, among many, step in this direction, and focus on the population structure of a cosmopolitan species, Systellaspis debilis (A. Milne-Edwards, 1881), that makes a significant contribution to mesopelagic ecosystems [24] and is the fourth most common pelagic shrimp in the Atlantic Ocean [25]. In contrast to previous studies on mesoplankton, this is a macroplanktonic decapod, a group still unexplored in this context despite their prominent role in the mesopelagic zone (40% of the total mesopelagic plankton biomass [26]). Systellaspis debilis occurs in many mesopelagic biogeographical provinces (sensu Sutton et al. [2]) in the Atlantic, Indian, and Pacific Oceans between 63° N to 58° S [27]. Such an extensive range of species always raises questions about genetic homogeneity and population structure. In this paper, we describe and analyze the genetic and morphological diversity of S. debilis in order to assess the degree of isolation between populations from various basins. Due to the high requirement of material to analyze (undamaged specimens for morphological analysis, “fresh” alcohol-fixed individuals for genetic analyses), our studies were restricted to the Northern Atlantic, Southern Atlantic, and Southwestern Indian Ocean.
We tested the hypothesis that populations of S. debilis are genetically and morphologically distinct in these three ocean basins, and analyzed the accordance of their geographic distribution with the proposed scheme of mesopelagic zonation [2]. In order to test our assumption, we assessed the distribution of genetic and morphological variability in S. debilis populations across the Atlantic and in the Southwest Indian Oceans.
2. Materials and Methods
2.1. Material
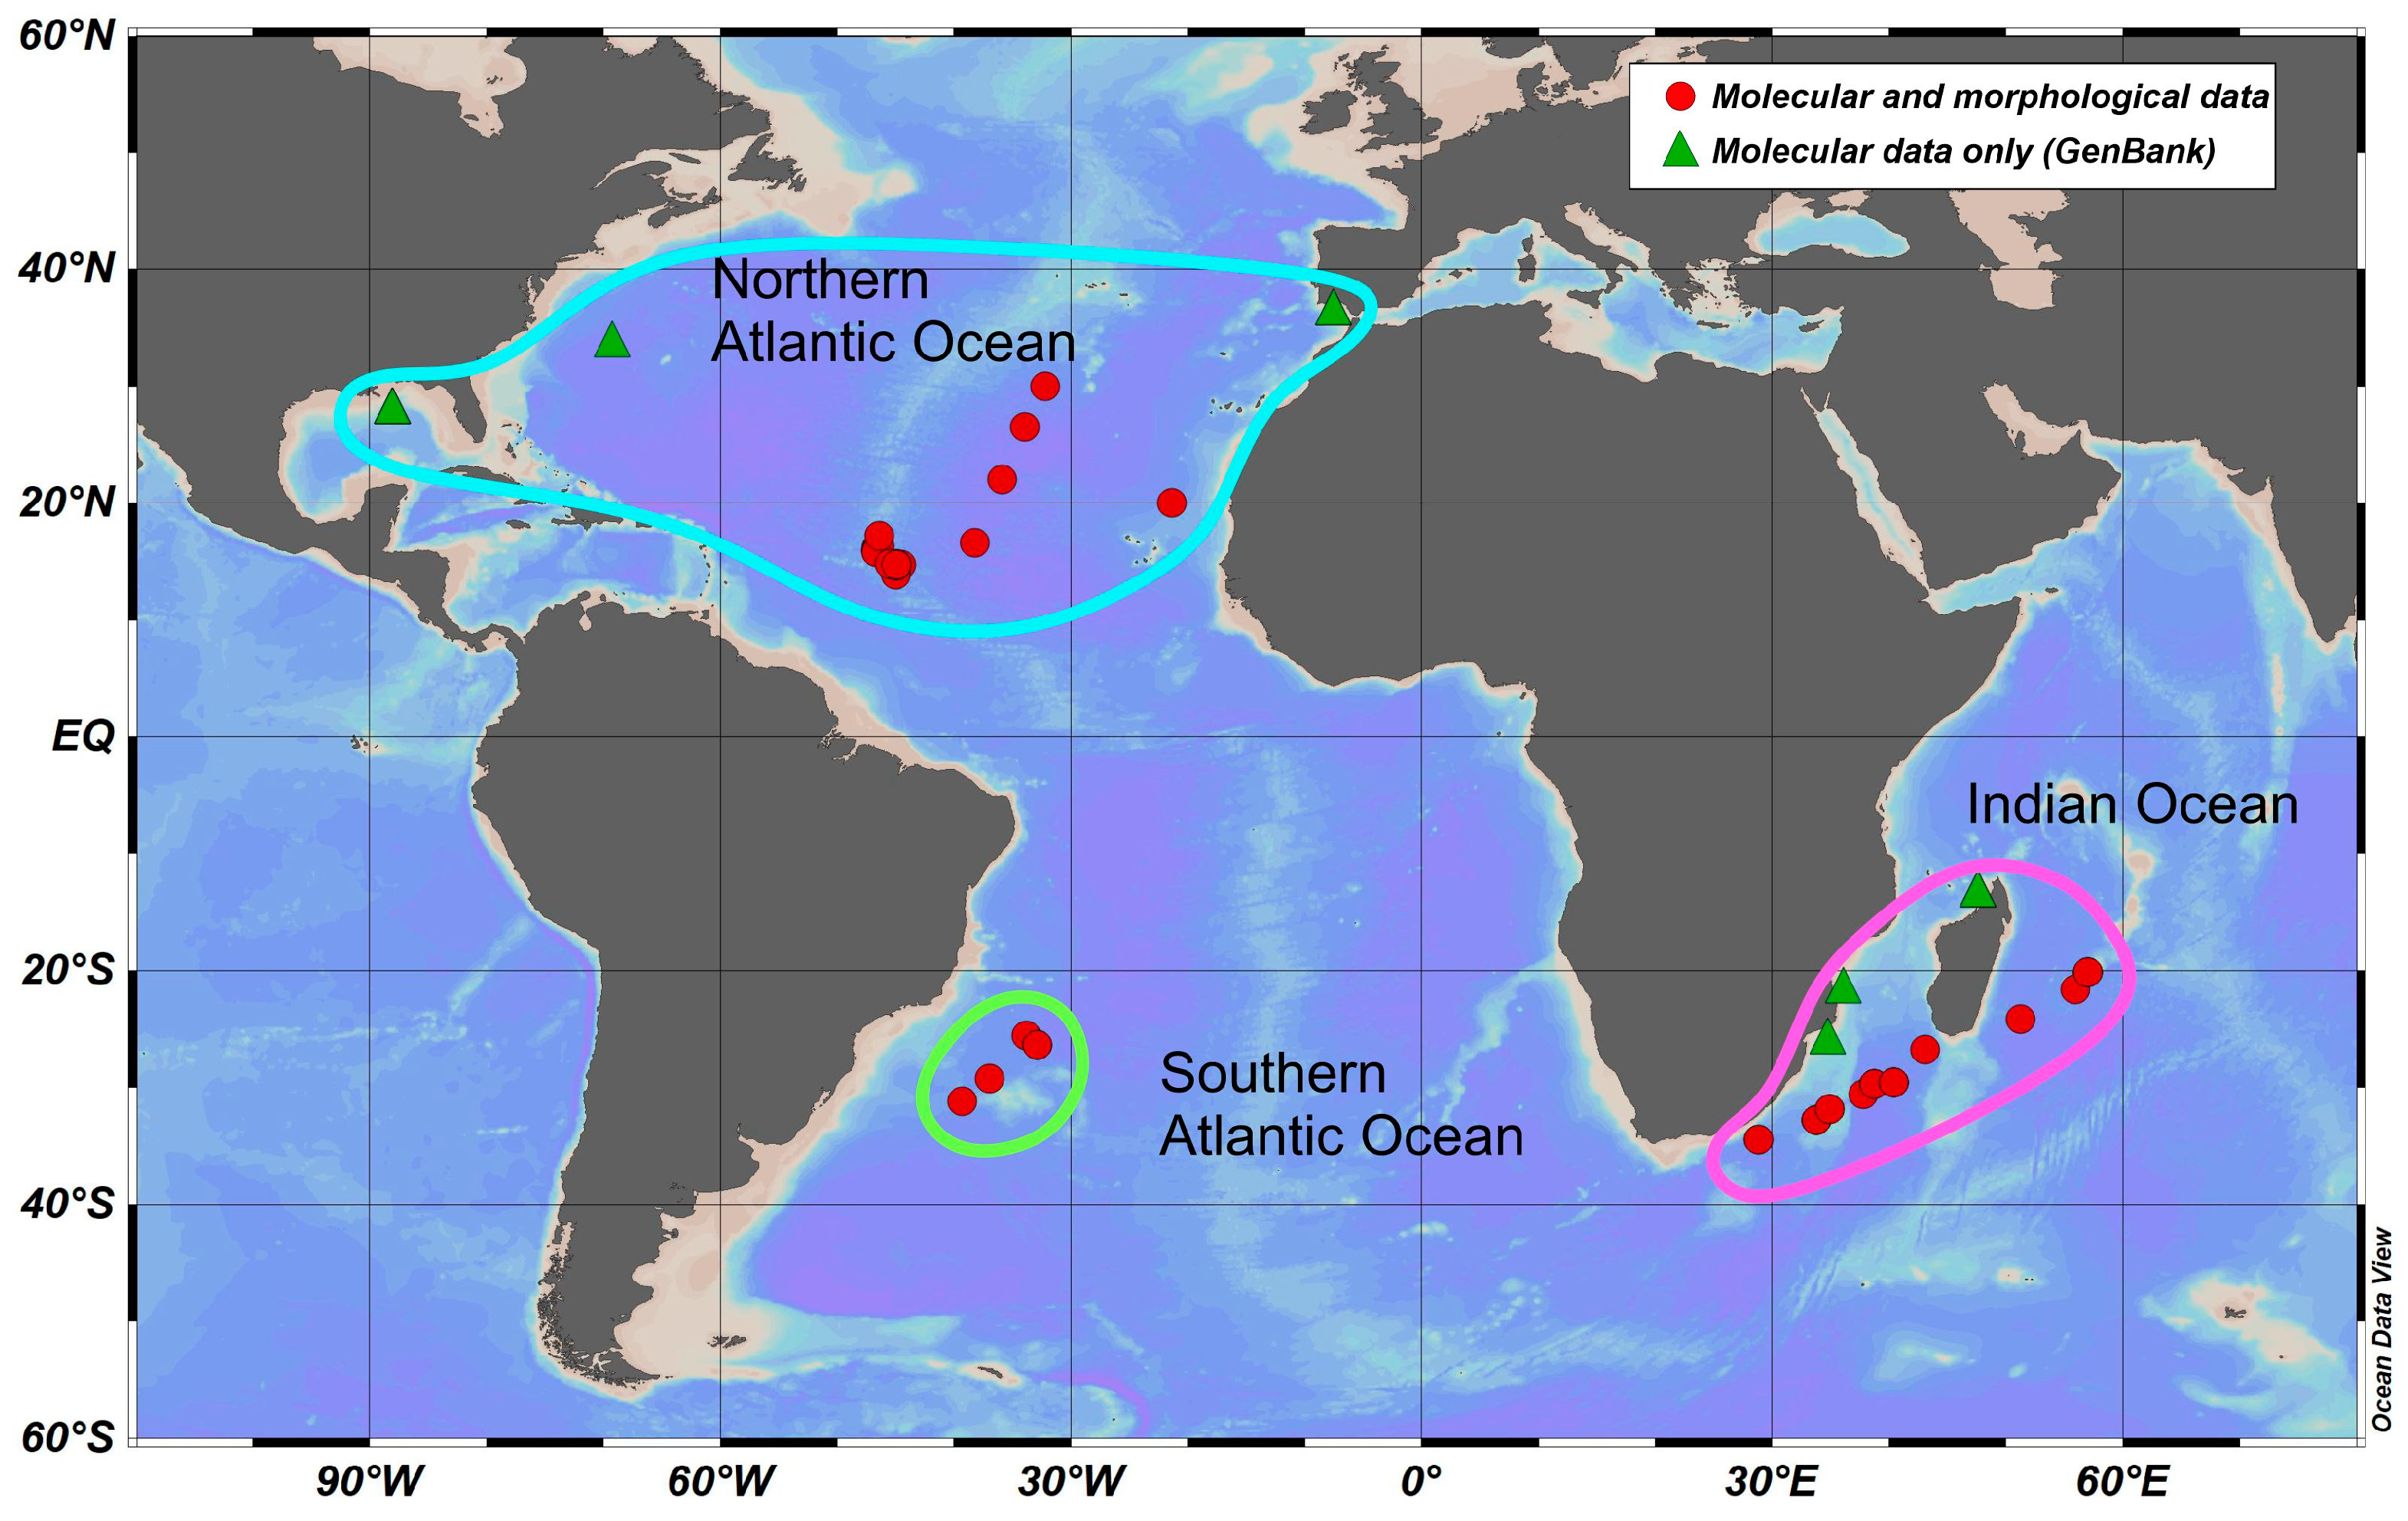
The material was collected in the Atlantic Ocean and the Southwestern Indian Ocean during cruises from 2013 to 2020 (Figure 1, Table S1) with a Bogorov–Rass plankton net (mouth area 1 m2, 500 μm mesh size) and an Isaacs–Kidd midwater trawl (mouth area 5.5 m2, mesh size 5 mm). A total of 75 specimens of S. debilis were identified using the key of Lunina et al. [28], fixed in 96% ethanol just after retrieval, and stored at −20 °C in the laboratory for further analysis. The COI gene was successfully sequenced in all of the 75 specimens in our collections (46 specimens from the North Atlantic, 5 from the South Atlantic, and 24 from the Indian Ocean); an additional 31 sequences were mined from GenBank and added to the dataset.

Figure 1.
Sampling locations of S. debilis in the Atlantic and Indian Oceans, along with their basin-scale grouping. The symbols on the map indicate the type of data used (references are on the legend).
2.2. DNA Extraction, Amplification, and Sequencing
DNA was extracted either from the fifth pair of the pleopods or from the pleonic muscle tissue using the IG-Spin™ DNA Prep 200 kit for DNA extraction following the manufacturer’s protocol. The extracted DNA was used as a matrix for the amplification of the mitochondrial cytochrome c oxidase subunit I gene fragment I (COI), and the nuclear gene of the first internal transcribed spacer (ITS1). PCR amplification of the COI gene fragment was accomplished with the universal primers LCOI 1490 (GGTCAACAAATCATAAAGATATTGG) and HCOI 2198 (TAAACTTCAGGGTGARDAAAAAATCA) [29], or decapod-specific primers COL6 (5′-ACAAATCATAAAGATATYGG-3′) and COH6 (5′-TADACTTCDGGRTGDRDAAARAAYCA-3′) in cases where the former failed. The primers ITS1FW (5’-CACACCGCCCGTCGCTACTA-3’) and ITS3R (5′-TCGACSCACGAGCCRAGTGATC-3′) [30] were used to amplify the ITS1 gene. PCR reactions were made in a reaction volume of 20 μL, containing 2.4 μL of the Encyclo Plus PCR kit (Eurogen, Russia), 0.2 μL of each primer, 1.6 μL of DNA template, 15.3 μL MilliQ water, and 0.3 μL of 50 X Encyclo polymerase (Eurogen, Russia). The PCR cycling profiles and annealing temperatures are listed in Table S2. The PCR products were purified and sequenced with the same primer sets on an ABI Prism 3500 xl genetic analyzer in the Resource Center Development of Molecular and Cellular Technologies of Saint Petersburg State University. Forward and reverse COI and ITS1 sequences were assembled in Geneious® 7.1.3. and manually treated for ambiguities and heterozygotes (in the case of ITS1). Additionally, COI sequences were checked for stop codons using Geneious® 7.1.3 software. All sequences were deposited in the NCBI GenBank database [31] (Table S1; accession numbers: OR398994–OR399068 and OR415900–OR415922).
2.3. Sequence Alignment and Phylogenetic Analyses
In addition to our material, we used all available COI sequences of S. debilis and the most closely related species, S. liui (no. KT946751), deposited in GenBank (https://www.ncbi.nlm.nih.gov/genbank/, accessed on 1 September 2023). Two species of the superfamily Oplophoroidea, S.curvispina (no. KP076159) and Acanthephyra quadrispinosa (no. KP076178), were chosen as outgroups to root the tree. Multiple alignments of all sequences were made in Geneious® 7.1.3 using the MUSCLE algorithm [32] (25 repeats). The final alignment for the COI fragment was 539 bp and included 109 sequences, and for the ITS1 fragment, 23 sequences of 328 bp. In the case of the ITS1 gene, the sequences were not found in public sources, so only newly generated sequences were analyzed.
The phylogenetic reconstruction of the COI gene by the Maximum Likelihood (ML) estimator was conducted with the RAxML (ver. 7.2.8 [33]), using the GTR + G nucleotide substitution model for each codon position. Statistical support was assessed using the bootstrap method involving 1000 replicates. Bootstrap values greater than 70% were considered statistically significant. Before the Bayesian analysis was conducted on the COI dataset, the most appropriate nucleotide substitution models and partitioning scheme were selected for each codon, using the Akaike Information Criterion (AICc) in the PartitionFinder2 software [34]). As a result, the nucleotide substitution patterns were as follows: GTR + I + G for the first codon, GTR + I for the second, and GTR + G for the third. A Bayesian analysis was performed using MrBayes 3.3 software [35]. Two parallel calculations of 10,000,000 generations, with tree selection every 1000 generations, were performed, and the first 25% of trees were excluded from the calculation of the posterior probabilities. Bayesian posterior probabilities greater than 0.95 were considered statistically significant.
PopArt 1.7 Software (http://popart.otago.ac.nz/, accessed on 1 September 2023, [36]) was used to construct the haplotype network using the minimum-spanning method. Haplotype and nucleotide diversity were analyzed in DNASP ver. 5 [37]. Genetic distances were assessed in the MEGA11 [38] using a two-parameter Kimura model (K2P) [39].
2.4. Morphological Analysis
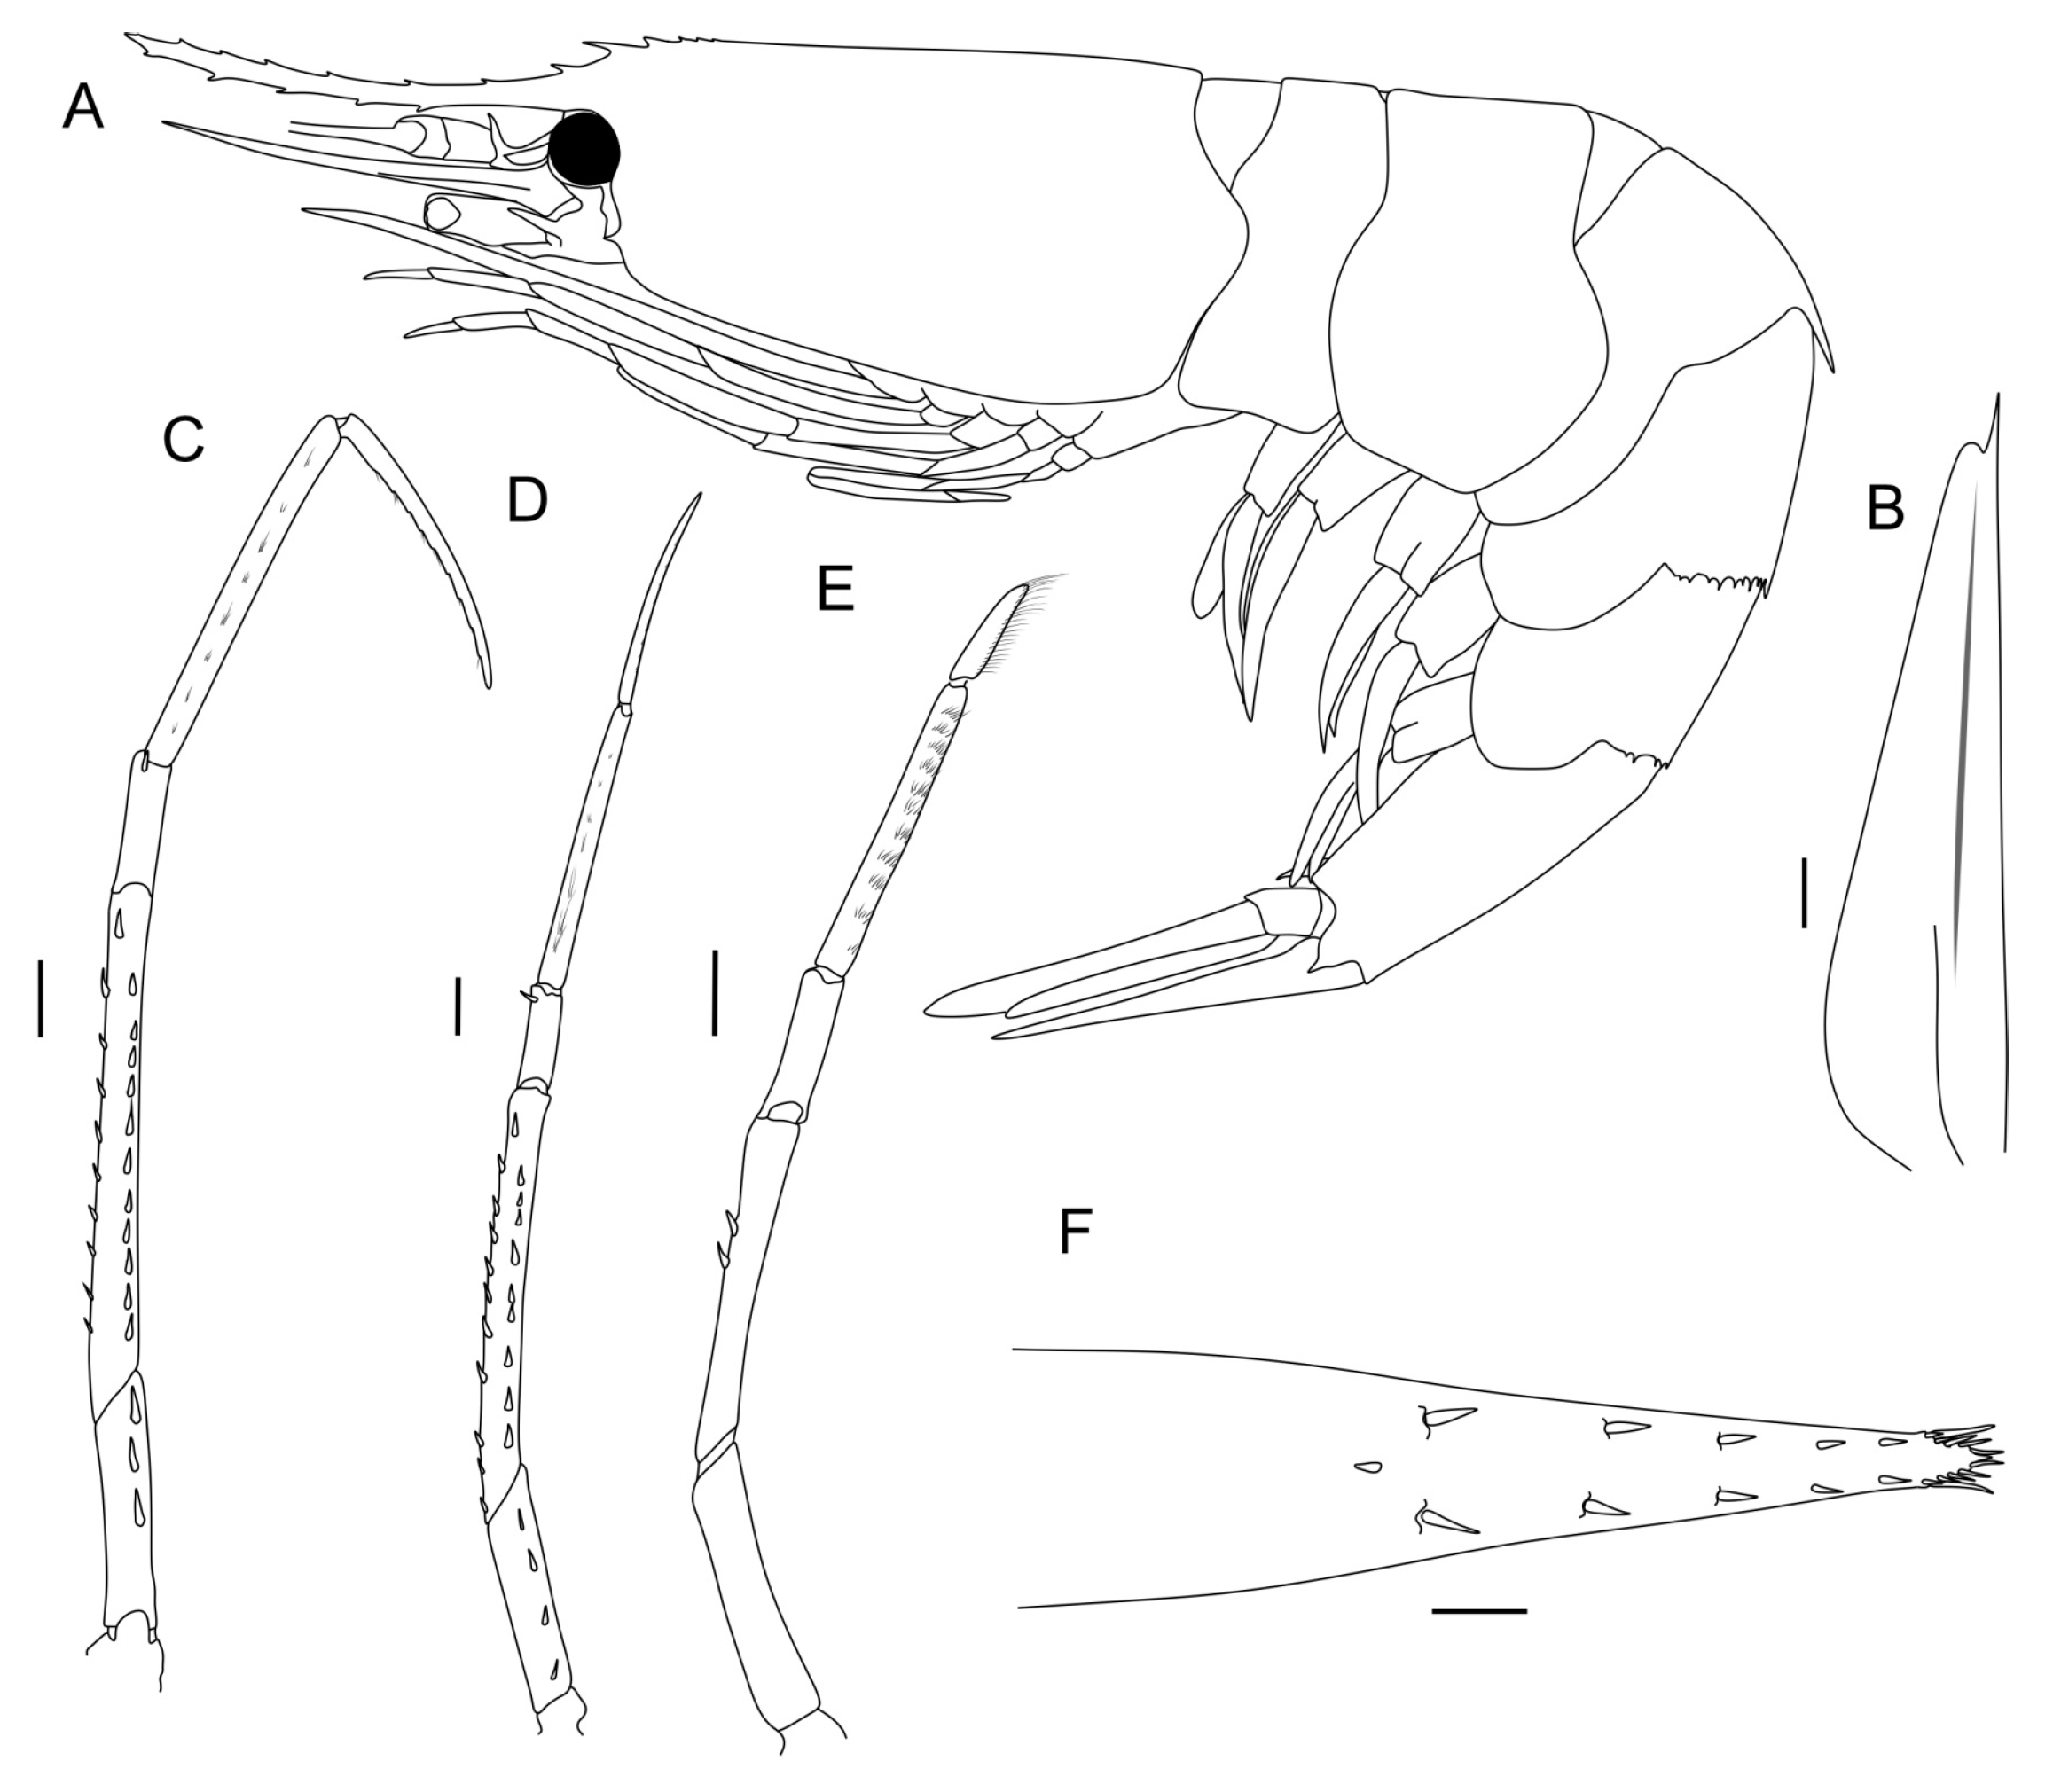
In order to assess the within-species morphological variability of S. debilis, we selected and coded the 32 most variable characteristics linked to carapace (5 characteristics), pleon (7 characteristics), antenna (1 characteristics), telson (2 characteristics), and pereopods (17 characteristics) (Table 1, Figure 2). The carapace length was measured from the posterior margin of the eye orbit to the dorsal posterior end of the carapace; the carapace height was measured at the highest point. All measurements are presented in Table S3. We coded morphological characteristics in 73 specimens ranging from 3.5 mm to 15.8 mm in carapace length: 43 females, 26 males, and 4 juveniles.

Table 1.
Morphological characteristics and their minimum, maximum, and average values with standard deviation (SD) for 73 S. debilis specimens collected in three geographical regions (North Atlantic, 44; South Atlantic, 5: Indian Ocean, 24 specimens). In qualitative characteristics “−” indicates absence, and “+” indicates presence of the morphological character.
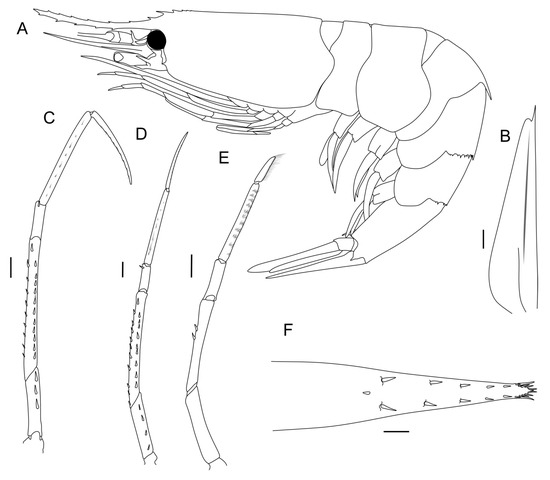
Figure 2.
Morphology of S. debilis (male). (A) General view; (B) scaphocerite; (C, D, E) pereopods 3, 4, and 5, respectively; (F) telson. Scales: 1 mm.
Statistical analyses of the morphological data and comparisons of the morphological and genetic parameters were run using R 4.0.5 [40]. Missing characteristics (1.2% of the database) were replaced with their mean values characteristics [41]. The juveniles (carapace lengths < 5 mm) were removed from the morphological analysis as the proportions of this species greatly change during ontogenesis.
In order to remove the influence of individual size, we used carapace length and carapace height as predictors in a Redundancy analysis (RDA: [42]), and the other 26 characteristics as dependent variables in the matrix. The analysis was conducted using the RDA function from the “vegan” package [42], yielding both constrained and unconstrained axes.
The canonical axes were influenced by the size of the individuals, while the unconstrained axes provided insight into the structure of the residual matrix from regression models, allowing us to examine the relationship between morphological characteristics without the impact of size. Therefore, we excluded the canonical axes (RDA1 and RDA2) from further analysis and focused on the two most informative unconstrained axes, PCA1 and PCA2, which facilitated a more accurate analysis of morphological characteristics without interference from the influence of individual size.
In order to assess the correlation between the morphological features and genetic characteristics, we used the Mantel test [41] and created two distance matrices. The first matrix included Euclidean distances between individuals in PCA1 and PCA2 space, whereas the second one included square roots of pairwise genetic distances between the sequences of the COI gene. Genetic distances were calculated using the dist. alignment function from the “seqinr” package [43]. The mantel correlation between the two matrices was calculated using the Mantel function from the “vegan” package [42]. The statistical significance of the test was assessed using the permutation method (9999 permutations). The results of the statistical analyses were visualized using the package “ggplot2” [44].
3. Results
3.1. Genetic Variability and Spatial Structure
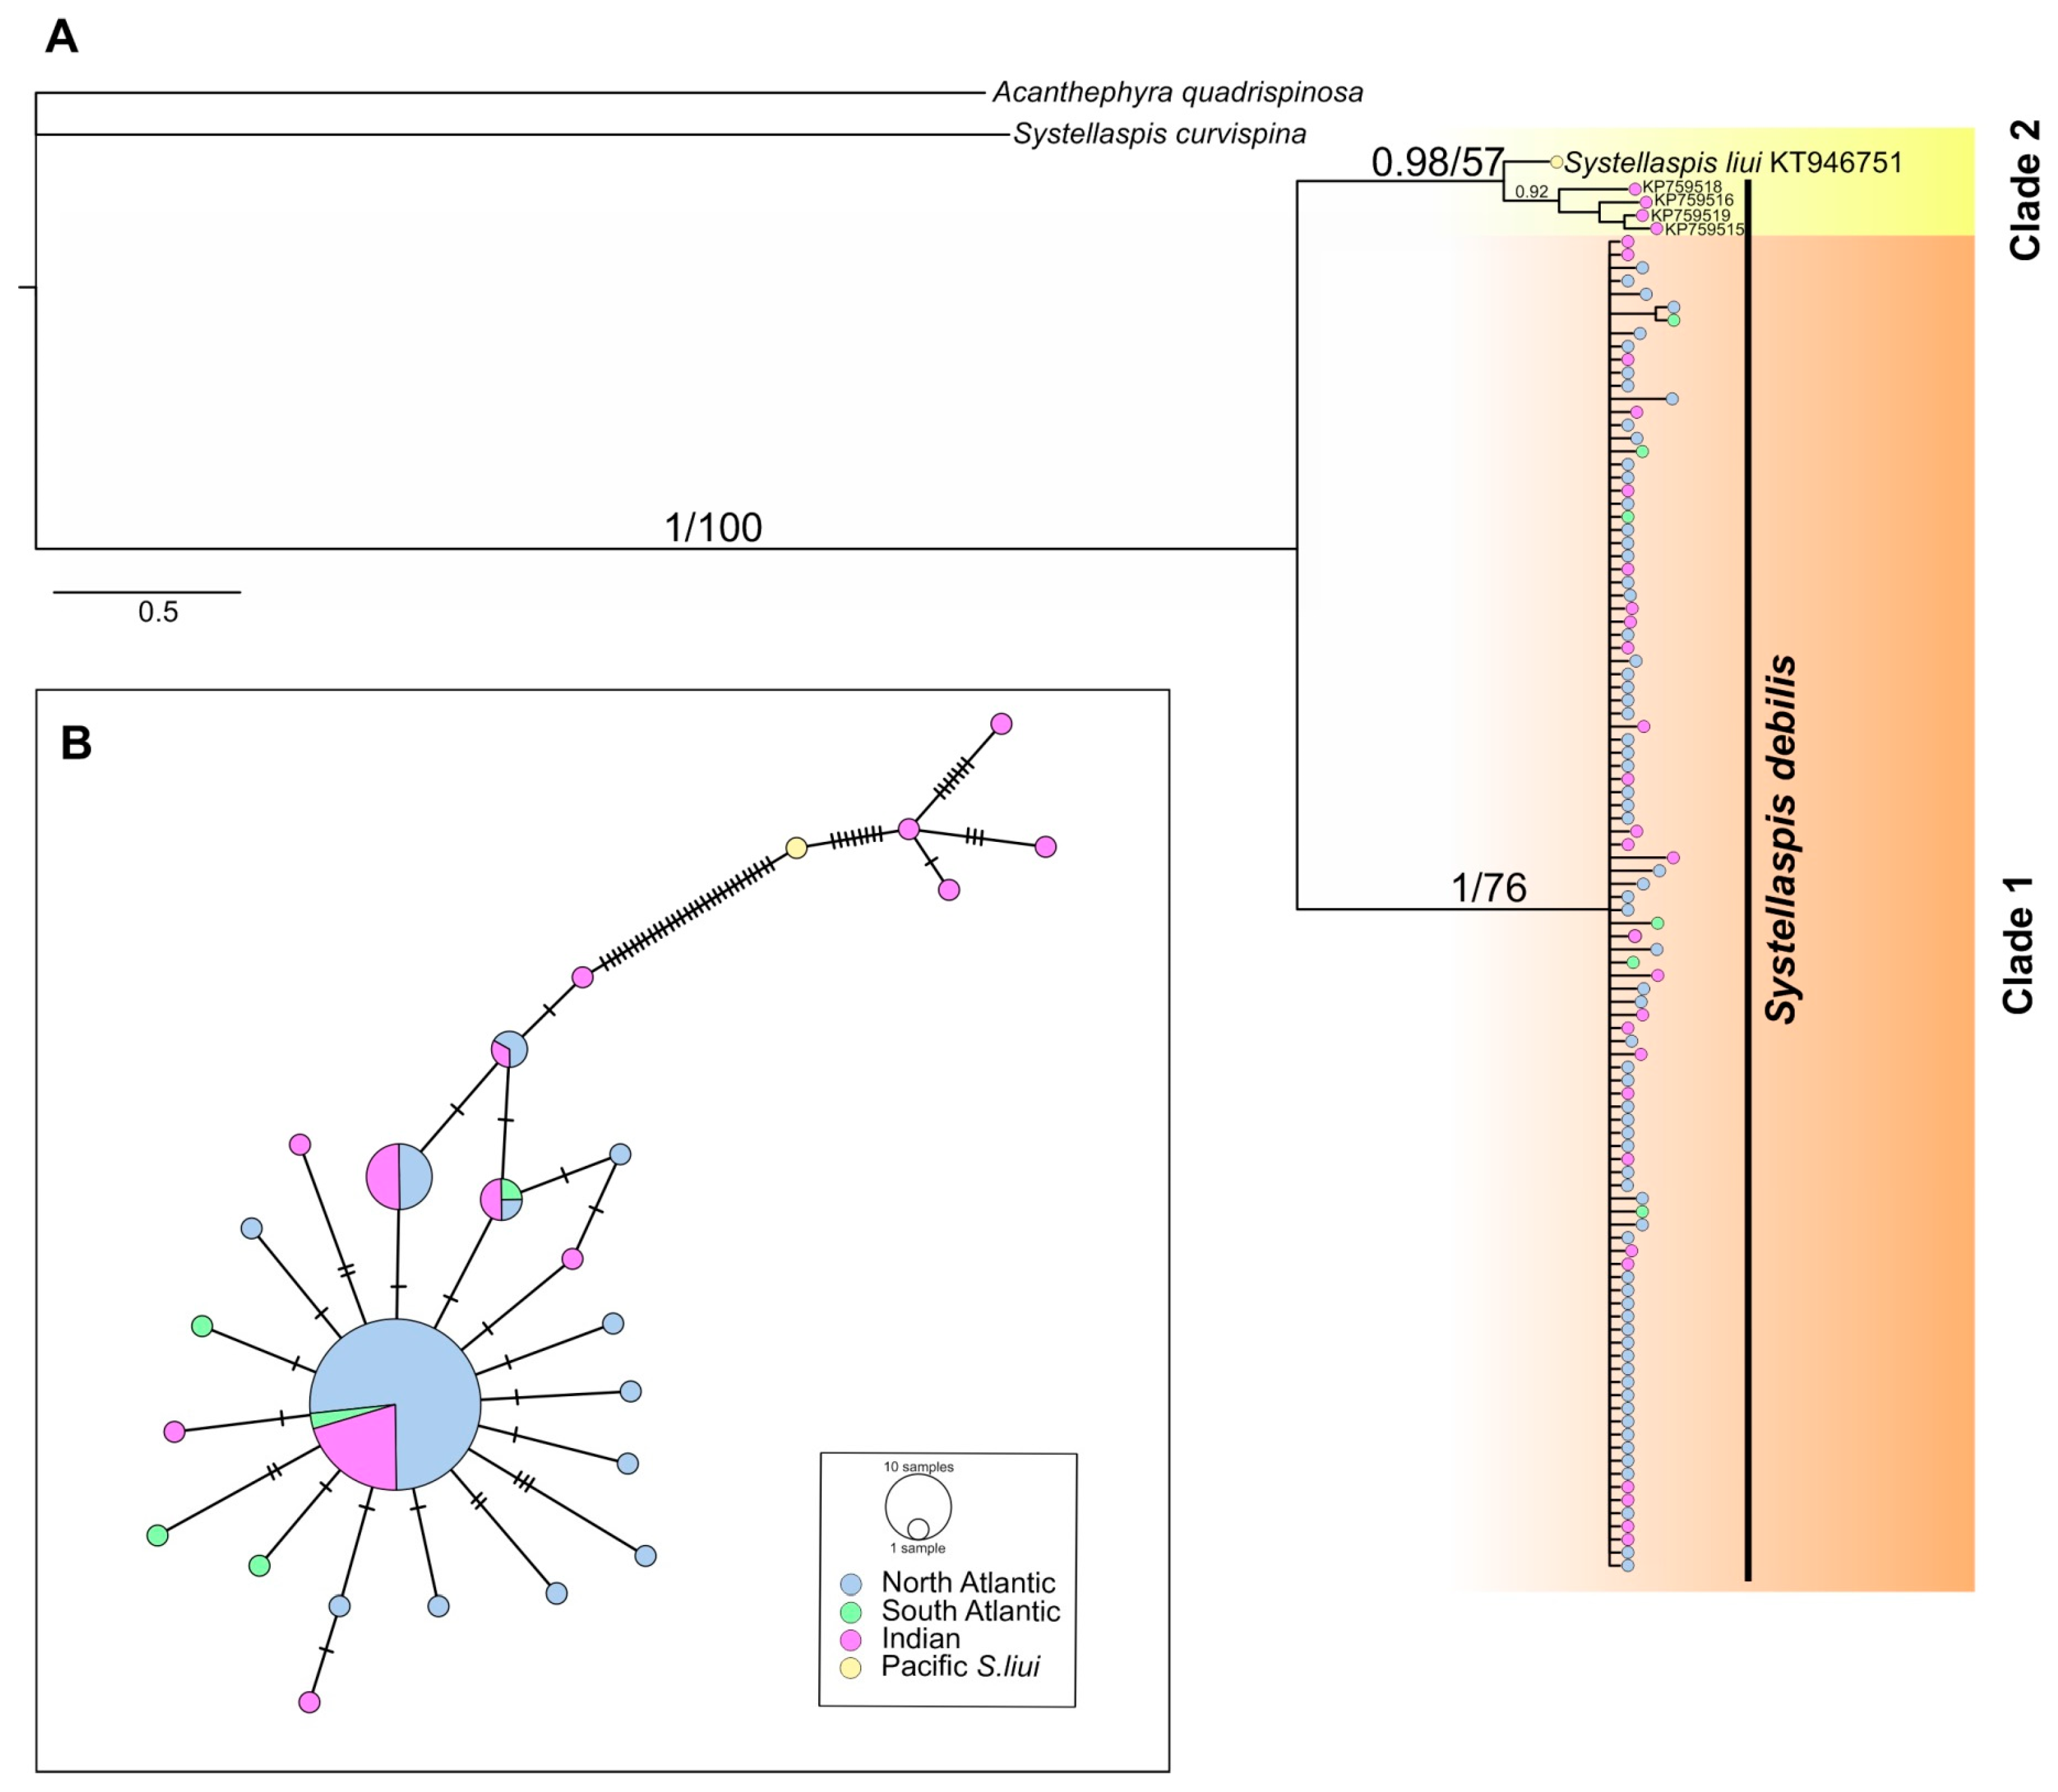
The phylogenetic reconstruction retrieved two supported clades, the most abundant, Clade 1 (1/76, Bayesian posterior probabilities/ML bootstrap), comprised 96% of the COI sequences (Figure 3A). This clade included all specimens from the North and South Atlantic (sixty-eight and six, respectively) and twenty-seven specimens from the Indian Ocean. Clade 2, sister of Clade 1, did not gain bootstrap support (0.98/57) and encompassed four specimens of S. debilis collected off the north coast of Madagascar, and one specimen of S. liui (KT946751) from the western Pacific.
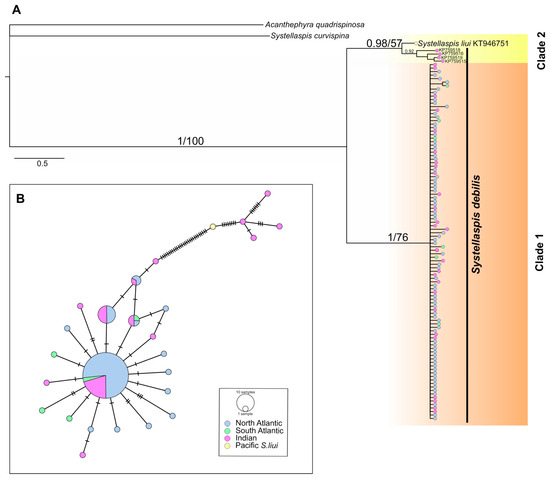
Figure 3.
(A) Bayesian consensus phylogram of S. debilis based on mitochondrial cytochrome c oxidase I (COI) gene fragment (539 bp). The horizontal scale bar marks the number of expected substitutions per site. Statistical support indicated as Bayesian posterior probabilities (left) and Maximum Likelihood bootstrap values for 1000 pseudoreplicates (right). (B) Minimum-spanning networks of S. debilis COI gene fragment. The size of the filled circles represents the number of individuals with each haplotype, with the smallest circles representing one individual with that haplotype, color represents sampling regions. Hatch marks on the branches represent the number of mutational steps.
Specimens from Clade 1 showed a moderate haplotype diversity (Hd) of 0.547 ± 0.059 (range: 0.611–1.000) and a low nucleotide diversity (π) of 0.0016 ± 0.000 (range: 0.0020–0.0056) across all three regions (Table 2). In the COI minimum-spanning network, 21 unique haplotypes were observed across 102 specimens, with 68 of these representing a shared central haplotype across all three regions (Figure 3B). Specimens from Clade 2 (including S. liui) had higher values of Hd (1.000 ± 0.126) and π (0.0122 ± 0.003), and unique haplotypes separated by 29 substitutions from the Clade 1 haplogroup (Figure 3B). The Tajima’s D neutrality test resulted in a rejection of the neutral model for Clade 1 overall (D = −2.338, p < 0.001) and the North Atlantic population (D= −1.913, p < 0.05), which is typical of a recently expanded population.
Table 2.
Genetic diversity of S. debilis mitochondrial cytochrome c oxidase I (COI) gene, including haplotype diversity (Hd), nucleotide diversity (π), and Tajima’s D (D). Significant Tajima’s D values are indicated by * (p < 0.05) or ** (p < 0.001). Clade 2 includes a single sequence of S. liui.
The ITS1 gene marker was analyzed in the specimens from Clade 1, as the Clade 2 representatives were absent in our collection. We randomly sorted five to ten specimens from each region and successfully sequenced ten specimens from the North Atlantic, five from the South Atlantic, and eight from the Indian Ocean. Genetic diversity was very low among the sequences: nineteen out of twenty-three were identical, and the others differed in one to twelve substitutions.
3.2. Morphological Variability
Four characteristics (numerous lateral spines arranged in two or more rows on the telson; the presence of the medial dorsal groove on the scaphocerite; number of the movable spines on the ischium of the third pereopod (anterior row of spines); and number of the movable spines on the carpus of the third pereopod (anterior row of spines) with no variance) were removed from the analysis. The remaining 28 characteristics examined in 73 specimens were used in further statistical analyses.
The RDA model, with carapace length and height as the predictors, was statistically significant (F = 7.3655, pperm = 0.0001, Nperm = 9999). The two canonical axes described 18% of the total variance, which suggested that 82% of the morphological variance was not related to body size, and 38% of the residual variability was determined by PCA1 and PCA2 (Table 3).
Table 3.
Partitioning of variance in morphological characteristics of S. debilis based on RDA results. The constrained axes correspond with the body size, and the unconstrained describe the characteristics that do not correlate with the size.
The RDA model showed a positive correlation between body size and some morphological characteristics (Figure 4A), such as number of movable spines in the posterior row of the ischium of the fifth pereopods, and number of serrations on the lateral margin of the fourth and fifth abdominal somites. We excluded the influence of size and further analyzed the residual RDA variability, i.e., the variability of the non-canonical axes, such as Principal Components (PC) (Figure 4B).
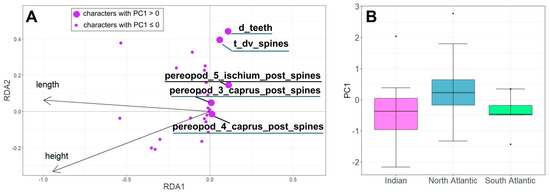
Figure 4.
The RDA results. (A). Ordination of morphological characteristics in the space of canonical axes RDA1 and RDA2. (B). Variability of individuals of S. debilis from the Indian Ocean, Northern, and Southern Atlantic along the non-canonical PC1 axis. See characteristic coding in Table 1.
Morphological variability (PC1) was significantly linked to the sampling region (ANOVA: F = 5.306, p = 0.0073) (Figure 4B). Specifically, specimens from the North Atlantic region exhibited lower PC1 values compared to those from the South Atlantic and the Indian Ocean. However, we did not observe any significant relationship between PC2 and the sampling location (ANOVA: F = 0.01, p = 0.99).
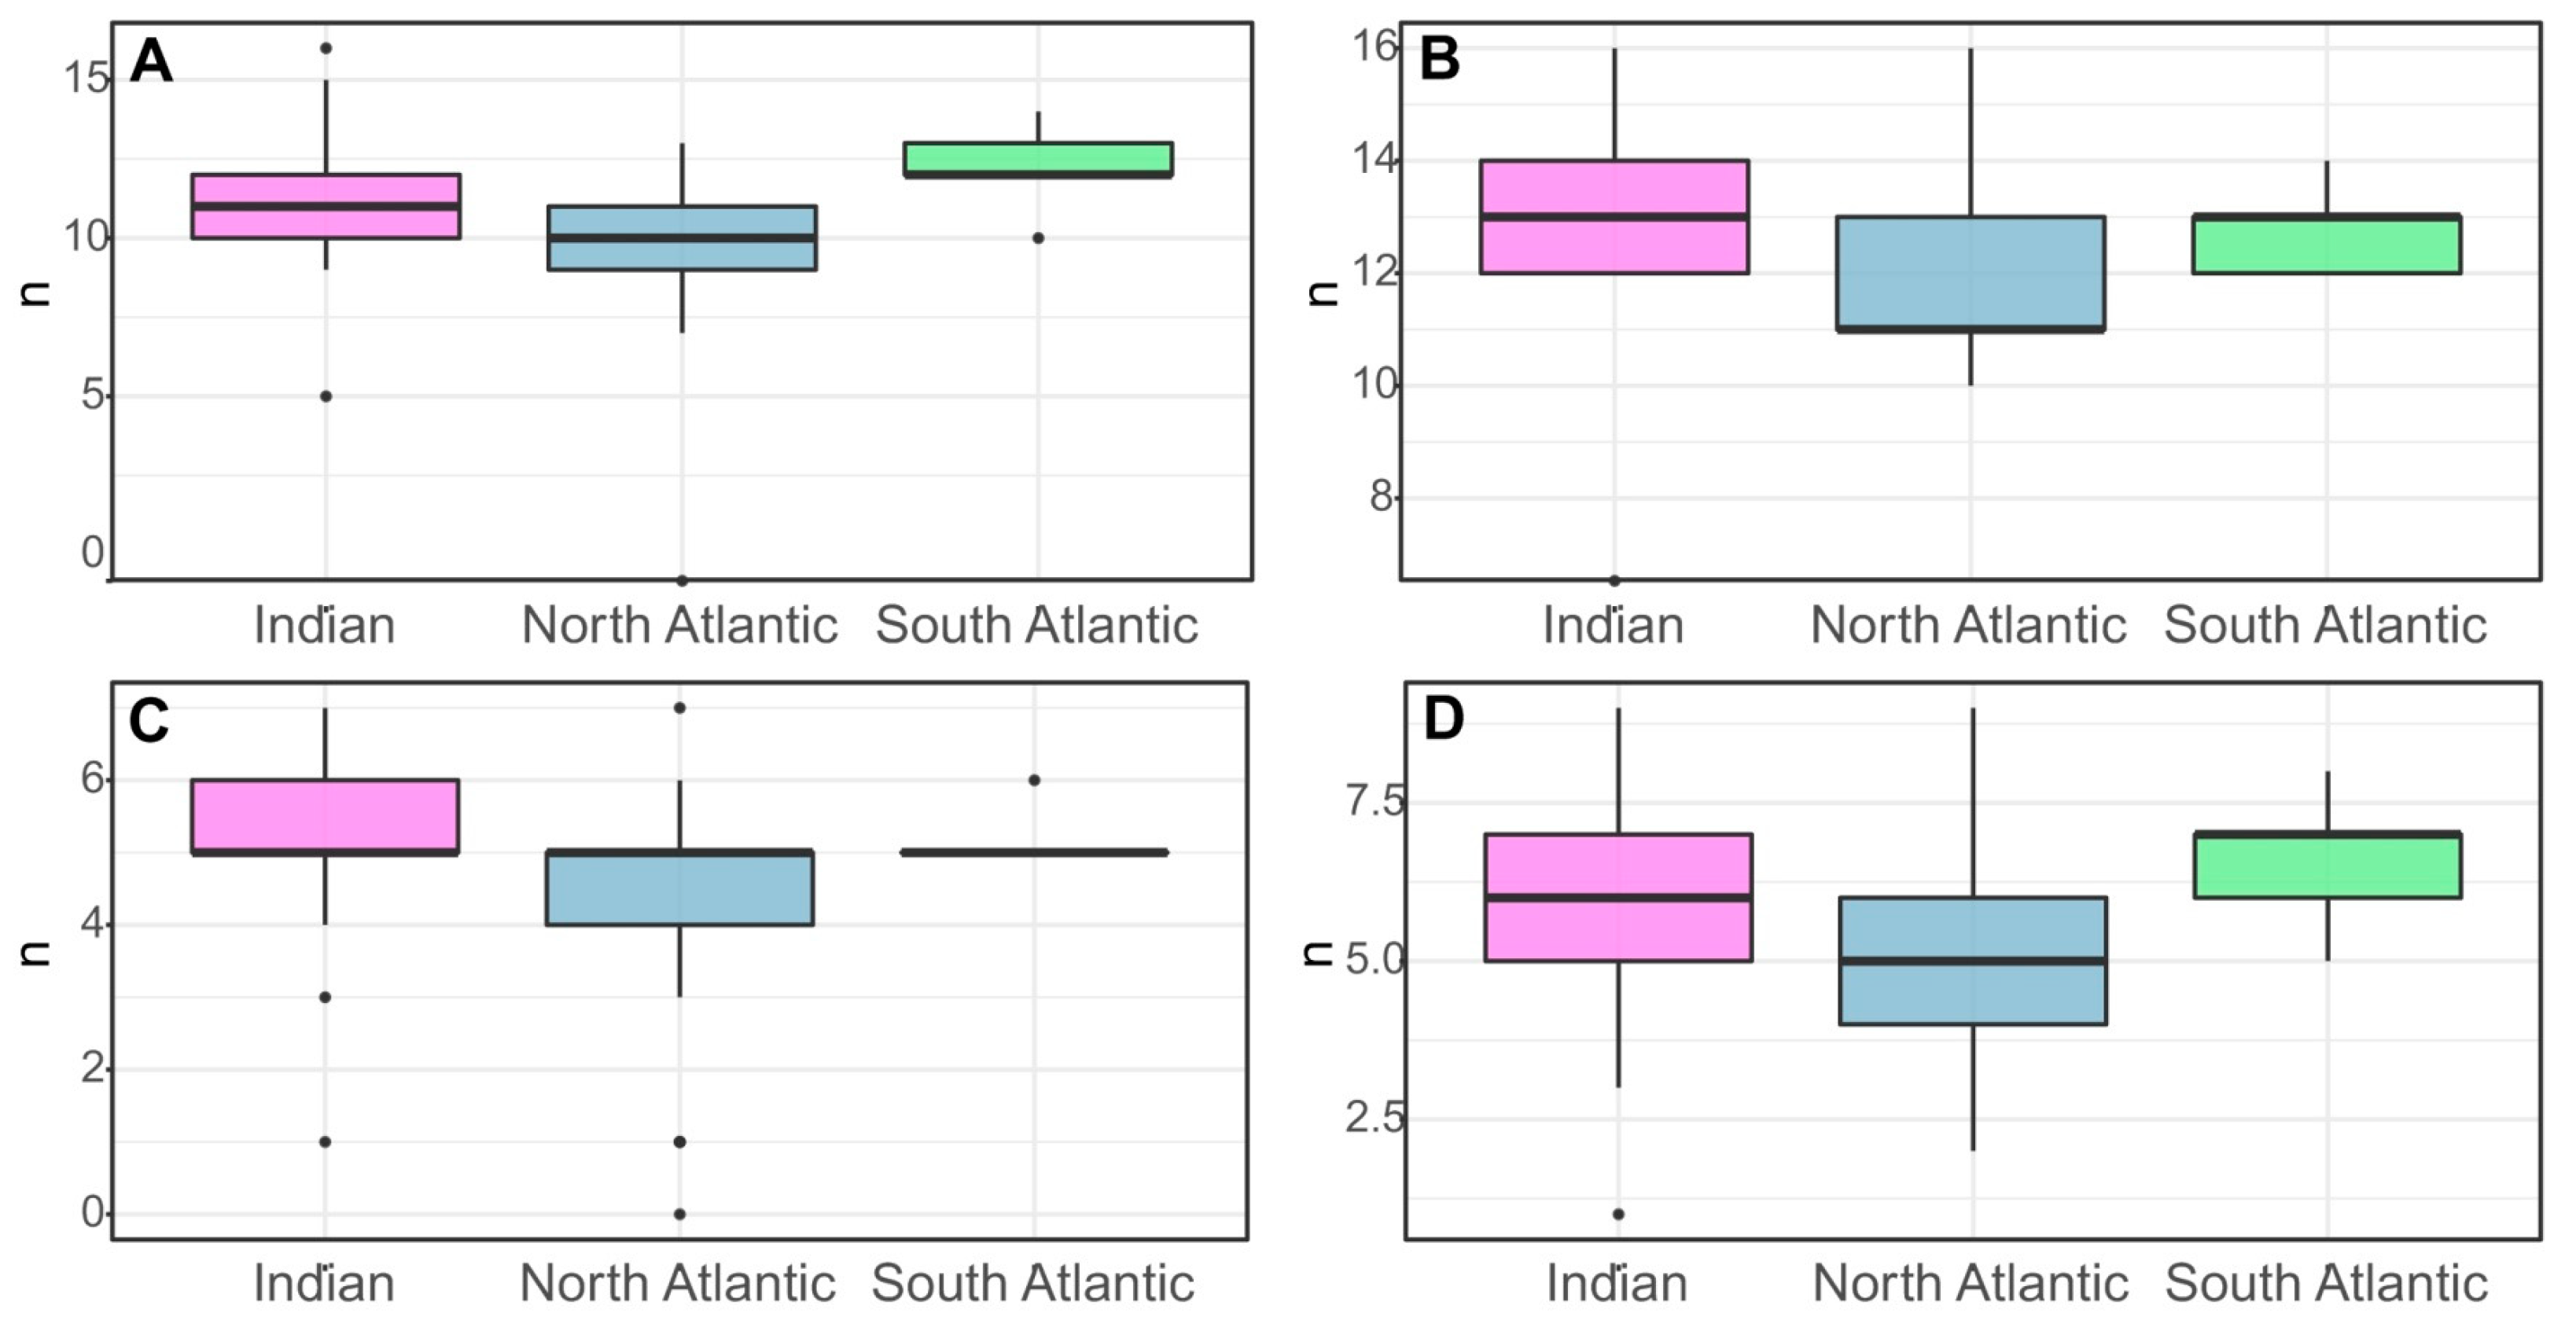
Some morphological characteristics showed significant dependence on location (Figure 5). Numbers of spines in the posterior row on the merus of the third and in the anterior row of the merus of the fourth pereopod were significantly higher in the Indian Ocean than in the Atlantic. Similarly, individuals from the South Atlantic had a higher average number of spines in the posterior row on the merus of the fourth pereopod than individuals from other geographic areas. Furthermore, the number of lateral serrations on the pleon on the left side of the fourth abdominal segment of the South Atlantic shrimp was only slightly higher than that of individuals from the Indian Ocean. The lowest average number of spines on the third and fourth pereopod and the number of teeth on the left side of the fourth pleonic somite were observed in the North Atlantic.
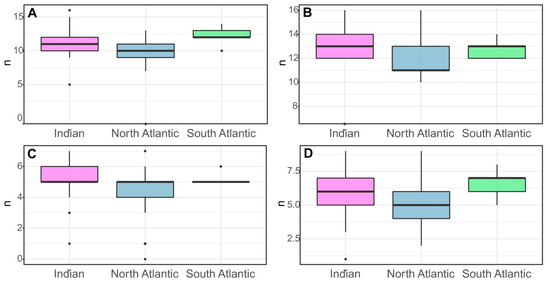
Figure 5.
Variation in morphological characteristics in populations of S. debilis from the Indian Ocean (21 specimens), Northern Atlantic (43), and Southern Atlantic (5): (A) Number of spines in the posterior row on the merus of the fourth pereopods; (B) Number of spines in the posterior row on the merus of the fourth pereopods, (B). Number of spines in the posterior row on the merus of the third pereopods, (C). Number of spines in the posterior row on the merus of the fourth pereopods, (D). Serrations on the lateral margin of the fourth abdominal somite, right side.
In order to analyze the relationship between the genetic and morphological characteristics of individuals, we ran the Mantel test that assessed the similarity of the two distance matrixes (genetic distance matrix and spatial distance matrix of PC1 and PC2). The results of this test showed that there is a statistically significant similarity between the two matrixes (r = 0.1791, p = 0.003, 9999 permutations).
4. Discussion
4.1. Population Structure of Systellaspis debilis (Clade 1)
In the Atlantic and Southwest Indian Ocean, S. debilis encompasses two divergent and reciprocally monophyletic mitochondrial clades with different geographic distributions. The Atlantic harbors only representatives of Clade 1; since the type locality of S. debilis is the Bahama Channel (North Atlantic), we consider this clade as S. debilis. This clade is genetically homogenous throughout the Atlantic and the Southwest Indian Oceans. The genetic similarity of the COI and ITS1 genes could be the result of several scenarios.
Firstly, there is an intensive gene flow through ecological barriers which are usually impede gene flow between populations of mesoplankton (animals much smaller than the species considered here) [12,13,15,16,20,21,22]. These mesoplankton species, even having haplotypes with panoceanic distribution, show significant variations of haplotype frequencies between oceans or ecoregions [8,12,20,45,46]. In contrast to most mesoplankton, S. debilis is a macroplankton species undertaking intensive diurnal vertical migrations through vertical abiotic gradients [47], which makes the species resistant to horizontal gradients of the frontal zones. In addition, a long life cycle (5 to 8 years for oplophoroid shrimps) [48] provides a better opportunity for individual transfer through geographic regions with oceanic currents, and thus also contributes to high levels of gene flow between distant regions.
Another possible scenario suggests that barriers to the gene flow currently exist but were established not long ago, and not enough time has passed to provide genetic differentiation between populations. In this case, purifying selection is effective in eliminating even slightly disadvantageous mutations and maintaining genetic homogeneity in each of the distant populations [49,50]. In fact, the purifying selection was thought to be a constraint on genetic diversity and differentiation between two distant populations of this species in the North-West Atlantic [11]. Subtle or no genetic differentiation at the global (circumtropical) scale was also reported for some large pelagic fishes and was explained by the large effective size of their populations and/or high capacity for dispersion, which can obscure signals of spatial genetic differentiation [51,52,53].
The second scenario is supported by the star-like structure of the haplotype network, the lack of transversion mutations, and the negative and significant Tajima’s D values. In fact, the low haplotype diversity of S. debilis is unusual for a globally distributed zooplankton species; a similar effect was found only in a few species over a much more limited distribution: the northern krill Meganyctiphanes norvegica [54] and the neritic chaetognath Sagitta setosa [55]. Despite their large population size, marine pelagic species may be susceptible to population crashes with measurable effects on their genetic makeup. Bottlenecks resulting from range contractions during the Pleistocene were proposed to have occurred in two copepod and one chaetognath species in the North Atlantic, which displayed lower levels of genetic variation than expected from their estimated population sizes [56,57]. Systellaspis debilis may have emerged relatively recently and spread over a huge area due to the possession of some evolutionary/ecological advantage. As there are no fossil records for S. debilis or related species, no correlation can now be found with any specific event in the past.
In the Indian Ocean, most S. debilis specimens were collected between 20° S and 34° S within the Southern Indian Ocean and Agulhas Current mesopelagic ecoregions, according to Sutton et al. [2]. Only one specimen from GenBank was collected at ~13° S, northwest of Madagascar, in the Mid-Indian Ocean ecoregion. Surprisingly, the same site harbored four genetically different specimens, which, along with S. liui from the West Pacific, comprised Clade 2. As no specimens of Clade 2 were found in the Atlantic Ocean or south of 20° S in the Indian Ocean, we suggest that the geographic boundary between both clades occurs between 13° S and 20° S in the Indian Ocean. This is consistent with the boundary between Mid-Indian and Southern Indian zones [2].
The genetic break between the clades can be caused by the Agulhas current, which originates at ~27° S [2] and transports water from the southwest tropical Indian Ocean to the Southern Atlantic, thereby stimulating the dispersal of Clade 1 representatives as it was shown earlier for some marine species [58]. Conversely, Clade 2 appears to be confined to the northern Indian Ocean, where the Gyre system prevails [2].As the tropical Indian Ocean likely harbors representatives of Clade 2, the Mozambique Channel acts as a meeting place for both clades.
4.2. Morphological Variability of Systellaspis debilis (Clade 1)
Our analyses showed that specimens from the North Atlantic had lower average PC1 values than those from the South Atlantic and Indian Oceans (Figure 4B) and suggested significant morphological differences between shrimp populations in these regions. In particular, the number of spines in the posterior row on the merus of the third pereopod and anterior row of the merus of the fourth pereopod were significantly higher in individuals collected from the Indian Ocean. Individuals from the South Atlantic, on the other hand, had a higher average number of spines in the posterior row on the merus of the fourth pereopod than individuals from other geographic groups. Finally, the lowest average of both the number of spines on the third and fourth pereopod, and the number of teeth on the left side of the fourth segment, were observed in the North Atlantic group, highlighting the differences in morphology across geographic regions.
Alain Crosnier [59] was the first to find variations in the rostrum–carapace length of S. debilis specimens from different geographic locations, including Northern and Southern Madagascar, the Northern and Southern Atlantic, and the Philippines. Our results indicated that the length of the rostrum to the length of the carapace (Lr/Lc) ratio of specimens from the Northern Atlantic was less homogeneous compared to those from the Indian Ocean, but significant variations between the basins that could potentially be correlated with haplotypes were not found.
The observed morphological differences between populations might be influenced by a combination of genetic and environmental factors. The Mantel test suggests that there is a significant similarity between genetic and spatial distance matrices, indicating that the observed morphological variability is likely to be driven, at least in part, by genetic differences between populations. The results suggest a link between the genetic makeup of individuals and their morphology; the exact mechanisms driving this correlation remain unclear and warrant further investigation.
The correlation between genetic and morphological traits does not necessarily imply a direct causal relationship. Other factors, such as environmental conditions and developmental plasticity, could also play a role in shaping the observed morphological variability [60]. Future studies that incorporate environmental and developmental factors will be necessary to fully understand the complexity of the relationship between genetic and morphological traits in this species of shrimp.
4.3. The status of Systellaspis liui and Related Specimens (Clade 2)
Clade 2 encompasses four specimens deposited in GenBank as ‘Systellaspis debilis’ [61] and one specimen of S. liui [62]. Sha and Wang [62] described Systellaspis liui based on a single female specimen from the Western Pacific (Philippine Sea) and suggested that four specimens of ‘S. debilis’ from Aznar-Cormano et al. [61] and S. liui are synonyms. According to the original description, genetic and morphological differences between S. debilis and S. liui were sufficient to suggest the new species, but the validity of S. liui was considered to be controversial [28]. In fact, morphological variations in S. debilis from various locations [59,62] makes defining S. liui as a distinct species difficult.
Sha and Wang [62] proposed five morphological characteristics to distinguish S. liui from S. debilis. Our morphological analysis showed that four of them were present in 26–100% of observed S. debilis: a medial dorsal groove on the scaphocerite; a carina on the dorsal margin of the third abdominal somite; movable spines on the pereopods; and three teeth on the posterior margin of the fifth abdominal somite. The only morphological characteristic not found in our specimens of S. debilis was the presence of additional spines on the telson, a characteristic not common for the family Oplophoridae and likely attributed to an abnormal specimen [28].
Molecular evidence supporting the identification of the new species S. liui was based on COI sequence divergence (K2P), indicating a difference of more than 5% between S. liui and S. debilis [62]. Typically, within-species COI sequence divergences for decapods range from 0.24% to 1.8% [63,64,65,66,67,68,69], while divergence among species within a genus is usually higher, ranging from 2.4% to 32.7% [68,69,70].
In this study, we compared interspecific and intraspecific K2P distances for all species of the genus Systellaspis, including S. debilis Clade 1, S. debilis Clade 2, and S. liui. The distance between Clade 2 (with and without S. liui) and Clade 1 was 7.1%, which was the lowest observed pairwise distance (ranging from 8.0% to 32.5%) (Table 4). A comparable divergence (8.0%) was observed between Systellaspis braueri and Systellaspis paucispinosa, which also differ mainly in the spination of the telson.
Table 4.
Intra- and intergroup genetic distances of COI gene of Systellaspis species and clades. “Systellaspis debilis Clade 1” corresponds to specimens from the Atlantic and Southern Indian Ocean, “S. debilis Clade 2 (Ind.)” corresponds Clade 2.
Pairwise differences within S. debilis Clade 1 and S. debilis Clade 2 were relatively low (0.4% and 1.1%) and matched those for Systellaspis curvispina (Table 4). In contrast, much higher intraspecific values (ranging from 8.2% to 12.5%) were observed in three other Systellaspis species (S. braueri, S. cristata, and S. pellucida), suggesting the presence of cryptic species (Table 4).
Overall, the observed divergences in COI sequences within and between S. debilis Clade 1 and S. debilis Clade 2 suggest that S. liui is similar to the “S. debilis” of Aznar-Cormano et al. [61], and represents a separate mitochondrial clade. However, further investigations with additional material for morphological studies and the analysis of additional nuclear genes are necessary to clarify the taxonomic status of S. liui and the previously mentioned ‘S. debilis’ of Aznar-Cormano et al. [61].
5. Conclusions
Our data indicates that S. debilis is a genetically cohesive species throughout its distribution range in the whole Atlantic and the Southwest Indian Ocean. Populations of S. debilis are genetically homogenous in three geographically distant ocean basins separated by oceanographic fronts, which is unusual for plankton species studied thus far. In contrast to genetic homogeneity, statistically significant morphological differences were found, and populations from the North Atlantic, South Atlantic, and Southwest Indian Oceans differ in the spination of pereopods and the serration of pleonic somites. Scenarios to explain the observed phenomenon include intensive gene flow through ecological barriers owing to resistance to horizontal oceanographic gradients, and long life cycle and/or purifying selection of mitochondrial genes. In both cases, morphological variation between regions may be a result of phenotypic plasticity or have a genetic (not mitochondrial-linked) basis. The use of genomic approaches will clarify this question and unveil finer detail about population structure and possible local adaptations of the species, as was shown for some other pelagic organisms [53,71]. We encourage marine biologists to further study the population structure of mesopelagic shrimps that are the key component of deep-sea communities and a target for possible commercial exploitation.
Systellaspis debilis is distinct from both S. liui and the five specimens mentioned as ‘S. debilis’ in GenBank, which creates a separate clade distributed in the West Indian Ocean and the West Pacific. Both clades are parapatric, and a geographic boundary occurs between 13° S and 20° S in the Indian Ocean. The taxonomic status of the ‘S. liui’ clade (e.g., species, subspecies, and species complex) needs further clarification through additional material for morphological studies and additional nuclear genes analyses.
Supplementary Materials
The following supporting information files can be downloaded from: https://www.mdpi.com/article/10.3390/d15091008/s1, Table S1: Material; Table S2: Annealing temperatures; Table S3: Measurements.
Author Contributions
A.S. performed morphological and genetic analyses, prepared figures, tables; D.K. envisioned the project, collected data, conducted genetic analyses, prepared figures; A.V. collected data, review the results, and prepared figures; V.K. conducted a statistical morphological analysis; A.L. assisted in morphometric scoring and prepared figures. All authors have read and agreed to the published version of the manuscript.
Funding
This work was supported by RSF Project No. 22–14-00202.
Institutional Review Board Statement
Not applicable.
Data Availability Statement
The data underlying this article are available in the article and in its online Supplementary Material. DNA sequences from the molecular analysis have been deposited in NCBI GenBank at https://www.ncbi.nlm.nih.gov/, accessed on 1 September 2023 under accession numbers OR398994–OR399068 and OR415900–OR415922.
Acknowledgments
We extend our appreciation to S. Kobyliansky and G. Abyzova for their contributions in sampling Systellaspis debilis during the 37th and 39th cruises of the RV Logachev, as well as during the 37th cruise of the RV Akademik Sergey Vavilov. We also thank the team at the Resource Centre “Development of Molecular and Cellular Technologies” of Saint Petersburg State University for their support in facilitating the sequencing process. We are grateful to M. Nikitin for providing a conducive working environment in his laboratory. Special thanks are due to A. Granovitch, P. Strelkov, and V.O. Mokievskiy for their insights throughout this study.
Conflicts of Interest
The authors declare no conflict of interest.
References
- Webb, T.J.; Berghe, E.V.; O’Dor, R. Biodiversity’s Big Wet Secret: The global distribution of marine biological records reveals chronic under-exploration of the deep pelagic ocean. PLoS ONE 2010, 5, 1–6. [Google Scholar] [CrossRef]
- Sutton, T.T.; Clark, M.R.; Dunn, D.C.; Halpin, P.N.; Rogers, A.D.; Guinotte, J.; Bograd, S.J.; Heino, M. A global biogeographic classification of the mesopelagic zone. Deep-Sea Res. I Oceanogr. Res. Pap. 2017, 126, 85–102. [Google Scholar] [CrossRef]
- Sarmiento, J.L.; Slater, R.; Barber, R.; Bopp, L.; Doney, S.C.; Hirst, A.C.; Kleypas, J.; Stouffer, R. Response of Ocean Ecosystems to Climate Warming. Glob. Biogeochem. Cycles 2004, 18, GB3003. [Google Scholar] [CrossRef]
- Mengerink, K.J.; Van Dover, C.L.; Ardron, J.; Baker, M.; Escobar-Briones, E.; Gjerde, K.; Koslow, J.A.; Levin, L.A. A call for deep-ocean stewardship. Science 2014, 344, 696–698. [Google Scholar] [CrossRef]
- Mackas, D.L.; Beaugrand, G. Comparisons of zooplankton time series. J. Mar. Syst. 2010, 79, 286–304. [Google Scholar] [CrossRef]
- Vereshchaka, A.L.; Mikaelyan, A.S.; Piontkovski, S.A.; Lunina, A.A. A mesoplankton biomass decline in the Central Atlantic coupled with an increase of surface temperature and an expansion of low-productive zones. Glob. Ecol. Biogeogr. 2023, 32, 1365–1376. [Google Scholar] [CrossRef]
- Palumbi, S.R. Genetic divergence, reproductive isolation, and marine speciation. Annu. Rev. Ecol. Evol. Syst. 1994, 25, 547–572. [Google Scholar] [CrossRef]
- Norton, E.L.; Goetze, E. Equatorial dispersal barriers and limited population connectivity among oceans in a planktonic copepod. Limnol. Oceanogr. 2013, 58, 1581–1596. [Google Scholar] [CrossRef]
- Kulagin, D.N.; Stupnikova, A.N.; Neretina, T.V.; Mugue, N.S. Spatial genetic heterogeneity of the cosmopolitan chaetognath Eukrohnia hamata (Möbius, 1875) revealed by mitochondrial DNA. Hydrobiologia 2014, 721, 197–207. [Google Scholar] [CrossRef]
- Deagle, B.E.; Faux, C.; Kawaguchi, S.; Meyer, B.; Jarman, S.N. Antarctic krill population genomics: Apparent panmixia, but genome complexity and large population size muddy the water. Mol. Ecol. 2015, 24, 4943–4959. [Google Scholar] [CrossRef]
- Timm, L.E.; Isma, L.M.; Johnston, M.W.; Bracken-Grissom, H.D. Comparative population genomics and biophysical modeling of shrimp migration in the Gulf of Mexico reveals current-mediated connectivity. Front. Mar. Sci. 2020, 7, 19. [Google Scholar] [CrossRef]
- Burridge, A.K.; Goetze, E.; Raes, N.; Huisman, J.; Peijnenburg, K.T.C.A. Global biogeography and evolution of cuvierina pteropods phylogenetics and phylogeography. BMC Evol. Biol. 2015, 15, 39. [Google Scholar] [CrossRef]
- Miyamoto, H.; Machida, R.J.; Nishida, S. “Complete mitochondrial genome sequences of the three pelagic chaetognaths Sagitta nagae, Sagitta decipiens and Sagitta enflata. Comp. Biochem. Physiol. Part D Genom. Proteom. 2010, 5, 65–72. [Google Scholar] [CrossRef]
- Yebra, L.; Bonnet, D.; Harris, R.P.; Lindeque, P.K.; Peijnenburg, K.T.C.A. Barriers in the Pelagic: Population structuring of Calanus helgolandicus and C. euxinus in European waters. Mar. Ecol. Prog. Ser. 2011, 428, 135–149. [Google Scholar] [CrossRef]
- Kulagin, D.N.; Lunina, A.A.; Simakova, U.V.; Vereshchaka, A.L. Progressing diversification and biogeography of the mesopelagic Nematoscelis (Crustacea: Euphausiacea) in the Atlantic”. ICES 2021, 78, 3457–3463. [Google Scholar] [CrossRef]
- Blanco-Bercial, L.; Álvarez-Marqués, F.; Bucklin, A. Comparative phylogeography and connectivity of sibling species of the marine copepod Clausocalanus (Calanoida). J. Exp. Mar. Biol. Ecol. 2011, 404, 108–115. [Google Scholar] [CrossRef]
- Churchill, C.K.C.; Valdés, Á.; Foighil, D.Ó. Molecular and morphological systematics of neustonic nudibranchs (Mollusca: Gastropoda: Glaucidae: Glaucus), with descriptions of three new cryptic species. Invertebr. Syst. 2014, 28, 174–195. [Google Scholar] [CrossRef]
- Churchill, C.K.C.; Valdés, Á.; Foighil, D.Ó. Afro-Eurasia and the Americas present barriers to gene flow for the cosmopolitan neustonic nudibranch Glaucus atlanticus. Mar. Biol. 2014, 161, 899–910. [Google Scholar] [CrossRef]
- Andrews, K.R.; Norton, E.L.; Fernandez-Silva, I.; Portner, E.; Goetze, E. Multilocus evidence for globally distributed cryptic species and distinct populations across ocean gyres in a mesopelagic copepod. Mol. Ecol. 2014, 23, 5462–5479. [Google Scholar] [CrossRef] [PubMed]
- Goetze, E.; Hüdepohl, P.T.; Chang, C.; Van Woudenberg, L.; Iacchei, M.; Peijnenburg, K.T.C.A. Ecological dispersal barrier across the Equatorial Atlantic in a migratory planktonic copepod. Prog. Oceanogr. 2017, 158, 203–212. [Google Scholar] [CrossRef]
- Kulagin, D.N.; Neretina, T.V. Genetic and morphological diversity of the cosmopolitan chaetognath Pseudosagitta maxima (Conant, 1896) in the Atlantic Ocean and its relationship with the congeneric species. ICES 2017, 74, 1875–1884. [Google Scholar] [CrossRef]
- Choo, L.Q.; Bal, T.M.P.; Goetze, E.; Peijnenburg, K.T.C.A. Oceanic dispersal barriers in a holoplanktonic gastropod. J. Evol. Biol. 2021, 34, 224–240. [Google Scholar] [CrossRef]
- Bucklin, A.; DiVito, K.R.; Smolina, I.; Choquet, M.; Questel, J.M.; Hoarau, G.; O’Neill, R.J. Population Genomics of Marine Zooplankton. In Population Genomics: Marine Organisms; Oleksiak, M., Rajora, O., Eds.; Springer: Cham, Switzerland, 2018; pp. 61–102. [Google Scholar] [CrossRef]
- Burukovsky, R.N.O. Biologii krevetki Systellaspis debilis (A. Milne Edwards, 1881) (Decapoda, Natantia, Oplophoridae). Bul. MOIP. Otd. boil 1992, 97, 60–70. (In Russian) [Google Scholar]
- Judkins, D.C. Geographical distribution of pelagic decapod shrimp in the Atlantic Ocean. Zootaxa 2014, 3895, 301–345. [Google Scholar] [CrossRef]
- Vereshchaka, A.; Abyzova, G.; Lunina, A.; Musaeva, E. The deep-sea zooplankton of the North, Central, and South Atlantic: Biomass, abundance, diversity. Deep Sea Res. Part II Top. Stud. Oceanogr. 2017, 137, 89–101. [Google Scholar] [CrossRef]
- Iwasaki, N.; Nemoto, T. Pelagics (Crustacea: Decapoda) from the Southern Ocean between 150° E and 115° E. Mem. Natl. Inst. Polar. Res. Ser. 1987, 38, 16–18. [Google Scholar]
- Lunina, A.A.; Kulagin, D.N.; Vereshchaka, A.L. Oplophoridae (Decapoda: Crustacea): Phylogeny, taxonomy and evolution studied by a combination of morphological and molecular methods. Zool. J. Linn. Soc. 2019, 186, 213–232. [Google Scholar] [CrossRef]
- Folmer, O.; Black, M.; Hoeh, W.; Lutz, R.; Vrijenkoek, R. DNA primers for amplification of mitochondrial cytochrome c oxidase subunit I from diverse metazoan invertebrates. Mol. Mar. Biol. Biotechnol. 1994, 3, 294–299. [Google Scholar]
- Wormhoudt, A.V.; Adjeroud, M.; Rouzé, H.; Leray, M. Recent and old duplications in crustaceans “Internal Transcribed Spacer 1 ″: Structural and phylogenetic implications. Mol. Biol. Rep. 2019, 46, 5185–5195. [Google Scholar] [CrossRef]
- Benson, D.A.; Cavanaugh, M.; Clark, K.; Karsch-Mizrachi, I.; Ostell, J.; Pruitt, K.D.; Sayers, E.W. GenBank. Nucleic Acids Res. 2018, 46, D41–D47. [Google Scholar] [CrossRef]
- Edgar, R.C. MUSCLE: Multiple sequence alignment with high accuracy and high throughput. Nucleic Acids Res. 2004, 32, 1792–1797. [Google Scholar] [CrossRef] [PubMed]
- Stamatakis, A. RAxML-VI-HPC: Maximum likelihood-based phylogenetic analyses with thousands of taxa and mixed models. Bioinformatics 2006, 22, 2688–2690. [Google Scholar] [CrossRef] [PubMed]
- Guindon, S.; Dufayard, J.F.; Lefort, V.; Anisimova, M.; Hordijk, W.; Gascuel, O. New algorithms and methods to estimate maximum-likelihood phylogenies: Assessing the performance of PhyML 3.0. Sys. Biol. 2010, 59, 307–321. [Google Scholar] [CrossRef]
- Huelsenbeck, J.P.; Ronquist, F. MRBAYES: Bayesian inference of phylogenetic trees. Bioinformatics 2001, 17, 754–755. [Google Scholar] [CrossRef] [PubMed]
- Bandelt, H.J.; Forster, P.; Röhl, A. Median-joining networks for inferring intraspecific phylogenies. Mol. Biol. Evol. 1999, 16, 37–48. [Google Scholar] [CrossRef] [PubMed]
- Librado, P.; Rozas, J. DnaSP v5: A software for comprehensive analysis of DNA polymorphism data. Bioinformatics 2009, 25, 1451–1452. [Google Scholar] [CrossRef]
- Tamura, K.; Stecher, G.; Kumar, S. MEGA11: Molecular evolutionary genetics analysis version 11. Mol. Biol. Evol. 2021, 38, 3022–3027. [Google Scholar] [CrossRef]
- Kimura, M. A simple method for estimating evolutionary rates of base substitutions through comparative studies of nucleotide sequences. J. Mol. Evol 1980, 16, 111–120. [Google Scholar] [CrossRef]
- Team, R.C. R: A language and environment for statistical computing. Suppl. Inf. Ref. S 2021, 1, 371–378. [Google Scholar]
- Legendre, P.; Legendre, L. Numerical Ecology; Elsevier: Amsterdam, The Netherlands, 2012. [Google Scholar]
- Oksanen, J.; Blanchet, F.G.; Friendly, M.; Kindt, R.; Legendre, P.; McGlinn, D.; Minchin, P.R.; Wagner, H. Vegan: Community Ecology Package. Ordination Methods, Diversity Analysis and Other Functions for Community and Vegetation Ecologists; R Package Version. 2.5-7. 2020. Available online: https://CRAN.R-project.org/package=vegan (accessed on 25 April 2023).
- Charif, D.; Lobry, J.R. SeqinR 1.0-2: A contributed package to the R project for statistical computing devoted to biological sequences retrieval and analysis. In Structural Approaches to Sequence Evolution; Springer: Berlin/Heidelberg, Germany, 2007; pp. 207–232. [Google Scholar]
- Wickham, H.; Chang, W.; Wickham, M.H. Package ‘ggplot2′. Create Elegant data Visualisations Using the Grammar of Graphics; Version 2(1); Springer: New York, NY, USA, 2016; pp. 1–189. [Google Scholar]
- Eberl, R.; Cohen, S.; Cipriano, F.; Carpenter, E.J. Genetic diversity of the pelagic harpacticoid copepod Macrosetella gracilis on colonies of the cyanobacterium Trichodesmium spp. Aquatic Biology 2007, 1, 33–43. [Google Scholar] [CrossRef]
- Hirai, J.; Tsuda, A.; Goetze, E. Extensive genetic diversity and endemism across the global range of the oceanic copepod Pleuromamma abdominalis. Prog. Oceanogr. 2015, 138, 77–90. [Google Scholar] [CrossRef]
- Roe, H.S.J.; Angel, M.V.; Badcock, J.; Domanski, P.; James, P.T.; Pugh, P.R.; Thurston, M.H. The diel migrations and distributions within a mesopelagic community in the North East Atlantic. 1. Introduction and sampling procedures. Prog. Oceanogr 1984, 13, 3–4. [Google Scholar] [CrossRef]
- Omori, M. The biology of pelagic shrimps in the ocean. Adv. Mar. Biol. 1975, 12, 233–324. [Google Scholar] [CrossRef]
- Nei, M. Molecular Evolutionary Genetics; Columbia University Press: New York, NY, USA, 1987. [Google Scholar]
- Hughes, A.L. Evidence for abundant slightly deleterious polymorphisms in bacterial populations. Genetics 2005, 169, 533–538. [Google Scholar] [CrossRef]
- Ely, B.; Viñas, J.; Bremer, J.R.A.; Black, D.; Lucas, L.; Covello, K.; Labrie, A.V.; Thelen, E. Consequences of the historical demography on the global population structure of two highly migratory cosmopolitan marine fishes: The yellowfin tuna (Thunnus albacares) and the skipjack tuna (Katsuwonus pelamis). BMC Evol. Biol. 2005, 5, 19. [Google Scholar] [CrossRef] [PubMed]
- Hoelzel, A.R.; Shivji, M.S.; Magnussen, J.; Francis, M.P. Low worldwide genetic diversity in the basking shark (Cetorhinus maximus). Biol. Lett. 2006, 2, 639–642. [Google Scholar] [CrossRef] [PubMed]
- Haro-Bilbao, I.; Riginos, C.; Baldwin, J.D.; Zischke, M.; Tibbetts, I.R.; Thia, J.A. Global connections with some genomic differentiation occur between Indo-Pacific and Atlantic Ocean wahoo, a large circumtropical pelagic fish. J. Biogeogr. 2021, 48, 2053–2067. [Google Scholar] [CrossRef]
- Papetti, C.; Zane, L.; Bortolotto, E.; Bucklin, A.; Patarnello, T. Genetic differentiation and local temporal stability of population structure in the euphausiid Meganyctiphanes norvegica. Mar. Ecol. Prog. Ser. 2005, 289, 225–235. [Google Scholar] [CrossRef]
- Peijnenburg, K.T.C.A.; Fauvelot, C.; Breeuwer, J.A.J.; Menken, S.B.J. Spatial and temporal genetic structure of the planktonic Sagitta setosa (Chaetognatha) in European seas as revealed by mitochondrial and nuclear DNA markers. Mol. Ecol. 2006, 15, 3319–3338. [Google Scholar] [CrossRef]
- Bucklin, A.; Wiebe, P.H. Low mitochondrial diversity and small effective population sizes of the copepods Calanus finmarchicus and Nannocalanus minor: Possible impact of climatic variation during recent glaciation. J. Hered. 1998, 89, 383–392. [Google Scholar] [CrossRef]
- Peijnenburg, K.T.C.A.; van Haastrecht, E.K.; Fauvelot, C. Present-day genetic composition suggests contrasting demographic histories of two dominant chaetognaths of the North-East Atlantic, Sagitta elegans and S. setosa. Mar. Biol. 2005, 147, 1279–1289. [Google Scholar] [CrossRef]
- Villar, E.; Farrant, G.K.; Follows, M.; Garczarek, L.; Speich, S.; Audic, S. Lucie Bittner. Environmental characteristics of Agulhas rings affect interocean plankton transport. Science. 2015, 348, 1261447. [Google Scholar] [CrossRef]
- Crosnier, A. Oplophoridae (Crustacea Decapoda) récoltés de 1971 à 1982 par les navires français dans Lócean Indien occidental sud. Bull. Mus. Natl. Hist. Nat. 1987, 9, 695–726. [Google Scholar]
- Burridge, A.K.; Van Der Hulst, R.; Goetze, E.; Peijnenburg, K.T.C.A. Assessing species boundaries in the open sea: An integrative taxonomic approach to the pteropod genus Diacavolinia. Zool. J. Linn. Soc. 2019, 187, 16–40. [Google Scholar] [CrossRef]
- Aznar-Cormano, L.; Brisset, J.; Chan, T.Y.; Corbari, L.; Puillandre, N.; Utge, J.; Zbinden, M.; Zuccon, D.; Samadi, S. An improved taxonomic sampling is a necessary but not sufficient condition for resolving inter-families relationships in Caridean decapods. Genetica 2015, 143, 195–205. [Google Scholar] [CrossRef]
- Sha, Z.; Wang, Y. A new deep-sea species of the genus Systellaspis (Decapoda, Caridea, Oplophoridae) in the Western Pacific. Crustaceana 2015, 88, 1181–1192. [Google Scholar] [CrossRef]
- Iacchei, M.; Gaither, M.R.; Bowen, B.W.; Toonen, R.J. Testing dispersal limits in the sea: Range-wide phylogeography of the pronghorn spiny lobster Panulirus penicillatus. J. Biogeogr. 2016, 43, 1032–1044. [Google Scholar] [CrossRef]
- Ketmaier, V.; Argano, R.; Caccone, A. Phylogeography and molecular rates of subterranean aquatic stenasellid isopods with a peri-tyrrhenian distribution. Mol. Ecol. 2003, 12, 547–555. [Google Scholar] [CrossRef] [PubMed]
- Knowlton, N.; Weigt, L.A. New dates and new rates for divergence across the Isthmus of Panama. Proc. R. Soc. B Biol. Sci. 1998, 265, 2257–2263. [Google Scholar] [CrossRef]
- Morrison, C.L.; Ríos, R.; Duffy, J.E. Phylogenetic evidence for an ancient rapid radiation of Caribbean sponge-dwelling snapping shrimps (Synalpheus). Mol. Phylogenet. Evol. 2004, 30, 381–563. [Google Scholar] [CrossRef]
- Quan, J.; Zhuang, Z.; Deng, J.; Dai, J.; Zhang, Y.P. Phylogenetic relationships of 12 Penaeoidea shrimp species deduced from mitochondrial DNA sequences. Biochem. Genet. 2004, 42, 331–345. [Google Scholar] [CrossRef] [PubMed]
- Da Silva, M.J.; Creer, S.; Dos Santos, A.; Costa, A.C.; Cunha, M.R.; Costa, F.O.; Carvalho, G.R. Systematic and evolutionary insights derived from mtDNA COI barcode diversity in the Decapoda (Crustacea: Malacostraca). PLoS ONE 2011, 6, e19449. [Google Scholar] [CrossRef]
- Dudoit, A.A.; Iacchei, M.; Coleman, R.R.; Gaither, M.R.; Browne, W.E.; Bowen, B.W.; Toonen, R.J. The little shrimp that could: Phylogeography of the circumtropical Stenopus hispidus (Crustacea: Decapoda), reveals divergent Atlantic and Pacific lineages. PeerJ 2018, 6, e4409. [Google Scholar] [CrossRef]
- Vereshchaka, A.; Kulagin, D.; Lunina, A. Discovery of a new species provides a deeper insight into taxonomic grouping of the deep-sea genus Acanthephyra (Crustacea: Decapoda). Diversity 2022, 14, 907. [Google Scholar] [CrossRef]
- DeHart, H.M.; Blanco-Bercial, L.; Passacantando, M.; Questel, J.M.; Bucklin, A. Pathways of pelagic connectivity: Eukrohnia hamata (Chaetognatha) in the Arctic Ocean. Front. Mar. Sci. 2020, 7, 396. [Google Scholar] [CrossRef]

Disclaimer/Publisher’s Note: The statements, opinions and data contained in all publications are solely those of the individual author(s) and contributor(s) and not of MDPI and/or the editor(s). MDPI and/or the editor(s) disclaim responsibility for any injury to people or property resulting from any ideas, methods, instructions or products referred to in the content. |
© 2023 by the authors. Licensee MDPI, Basel, Switzerland. This article is an open access article distributed under the terms and conditions of the Creative Commons Attribution (CC BY) license (https://creativecommons.org/licenses/by/4.0/).