Article

Implications of Ecological Drivers on Roan Antelope Populations in Mokala National Park, South Africa

1
Scientific Services, Conservation Services Division, SANParks, 110040, Hadison Park, Kimberley 8306, South Africa
2
Applied Behavioural Ecology and Ecosystem Research Unit, UNISA, Private Bag X6, Florida 1717, South Africa
3
Department of Nature Conservation and Marine Science, Cape Peninsula University of Technology, 652, Cape Town 8000, South Africa
4
Centre for Environmental Studies, Department of Geography, Geoinformatics and Meteorology, University of Pretoria, Private Bag x20, Hatfield 0028, South Africa
*
Author to whom correspondence should be addressed.
Diversity 2024, 16(6), 355; https://doi.org/10.3390/d16060355
Submission received: 26 March 2024 / Revised: 13 May 2024 / Accepted: 28 May 2024 / Published: 19 June 2024
(This article belongs to the Special Issue Biodiversity in Arid Ecosystems)

Abstract

:
Climate change has massive global impacts and affects a wide range of species. Threatened species such as the roan antelope (Hippotragus equinus) are particularly vulnerable to these changes because of their ecological requirements. Attempts to address concerns about the roan’s vulnerability have not been well documented in South African protected areas. This study identifies the landscape use and distribution of the roan as well as habitat and forage suitability changes to help inform management decisions for the conservation of roan. We used fine- and broad-scale data from Mokala National Park, South Africa that includes roan occurrence data, vegetation condition indices, vegetation (structure and plant species composition), elevation and temperature differences, and precipitation strata to construct a suitability framework using the Maximum Entropy (Maxent) and Random Forest statistical package. In Mokala National Park, roan occurred in the Schmidtia pappophoroides–Vachellia erioloba sparse woodland, Senegalia mellifera–Vachellia erioloba closed woodland, Senegalia melliferaVachellia tortilis open shrubland, Vachellia eriolobaV. tortilis closed woodland and Rhigozum obovatum–Senegalia mellifera open shrubland. The veld (vegetation) condition index (VCI) improved from 2019 (VCI < 50%) to 2021 (VCI > 60%), with the proportion of palatable grass species (Schmidtia pappophoroides and Eragrostis lehmanniana) also increasing. This study identified four key climatic conditions affecting roan distribution, namely annual mean daily temperature range, temperature seasonality, minimum temperatures of the coldest month, and precipitation of the wettest month. These results suggest that the conservation of roan antelope should consider these key variables that affect their survival in preferred habitats and foraging areas in anticipation of changing ecological conditions.

1. Introduction

Biodiversity carries a variety of values, some of which, protected areas safeguard from various threats [1]. Global environmental change drivers including climate change influence biodiversity, often intensified within fenced protected areas containing large terrestrial animals [2]. Climate change that leads to changes in environmental conditions can lead to changes in distribution, reproductive success, foraging behaviour, and even the death of wildlife [3]. Climate change impacts on vegetation can lead to changes in plant species dominance, available forage, and biomass [4]. The implications of these changes can influence the long-term survivorship of wildlife species.
Climate change creates complexity and uncertainty that challenges wildlife and biodiversity management and conservation strategies [3]. These uncertainties and complexities need to be resolved to achieve management objectives, even though the effects of the management activities are in themselves uncertainties. A habitat suitability framework assists with the management of wildlife as part of an adaptive management approach [5,6].
Managing herbivores requires an understanding of wildlife species’ fundamental niches, defined as the conditions that allow for long-term survival [7], habitat needs [8] as well as population dynamics [9], and how various factors may influence these [9]. Mokala National Park (Mokala), located in the semi-arid north-western section of South Africa, was established for the protection of rare and endangered species such as roan antelope (Hippotragus equinus), sable (Hippotragus niger), and tsessebe (Damaliscus lunatus lunatus). Globally the conservation status of roan is Least Concern [10]; however, roan are regionally listed in South Africa as Vulnerable [11]. Mokala is at the edge of the species’ recent distribution, and environmental changes are likely to occur with a changing climate, which can impose challenges on persistence. In addition, range contractions beyond Mokala are likely to result in fragmented populations or patches with intense management approaches in the future.
The scale and spatially explicit distribution of roan can potentially be predicted using occurrence data. Although occurrence data do not indicate ecological interactions [12], they reveal the environmental conditions that meet species’ ecological requirements [13]. In this study, we combine direct observations with machine learning [14] to determine the suitability of Mokala for roan antelope under changing climatic conditions. This framework uses both broadscale and fine-scale measurements as an approach that combines empirical data, integrated remote sensing derived vegetation trends [15,16,17], field-based vegetation conditions, and climatic conditions.
Roan is generally referred to as savanna woodlands and grasslands dwelling antelope occurring in protected subpopulations [11]. The main threats to the roan include reduced habitat quality, genetic diversity, and suitable habitat within protected areas [3]. Roan is sensitive to predation and competition, and they struggle to co-exist with high densities of wildlife [18]. The risk of emerging climate change reducing potentially suitable habitats has been identified as one of the highest threats to the species [3]. Attempts to address the concerns around the vulnerability of the roan include managing roan subpopulations in a way that contributes to its long-term conservation, planning for sustaining the genetic diversity and resilience of the species, and reducing the threat of genetic contamination.
We predict that as the rainfall increases or decreases, vegetation (vegetation structure and plant species dominance) could be changed, altering forage or calving suitability. We also predict that if the dominant herbaceous plant species were to change under climatic conditions, then there would be changes in productivity and change in the biomass of herbaceous (forbs and grasses) plant species (i.e., changes in dominance and palatable biomass available) as well as woody plant productivity and phenology (i.e., flowering, pods, foliage) leading to increased competition between wildlife species. If rainfall increases in duration (season length) and frequency (summer and winter rainfall), then the winter temperatures decrease, which could lead to an impact on vegetation resilience (i.e., stunted growth, reduced palatable biomass). We predict that these changes could potentially influence the persistence and distribution of roan antelope.
This study aims to (a) identify the range use and distribution of roan, (b) identify ecological drivers and suitability, and (c) determine the implications of changing climate and environmental variables on the roan in Mokala.

2. Methods

2.1. Study Area

Mokala National Park (−29°09′56.93″ S, 24°19′10.86″ E) is in the Northern Cape, 80 km south-west of Kimberley (Figure 1). Mokala was proclaimed in 2007; it encompasses 32,445 ha and falls on the Savanna and Nama-Karoo Biome interface. The area is semi-arid with erratic rainfall averaging at 355 mm per annum between 2007 and 2016. Rainfall predominantly occurs during the summer months (October to March). Between 2016 and 2019, there was a drought in the Northern Cape and various areas of South Africa where rainfall was significantly below average. The neighbouring land uses include livestock, wildlife, and crop farming.

2.2. Data Collection and Modelling

Environmental (ecological) niche models (ENM) use occurrence data and pseudo-absence in conjunction with environmental data to create a correlative model of the environmental conditions that meet species’ ecological requirements and predict the relative suitability of their current range considering absence–presence [13]. To develop a framework of habitat suitability, spatially explicit variables were selected for their potential based on knowledge and relevance to the species. These variables included the vegetation condition index (VCI), remotely-sensed-vegetation-based VCI (RS-based VCI), vegetation (structure and species composition), landscape features (geology and topography), and varying layers of temperature and precipitation.
We collated 144 observations of roan occurrence from observations made during general large mammal aerial surveys and ground monitoring by field ranger patrols between 2019 and 2021. Ecological data included climatic, vegetation, and landscape variables. Rainfall data came from data collected from weather stations within Mokala and the Mokala Agricultural Research Council weather station [19]. The bioclimatic variables on the modelling platform used data from WorldClim [20].
Mokala falls within a predominantly summer rainfall area and ranges from 233 mm per year to 558 mm. The average rainfall in the park has been recorded monthly since 2006. The average rainfall increased from 355 mm in 2006 up to 579 mm in 2021; however, the long-term variance remains low [4] (Supplementary material: Figure S1). The temperature in Mokala is less erratic, with the coldest months (June–July) reaching a minimum of −6.6 °C (July 2011) and maximum temperatures in the warmer months (December–January) as high as 43.2 °C (ARC 2022—Supplementary Material Figure S2).
We used a Random Forest model to discern the role of landscape features (i.e., soil, elevation, aspect, slope (topography), and vegetation) as an indication and prediction of roan presence and pseudo-absence. Soil data were sourced from ISRI world soil information (https://files.isric.org/public/soter/ZA-SOTER.zip). DEM was extracted from WorldClim. Elevation, aspect, and slope were computed in QGIS using the raster function. We included roan occurrence and pseudo-absence as response variables and soil, vegetation, elevation, aspect, slope, and distance to the rivers as environmental predictors. The animals are unable to access the river due to fencing; thus, this variable referred to the available surface water at artificial water points. Distribution data were divided into two parts, 80% for training and 20% for testing. Random Forest modelling was implemented with a ‘randomForest’ function in an R statistical environment. Nineteen ‘bioclimatic variables’ were extracted from the WorldClim dataset and represent conditions from 1950 to 2000 [20]. The data were summarised within the 1 km2 grid according to existing resolution scales for climate source data for time-series analysis [21].
Vegetation provides forage, shelter, and other key functions that influence distribution requiring a thorough analysis. The veld condition index (VCI) is a commonly used indicator for determining vegetation condition [15,22] and signifies the impact of drought on vegetation. The use of RS-based VCI provides an additional dataset that supports ground-based verification of veld conditions. The VCI is expressed in percentage (%) and gives an idea of where the observed value is situated between the extreme values (minimum and maximum). Lower and higher values indicate poor and good vegetation indexes, respectively. The outcome of the VCI indicates whether current conditions are above (values above 50%) or below normal (values below 50%) conditions [23]. Mokala landscape units were mapped and described by [24], including landscape units that comprise vegetation features such as plant species composition (i.e., forage, palatability, nutrition), vegetation structures (i.e., canopy cover and height—herbaceous, shrub and tree stratums) [25], and soil (depth and clay content), which are important features for wildlife. The term landscape unit describes the vegetation-cum-habitat. Therefore, when referring to habitat suitability, we define the landscape unit as vegetation (plant species composition and structure), soil, and geology [24]. For the veld condition index (VCI), an adapted [26] framework that described the grazing potential for each landscape unit assisted SANParks in estimating the grazing carrying capacity for grazers in Mokala National Park. There are 10 landscape units described for Mokala (Table 1; Figure 2).
Recording plant species composition and vegetation structure field data per plot in each landscape unit as per [26] methods, a VCI for the landscape unit could be estimated in Mokala, two landscape units were excluded, namely the Searsia lancea open woodland (very small 46 ha) and the Searsia pendulina open woodland (147 ha), closely associated with the Riet River because it is fenced from the park [27]. The adapted [26] was extended by amalgamating vegetation survey data, aerial survey data, satellite-derived normalized difference vegetation index assessments, and dynamic population models.
Relying on occurrence data to infer species distributions and environmental tolerance [28], Maxent uses L1 regularization to constrain modelled distributions rather than match exactly. L1 regularization allows the user to constrain over-parameterisation and over-fitting. The Maxent algorithm controls the parameterisation of the models and selects from a range of levels of complexity. In so doing, the algorithm parameters create feature types. The feature types used for this analysis were Linear features (L), Quadratic features (Q), Hinge features (H), and Product features (P). Each of the feature classes ran three regularization multipliers after selecting the variables that contributed to the initial model result [13]. The regularization multiplier of 3 reduced the model complexity and led to the formation of fifteen (15) models.
To assess the model performance, Maxent uses Receiver Operating Characteristic (ROC) curves [28]. ROC analysis uses both area the under the curve (AUC) and the Akaike information criterion (AIC). The AUC values greater than 0.7 are potentially significant, while scores of 0.5 imply random selection [29]. The AUC uses the information from the occurrence data to train the model to identify the relevant parameters. The AUC tests the quality of the model, while the AIC describes the performance of the model [29]. The AUC (area under the curve), AUCtrain (estimate of model quality), AUCtest (selects the model that produces the maximum AUC value), AUCdiff (minimum difference between AUCtrain and AUCtest), AIC (Akaike information criterion), AICc (AIC correction value), ∆AICc (the relative difference between the best model and other models in the set), w.AIC (the probability that a model is the best), and Para (number of parameters) [13,30] were included. We performed the analysis in Wallace, an R-based GUI application for ecological modelling that builds and visualises models of species niche and distribution [31]. A total of 19 bioclimatic predictors were used as climatic variables (Table 2).

3. Results

The roan were predominantly observed in association with black wildebeest and plains zebra. However, when the black wildebeest were removed from the park, roan were seen in association with and proximity to sable and plains zebra.
The analysis began with first validating the occurrence of roan in Mokala and their distribution. With this information, we identified the potential ecological drivers, such as landscape features. Of the ecological features, the Random Forest model was able to explain 98.14% of what influences the roan distribution in Mokala National Park. In the Random Forest model, the mean-squared error (MSE) provides an objective perspective of a model’s performance. Our results showed that aspect (27.40) is the most influential parameter for roan occurrence and distribution. This was followed by elevation (20.42) and slope (15.44). Distance to the river, vegetation, and soil proved to be the least influential parameters (Table 3; Figure 3).
Roan occurred in 5 of the 10 landscape units identified in Mokala: Schmidtia pappophoroidesVachellia erioloba sparse woodlands, Senegalia melliferaVachellia erioloba closed woodland, Senegalia melliferaVachellia tortilis open shrubland, Vachellia erioloba–V. tortilis closed woodland, and Rhigozum obovatumSenegalia mellifera open shrubland (Table 1; Figure 2) [24]. Of these landscape units, roan frequently occurred in Schmidtia pappophoroidesVachellia erioloba sparse woodland (38% of observations), followed by Rhigozum obovatumSenegalia mellifera open shrubland and Senegalia melliferaVachellia tortilis open shrubland, which were equally observed (18% of observations each). The herbaceous plant species composition is different for Senegalia melliferaVachellia tortilis open shrubland and Rhigozum obovatumSenegalia mellifera open shrubland due to the topography and soil compared to the other three landscape units that have the same herbaceous plant species composition and vegetation structure [24].
The veld condition index was measured, and two data sets were analysed; remote sensing-based (RS-based VCI) and field verification. Both data sets suggest that the VCI improved from 2019 (VCI < 50%) to 2022 (VCI > 60%) (Figure 4). Bothma et al. [26] developed a model that recognises plant resource variation at the landscape unit level and differentiates between the grazing and browsing components in the diet of grazers and herbivores. The percentage of the palatable grass and forb species increased during the study period, for example, Schmidtia pappophoroides and Eragrostis lehmanniana, which contributed towards the plant resource at the landscape level. Additionally, a veld condition index for graze was described for each landscape unit.
A total of 19 bioclimatic predictors were used as climatic variables with the AUC values for all models > 0.90 (Table 4). Of these, there were seven relevant to this study, which were Bio 2 (annual mean diurnal temperature range), Bio 4 (temperature seasonality), Bio 6 (minimum temperature of coldest month), Bio 13 (precipitation of wettest month), Bio 14 (precipitation of the driest month), Bio 15 (precipitation seasonally), and Bio 16 (precipitation of the wettest quarter). Of the seven, Bio 2, Bio 4, Bio 6, and Bio 13 were repeatedly indicated as contributing factors in the best-fit models. The model selection process provided information on the variables of importance (VIP) as it more accurately estimated the relative importance of the climatic variables as well as their suitability. This information criterion-based approach to model selection is appropriate for the sample size of this data set.
The bioclimatic predictors that were identified as significant for roan were Bio 2 (mean diurnal range of monthly temperature), Bio 4 (temperature seasonality), Bio 6 (minimum temperature of the coldest months), Bio 13 (precipitation of wettest month), Bio 14 (precipitation of driest month), Bio 15 (precipitation seasonality), and Bio 16 (precipitation of wettest quarter), (Figure 5). The area under the curve (AUC) values for all models were > 0.90, implying a significant result (Table 4). There were four best-fit models according to the AUC and Akaike information criterion (AIC); Models 4, 5, 9, and 12. Model 6 was a close fit. The AUC is used to evaluate a metrics classification model’s performance. This indicates how much the model is capable of distinguishing between variables. The higher the AUC, the better the model, where 0 is low and 1 is high. The AIC is used to compare the different possible models and determine which one is the best fit for the data. The best-fit models all included the same four bioclimatic factors: Bio 2, 4, 6, and 13.
Bioclimatic Models 4, 5, 9, and 12 were the best fit, and the variables of importance were Bio 2 (annual mean diurnal temperature range), Bio 4 (temperature seasonality), Bio 6 (minimum temperature of the coldest month), and Bio 13 (precipitation of the wettest month).

4. Discussion

For this study, the aim was to use broad-scale occurrence data to identify the ecological drivers that influence the distribution and range use of roan and how this may be impacted by changing climates and environments. The occurrence and distribution data of the roan were identified from observational data collected from various sources, including annual aerial surveys and ground patrols by park rangers and scientists. The direct physiological impacts and the calf survival of roan were not documented during this study.
Random Forest models were used to address the first aim of this study, which was to identify the factors and drivers influencing distribution and occurrence. The topographical features that were identified as contributing towards the occurrence and distribution of roan included the slope, aspect, and elevation. Although topography has been identified as an important factor that influences vegetation patterns, little has been documented on the scale and intensity of the interaction [23], particularly on the local scale of the study site. Slope and elevation did not provide significant contributions to the distribution of roan, likely due to the relatively flat and even terrain landscape of the park. The elevation range in Mokala is fairly even, with high elevations restricted to the hills in the south-central section in areas where the roan was not documented. The results suggest that aspect was the driving topographical factor. This is likely due to the influence of aspect on vegetation patterns due to heat, sun, and radiation exposure and consequently soil moisture, type, and texture. It is recommended that the addition of soil be included as a parameter of the future habitat suitability framework in conjunction with vegetation assessments. Aspect and geology appeared to influence the soil and vegetation (composition and structure) and, consequently, the landscape unit and habitat [23].
To address the second aim of this study, which was to take distribution a step further and identify the ecological drivers that potentially influenced the range use of the roan in Mokala, we assessed the landscape units (vegetation). The roan were documented as occurring in 5 of the 10 landscape units in Mokala; Schmidtia pappophoroides–Vachellia erioloba sparse woodlands, Senegalia mellifera–Vachellia erioloba closed woodland, Senegalia mellifera–Vachellia tortilis open shrubland, Vachellia erioloba–V. tortilis closed woodland, and Rhigozum obovatum–Senegalia mellifera open shrubland. With regards to the plant species composition and vegetation structure of these landscape units, it was noted that each is a woodland or shrubland either closed (100–10% canopy cover), open (10–1% canopy cover), or sparse (1–0.1% canopy cover) [29]. The vegetation structure and plant species composition of each landscape unit did not change, but there was a change with the palatable forb and grass plant species, which became more dominant than the unpalatable plant species in the landscape unit, as also described by Bezuidenhout et al. [33]. Roan have been documented as preferring vegetation with a combination of tall (1–2 m), closed (canopy cover 100–10%) herbaceous stratum [34]. These habitats play a role in both grazing and calving. Given these requirements, roan are especially sensitive to changes in vegetation (herbaceous stratum height and plant species dominance) because they rely on herbaceous and woody plant species to camouflage their young and for foraging [35]. Palatable plant species during the drier years are less dominant, which reduces forage availability. This may explain why roan in Mokala utilise different landscape units for grazing, such as the landscape units with the palatable grass species Schmidtia pappophoroides, Digitaria eriantha, and Cenchrus ciliaris but also utilise the closed or open woodland and shrubland. The rolling, rocky, shallow soil dolerite hills (Rhigozum obovatumSenegalia mellifera open shrubland) landscape unit provides not only tall (0.8–1.0 m), palatable grasses such as Digitaria eriantha and Cenchrus ciliaris in good rainfall years but also provide shelter and cover for ideal roan habitat.
To further interrogate the second aim of this study, which was to identify the contributing climatic factors and, consequently, the third aim, the implications thereof. Of the 19 Bioclims that were inputs for the model, only 7 were relevant for this study, and 4 were repeated as significant for roan: Bio 2 (annual mean diurnal temperature range), Bio 4 (temperature seasonality), Bio 6 (minimum temperature of coldest month), and Bio 13 (precipitation of wettest month). The annual mean diurnal temperature considers the mean of the monthly temperature range and indicates the relevance of temperature fluctuation. Some forb and grass species can be sensitive to cold and frost, while woody species tend to be more resilient and resistant [36,37]. The impacts of frost and cold on forb and grass plant species can lead to negative impacts on plant growth, survival, and reproduction [38]. Shifts in the climate could potentially lead to more frequent and intense frost events. The natural distribution of roan is in subtropical environments with a low range of fluctuating temperatures and a high minimum temperature [10,39]. Temperature seasonality refers to temperature variation within a year and is a measure of temperature change over a year. The larger the standard deviation, the greater the variability in temperature. The observed temperature fluctuation has shifted to lower winter minimums for a longer duration and brief high temperatures. The variation could potentially lead to conditions that affect the landscape units’ production and growth [40]. Therefore, this could influence the forage quality, quantity, and availability for roan. Studies conducted on forage for herbivores in semi-arid environments in Oregon, United States, found that changes in temperature and precipitation shortened the peak plant productivity of shrubs and forbs [41]. The knock-on effect of changes in ecological drivers could lead to possible nutritional consequences for herbivores [42]. The minimum average temperature of the coldest month refers to a specific period within a specified year or period and determines whether roan distribution is affected by cold temperature anomalies throughout the year. The colder average temperature could affect the phenology, growth (volume m3/height), or quality (palatability) of the preferred forage for roan. Total precipitation during the wettest season refers to the wettest month. The extreme precipitation conditions during the year influenced the potential range of the roan. Research conducted on semi-arid rangelands in the United States indicated that temperature and precipitation influenced plant phenology and overall changes in vegetation growth [43]. The influence of climatic variables on phenology has been documented in the literature; however, information regarding phenological changes in herbaceous semi-arid plant communities is limited [40,44]. Research conducted in semi-arid Montana, United States, suggested that changes in precipitation led to earlier growth and flowering of wildflowers [44]. Similarly, regions where changes in phenology have been documented suggest that changes in growth can affect the pollination and senescence potential as well as exposure risk to environmental conditions [43]. The short-term impacts of seasonality on herbaceous plant communities have been well documented; however, more research on the influence of long-term ecological changes on herbivores such as roan in semi-arid environments is required.

5. Conclusions

Roan naturally require savanna conditions and the associated vegetation and landscapes, as seen within their distribution range. Although roan are currently occurring at the edge of their distribution range in Mokala National Park, changing climatic conditions may influence the persistence of this occurrence. The change in minimum temperatures during the coldest months and the amount of precipitation during the wet season impact the growth and composition of vegetation. This has been evident through higher fuel loads in response to available precipitation, as observed during the study period. The colder winters play a role as a precursor to the wet season precipitation where, the colder the winter, the wetter the summer. The Bioclims selected by the models suggest that changing climatic factors that have been predicted to continue in the semi-arid Mokala, may alter the landscape and, consequently, the persistence of roan in the area. If the changes were to continue as predicted over time, then the potential need to reassess alternative habitats for this species within the National Park and other managed protected areas may be required. Given the sensitivity of roan, this species may potentially act as a large, easily detected indicator species. Managing roan in a small, protected area already requires intensive and active management.
There are several adaptive management options available given the potential implications for the roan species; significant range expansion of Mokala to allow for movement to areas that are suitable or safe havens during unfavourable seasonal fluctuations, the reduction in competition from other grazing species or translocation to suitable habitats that are less likely to experience fundamental climatic shifts. The majority of South African national parks have expansion plans however the implementation is a lengthy process but viable. The reduction in competition is a viable option; however, this will need to be taken in the context of what the park aims to achieve and is mandated to accomplish. Mokala is one of the highest producers of plains wildlife for donations and to supplement other park populations. The trade-off of the ‘management–business’ model versus species-specific conservation will require intensive research and deliberation. The translocation of the roan to other parks is viable given that Mokala is already marginally suitable and at the edge of the roan range. This study highlighted the need for adaptive management and decision-making with regard to endangered species in a changing environment.

Supplementary Materials

The following supporting information can be downloaded at: https://www.mdpi.com/article/10.3390/d16060355/s1, Figure S1: Long-term rainfall data (mm) for Mokala National Park from 2008–2021 where drought is below 230 mm indicated by the red line, Figure S2: Temperature data (°C) for Mokala National Park of annual maximum and minimum temperatures.

Author Contributions

Conceptualisation N.T.M.-M., S.F. and H.B.; Methodology N.T.M.-M., S.F. and H.B.; software , N.T.M.-M. and M.M.; validation H.B., A.R. and S.F.; formal analysis N.T.M.-M. and M.M.; investigation N.T.M.-M., H.B., L.M. and R.E.; resources R.E., N.T.M.-M., H.B. and L.M.; data curation R.E. and N.T.M.-M.; writing original draft preparation N.T.M.-M.; Writing review and editing H.B., A.R., S.F.; visualisation N.T.M.-M., H.B. and S.F.; supervision N.T.M.-M., H.B. and S.F.; project administration N.T.M.-M. All authors have read and agreed to the published version of the manuscript.

Funding

This research received no external funding.

Institutional Review Board Statement

Not applicable.

Data Availability Statement

Data can be requested from South African National Parks.

Acknowledgments

The researchers would like to thank the Park Management and especially the Field Rangers from Mokala National Park for their support and the collection of the roan occurrence data and the ARC for climate data.

Conflicts of Interest

The authors declare no conflict of interest.

References

  1. Chape, S.; Harrison, J.; Spalding, M.; Lysenko, I. Measuring the extent and effectiveness of protected areas as an indicator for meeting global biodiversity targets. Philos. Trans. R. Soc. B Biol. Sci. 2005, 360, 443–455. [Google Scholar] [CrossRef]
  2. Elith, J.; Graham, C.H.; Anderson, R.P.; Anderson, R.P.; Dudik, M.; Ferriera, S.; Guisan, A.; Hijmans, R.J.; Huettmann, F.; Leathwick, J.R.; et al. Novel methods improve prediction of species’ distributions from occurrence data. Ecography 2006, 29, 129–151. [Google Scholar] [CrossRef]
  3. Kruger, J.; Parrini, F.; Koen, J.; Collins, K.; Nel, E.J.; Child, M.F. A conservation assessment of Hippotragus equinus. In The Red List of Mammals of South Africa, Swaziland and Lesotho; Child, M.F., Roxburgh, L., Do Linh San, E., Raimondo, D., Davies-Mostert, H.T., Eds.; South African National Biodiversity Institute and Endangered Wildlife Trust: Midrand, South Africa, 2016. [Google Scholar]
  4. Tidmarsh, C.E.M.; Havenga, C.M. The wheel-point method of survey and measurement of semi-open grasslands and Karoo vegetation in South Africa. Mem. Bot. Surv. S. Afr. 1955, 29, 1–49. [Google Scholar]
  5. van Vliet, A.J.H.; de Groot, R.S. Phenological events as indicators of climate change. In RSPB/WWF Workshop on Effects of Climate Change on Flora and Fauna; University of East Anglia: Norwich, UK, 1999; pp. 14–15. [Google Scholar]
  6. O’Donnell, M.S.; Ignizio, D.A. Bioclimatic Predictions for Supporting Ecological Applications in the Conterminous United States. US Geol. Surv. Data Ser. 2012, 691, 10. [Google Scholar]
  7. Havemann, C.P.; Retief, T.A.; Collins, K.; Fynn, R.W.S.; Tosh, C.A.; de Bruyn, P.J.N. Home range and habitat use of roan antelope Hippotragus equinus in Northern Botswana. J. Arid Environ. 2022, 196, 104648. [Google Scholar] [CrossRef]
  8. Kass, J.M.; Vilela, B.; Aiello-Lammens, M.E.; Muscarella, R.; Merow, C.; Anderson, R.P. Wallace: A flexible platform for reproducible modeling of species niches and distributions built for community expansion. Methods Ecol. Evol. 2018, 9, 1151–1156. [Google Scholar] [CrossRef]
  9. Muller, K.; O’connor, T.G.; Henschel, J.R. Impact of a severe frost event in 2014 on woody vegetation within the Nama-Karoo and semi-arid savanna biomes of South Africa. J. Arid. Environ. 2016, 133, 112–121. [Google Scholar] [CrossRef]
  10. Holt, R.D.; Gaines, M.S. Analysis of adaptation in heterogeneous landscape: Implications for the evolution of fundamental niches. Evol. Ecol. 1992, 6, 433–447. [Google Scholar] [CrossRef]
  11. EWT Red Data List 2022. Available online: https://ewt.org.za/red-list/ (accessed on 23 November 2022).
  12. Blanchet, F.G.; Cazelles, K.; Gravel, D. Co-occurrence is not evidence of ecological interactions. Ecol. Lett. 2020, 23, 1050–1063. [Google Scholar] [CrossRef]
  13. Tyowua, B.T.; Orsar, J.T.; Agbelusi, E.A. Habitat preference of Roan Antelope (Hippotragus equinus, Desmarest, 1840) In Kainji Lake National Park, Nigeria. J. Res. For. Wildl. Environ. 2012, 4, 13–21. [Google Scholar]
  14. Sannier, C.A.D.; Taylor, J.C.; Du Plessis, W.; Campbell, K. Real-time vegetation monitoring with NOAA-AVHRR in Southern Africa for wildlife management and food security assessment. Int. J. Remote Sens. 1998, 19, 621–639. [Google Scholar] [CrossRef]
  15. Knoop, M.-C.; Owen-Smith, N. Foraging ecology of roan antelope: Key resources during critical periods. Afr. J. Ecol. 2006, 44, 228–236. [Google Scholar] [CrossRef]
  16. Fick, S.E.; Hijmans, R.J. WorldClim 2: New 1 km spatial resolution climate surfaces for global land areas. Int. J. Climatol. 2017, 37, 4302–4315. [Google Scholar] [CrossRef]
  17. Phillips, S.J.; Anderson, R.P.; Schapire, R.E. Maximum entropy modeling of species geographic distributions. Ecol. Model. 2006, 190, 231–259. [Google Scholar] [CrossRef]
  18. Strimbeck, G.R.; Schaberg, P.G.; Fossdal, C.G.; Schröder, W.P.; Kjellsen, T.D. Extreme low temperature tolerance in woody plants. Front. Plant Sci. 2015, 6, 884. [Google Scholar] [CrossRef]
  19. AgroClimatology Staff. ARC-ISCW AgroClimatology Daily Data Report (DDR Format, Limited Quality Control). In ARC-ISCW Climate Information System; ARC-Institute for Soil, Climate and Water: Pretoria, South Africa, 2023. [Google Scholar]
  20. Elsen, P.R.; Monahan, W.B.; Dougherty, E.R.; Merenlender, A.M. Keeping pace with climate change in global terrestrial protected areas. Sci. Adv. 2020, 6, eaay0814. [Google Scholar] [CrossRef]
  21. Moeslund, J.E.; Arge, L.; Bøcher, P.K.; Dalgaard, T.; Odgaard, M.V.; Nygaard, B.; Svenning, J.-C. Topographically controlled soil moisture is the primary driver of local vegetation patterns across a lowland region. Ecosphere 2013, 4, 91. [Google Scholar] [CrossRef]
  22. Owen-Smith, N. Functional heterogeneity in resources within landscapes and herbivore population dynamics. Landsc. Ecol. 2004, 19, 761–771. [Google Scholar] [CrossRef]
  23. Lesica, P.; Kittelson, P. Precipitation and temperature are associated with advanced flowering phenology in a semi-arid grassland. J. Arid. Environ. 2010, 74, 1013–1017. [Google Scholar] [CrossRef]
  24. Bezuidenhout, H.; Bradshaw, P.L.; Bradshaw, M.; Zietsman, P.C. Landscape units of Mokala National Park, Northern Cape Province, South Africa. Navorsinge Van Die Nas. Mus. Bloemfontein 2015, 31, 1–27. [Google Scholar]
  25. Climate Source, Inc. Downscaled OSU PRISM Climate Data: Corvallis, Oreg., The Climate Source. 2011. Available online: http://www.climatesource.com/ (accessed on 23 October 2023).
  26. Bothma J du, P.; van Rooyen, N.; van Rooyen, M.W. Using diet and plant resources to set wildlife stocking densities in African savannas. Wildl. Soc. Bull. 2004, 32, 840–851. [Google Scholar] [CrossRef]
  27. Meroni, M.; Fasbender, D.; Rembold, F.; Atzberger, C.; Klisch, A. Near real-time vegetation anomaly detection with MODIS NDVI: Timeliness vs. accuracy and effect of anomaly computation options. Remote Sens. Environ. 2018, 221, 508–521. [Google Scholar] [CrossRef]
  28. Mzileni, N.; Ferreira, S.; Bezuidenhout, H.; Smit, I.; de Klerk, J. Mokala National Park Herbivore Off-Take Recommendations 2022: An Integrated Approach Combining Local Knowledge with Data Derived from Animal Census, Herbivore Models, and Vegetation Monitoring and Satellite Imagery; Internal Report 35/2022, Scientific Services; South African National Parks: Kimberley, South Africa, 2022. [Google Scholar]
  29. Edwards, D. A broad-scale structural classification of vegetation for practical purposes. Bothalia 1983, 14, 705–812. [Google Scholar] [CrossRef]
  30. Burnham, K.P.; Anderson, D.R. Model Selection and Multimodel Inference: A Practical Information-Theoretic Approach, 2nd ed.; Springer Science & Business Media: Berlin/Heidelberg, Germany, 2003. [Google Scholar]
  31. Karger, D.N.; Conrad, O.; Böhner, J.; Kawohl, T.; Kreft, H.; Soria-Auza, R.W.; Zimmermann, N.E.; Linder, H.P.; Kessler, M. Climatologies at high resolution for the earth’s land surface areas. Sci. Data 2017, 4, 170122. [Google Scholar] [CrossRef]
  32. IUCN SSC Antelope Specialist Group. Hippotragus equinus. 2017. Available online: https://doi.org/10.2305/IUCN.UK.2017-2.RLTS.T10167A50188287.en (accessed on 16 November 2022).
  33. Bezuidenhout, H.; Botha, J.; Ramaswiela, T.; O’Connor, T. Key determinants of long-term compositional variation of the herbaceous layer in a semi-arid African savanna: Rainfall, soil type, and plant species functional types. Suid-Afr. Tydskr. Vir Natuurwetenskap En Tegnol. 2018, 37, 14. [Google Scholar]
  34. Klein, D.R. Variation in quality of caribou and reindeer forage plants associated with season, plant part, and phenology. Rangifer 1990, 10, 123–130. [Google Scholar] [CrossRef]
  35. Hatfield, J.L.; Prueger, J.H. Temperature extremes: Effect on plant growth and development. Weather Clim. Extrem. 2015, 10 Pt A, 4–10. [Google Scholar] [CrossRef]
  36. Mawdsley, J.R.; O’Mallay, R.O.; Ojima, D.S. A review of, climate-change adaptation strategy for wildlife management and biodiversity conservation. Conserv. Biol. 2009, 23, 1080–1089. [Google Scholar] [CrossRef]
  37. Roux, D.J.; Foxcroft, L.C. The development and application of strategic adaptive management within South African National Parks. Koedoe 2011, 53, 1049. [Google Scholar] [CrossRef]
  38. CaraDonna, P.J.; Bain, J.A. Frost sensitivity of leaves and flowers of subalpine plants is related to tissue type and phenology. J. Ecol. 2016, 104, 55–64. [Google Scholar] [CrossRef]
  39. Ghorbanian, A.; Mohammadzadeh, A.; Jamali, S. Linear and Non-Linear Vegetation Trend Analysis throughout Iran Using Two Decades of MODIS NDVI Imagery. Remote Sens. 2022, 14, 3683. [Google Scholar] [CrossRef]
  40. Gonḉalves, M.; Siegismund, H.R.; van Vuuren, B.J.; Ferrand, N.; Godinho, R. Evolutionary history of the roan antelope across its African range. J. Biogeogr. 2020, 48, 2812–2827. [Google Scholar] [CrossRef]
  41. Brown, C.L.; Coe, P.K.; Clark, D.A.; Wisdom, M.J.; Rowland, M.M.; Averett, J.P.; Johnson, B.K. Climate change effects on understory plant phenology: Implications for large herbivore forage availability. Environ. Res. Ecol. 2022, 1, 011002. [Google Scholar] [CrossRef]
  42. Kimanzi, J.K.; Sanderson, R.A.; Rushton, S.P. Habitat suitability modelling and implications for management of roan antelopes in Kenya. Afr. J. Ecol. 2013, 52, 111–121. [Google Scholar] [CrossRef]
  43. Chen, F.; Weber, K.T. Assessing the impact of seasonal precipitation and temperature on vegetation in a grass-dominated rangeland. Rangel. J. 2014, 36, 185–190. [Google Scholar] [CrossRef]
  44. Kogan, F. Application of vegetation index and brightness temperature for drought detection. Adv. Space Res. 1995, 15, 91–100. [Google Scholar] [CrossRef]
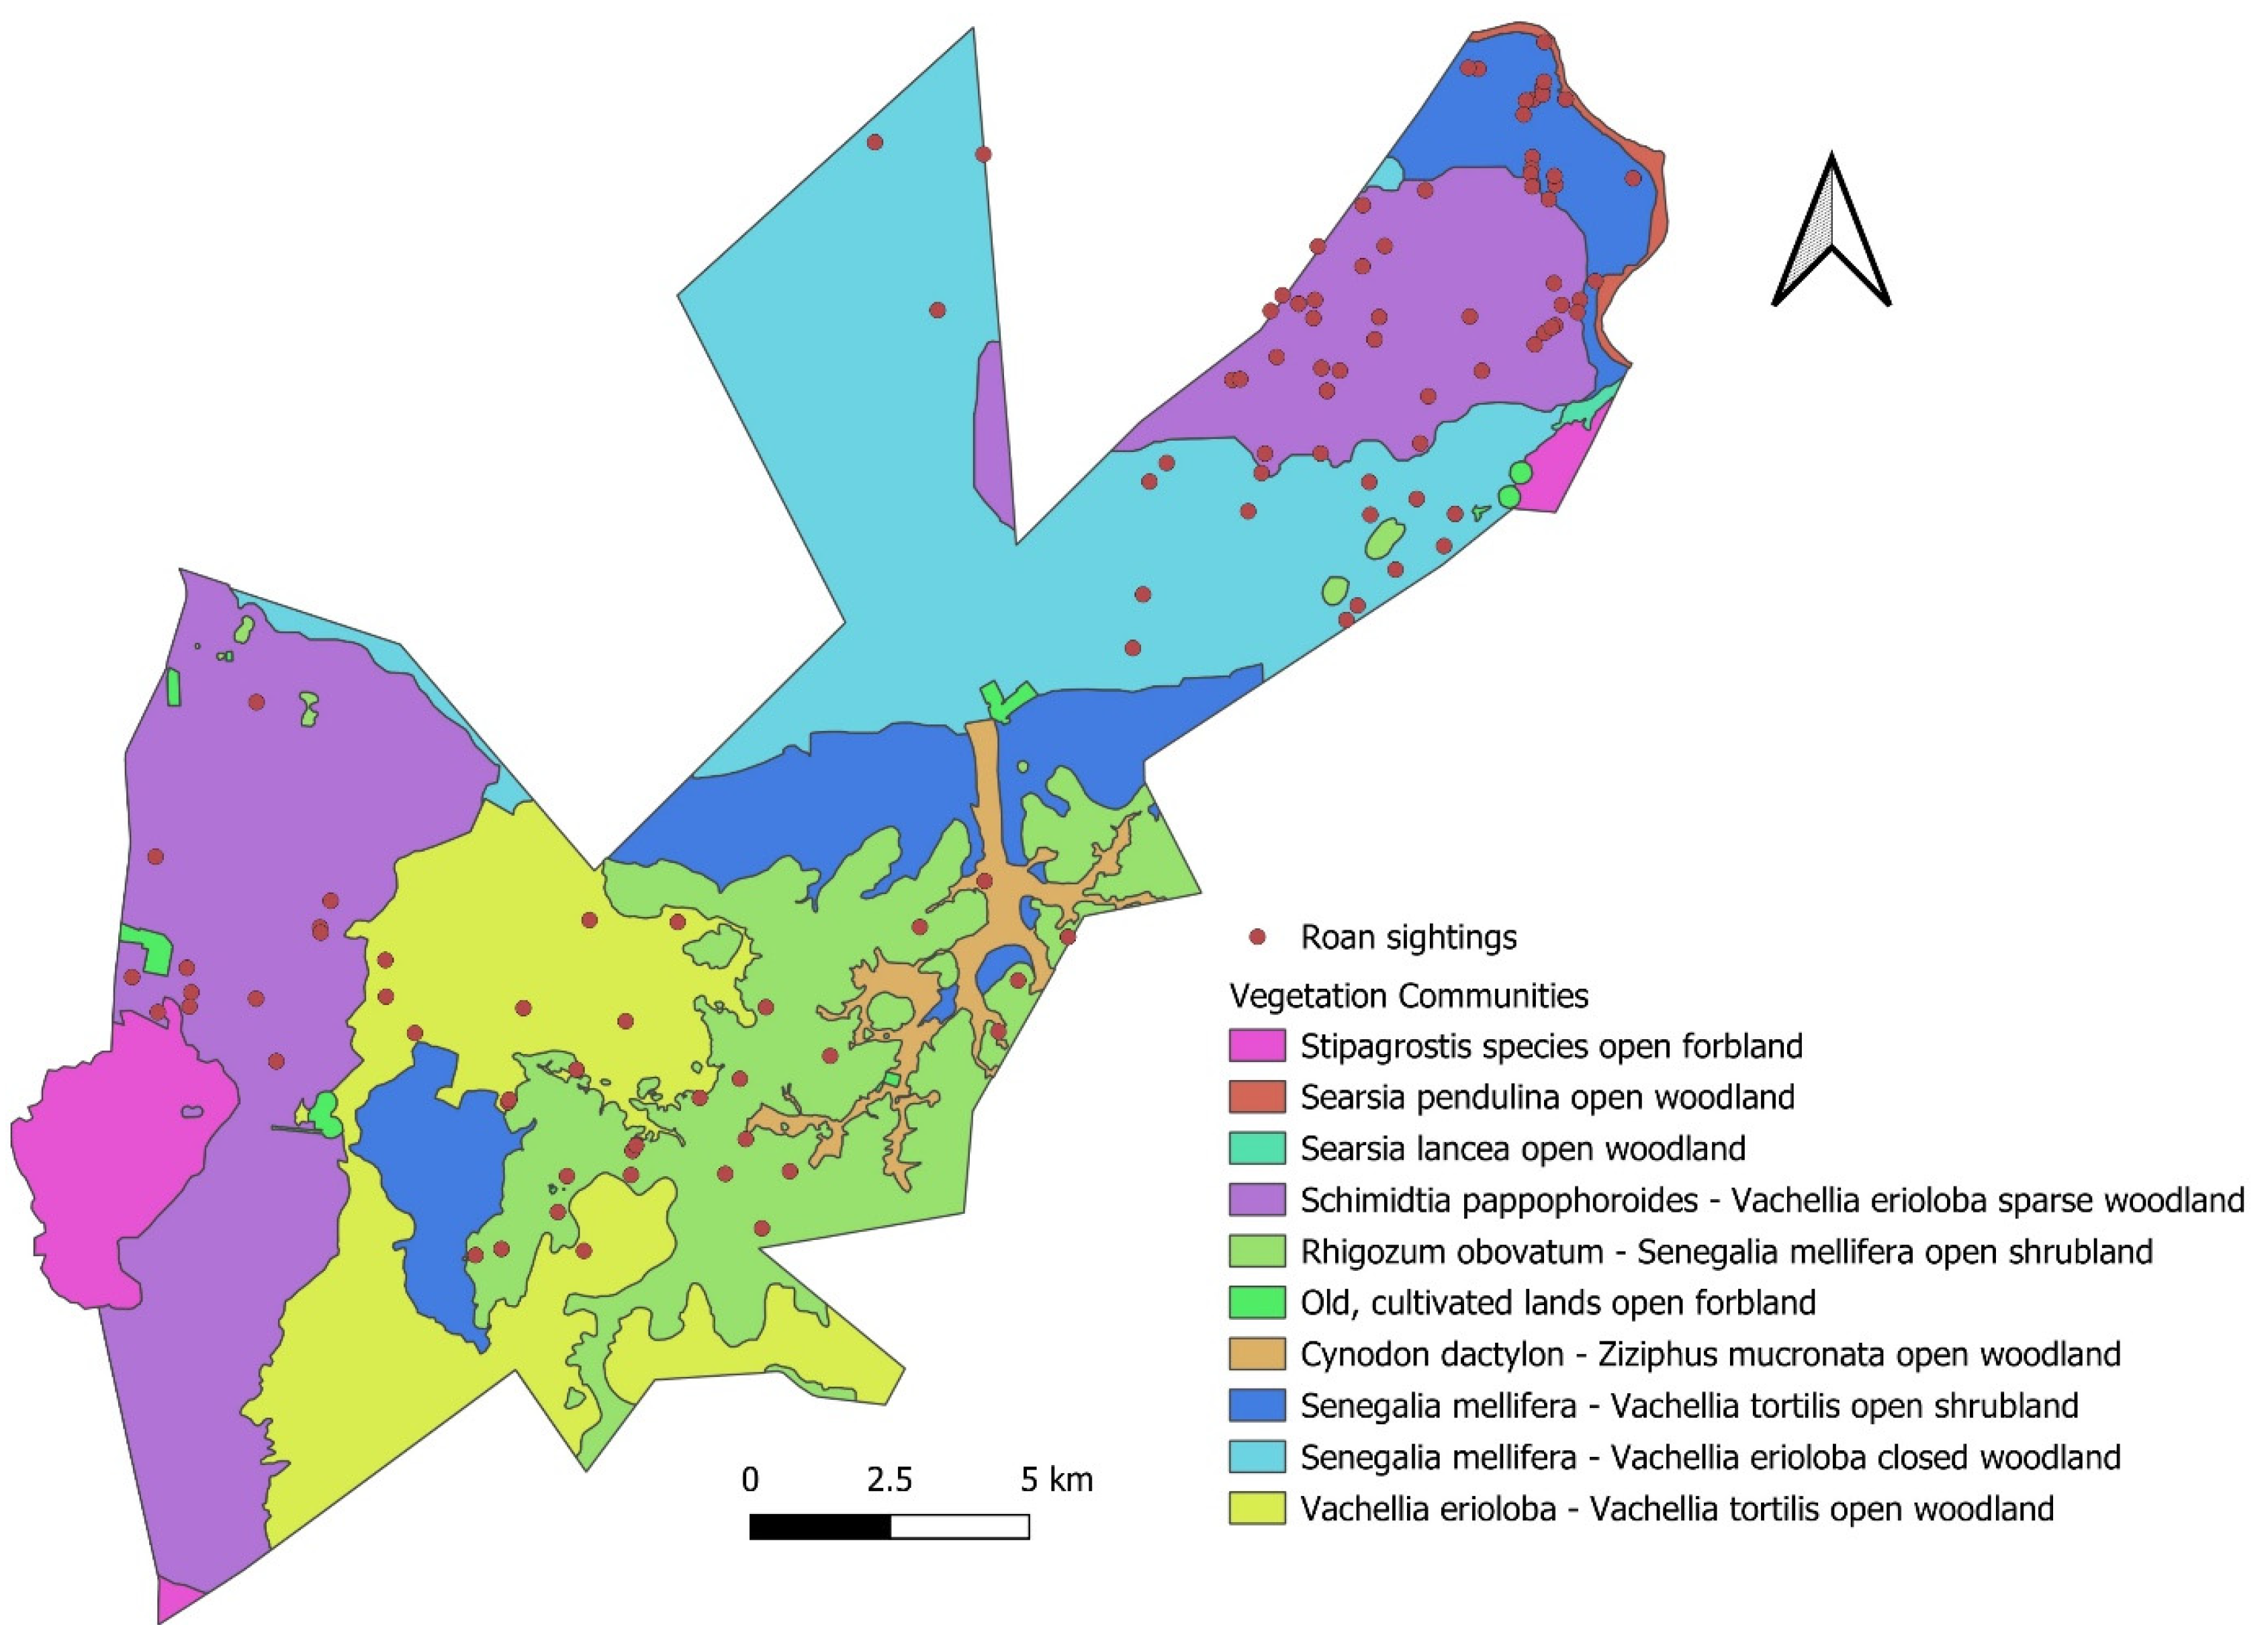
Figure 1. Mokala National Park, study site location in South Africa.
Diversity 16 00355 g001
Figure 2. Mokala National Park with the landscape unit locations of the roan antelope from 2019 to 2022 based on aerial and ground observations.
Diversity 16 00355 g002
Figure 3. Graphical representation of the contributing ecological landscape features on roan and the occurrence and distribution.
Diversity 16 00355 g003
Figure 4. Landscape unit veld condition indexes for 2019 and 2022 (refer to Table 1 for detailed landscape unit and habitat description).
Diversity 16 00355 g004
Figure 5. The predictors that were identified as significant variables of importance for roan in Mokala National Park, including temperature seasonality °C and the precipitation of the wettest month in mm [32].
Diversity 16 00355 g005
Table 1. Landscape units described with a summary of Mokala National Park (adapted from Bezuidenhout et al. [24]) and where roan have been observed.
Habitat Description
Landscape UnitLandscapeGeology and SoilRoan
1Vachellia erioloba–Vachellia tortilis open woodlandUndulating plains, open woodlandAeolian sand covering the Dwyka Formation with deep sandy soilPresent
2Senegalia mellifera–Vachellia erioloba closed woodlandFlat plains, open woodlandAeolian sand covering the Dwyka Formation with deep sandy soilPresent
3Schmidtia pappophoroides–Vachellia erioloba sparse woodlandsFlat plains, sparse woodlandAeolian sand covering the Dwyka Formation with deep sandy soilPresent
4Rhigozum obovatum–Senegalia mellifera open shrublandRolling hills, open shrublandAndesitic lava and dolerite with rocky shallow soilPresent
5Senegalia mellifera–Vachellia tortilis open shrublandSlightly undulating foot slopes Andesitic lava, dolerite, shale, and rocky outcrops with shallow soilPresent
6Cynodon dactylonZiziphus mucronata e open woodlandSlightly undulating clayey drainage lineAlluviumAbsent
7Searsia lancea open woodlandSlightly undulating rocky drainage lineCalcreteAbsent
8Stipagrostis species open woodlandSlightly undulating valley bottomlandsCalcreteAbsent
9Searsia pendulina open woodlandFlat Riet RiverAlluviumAbsent
10Old, cultivated lands open woodlandFlat cultivated landAeolian sand covering the Dwyka FormationAbsent
Table 2. Bioclimatic parameters and the most relevant to the models.
Bioclimatic PredictorUnitDefinitionInterpretation
Bio 1—Annual Mean TemperatureDegrees CelsiusThe annual mean temperatureThe annual mean temperature.
Bio 2—Annual Mean Diurnal RangeDegrees CelsiusThe mean of the monthly temperature ranges (monthly maximum minus monthly minimum).Indicates the relevance of temperature fluctuation for different species.
Bio—3 IsothermyPercentageQuantifies how large the day-to-night temperatures oscillate relative to the summer-to-winter (annual) oscillations.Species distribution may be influenced by large or small temperature fluctuations within a month relative to the year.
Bio 4—Temperature Seasonality (standard deviation)Degrees CelsiusThe amount of temperature variation over a given year based on standard deviation of monthly temperature averages.Temperature seasonality is a measure of temperature change over the course of a year. The larger the standard deviation the greater the variability of temperature.
Bio 5—Max Temperature of Warmest MonthDegrees CelsiusThe maximum monthly temperature occurrence over a given year (time series) or averaged set of years (normal)Used to determine whether species distributions are affected by warm temperature anomalies throughout the year.
Bio 6—Minimum Temperature of Coldest MonthDegrees CelsiusThe minimum monthly temperature occurrence over a given year or averaged specified years.This determines whether species distributions are affected by cold temperature anomalies throughout the year.
Bio 7—Annual Temperature RangeDegrees CelsiusMeasure of temperature variation over a given period of timeUsed to determine whether species distributions are affected by ranges of extreme temperature conditions.
Bio 8—Mean Temperature of Wettest QuarterDegrees CelsiusApproximates the mean temperatures that prevail during the wettest season.This index approximates mean temperature during the wettest three months of the year, which may influence species’ seasonal distribution.
Bio 9—Mean Temperature of Driest MonthDegrees CelsiusApproximates the mean temperatures that prevail during the driest season.This index approximates mean temperature during the driest three months of the year, which may influence species’ seasonal distribution.
Bio 10—Mean Temperature of Warmest QuarterDegrees CelsiusApproximates the mean temperatures that prevail during the warmest quarterThe mean temperature during the warmest three months indicates the influence on species seasonal distribution.
Bio 11—Mean Temperature of Coldest QuarterDegree CelsiusApproximates the mean temperatures that prevail during the coldest quarterThe mean temperature during the coldest three months indicates the influence on species seasonal distribution.
Bio 12—Annual PrecipitationmmThe sum of all total monthly precipitation valuesImportant for determining the importance of water availability to species distribution.
Bio 13—Precipitation of Wettest MonthmmIdentifies the total precipitation that prevails during the wettest month.The wettest month is useful if extreme precipitation conditions during the year influence a species’ potential range.
Bio 14 –Precipitation of Driest MonthmmIdentifies the total precipitation that prevails during the driest month.The driest month is useful if extreme precipitation conditions during the year influence a species’ potential range.
Bio 15—Precipitation Seasonality (CV)mmThe measure of the variation in monthly precipitation totals over the course of the year. Species distributions can be strongly influenced by variability in precipitation.
Bio 16—Precipitation of Wettest QuartermmApproximates total precipitation that prevails during the wettest quarter.Provides total precipitation during the wettest three months of the year, which may affect species’ seasonal distributions.
Bio 17—Precipitation of Driest QuartermmApproximates total precipitation that prevails during the driest quarter.Provides total precipitation during the driest three months of the year, which may affect species’ seasonal distributions.
Bio 18—Precipitation of the Warmest QuartermmApproximates total precipitation during the warmest quarterProvides total precipitation during the warmest three months of the year, which may influence species’ distribution.
Bio 19—Precipitation of Coldest QuartermmApproximates total precipitation during the coldest quarterProvides total precipitation during the coldest three months of the year, which may influence species’ distribution.
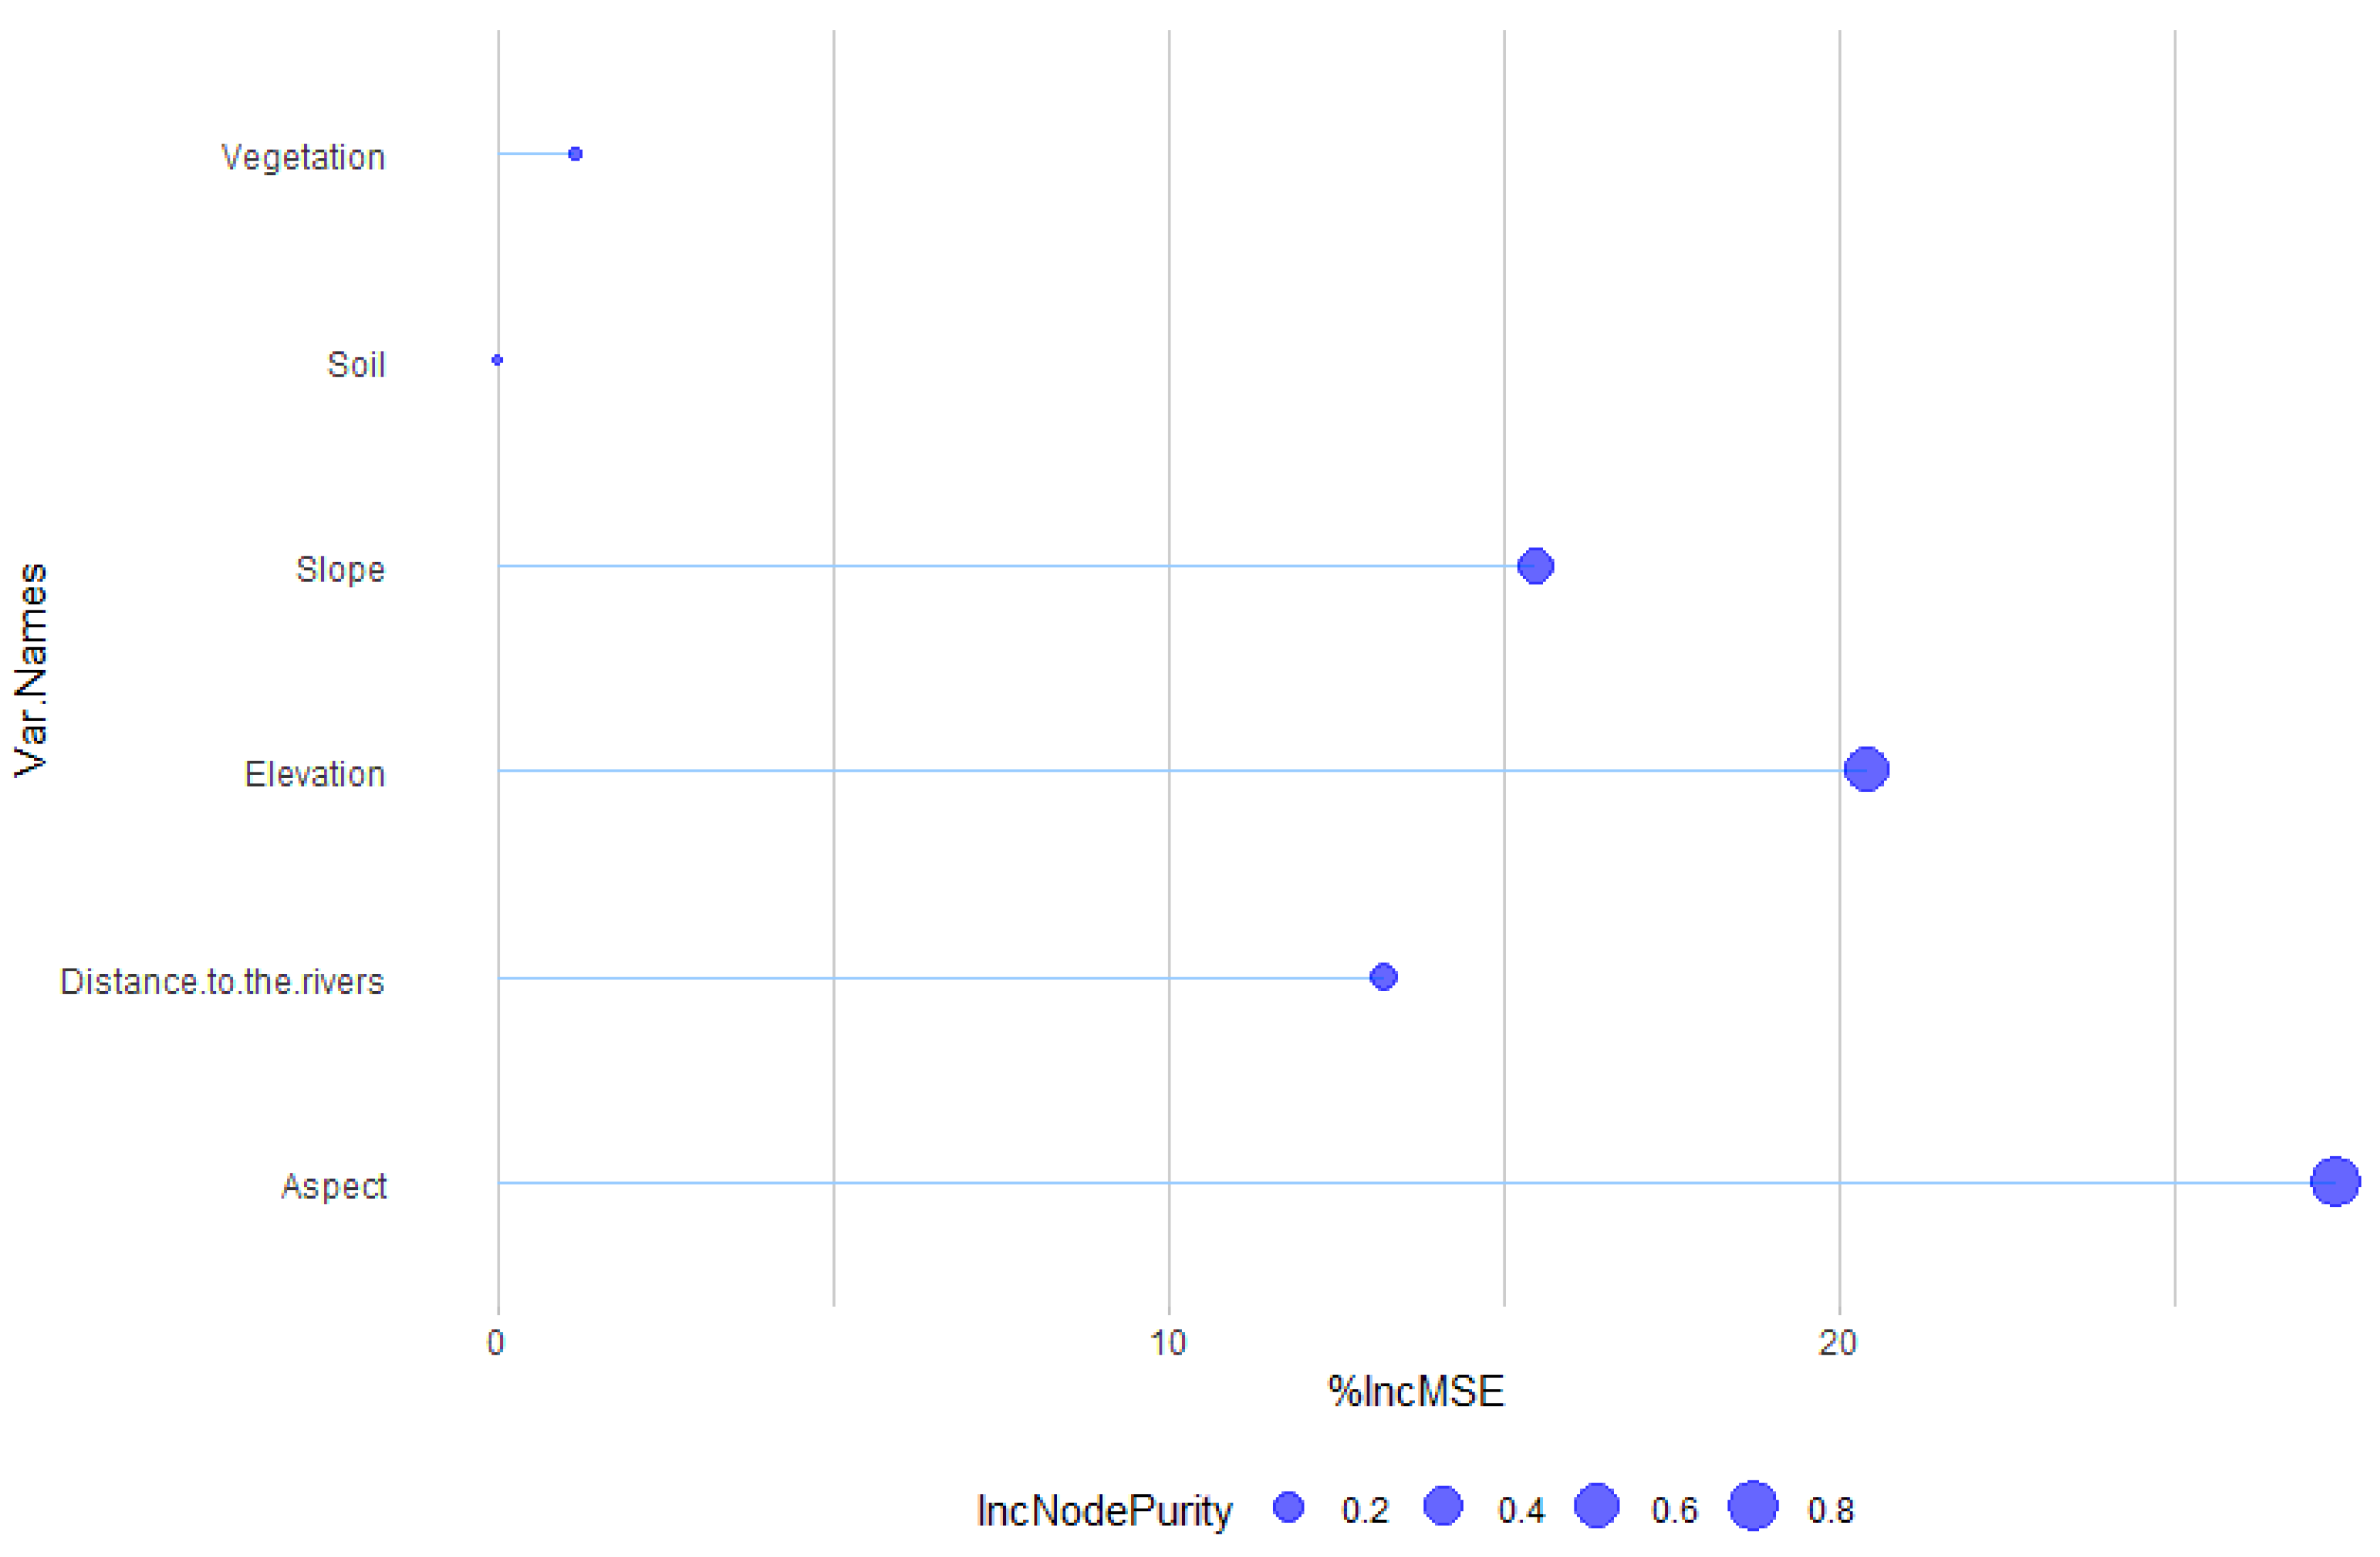
Table 3. The ecological features that contribute to roan occurrence and distribution in Mokala National Park; landscape structures are indicated as most significant.
Environmental Variable%IncMSEIncNodePurity
Aspect27.400.84
Elevation20.420.59
Slope15.440.32
Distance to the river13.220.16
Vegetation1.130.01
Soil0.000.00
Table 4. The bioclimatic model summary table.
MODELFEATUREAUCTRAINAUCDIFFAUCTESTAICC∆AICCW.AICPARA
1rm.1_fc.L0.970.060.87289.3849.600.008
2rm.2_fc.L0.940.040.87262.5322.750.006
3rm.3_fc.L0.910.030.87258.5718.780.005
4rm.1_fc.LQ0.990.030.91249.599.800.017
5rm.2_fc.LQ0.980.020.92244.975.180.076
6rm.3_fc.LQ0.970.020.92239.780.000.875
7rm.1_fc.H1.000.010.98264.3824.600.008
8rm.2_fc.H1.000.000.95257.8518.060.007
9rm.3_fc.H0.990.010.94248.138.340.015
10rm.1_fc.LQH1.000.020.94NANANA11
11rm.2_fc.LQH0.990.020.92271.1731.390.008
12rm.3_fc.LQH0.980.020.92246.356.560.036
13rm.1_fc.LQHP1.000.010.96260.2120.430.008
14rm.2_fc.LQHP0.990.030.94274.2834.500.008
15rm.3_fc.LQHP0.990.040.93249.349.550.016
Disclaimer/Publisher’s Note: The statements, opinions and data contained in all publications are solely those of the individual author(s) and contributor(s) and not of MDPI and/or the editor(s). MDPI and/or the editor(s) disclaim responsibility for any injury to people or property resulting from any ideas, methods, instructions or products referred to in the content.

