Abstract
Investigations of seasonal variations in nest predation rates yield highly variable results. Some investigations argue that search image is responsible for some of the nest-predation patterns, but as far as we know, this study is the first in which search image in connection with seasonal variation in nest-predation rate has been experimentally tested. We used 1457 artificial nests placed in an identical way during the months of March to August, either in the two months consecutively or early and late within one of the two months, between the years 2000 and 2023. In addition, we compared the change in nest-predation rates at 113 artificial and 460 natural nests between the same two months. We estimated the seasonal variation in the abundance of breeding birds in the study area with 140 point counts to find the abundance of different species at the times when they normally breed. We found a strong and consistent seasonal variation in the nest-predation rate, with the highest predation rate in the middle of the breeding season. There was a similar change in the predation rate on natural and artificial nests between May and June. From July to August, the predation rate on artificial nests decreased significantly, while the search-image experiment revealed a significant increase between the same two months. A generalized linear mixed-effect model analysis found that the variation in nest-predation rates on artificial nests was significantly affected by seasonal variation in the estimated number of natural nests, that nests in trees were predated more often than nests on the ground, and that nests in the open landscape and on forest edges suffered higher predation rates than nests inside a forest. Mammals were nest predators significantly more often inside forests and on forest edges than in the open landscape, but birds were much more common nest predators than mammals independent of placement and habitat. Our experiment shows that search image explains the seasonal variation in nest-predation rates. However, more investigations are needed to find the reasons for the variation in published results on seasonal variation. Further, experimental testing on search image to find its contribution to the seasonal variation in nest-predation rates in other areas is also needed.
1. Introduction
Birds’ eggs are very rich in nutrients [1] and are thus a valuable energy source for any predator. Likewise, nestlings are attractive food to meat-eating predators. Predation of eggs and nestlings of birds seems to be the most important cause of nest failures in most species [2,3,4,5,6,7,8]. In some areas, the predation rate is high enough to cause population declines [9,10], and predation rates probably influence life-history traits, habitat use, and bird communities [11,12,13,14]. Seasonal patterns in life-history traits can be associated with nest failure and predation risk [15,16], but other factors, for example, variation in spring phenology and food availability, are also important [17].
Many investigations have shown that nest-predation rates decrease [13,18,19,20,21,22,23,24,25] or increase during the breeding season [26,27,28,29,30,31,32,33,34]. Other investigations have found that they increase [35,36,37,38,39,40] or decrease [23,40] in the middle of the breeding season compared with early and late in the season. Some investigations, however, have found no particular trend in nest-predation rates during the breeding season [41,42,43,44,45,46,47]. Replication of earlier studies is important in determining the generality of the results of a study [48], and this is especially important when the results of former investigations diverge as much as described above. Probably, a composite of factors determines the seasonal variation in nest-predation rate, for example, nest age and developmental stage of offspring [19,22,32], nestling begging calls that are used by corvids to detect and rob nests [49], and parental activity near nests [50]. Phenological development, and thereby nest concealment, can also influence nest-predation rates [23,27].
However, the underlying causes of intra-seasonal variation in nest predation have largely been ignored in studies of avian breeding phenology [24], and earlier studies looking at mechanisms have, with few exceptions, included only one explanatory factor in their analyses [23]. Despite all the investigations on nest predation, we still do not have enough information to understand the topic very well, and in-depth studies on the topic ought to be carried out [51]. Some researchers have discussed the effects of search image on seasonal variation in nest-predation rates found in their investigations [13,23,36,44,52,53]. Despite the fact that search image has been tested in birds [54,55,56], as far as we know, it has not been experimentally tested in relation to seasonal variation in nest-predation rates.
The search-image hypothesis implies that a generalist predator should switch to searching for a cryptic prey type, for example birds’ nests, when the abundance or encounter rate for this prey increases [52,57,58,59,60,61,62,63,64]. Intensification of a predator’s search image can increase the risk of nest predation, especially if nests are in similar microhabitats [52]. Search image enhances prey detection and is reported in both observational and experimental studies [65]. A cryptic and scarce prey species is not typically eaten by a predator but becomes over-represented in the diet of predators when the prey density reaches a certain threshold. In our investigation area in the western part of the boreal forest, the breeding season is restricted to a relatively short period in spring and summer. This implies that the number of natural nests in this area increases and becomes numerous during the spring, and even though the nests are usually well hidden, some of them are found by predators searching for food. To evaluate the degree to which predation rates are potentially affected by the availability of natural nests, we estimated an expected abundance of natural bird nests from March to August. However, finding the expected close positive relationship between the abundance of natural nests and the nest-predation rate would not prove a causal relationship. We therefore used artificial nests to generate a possible search-image response in a period with a normally declining nest-predation rate. If this experiment were to create an effect opposite to the normal change in the predation rate during the same period, we would assume that search image is an important factor explaining seasonal variation in nest-predation rate. We also compared the change in nest-predation rate between natural and artificial nests between May and June to evaluate the reliability of the artificial-nest experiment.
Most of the earlier tests of the search-image hypothesis have used artificial nests [24]. Artificial nests may not provide adequate estimates of the risk of nest predation in real nests [66,67,68,69], but they are necessary and recommended in experiments in which we want to find relative nest-predation rates in relation to ecological factors [13,36,49,70,71,72]. In our study area, the nest-predation rates and patterns are quite similar between natural nests and similar artificial nests [73]. The advantages of artificial nests in our experiments are that we ensure large sample sizes and manipulate nest dispersal and timing of nesting. In addition, we remove variation in parental activity and vigilance at the nest, as well as nest-site selection and clutch-size variation, which are factors that breeding birds can manipulate as a response to assumed predation risk [74,75,76].
Despite the diverging results in the literature cited above, our first prediction (prediction 1) is that our results will be similar to those of an earlier investigation of seasonal variation in nest-predation rate, which was mainly carried out in the same area [36]. This result implies that predation rates are highest in the middle of the breeding season. Our second prediction (prediction 2) is that the estimated number of natural nests with eggs and chicks will also be highest in the middle of the breeding season and that we will find a close correlation between the presumed abundance of natural nests with eggs or nestlings of open-cup nesters and the predation rates of artificial nests. This pattern could result if predators develop a search image of birds’ nests. Our third prediction (prediction 3) is that the search-image experiment will show a stable or increasing nest predation rather than the expected decline in nest predation at this time of year. We have also investigated the predation rate on natural nests, and our fourth prediction (prediction 4) is that we will have a similar change in the predation rates on natural and artificial nests in the periods for which we have data on both nest types.
2. Materials and Methods
2.1. Study Areas
The study areas were in the western part of the mid-boreal forest zone in Norway, in a mosaic landscape with forest, forest patches, farmland, lakes, ocean, mires, and human habitations. The forests here are dominated by Norwegian Spruce Picea abies but include some deciduous and mixed forests. Nearly all artificial nests (n = 1393, number of areas = 45) were in the central region of Norway, 21–71 km north of Trondheim (63.4° N, 10.4° E), and a few nests (n = 64, number of areas = 1) were in the same landscape type in the south-eastern part of Norway, 45 km south-west of Oslo (59.9° N, 10.8° E).
2.2. Artificial-Nest Experiments and Search Image
To evaluate the variation in nest-predation rates during the breeding season, we conducted experiments with artificial nests placed in the same area and in a similar way in two different months or early and late in the same month. We used 1457 open-cup artificial nests placed in 46 different areas between 2000 and 2023, from March to August each year. In March, some areas had snow cover and patches with bare ground, while there was no snow in these areas in the other months. The nests were placed on the ground (n = 807) or in trees 1–1.5 m above the ground (n = 650) and inside the forest a minimum of 50 m away from the forest edge (n = 607), along the forest edge (n = 624) or in an open landscape a minimum of 50 m away from the forest edge (n = 226). With the exception of the nests used in the search-image experiment, nests placed at the forest edge followed the edge closely at a maximum of five meters away from the open area, while nests placed in the open landscape and inside the forest were a minimum of 50 m from the forest edge. The distance between nests was a minimum of 50 m and was often greater than this for nests placed in a similar way because we had to find suitable nest sites and alternated between placement on the ground or in a tree. If nests were placed only on the ground, as in meadows and clear-cut areas, the distance between each nest was increased to a minimum of 100 m. Natural nests less than 50 m apart might suffer higher nest-predation rates compared with nests situated farther apart from each other [77]. The nests were exposed for exactly 10 days, and a nest was considered predated if at least one of two eggs placed in the nest was removed or damaged. The nests were moved between the two periods, but the same area was used and the nests were placed with the same proportion of nests in trees or on the ground and in the same habitat as in the first period.
In the search-image experiment, the distance between nests was only 5–10 m in each area, and the nests were more conspicuous than in the experiments described above. If a predator finds one nest in an area, the predator should be able to find another nest by searching the surrounding neighborhood. This experiment was conducted in the months of July and August in 2022 and 2023, and the nests were exposed to predators for only five days. The nests in 2022 were placed in trees 1–1.5 m above the ground and left empty and without nesting material (only the metal grid) after the experiment in July. New nesting material was added and the nest sites were reused without being moved in August, 31 days after the experiment ended in July. In 2023, all nests were placed on the ground. Nothing was left at the nest sites after the experiment in July, and the setup in August started 14 days after the end of the July experiment.
All nests placed in trees and most nests placed on the ground were made of wire baskets lined with dry grass and moss. In trees, nests were attached to branches with an iron wire. The wire cup was visible from beneath but completely hidden by nesting material from above. We tried to make the appearance somewhat like that of a natural nest. Ground nests were normally placed close to a tree, bush, or stump or on the side of a tussock to mimic naturally placed nests. Because the ground nests were totally covered with nesting material, making the wire cup invisible, we used only a depression in the ground without a wire basket in some areas, but we used identical methods in both periods.
The nests were about 11 cm in outer diameter and about 4 cm deep, similar to those of some other open-cup nesters in the study areas. Each nest contained one fresh quail Coturnix coturnix egg and one plasticine egg. The mean dimensions of 34 measured quail eggs were 33.6 mm ± 2.0 SE in length and 26.5 mm ± 0.8 SE in width, making them comparable in size to eggs from tree-nesting species such as thrushes and common wood pigeon Columba palumbus and ground-nesting species such as hazel grouse Tetrastes bonasia and many waders [78]. Plasticine eggs were constructed from a mixture of grey, brown and green plasticine and were similar in size and shape to the quail eggs. To make them difficult to remove, the plasticine eggs were attached to metal wires with a barb inside the egg and to tree branches under the nest or to structures in the surrounding vegetation.
The risk of predators learning to associate human scent or activity with artificial nests is minimal [13,79]. Therefore, we did not use rubber boots or gloves to avoid leaving scents at the nest. As we used the same method in both periods, any potential effect of human activity increasing the predators’ ability to find nests should be minimal.
2.3. Predator Identification
We examined the marks left on the plasticine eggs to determine whether the predator was a bird or a mammal. The predator could not be identified if the plasticine egg had been removed; if it did not contain any bill, tooth, or claw marks despite predation of the quail egg; or if marks were not distinguishable. A small number of plasticine eggs with only marks made by small rodents, snails, or tits were not considered to be depredated because these groups of animals cannot destroy quail eggs and are not potential predators for eggs of this size [41,79]. Without small rodents as predators, we avoid any problems connected to large annual variations in small-rodent abundance [80,81,82]. The effects of small predators are probably overestimated in artificial nest experiments including plasticine eggs [83], but they can predate eggs from small birds such as warblers [84].
Common potential nest depredators of open-cup nests in our study areas are stoat Mustela erminea, least weasel Mustela nivalis nivalis, American mink Mustela vison, European pine marten Martes martes, red squirrel Sciurus vulgaris, red fox Vulpes vulpes, badger Meles meles, Eurasian jay Garrulus glandarius, Eurasian magpie Pica pica, hooded crow Corvus cornix, and common raven Corvus corax. Stoats and, in particular, least weasels, are specialist predators on rodents, but they predominantly eat birds and eggs as alternative forage when rodent numbers are low [85].
2.4. Estimated Abundance of Natural Nests
To evaluate the connection between artificial-nest predation and the abundance of natural birds’ nests susceptible to predation, we quantified bird abundance in our main study region using standardized point counts [86,87,88]. This was done in seven areas, each with 20 points with exactly 5 min of recordings at each point. All observations were translated into pairs (observations of singing male, female, male and female together, or parent with offspring) [86]. Within each route, the distance between observation points was a minimum 350 m in the open landscape and 250 m in forests. Possible duplicates were kept to a minimum by recording distance and direction to distant birds. The seven routes included in this study were surveyed between 25 May and 20 June 2001, which is within the main breeding season of most birds in the area [78]. All surveys were conducted between 04:00 and 10:00 in the morning and when there was no or very little precipitation and no hard winds and temperatures were above zero. All routes had similar landscapes and heights above sea level to those used in the artificial nest experiments. Therefore, we expect the survey to provide realistic information about the expected variation in abundance of different bird species in the area.
In total, 1882 pairs of birds with open-cup nests susceptible to predation were recorded in the 140 survey points (Table 1). We determined the main breeding season for all recorded species based on the published literature [78] and our own experience (MH, unpublished data). The breeding season was defined to include the main egg-laying period and the length of the incubation and chick-rearing periods in the region (Table 1). We included only open-cup nesting species with body sizes equal to or smaller than those of the common wood pigeon and hazel grouse, thus excluding all cavity nesters, owls, raptors, ducks, divers, and larger grouse species. The main breeding period of each species was categorized into three 10-day periods per month (1st–10th, 11th–20th, and 21st–end of the month) and assigned the value of observed pairs from the survey. The total number of breeding pairs was then summarized for each 10-day period, providing some information about the expected abundance of nests with eggs or chicks during different periods of the breeding season (Figure 1).

Table 1.
Number of pairs (N) of each species observed from March to August in the breeding-bird surveys in seven areas and 140 points within the study area and when their nests contained eggs or chicks. Each month is divided into three ten-day periods (1–10, 11–20, 21–end of month) but includes only the last period of March (Mar) and the first period of August (A). The bird names and sequence follow the IOC World Bird List v. 13.1 (https://www.worldbirdnames.org/new/ (accessed on 16 June 2024).
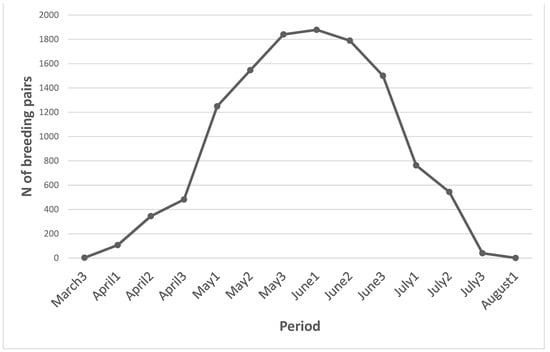
Figure 1.
Estimated numbers of pairs of birds detected during 140 point counts in seven areas within the study area surveyed between 25 May and 20 June, combined with the breeding season of each species (Table 1). The number of breeding pairs (y-axis) are the numbers assumed to have nests with eggs or chicks. Each month is divided into three periods (1st–10th, 11th–20th, and 21st–end of month).
The breeding-bird survey is probably not fully representative of the whole study area and all the years included in our investigation, but it does provide some information about the seasonal variation in bird abundance, which is similar year-to-year. Likewise, the number of registered birds is not equal to the number of nests with eggs or chicks at any given time. Not all pairs of a certain species start breeding at the same time, and some lose their nests early in the breeding period and start another attempt. After successful breeding, some species start a second brood. However, double brooding is less common than it once was [89] and perhaps less common in Fennoscandia compared to Central Europe [90]. Some pairs that lose their clutches might move out of the investigated area, but it is equally probable that pairs that lose their clutches outside the investigated area will move into the study area. Because of these possibilities, the number of natural nests with eggs or chicks is probably lower than illustrated in Figure 1 and delayed in comparison. However, a modified approach would likely yield only a small improvement in reliability.
2.5. Natural Nests
In 1998–2000 and 2004–2006, we found 458 natural open-cup nests in the months of May and June during nest-building and egg-laying and early in the egg-brooding period (Table 2), and we investigated the fate of these nests until the fledging stage. All nests were found within the study area in May and June, but the numbers in each area were not necessarily the same in the two months. All natural nests were inside forests and close to the forest edges. We did not search for natural nests in the open landscape. The height above the ground varied more for natural nests than for artificial nests, with 6.6% of the nests situated below 0.5 m and 69.6% above 1.5 m.
Table 2.
Number of nests of open-cup passerine birds found in May and June during 1998–2000 and 2004–2006.
2.6. Statistics
To reveal the effects of different factors that might influence predation rates, we used generalized linear mixed-effect models (GLMM) with predation (1 = survived nests and 2 = predated nests) as the target variable with binomial distribution and link-function identity. Explanatory variables were the estimated number of natural nests with eggs or chicks, nest placement (1 = in a tree and 2 = on the ground), habitat (1 = open landscape, 2 = forest edge and 3 = forest interior), and year (Table 3) as random factors.
Table 3.
Number of artificial and natural nests in each of two periods and Chi square (χ2) tests comparing the predation rate (depredated or not depredated) in the two periods (df = 1), with increase (+) or decrease (−) in depredation rate if significant (p values in bold). The results are given for combined data from all areas in the given period. If only one month is included, the number of nests early and late in the actual month is given. Natural nests contain nests found in May and June in 1998–2000 and 2004–2006. All others within a given year are artificial nests.
GLMM is a powerful tool with which to estimate independent and random effects in one model, even in unbalanced data [91]. GLMM reduces Type I error rates by removing variability in responses that are associated with random factors rather than the conditions of interest [92]. The GLMM analysis contained only data from one month to the next month with 1108 nests from 30 different areas. This analysis did not include investigations early and late in one month, the investigation between May and July, or the search-image investigation. The correlations between the three explanatory variables were a maximum of 0.27, far below the recommended upper limit of 0.7 [93], and the maximum variation inflation factors were 1.1, far below the often-recommended upper limit of 2 [94,95].
We used stepwise selection of the explanatory variables to find the Akaike Information Criterion (AIC) for the possible models, and the best model included all three explanatory variables. Because AIC > 2 for the other models, they were rejected [94]. Therefore, the GLMM analysis was run with all three explanatory variables.
We used the non-parametric Pearson Chi-square test (χ2) to investigate any changes in nest-predation rates between the two periods for artificial and natural nests separately. All statistical test analyses were performed with SPSS (IBM Statistics SPSS v. 29), and they were two-tailed with an α-level of 0.05.
Earlier, small variations in predation rates on artificial nests between years in the study area were found [96], and year as a random factor was far from significant in our investigation (GLMM: Z = 0.667, p = 0.505). Except in the search-image investigation, we used a minimum distance of 50 m between the nests, which we consider adequate to treat each nest as an independent unit.
The mean nest-predation rate in one area and one period was used to calculate an index for nest predation in the next period using the following equation:
Predation index period 2 = (Percent predated period 2/Percent predated period 1) × Predation index period 1
In this way, it is not important that the predation rates differ between the areas because the same areas are used in the same way in both periods in the index calculations.
3. Results
Of the 1457 artificial nests, 658 were predated (45.2%) within 10 days of exposure. Judging from the marks on the plasticine eggs, 380 were predated by birds (57.8%), 51 (7.8%) by mammals, one by both birds and mammals (0.2%), and 226 (34.3%) by unknown predators. In all nests, except in the search-image experiment, birds were predators on 88.4% of the nests in trees and 84.7% of the nests on the ground, including only nests with known predators and excluding one nest with marks from both bird and mammal predators on the plasticine egg. That means that birds were the main predators both for nests placed in trees and on the ground and that mammals were responsible for only 11.6 and 15.3% of nests in trees and on the ground, respectively, of the predated nests with known predators. Birds were predators for 93.9% of the nests in the open landscape, 83.3% of the nests in the forest edge, and 84.0% of the nests in the forest interior. Mammals were therefore relatively more common as nest predators than birds near the forest edge and in the forest interior compared with the open landscape (χ2 = 6.53, df = 2, p = 0.038). However, most of the nests were predated by birds, independent of nest placement and habitat.
The greatest estimated number of natural nests with eggs and chicks was found during the last 20 days of May to the end of June, especially during the last 10 days of May and the first 20 days of June (Figure 1). The seasonal variation in predation rates on artificial nests varied in a consistent way from March to August (Figure 2). The change was non-significant from March to April, from early to late April, and from April to May. The increase in the predation rate was significant from early to late May and from May to June. From June to July and from July to August, the nest-predation rates decreased significantly, while there was no significant change between May and July (Table 3). The predation rate on natural nests increased significantly from May to June, as did predation on artificial nests in the same period (Table 3). The predation rates in May were 47.2% in natural nests and 50.9% in artificial nests, increasing in June to 61.7% and 75.0%, respectively. The predation rates in natural and artificial nests are not directly comparable. One reason for the difference is that the exposure time was about 30 days (egg laying, brooding, nestling period until fledging) in natural nests and 10 days in artificial nests.
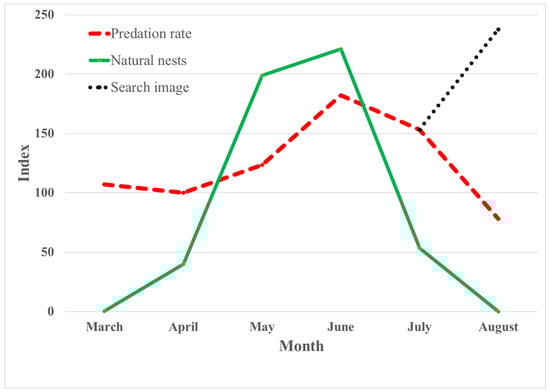
Figure 2.
Index of predation rates on artificial nests (except the search-image experiment) for each month with index 100 in April, the mean number of potential nests with eggs or chicks each month with index 40 in April, and the change in index during the search-image experiment.
Despite a normally significant decline in the predation rate from July to August, the creation of the search-image experiment resulted in a significant increase in the predation rate between these two months (Figure 2). This suggests that search image could account for the variation in predation rates. Figure 2 also shows that there is a quite close relationship between the seasonal variation in the estimated number of natural nests with eggs or chicks in the study area and the nest-predation rates from March to August.
As indicated by the close fit in shape between the estimated number of natural nests with eggs and chicks and the predation rate shown in Figure 2, the results of the GLMM analysis presented in Table 4 show a strong and significant effect of the number of natural nests on the predation rate. The GLMM analyses also show a significantly higher predation rate on nests in trees compared to nests on the ground and on nests on forest edges and, in particular, in the open landscape compared to the forest interior (Table 4).
Table 4.
GLMM analysis with predation of artificial nests as target variable (n = 1108), and nest placement (tree and ground), habitat (Open landscape, forest edge and inside forest), and the mean number of natural nests with eggs or chicks in each month as explanatory variables. The estimated number of natural nests is calculated as the mean of the three periods each month (Table 1). Nests in trees are compared with nests on the ground, and nests in open landscape and in forest edges are compared with nests inside a forest. Significant results are in bold.
4. Discussion
The nest-predation rate varied substantially and significantly during the breeding season, with the highest nest-predation rate in the middle of the breeding season. This result is in accordance with hypothesis 1 and with the results of some other investigations [35,36,37,38,39,97] but not with the majority of investigations referred to in the Introduction [21,22,23,42,43]. These studies show that there is a high diversity in nest-predation rates during the breeding season in different areas, probably because a range of ecological factors also vary during the season and influence the nest-predation rate. These factors are, for example, related to nesting birds [13,22,33], predator behavior and identity [83,98,99,100], and foliage density [23].
The GLMM analysis showed that the seasonal variation in nest predation on artificial nests was significantly explained by the estimated abundance of natural nests when accounting for nest placement and habitat. This is in accordance with prediction 2. In our experiment, the nest-predation rate was mainly skewed slightly to the right (later in the season) compared with the graph showing the estimated abundance of natural nests. This is to be expected because our data on bird abundance include the registered number of pairs and not the number of nests, and pairs in most species do not start to lay eggs simultaneously; they start another attempt if they lose the nest contents, and some pairs might initiate a second brood after a successful first brood [16,78,101]. In addition, the search image starts after the number of nests reaches a certain threshold [52,57,58,59,60,61,62,63]. This means that the expected abundance of nests is slightly farther to the right than shown in Figure 2 and might fit the predation-rate variation even better.
In relation to these arguments, it seems strange that the nest-predation rate in March was higher than expected from the low number of natural nests in this month (Figure 2). The most probable explanation for this is that some areas were still partly covered with snow in March, with patches of bare ground where the artificial nests were placed. It is known that such habitat increases the nest-predation rate because the area for nest placement is limited and predators can concentrate their search on these patches [102,103]. Foliage phenology cannot be an explanation because the artificial nests placed in forests in our study were mostly placed in conifer forests with small seasonal variations in foliage density and because the habitat above the tree line did not have deciduous trees with seasonal variations in foliage density. In addition, foliage phenology does not necessarily have a strong impact on nest predation, as 74% of 106 investigations did not show any effect of foliage phenology [23]. There were no exceptionally harsh weather conditions during the investigation period, and no nests were destroyed by heavy rainfall, flooding, or other weather events.
Search image is our main explanation for the close relationship between the assumed number of natural nests and the nest-predation rate. There are also other types of learning that must be excluded before we have evidence of search image, and one of them is learning to visit a particular place to find food [60]. In addition, a cryptic prey species is needed before we conclude that more efficient predation is caused by search image [58], and the authors of this study offer many examples of publications that claim that search image explains their observations while, in fact, other explanations are equally relevant. Why do we believe that search image is the explanation of our observations? First, birds’ nests, especially natural nests, are cryptic because that is their best chance to avoid predation. The artificial nests in our study were also cryptic because we tried to mimic the appearance and placement of natural nests. In large parts of our study area, earlier investigations have found that nest-predation rates on natural and artificial nests are quite similar [73]. Second, the predation rate in our artificial nests was low early in the breeding season, when the density of natural nests was low, and the predation rate increased significantly when natural nests became more common. Outside the breeding season, there was nearly no nest predation on artificial nests placed mainly in our investigated area [36]. Third, in the search-image experiment, in 2022, there were 31 days without artificial nests, compared to 14 days without nests between the two placements in 2023. Therefore, we do not believe that predators treat the areas as a special place to find food, but instead that search image accounts for the change in nest-predation rate between July and August; this change was significantly different in the search-image experiment compared to the normal change. If the predators in our study areas judged each area as a special place to find food, then we would expect an increase in the predation rate between every period from March to August, but that was surely not the case after June. We have no access to the predators’ cognitive processes [104], but search image is a highly probable explanation. One might argue that the nests of different species constitute a non-homogeneous category of prey and are therefore not suited for the development of search image. However, when we search for nests, we are able to find nests from many different species despite the fact that the nests are not identical in shape and placement, as was also the case for other researchers [105]. In addition, there are many potential nest predators in our research area, and it is possible that they utilize different search images and therefore specialize in different types of nests. Thereby, the nest-predator community predates on various nest types.
However, search image has rarely been tested under natural conditions [106], and a combination of theory and observations is still used to explain prey selection in terms of the operative mechanisms of search image [107]. Despite the fact that subsequent trials with artificial nests showed an increase in predation rate in another experiment [108], it was not so in our experiment after the maximum predation rate was reached in June (Figure 2). Our result is supported by the results of another study in which predators did not revisit the same nests in subsequent trials [109], but it has also been proven that hooded crows may revisit a former nest site even one year after the first visit [110]. However, we conclude that our search-image experiments are reliable and that, in accordance with hypothesis 3, they strongly indicate that search image is the main explanation for the seasonal variation in nest-predation rates in our study area.
The relative values of nest-predation rates in our investigation are consistent and probably trustworthy, and because we have identical setups in each of the two subsequent trials, the change in the predation rate during the season is probably also similar for natural nests. At least, the significant increase in predation rates on artificial and natural nests was quite similar from May to June. This is in accordance with hypothesis 4. May and June were the only two months with a sufficient number of natural nests on which to run statistical analyses. This demonstrates the advantages of using artificial nests.
Birds dominated as predators of the artificial nests compared to mammals, more so than in another investigation in mainly the same area [36]. Our result was independent of whether placement was in a tree, on the ground, in open habitat, on the forest edge, or in the forest interior. The high proportion of birds has also been found by others [36,111] and might partly be explained by the fact that birds prey more often on artificial nests than on natural nests [66,109,112,113].
One might expect that strong seasonal variation in nest-predation rates might result in some birds breeding outside the main breeding season [114]. This has been found in some investigations [76], but other investigations have not found that birds breed in periods with a lower nest-predation rate to enhance their reproductive rate [43]. It might, on the other hand, be an advantage to breed simultaneously with conspecifics because of the safety in numbers (dilution effect), improved defense, and increased vigilance [114,115,116]. Many investigations have shown that the breeding season should start early in the spring to achieve higher productivity [115,117]. Early breeding is advantageous in relation to nest predation, as found in our investigation, but it can also be risky because of bad weather early in the spring. It might perhaps be impossible to breed early because of the low body condition of the breeding birds, and early breeding might reduce parents’ future reproductive output [118,119,120,121]. A review paper stated that both very early- and very late-breeding can result in reduced fledging success [115]. It has been demonstrated that constraints prevent some species from breeding earlier than they do when supplementary feeding significantly enhances egg-laying dates [122,123,124], but this is not always so [125]. The disadvantage of late breeding is that the young birds will have less time to acquire the strength and skills needed to survive the approaching winter.
Considering the variable results with regard to seasonal variation in nest-predation rates in different publications, more investigations are recommended, including, eventually, a review paper to reveal the reasons for the discrepancies in the literature. As this is the first example of experimental testing of search image as an explanation of the seasonal variation in nest-predation rate, further investigations of this hypothesis are certainly needed.
Author Contributions
Conceptualization, M.H.; methodology, M.H. and T.V.; software, M.H.; validation, M.H.; formal analysis, M.H.; investigation, M.H. and T.V.; resources, M.H.; data curation, M.H.; writing—original draft preparation, M.H.; writing—review and editing, M.H. and T.V.; visualization, M.H.; supervision, M.H.; project administration, M.H.; funding acquisition, None. All authors have read and agreed to the published version of the manuscript.
Funding
This research received no external funding.
Institutional Review Board Statement
Not applicable.
Data Availability Statement
The data presented in this study are available on request from the corresponding author (for the moment including other data).
Acknowledgments
We acknowledge Morten Einarsve, Ann-Kristin Skjeflo Grande and Arve Hojem for their assistance in the fieldwork.
Conflicts of Interest
The authors declare no competing interests.
References
- Birkhead, T. The Most Perfect Thing. Inside (and Outside) a Bird’s Egg; Bloomsbury: London, UK, 2016; pp. 1–288. [Google Scholar]
- Lack, D. The Natural Regulation of Animal Numbers; Oxford University Press: Oxford, UK, 1954. [Google Scholar]
- Skutch, A.F. A breeding bird census and nesting success in central America. IBIS 1966, 108, 1–16. [Google Scholar] [CrossRef]
- Ricklefs, R.E. An analysis of nesting mortality in birds. Smithson. Contrib. Zool. 1969, 9, 48. [Google Scholar] [CrossRef]
- Best, L.B.; Stauffer, D.F. Factors affecting nesting success in riparian bird communities. Condor 1980, 82, 149–158. [Google Scholar] [CrossRef]
- Hann, H.W. Life history of the oven-bird in southern Michigan. Wilson Bull. 1937, 49, 145–237. [Google Scholar]
- Zanette, L.; Jenkins, B. Nesting success and nest predators in forest fragments: A study using real and artificial nests. Auk 2000, 117, 445–454. [Google Scholar] [CrossRef]
- Pierce, A.J.; Sankamethawee, W.; Powell, L.A.; Gale, G.A. Patterns of nesting and nest success in an evergreen forest in southeast Asia. Emu-Austral Ornithol. 2020, 120, 46–55. [Google Scholar] [CrossRef]
- Robinson, S.K.; Thompson, F.R.; Donovan, T.M.; Whitehead, D.R.; Faaborg, J. Regional forest fragmentation and the nesting success of migratory birds. Science 1995, 267, 1987–1990. [Google Scholar] [CrossRef] [PubMed]
- Roodbergen, M.; van der Werf, B.; Hotker, H. Revealing the contributions of reproduction and survival to the europe-wide decline in meadow birds: Review and meta-analysis. J. Ornithol. 2012, 153, 53–74. [Google Scholar] [CrossRef]
- Slagsvold, T. Clutch size variation in passerine birds: The nest predation hypothesis. Oecologia 1982, 54, 159–169. [Google Scholar] [CrossRef]
- Stearns, S.C. Life-history tactics: A review of the ideas. Quaterly Rev. Biol. 1976, 51, 3–47. [Google Scholar] [CrossRef]
- Roos, S. Functional response, seasonal decline and landscape differences in nest predation risk. Oecologia 2002, 133, 608–615. [Google Scholar] [CrossRef] [PubMed]
- Martin, T.E. Avain life-history evolution in relation to nest sites, nest predation, and food. Ecol. Monogr. 1995, 65, 101–127. [Google Scholar] [CrossRef]
- Mönkkönen, M.; Forsman, J.T.; Kananoja, T.; Ylonen, H. Indirect cues of nest predation risk and avian reproductive decisions. Biol. Lett. 2009, 5, 176–178. [Google Scholar] [CrossRef]
- Perrins, C.M. Timing of birds’ breeding seasons. IBIS 1970, 112, 242–255. [Google Scholar] [CrossRef]
- Klomp, H. The determination of clutch-size in birds. A review. Ardea 1970, 58, 1–124. [Google Scholar] [CrossRef]
- Brown, W.P.; Roth, R.R. Temporal patterns of fitness and survival in the wood thrush. Ecology 2002, 83, 958–969. [Google Scholar] [CrossRef]
- Davis, S.K. Nest-site selection patterns and the influence of vegetation on nest survival of mixed-grass prairie passerines. Condor 2005, 107, 605–616. [Google Scholar] [CrossRef]
- Preston, K.L.; Rotenberry, J.T. Independent effects of food and predator-mediated processes on annual fecundity in a songbird. Ecology 2006, 87, 160–168. [Google Scholar] [CrossRef]
- Yahner, R.H.; Cypher, B.L. Effects of nest location on depredation of artificial arboreal nests. J. Wildl. Manag. 1987, 51, 178–181. [Google Scholar] [CrossRef]
- Kroll, A.J.; Haufler, J.B. Age and clutch size variation in dusky flycatcher nest survival. J. Ornithol. 2009, 150, 409–417. [Google Scholar] [CrossRef]
- Borgmann, K.L.; Conway, C.J.; Morrison, M.L. Breeding phenology of birds: Mechanisms underlying seasonal declines in the risk of nest predation. PLoS ONE 2013, 8, 10. [Google Scholar] [CrossRef] [PubMed]
- Borgmann, K.L. Mechanisms Underlying Intra-Seasonal Variation in the Risk of Avian Nest Predation: Implications for Breeding Phenology. Ph.D. Thesis, The University of Arizona, Tucson, AZ, USA, 2010; p. 161. [Google Scholar]
- Shustack, D.P.; Rodewald, A.D. Nest predation reduces benefits to early clutch initiation in northern cardinals Cardinalis cardinalis. J. Avian Biol. 2011, 42, 204–209. [Google Scholar] [CrossRef]
- Patnode, K.A.; White, D.H. Effects of habitat on avian productivity in abandoned pecan orchards in Southern Georgia. J. Field Ornithol. 1992, 63, 77–85. [Google Scholar]
- Vander Lee, B.A.; Lutz, R.S.; Hansen, L.A.; Mathews, N.E. Effects of supplemental prey, vegetation, and time on success of artificial nests. J. Wildl. Manag. 1999, 63, 1299–1305. [Google Scholar]
- Wiebe, K.L. Delayed timing as a strategy to avoid nest-site competition: Testing a model using data from starlings and flickers. Oikos 2003, 100, 291–298. [Google Scholar] [CrossRef]
- Nur, N.; Holmes, A.L.; Geupel, G.R. Use of survival time analysis to analyze nesting success in birds: An example using loggerhead shrikes. Condor 2004, 106, 457–471. [Google Scholar] [CrossRef]
- Grant, T.A.; Shaffer, T.L.; Madden, E.M.; Pietz, P.J. Time-specific variation in passerine nest survival: New insights into old questions. Auk 2005, 122, 661–672. [Google Scholar] [CrossRef]
- Müller, M.; Pasinelli, G.; Schiegg, K.; Spaar, R.; Jenni, L. Ecological and social effects on reproduction and local recruitment in the red-backed shrike. Oecologia 2005, 143, 37–50. [Google Scholar] [CrossRef]
- Schaub, R.; Mumme, R.L.; Woolfenden, G.E. Predation on the eggs and nestlings of Florida scrub jays. Auk 1992, 109, 585–593. [Google Scholar]
- Ludwig, M.; Schlinkert, H.; Holzschuh, A.; Fischer, C.; Scherber, C.; Trnka, A.; Tscharntke, T.; Batary, P. Landscape-moderated bird nest predation in hedges and forest edges. Acta Oecol.-Int. J. Ecol. 2012, 45, 50–56. [Google Scholar] [CrossRef]
- Eguchi, K. Seasonal change in breeding success of the blackbilled magpie Pica pica sericea. Jpn. J. Ornithol. 1995, 44, 73–80. [Google Scholar] [CrossRef]
- Wilson, S.; Martin, K.; Hannon, S.J. Nest survival patterns in willow ptarmigan: Influence of time, nesting stage, and female characteristics. Condor 2007, 109, 377–388. [Google Scholar] [CrossRef]
- Husby, M.; Hoset, K. Seasonal variation in nest predation rates in boreal forests. J. Ornithol. 2018, 159, 975–984. [Google Scholar] [CrossRef]
- Cox, W.A.; Thompson, F.R.; Faaborg, J. Species and temporal factors affect predator-specific rates of nest predation for forest songbirds in the Midwest. Auk 2012, 129, 147–155. [Google Scholar] [CrossRef]
- Burhans, D.E.; Dearborn, D.; Thompson, F.R.; Faaborg, J. Factors affecting predation at songbird nests in old fields. J. Wildl. Manag. 2002, 66, 240–249. [Google Scholar] [CrossRef]
- Fenske-Crawford, T.J.; Niemi, G.J. Predation of artificial ground nests at two types of edges in a forest-dominated landscape. Condor 1997, 99, 14–24. [Google Scholar] [CrossRef][Green Version]
- Rosoni, J.R.R.; Fontana, C.S.; Carlos, C.J. Timing of breeding as a determinant of nest success of the vulnerable chestnut seedeater (Sporophila cinnamomea) in grasslands of southern South America. Avian Res. 2023, 14, 10. [Google Scholar] [CrossRef]
- Nour, N.; Matthysen, E.; Dhondt, A.A. Artificial nest predation and habitat fragmentation: Different trends in bird and mammal predators. Ecography 1993, 16, 111–116. [Google Scholar] [CrossRef]
- Telleriá, J.L.; Santos, T. Spatiotemporal patterns of egg predation in forest islands: An experimental approach. Biol. Conserv. 1992, 62, 29–33. [Google Scholar] [CrossRef]
- Major, R.E.; Pyke, G.H.; Christy, M.T.; Gowing, G.; Hill, R.S. Can nest predation explain the timing of the breeding season and the pattern of nest dispersion of New Holland honeyeaters. Oikos 1994, 69, 364–372. [Google Scholar] [CrossRef]
- Yahner, R.H.; Morrell, T.E. Depredation of artificial avian nests in irrigated forests. Wilson Bull. 1991, 103, 113–117. [Google Scholar]
- Draycott, R.A.H.; Hoodless, A.N.; Woodburn, M.I.A.; Sage, R.B. Nest predation of common pheasants Phasianus colchicus. IBIS 2008, 150, 37–44. [Google Scholar] [CrossRef]
- Meilvang, D.; Moksnes, A.; Roskaft, E. Nest predation, nesting characteristics and nest defence behaviour of fieldfares and redwings. J. Avian Biol. 1997, 28, 331–337. [Google Scholar] [CrossRef]
- Noske, R.A.; Fischer, S.; Brook, B.W. Artificial nest predation rates vary among habitats in the Australian monsoon tropics. Ecol. Res. 2008, 23, 519–527. [Google Scholar] [CrossRef]
- Andrén, H.; Angelstam, P. Elevated predation rates as an edge effect in habitat islands: Experimental evidence. Ecology 1988, 69, 544–547. [Google Scholar] [CrossRef]
- Husby, M. Nestling begging calls increase predation risk by corvids. Anim. Biol. 2018, 69, 137–155. [Google Scholar] [CrossRef]
- Martin, T.E.; Scott, J.; Menge, C. Nest predation increases with parental activity: Separating nest site and parental activity effects. Proc. R. Soc. B Biol. Sci. 2000, 267, 2287–2293. [Google Scholar] [CrossRef] [PubMed]
- Quinn, J.L.; Reynolds, S.J.; Bradbury, R.B. Birds as predators and as prey. IBIS 2008, 150, 1–8. [Google Scholar] [CrossRef]
- Martin, T.E. On the advantage of being different-nest predation and the coexistence of bird species. Proc. Natl. Acad. Sci. USA 1988, 85, 2196–2199. [Google Scholar] [CrossRef]
- Schiegg, K.; Eger, M.; Pasinelli, G. Nest predation in reed buntings Emberiza schoeniclus: An experimental study. IBIS 2007, 149, 365–373. [Google Scholar] [CrossRef]
- Gendron, R.P. Searching for cryptic prey: Evidence for optimal search rates and the formation of search images in quail. Anim. Behav. 1986, 34, 898–912. [Google Scholar] [CrossRef]
- Bond, A.B.; Kamil, A.C. Searching image in blue jays: Facilitation and interference in sequential priming. Anim. Learn. Behav. 1999, 27, 461–471. [Google Scholar] [CrossRef]
- Bond, A.B.; Kamil, A.C. Visual predators select for crypticity and polymorphism in virtual prey. Nature 2002, 415, 609–613. [Google Scholar] [CrossRef]
- Morgan, R.A.; Brown, J.S. Using giving-up densities to detect search images. Am. Nat. 1996, 148, 1059–1074. [Google Scholar] [CrossRef]
- Lawrence, E.S.; Allen, J.A. On the term search image. Oikos 1983, 40, 313–314. [Google Scholar] [CrossRef]
- Tinbergen, L. The natural control of insects in pine woods. I. Factors influencing the intensity of predation by songbirds. Arch. Neerl. Zool 1960, 13, 265–343. [Google Scholar] [CrossRef]
- Krebs, J.R. Behavioral aspects of predation. In Perspectives in Ethology; Bateson, P.P.G., Klopfer, P.H., Eds.; Plenum Press: New York, NY, USA, 1973; pp. 73–111. [Google Scholar]
- Tinbergen, N.; Impekoven, M.; Franck, D. An experiment on spacing-out as a defence against predation. Behaviour 1967, 28, 307–321. [Google Scholar] [CrossRef]
- Nams, V.O. Density-dependent predation by skunks using olfactory search images. Oecologia 1997, 110, 440–448. [Google Scholar] [CrossRef]
- Elmberg, J.; Folkesson, K.; Guillemain, M.; Gunnarsson, G. Putting density dependence in perspective: Nest density, nesting phenology, and biome, all matter to survival of simulated mallard Anas platyrhynchos nests. J. Avian Biol. 2009, 40, 317–326. [Google Scholar] [CrossRef]
- Lehtinen, S.O.; Perälä, T.A.; Uusi-Heikkilä, S.K.; Kuparinen, A.K. Mutually exclusive feeding yields Holling type III functional response. Funct. Ecol. 2024, 38, 403–416. [Google Scholar] [CrossRef]
- Krebs, J.R.; Davies, N.B. Behavioural Ecology. An Evolutionary Approach; Blackwell Publishing: Oxford, UK, 2003; pp. 1–456. [Google Scholar]
- Storaas, T. A comparison of losses in artificial and naturally-occurring capercaillie nests. J. Wildl. Manag. 1988, 52, 123–126. [Google Scholar] [CrossRef]
- Thompson, F.R.; Burhans, D.E. Differences in predators of artificial and real songbird nests: Evidence of bias in artificial nest studies. Conserv. Biol. 2004, 18, 373–380. [Google Scholar] [CrossRef]
- Major, R.E.; Kendal, C.E. The contribution of artificial nest experiments to understanding avian reproductive success: A review of methods and conclusions. IBIS 1996, 138, 298–307. [Google Scholar] [CrossRef]
- Burke, D.M.; Eliliott, K.; Moore, L.; Dunford, W.; Nol, E.; Phillips, J.; Holmes, S.; Freemark, K. Patterns of nest predation on artificial and natural nests in forests. [Patrones de depredación de nidos artificiales y naturales en bosques.]. Conserv. Biol. 2004, 18, 381–388. [Google Scholar] [CrossRef]
- Magrath, R.D.; Haff, T.M.; Horn, A.G.; Leonard, M.L. Calling in the face of danger: Predation risk and acoustic communication by parent birds and their offspring. In Advances in the Study of Behavior; Brockmann, H.J., Roper, T.J., Naguib, M., WynneEdwards, K.E., Mitani, J.C., Simmons, L.W., Eds.; Elsevier Academic Press Inc.: San Diego, CA, USA, 2010; Volume 41, pp. 187–253. [Google Scholar]
- Mönkkönen, M.; Husby, M.; Tornberg, R.; Helle, P.; Thomson, R.L. Predation as a landscape effect: The trading off by prey species between predation risks and protection benefits. J. Anim. Ecol. 2007, 76, 619–629. [Google Scholar] [CrossRef] [PubMed]
- Fontaine, J.J.; Martel, M.; Markland, H.A.; Niklison, A.A.; Decker, K.L.; Martin, T.E. Testing ecological and behavioral correlates of nest predation. Oikos 2007, 116, 1887–1894. [Google Scholar] [CrossRef]
- Hoset, K.S.; Husby, M. Are predation rates comparable between natural and artificial open-cup tree nests in boreal forest landscapes? PLoS ONE 2019, 14, 15. [Google Scholar] [CrossRef] [PubMed]
- Martin, T.E. Avian life-history evolution has an eminent past: Does it have a bright future? Auk 2004, 121, 289–301. [Google Scholar] [CrossRef]
- Fontaine, J.J.; Martin, T.E. Parent birds assess nest predation risk and adjust their reproductive strategies. Ecol. Lett. 2006, 9, 428–434. [Google Scholar] [CrossRef]
- Decker, K.L.; Conway, C.J.; Fontaine, J.J. Nest predation, food, and female age explain seasonal declines in clutch size. Evol. Ecol. 2012, 26, 683–699. [Google Scholar] [CrossRef]
- Woodworth, B.K.; Wheelwright, N.T.; Newman, A.E.M.; Norris, D.R. Local density regulates migratory songbird reproductive success through effects on double-brooding and nest predation. Ecology 2017, 98, 2039–2048. [Google Scholar] [CrossRef] [PubMed]
- Haftorn, S. Norges Fugler; Universitetsforlaget: Oslo, Norway, 1971. [Google Scholar]
- Sloan, S.S.; Holmes, R.T.; Sherry, T.W. Depredation rates and predators at artificial bird nests in an unfragmented northern hardwood forest. J. Wildl. Manag. 1998, 62, 529–539. [Google Scholar] [CrossRef]
- Collett, R. Norges Pattedyr; Aschehoug & Co.: Kristiania, Norway, 1911. [Google Scholar]
- Sørensen, O.J.; Moa, P.F.; Hagen, B.R.; Selås, V. Possible impact of winter conditions and summer temperature on bank vole (Myodes glareolus) population fluctuations in central norway. Ethol. Ecol. Evol. 2023, 35, 471–487. [Google Scholar] [CrossRef]
- Högstedt, G.; Seldal, T.; Breistol, A. Period length in cyclic animal populations. Ecology 2005, 86, 373–378. [Google Scholar] [CrossRef]
- Weidinger, K. Nest predators of woodland open-nesting songbirds in Central Europe. IBIS 2009, 151, 352–360. [Google Scholar] [CrossRef]
- Bures, S. High common vole Microtus arvalis predation on ground-nesting bird eggs and nestlings. IBIS 1997, 139, 173–174. [Google Scholar] [CrossRef]
- Korpimäki, E.; Norrdahl, K.; Rintajaskari, T. Responses of stoats and least weasels to fluctuating food abundances: Is the low phase of the vole cycle due to mustelid predation? Oecologia 1991, 88, 552–561. [Google Scholar] [CrossRef] [PubMed]
- Koskimies, P.; Väisänen, R.A. Monitoring Bird Populations; Zoological Museum, Finnish Museum of Natural History: Helsinki, Finland, 1991; 144p. [Google Scholar]
- Bibby, C.J.; Burgess, N.D.; Hill, D.A. Bird Census Techniques; Academic Press: London, UK, 1992. [Google Scholar]
- Gregory, R.D.; Gibbons, D.W.; Donald, P.F. Bird census and survey techniques. In Bird Ecology and Conservation: A Handbook of Techniques; Sutherland, W.J., Newton, I., Green, R.E., Eds.; Oxford University Press: Cary, NC, USA, 2004; pp. 17–56. [Google Scholar]
- Husby, A.; Kruuk, L.E.B.; Visser, M.E. Decline in the frequency and benefits of multiple brooding in great tits as a consequence of a changing environment. Proc. R. Soc. B Biol. Sci. 2009, 276, 1845–1854. [Google Scholar] [CrossRef] [PubMed]
- Martinez, N.; Zingg, S. Zweitbruten beim Gartenrotschwanz Phoenicurus phoenicurus in der Schweiz. Ornitol. Beobacther 2014, 111, 239–246. [Google Scholar]
- SPSS. Linear Mixed-Effects Modeling in SPSS: An Introduction to the Mixed Procedure; SPSS Inc.: Chicago, IL, USA, 2005; pp. 1–29. [Google Scholar]
- Lo, S.; Andrews, S. To transform or not to transform: Using generalized linear mixed models to analyse reaction time data. Front. Psychol. 2015, 6, 1–16. [Google Scholar] [CrossRef]
- Dormann, C.F.; Elith, J.; Bacher, S.; Buchmann, C.; Carl, G.; Carre, G.; Marquez, J.R.G.; Gruber, B.; Lafourcade, B.; Leitao, P.J.; et al. Collinearity: A review of methods to deal with it and a simulation study evaluating their performance. Ecography 2013, 36, 27–46. [Google Scholar] [CrossRef]
- Burnham, K.P.; Anderson, D.R. Model Selection and Multimodel Inference. A Practical Information-Theoretic Approach, 2nd ed.; Springer: New York, NY, USA, 2002. [Google Scholar]
- Zuur, A.F.; Ieno, E.N.; Elphick, C.S. A protocol for data exploration to avoid common statistical problems. Methods Ecol. Evol. 2010, 1, 3–14. [Google Scholar] [CrossRef]
- Hoset, K.; Husby, M. Small between-year variations in nest predation rates are not related with between-year differences in predator identity. Ecoscience 2018, 25, 199–208. [Google Scholar] [CrossRef]
- de Aguiar, I.R.; Vianna, V.R.; Dias, R.I. Nest density, egg conspicuity, vegetation structure and seasonality affect artificial nest predation in the brazilian cerrado. J. Trop. Ecol. 2022, 38, 362–369. [Google Scholar] [CrossRef]
- Schmidt, K.A.; Whelan, C.J. Nest predation on woodland songbirds: When is nest predation density dependent? Oikos 1999, 87, 65–74. [Google Scholar] [CrossRef]
- Sieving, K.E.; Willson, M.F. A temporal shift in Steller’s jay predation on bird eggs. Can. J. Zool.-Rev. Can. Zool. 1999, 77, 1829–1834. [Google Scholar] [CrossRef]
- Benson, T.J.; Brown, J.D.; Bednarz, J.C. Identifying predators clarifies predictors of nest success in a temperate passerine. J. Anim. Ecol. 2010, 79, 225–234. [Google Scholar] [CrossRef] [PubMed]
- Perrins, C.M. Population fluctuations and clutch size in the great tit, Parus Major, L.J. Anim. Ecol. 1965, 34, 601–647. [Google Scholar] [CrossRef]
- McGuire, R.L.; Lanctot, R.B.; Saalfeld, S.T.; Ruthrauff, D.R.; Liebezeit, J.R. Shorebird reproductive response to exceptionally early and late springs varies across sites in arctic Alaska. Front. Ecol. Evol. 2020, 8, 19. [Google Scholar] [CrossRef]
- Byrkjedal, I. Nest predation in relation to snow-cover—A possible factor influencing the start of breeding in shorebirds. Ornis Scand. 1980, 11, 249–252. [Google Scholar] [CrossRef]
- Ishii, Y.; Shimada, M. The effect of learning and search images on predator-prey interactions. Popul. Ecol. 2010, 52, 27–35. [Google Scholar] [CrossRef]
- Martin, T.E.; Geupel, G.R. Nest-monitoring plots-methods for locating nests and monitoring success. J. Field Ornithol. 1993, 64, 507–519. [Google Scholar]
- Piersanti, S.; Salerno, G.; Di Pietro, V.; Giontella, L.; Rebora, M.; Jones, A.; Fincke, O.M. Tests of search image and learning in the wild: Insights from sexual conflict in damselflies. Ecol. Evol. 2021, 11, 4399–4412. [Google Scholar] [CrossRef] [PubMed]
- Beardsell, A.; Gravel, D.; Berteaux, D.; Gauthier, G.; Clermont, J.; Careau, V.; Lecomte, N.; Juhasz, C.C.; Royer-Boutin, P.; Bêty, J. Derivation of predator functional responses using a mechanistic approach in a natural system. Front. Ecol. Evol. 2021, 9, 12. [Google Scholar] [CrossRef]
- Yahner, R.H.; Wright, A.L. Depredation on artificial ground nests: Effects of edge and plot age. J. Wildl. Manag. 1985, 49, 508–513. [Google Scholar] [CrossRef]
- Angelstam, P. Predation on ground-nesting birds’ nests in relation to predator densities and habitat edge. Oikos 1986, 47, 365–373. [Google Scholar] [CrossRef]
- Sonerud, G.A.; Fjeld, P.E. Long term memory in egg predators—An experiment with a hooded crow. Ornis Scand. 1987, 18, 323–325. [Google Scholar] [CrossRef]
- Bravo, C.; Sarasa, M.; Bretagnolle, V.; Pays, O. Detectability and predator strategy affect egg depredation rates: Implications for mitigating nest depredation in farmlands. Sci. Total Environ. 2022, 829, 9. [Google Scholar] [CrossRef] [PubMed]
- Buler, J.J.; Hamilton, R.B. Predation of natural and artificial nests in a southern pine forest. Auk 2000, 117, 739–747. [Google Scholar] [CrossRef]
- Willebrand, T.; Marcström, V. On the danger of using dummy nests to study predation. Auk 1988, 105, 378–379. [Google Scholar] [CrossRef]
- Harts, A.M.F.; Kristensen, N.P.; Kokko, H. Predation can select for later and more synchronous arrival times in migrating species. Oikos 2016, 125, 1528–1538. [Google Scholar] [CrossRef]
- Verhulst, S.; Nilsson, J.-Å. The timing of birds’ breeding seasons: A review of experiments that manipulated timing of breeding. Philos. Trans. R. Soc. B-Biol. Sci. 2008, 393, 399–410. [Google Scholar] [CrossRef]
- Duca, C.; Brunelli, W.A.; Doherty, P.F. Predator search image and the dilution effect: When is the best time to nest? Auk 2019, 136, 7. [Google Scholar] [CrossRef]
- Morrison, C.A.; Robinson, R.A.; Clark, J.A.; Leech, D.I.; Gill, J.A. Season-long consequences of shifts in timing of breeding for productivity in willow warblers, Phylloscopus trochilus. Bird Stud. 2015, 62, 161–169. [Google Scholar] [CrossRef]
- Kokko, H. Competition for early arrival in migratory birds. J. Anim. Ecol. 1999, 68, 940–950. [Google Scholar] [CrossRef]
- Brinkhof, M.W.G.; Cave, A.J.; Daan, S.; Perdeck, A.C. Timing of current reproduction directly affects future reproductive output in european coots. Evolution 2002, 56, 400–411. [Google Scholar] [PubMed]
- Nilsson, J.A. Energetic bottle-necks during breeding and the reproductive cost of being too early. J. Anim. Ecol. 1994, 63, 200–208. [Google Scholar] [CrossRef]
- Tökölyi, J.; McNamara, J.M.; Houston, A.I.; Barta, Z. Timing of avian reproduction in unpredictable environments. Evol. Ecol. 2012, 26, 25–42. [Google Scholar] [CrossRef]
- Pearson, M.; Husby, M. Supplementary feeding improves breeding performance in Eurasian eagle owl Bubo bubo. Ornis Fenn. 2021, 98, 46–58. [Google Scholar] [CrossRef]
- Brommer, J.E.; Karell, P.; Pietiainen, H. Supplementary fed Ural owls increase their reproductive output with a one year time lag. Oecologia 2004, 139, 354–358. [Google Scholar] [CrossRef]
- Dhindsa, M.S.; Boag, D.A. The effect of food supplementation on the reproductive success of black-billed magpies Pica pica. IBIS 1990, 132, 595–602. [Google Scholar] [CrossRef]
- Karell, P.; Kontiainen, P.; Pietiainen, H.; Siitari, H.; Brommer, J.E. Maternal effects on offspring Igs and egg size in relation to natural and experimentally improved food supply. Funct. Ecol. 2008, 22, 682–690. [Google Scholar] [CrossRef]


Disclaimer/Publisher’s Note: The statements, opinions and data contained in all publications are solely those of the individual author(s) and contributor(s) and not of MDPI and/or the editor(s). MDPI and/or the editor(s) disclaim responsibility for any injury to people or property resulting from any ideas, methods, instructions or products referred to in the content. |
© 2024 by the authors. Licensee MDPI, Basel, Switzerland. This article is an open access article distributed under the terms and conditions of the Creative Commons Attribution (CC BY) license (https://creativecommons.org/licenses/by/4.0/).