Article

Decoding Anotylus (Thomson 1859) Beetle Diversity: DNA and External Morphology Match in Área de Conservaciόn Guanacaste, Costa Rica

by
K. Dante Underwood
1,
Robert Puschendorf
1,
David T. Bilton
1,2,
Winnie Hallwachs
3,
Daniel H. Janzen
3 and
M. Alex Smith
4,*
1
School of Biological and Marine Sciences, University of Plymouth, Plymouth PL4 8AA, Devon, UK
2
Department of Zoology, University of Johannesburg, Auckland Park, P.O. Box 524, Johannesburg 2006, South Africa
3
Department of Biology, University of Pennsylvania, Philadelphia, PA 19104-6018, USA
4
Department of Integrative Biology, University of Guelph 50 Stone Road East Guelph, Guelph, ON N1G 2W1 2, Canada
*
Author to whom correspondence should be addressed.
Diversity 2024, 16(8), 441; https://doi.org/10.3390/d16080441
Submission received: 3 June 2024 / Revised: 19 July 2024 / Accepted: 21 July 2024 / Published: 25 July 2024
(This article belongs to the Special Issue Diversity, Distribution and Zoogeography of Coleoptera)

Abstract

:
Taxonomy underpins biological research because names are needed for comparative analysis, conservation status, and public communication. Despite this, many species remain undescribed and are therefore vulnerable and unprotected, particularly in the tropics. Neotropical Staphylinidae beetles (Coleoptera) are among the insect groups most likely to contain significant unknown and/or cryptic diversity. Here we used an integrative taxonomic framework to conduct a preliminary review of one particularly diverse genus of Staphylinidae (Anotylus) in Área de Conservaciόn Guanacaste, northwestern Costa Rica. We began by DNA barcoding novel collections and using Barcode Index Numbers (BINs) as an estimate of taxonomic diversity; we found 18 provisional new species. We augmented this genetic analysis with a morphometric analysis of adult morphological characters and found that we could differentiate most provisional species by external morphology as well as by elevation of collection. All the most abundant species could be differentiated from each other by differences in body size. One BIN included slight (~1%) genetic variation that corresponded with some morphological differentiation suggesting the existence of two species within a DNA BIN. Our results support the efficacy of DNA barcoding collections of tropical insects as an effective biodiversity estimator, one that can be used as a primer for integrative taxonomic studies using BINs as species hypotheses.

1. Introduction

Only a small fraction of global diversity has been described [1]. There are approximately 2.3 million named species [2] from a total diversity that may be as low as 8 million [3] or as high as hundreds of millions [4]. Without knowing what species exist and where, we cannot effectively conserve them [5], manage ecosystem services [6], or monitor biodiversity loss [7], which, if unchecked, can result in dangerous ecological cascades [8]. While fundamental, describing new species is difficult, with many concepts [9], dated revisions [10], and an unfortunate lack of institutional and governmental support for taxonomists [11]. Quite simply, there are not enough trained taxonomists to characterize global biodiversity. This taxonomic impediment is even more alarming, given that we are in the midst of the sixth, and largely anthropogenic, mass extinction [12]. With many limitations to identifying the globe’s true biodiversity, and mounting environmental pressures, it is increasingly vital to describe as many species and their natural histories as possible before their extinction [13].
While the actual global number of species is unknown, we know that biodiversity is unequally represented both geographically and taxonomically [14]. Despite containing the majority of species and numerous different major ecosystems, the tropics are underrepresented both in terms of studies and descriptions [15,16,17]. This has been attributed to historical inaccessibility [18], a lack of scientific infrastructure for accurate species identification [19], and the sheer volume of species [20]. Furthermore, there are inherent biases across taxonomic groups, as larger individuals and more well-studied taxa are disproportionately represented, despite these often being relatively species-poor. For example, despite accounting for less than one-fifth of known biodiversity [21], vertebrates contributed to nearly one-third of species’ descriptions between 2006 and 2013 [22]. It is often the hyper-diverse, supposedly “uncharismatic” organisms (such as the invertebrates) that are in most need of taxonomic groundwork [17,23]. These biases place tropical invertebrates among the most poorly understood multicellular taxa in the world [24,25].
Quantifying tropical invertebrate biodiversity is difficult for groups that lack taxonomic infrastructure such as revisions and representative specimens; one such group is the hyperdiverse family of litter-inhabiting small beetles, the Staphylinidae. Due to its species richness, many species with rather high morphological similarity, and relatively unresolved phylogeny, taxonomic revisions are rare and often confined to a single genus or species complex/group [26,27,28]. At a deeper phylogenetic level, some subfamilies are understood better than others (e.g., the recent movement of the burying and carrion beetles to be a subfamily of Staphylinidae rather than a family (the Silphidae) of its own [29], and several species groups and genera have well resolved phylogenies [30,31]). In addition, there is a large gap between described species and the collection of publicly available standardised DNA barcodes (an average of 0.062 barcodes per described species within the family [32]). Consider the inherent hidden taxonomic scope for tropical staphylinids by comparison to the Canadian fauna (a much more thoroughly studied and less diverse system) where the number of staphylinid species has increased by over 90% within the last 40 years [33] (and achievements made through investment in taxonomic expertise and the advent and integration of molecular techniques with morphology and ecology). Taxonomic revisions are more complicated in the tropics where comprehensive cataloguing of biodiversity is faced with the most species and the fewest research resources. Recent increases in tropical descriptions can be sometimes linked to the development of barcoding initiatives within these regions [34]. With numerous ecosystems and microclimates within a comparatively small area to other biomes, the tropics have developed sharp ecological boundaries associated with (comparatively) stable abiotic regimes of temperature and precipitation. Consequently, these boundaries in the tropics can create a tighter relationship between elevation and diversity than seen in temperate systems. The rapidly changing community assemblages across tropical mountain elevation gradients are known to be some of the most biodiverse systems on the globe [35].
The Staphylindae are amongst the most diverse animal family, with nearly 67,000 species currently described across 32 extant subfamilies [36,37], and a global distribution including arctic [38], tropical [39], taiga [40], and intertidal marine habitats [41]. Notwithstanding that the cryptic diversity of other insect families will eventually make them more diverse (see the hymenopteran parasitoid families of Ichneumonidae and Braconidae [42,43] as well as the small dipteran Cecidomyiidae [44,45]), the staphylinids already have more named taxa than do vertebrates, and, as they also contain much historically cryptic diversity, will likely remain one of the most diverse animal families [46]. Improving the representation, visibility, and understanding of Staphylinidae will only further our understanding of an ecosystem’s biodiversity and functioning. Some have argued that they are a good indicator taxon for various ecological processes [47,48,49] due to the multiple roles that staphylinids play in key ecological processes such as nutrient cycling [50], predation [51,52], and ecological succession [53].
Within the staphylinids, the Oxytelinae is the eighth largest subfamily, with 47 genera containing approximately 2000 species [54]. They are primarily found within leaf litter, with a diet predominantly composed of animal dung and decaying organic matter [55]. One morphologically challenging genus of Oxytelinae, Anotylus Thomson, 1859, has been called a taxonomic “left over” since there is no singular morphological character unique to the group [56]. However, Hammond [57] suggested that the genus can be identified by the crest-shaped structure on the scutellum. Whether this applies to all taxa assigned to Anotylus to date is unclear. While many beetle taxa may not possess a unique morphological characteristic, not all contain as much undescribed diversity as does Anotylus [57]. The 90 currently named species of Anotylus have a cosmopolitan distribution, but the greatest concentration of diversity occurs in the Neotropics [58,59]. The last catalogue of staphylinid biodiversity reported two species of Anotylus in Costa Rica [58], Anotylus insignitus Gravenhorst, 1806 which is an invasive species, and Anotylus nitescens Bernhauer, 1942 a species apparently endemic to Costa Rica (Vera Blanca [60]. The former possesses a large distribution throughout the Americas and several Atlantic and Pacific islands [57]; however, like many older species’ descriptions, this taxon may be made up of several discreet species with smaller distributions [61]. A. nitescens has not appeared in the literature since its original species description [62]. Anotylus individuals can range in length from 1 to 6 mm [56], with some species known to be conspicuously sexually dimorphic [63]. Dolson et al. (2021) [64] reported that Anotylus made up most of the Oxytelinae recovered from leaf litter sifting across a 1500 m elevational gradient in Costa Rica, being most abundant in cloud forest, with one species apparently restricted to the low-elevation dry forest and one species more widespread across elevation.
In this study, our aim was to integrate morphometrics into the spatial and genetic dataset analysed by Dolson et al. and to provide a preliminary review of Costa Rican Anotylus diversity using an integrative approach that combines molecular and external morphological characters to identify provisional species, specifically focusing on characters which can be scored on high-resolution photos of external adult morphology. We did this by first using Barcode Index Numbers (BINs—[65]) to sort samples into provisional species, and then by identifying taxa supported by (i) both molecular and morphological differences, (ii) only molecular variation, and (iii) where morphological variation suggested a valid taxonomic division missed by the BIN algorithm. We found that many, but not all, of the provisional species suggested by DNA barcoding could be differentiated by morphometrics, suggesting that our initial molecular estimate of Anotylus diversity is warranted. Rapid identifications (and descriptions), especially in historically overlooked taxa like the Staphylinidae, will better inform conservation management strategies in protected areas as well as our understanding of ecological and evolutionary processes. Rapid descriptions and profound understanding are needed across the tropics, particularly for taxa such as these Anotylus, where most of the diversity resides in forests whose future in the climate crisis is in stark jeopardy.

2. Materials and Methods

The integrative taxonomic approach adopted here builds on more than a decade of ongoing (2008–2017) leaf-litter arthropod collections made across a 1500 m elevational gradient in Área de Conservaciόn Guanacaste (ACG) in northwestern Costa Rica [64,66,67,68,69].
ACG is a UNESCO World Heritage Site that covers 1470 km2 of northwestern Costa Rica and three inactive volcanoes, reaching a peak elevation of 1900 m. The collections used here were made principally on the slopes of Volcan Cacao. Across this elevational transect (0–1500 m), there are three distinct forest types (cloud, dry, and rain), and as many as eight Holdrige Life Zones [70]. Dry forests dominate the lower elevations (10–600 m) with warm and dry environments, rain forests reside in mid-elevations (700–1200 m) with predominately warm and wet climates, and, lastly, at the highest elevations (1300–1500 m) are cloud forests that are relatively cool and wet [71,72]. In small isolated tropical mountain systems like Volcan Cacao, relatively stable climatic conditions are common; therefore, the quantitatively small changes in temperature and precipitation across elevations create sharp ecological boundaries across which species are unlikely to pass, offering higher biodiversity among them than in extratropical systems [35]. High-resolution, 360° panoramic images of the forests sampled are available at http://www.gigapan.com/galleries/10092/gigapans (accessed on 23 July 2024).
Staphylinidae were collected using various standardised trapping techniques (see Dolson et al., [64]; Smith et al., for details [66]) across an elevational transect from sea level to the summit of Volcan Cacao (1500 m). Sampling was standardised for site size, time, and intensity, collecting invertebrates using a combination of active searching bait, Davis-sifting (see an example of this search method capturing an Anotylus here: https://youtu.be/BKr05x0_d0s?si=ByekGavLQ666LOYy (accessed on 23 July 2024)), pitfalls traps, and mini-Winkler litter extractors. Specimens were preserved in 95% ethanol in the field and later stored at −20 °C. DNA was extracted from one leg per specimen using standardised methods [73], and mitochondrial DNA 5′ COI amplified with primer cocktails outlined in Smith and Fisher [74]. Staphylinidae were identified to subfamily and genera using keys from North America [75] and Mexico [76]. All sequence and collection metadata have been deposited in BOLD (https://doi.org/10.5883/DS-ASANOT (accessed on 23 July 2024)), and physical specimens are stored within the Research Collection of M. Alex Smith at the University of Guelph.
For every Anotylus individual (n = 210), their COI DNA sequence and any available images from the Barcode of Life Data System (BOLD [77]) were extracted from the public dataset https://doi.org/10.5883/DS-ASSTAPHY (accessed on 23 July 2024). BINs are automatically assigned in BOLD using a five-step process by clustering sequences using their uncorrected pairwise distances in a refined single linkage algorithm (RESL) [65]. A standardised threshold of nucleotide diversity is used to partition sequences and is altered at a later stage to optimise effectiveness. We used BINs as our initial species’ hypotheses, utilising the BIN as an epistemological, or operational, criterion of a species. We compared one other method of species delimitation via genetic distance (e.g., Assemble Species by Automatic Partitioning (ASAP) [78]) with the BIN-derived species hypotheses.
From these samples, we selected only those individuals with barcode sequences greater than 300 bp (201) and included one sympatric Oxytelus specimen as an outgroup for analysis. Sequences were aligned in MEGA11 [79], using MUSCLE [80]. To identify the best evolutionary substitution model we used MEGA11, which suggested the general time reversible (GTR) model [81], with a gamma frequency distribution and invariant sites (G+I). We produced a Bayesian tree in Geneious 11.0.3+7 [82], with the MrBayes Plugin version 3.2.6 [83]. The tree was then estimated using the Markov Chain Monte Carlo (MCMC) algorithm with a chain length of 12,000,000 and a 1,500,000 burn in and four heated chains at a 0.2 chain temperature, with trees subsampled every 10,000 simulations. A maximum likelihood tree was also generated using the GTR+G+I substitution model with 1000 bootstraps. Trees were rooted on the Oxytelus and then visualised using FigTree version 1.4.4 [84].
To estimate the genetic variation and depth of divergence within the sampled staphylinids, we first created a Bayesian inference tree to identify the depth of divergence between individuals and species and then created a pairwise matrix of p-distances between species to estimate nucleotide variation.
To quantify the morphospace for each species, we measured each individual from focus-stacked photographs for 16 different characters (Figure 1): Largest antennal segment length (1), total antennal length (2), body length (3), compound eye area (4), compound eye maximum diameter (5), compound eye maximum width (6), head width (7), temple length (8), pronotum maximum width (9), pronotum maximum length (10), pronotal area (11), elytral maximum width (12), elytral maximum length (13), elytral area (14), pronotal pigmentation (15), and elytral pigmentation (16). While total body length can by affected by the degree retraction of the abdominal segments, we found that it was as useful a measure of an individual’s size as adding the lengths of the forebody (i.e., 10 + 13). Measurements 1, 2, 4, 5, and 12–14 have been used previously to delimit species within the subfamily Oxytelinae [85]. The remaining measurements: 3, 6–10, and 15, have also been used as descriptive characters in Anotylus [86], since pronotal width, length, and pigmentation have been used previously.
Measurements were taken from focus-stacked dorsal and lateral photos using ImageJ [87]. To calculate the area of the elytra and the compound eye, we traced the outline of the structure and used the Measure tool in ImageJ. The measurement is a two-dimensional simplification, as each structure has an irregular, nonflat surface. Elytral and pronotal pigmentation were collected from three dorsal cross-sections of each feature using the “color histogram” plugin for ImageJ 1.54g [88], and later converted from RGB values into HSV using the rgb2hsv function in R [89], with an average of the three values being taken as a representative sample of the character. The species identity for each sample was added to the morphometric data frame post-measurement, to reduce potential confirmation bias. All images are available on BOLD as part of the sample metadata.
We performed a principal component analysis (PCA) in R using the “FactoMineR” package [90]. To maximise the number of specimens in the analysis, we used individuals that possessed measurements for at least 75% of the characters. This consequently increased the number of individuals in the analysis from 127 to 177. Values were generated for absent data using the imputePCA function within the R package “missMDA” [91], by using an iterative PCA algorithm [92], which imputes values based on the similarity of relationships between individuals, and the relationships between variables. The algorithm continues to rerun until the artificial data point converges with the line of best fit for the original data. To avoid overexaggerating relationships, we used a regularised iterative PCA algorithm (rPCA) [93], which assumes consistent and mostly complete datasets. Therefore, before analysis, we calculated the percentage of the complete dataset (96.71%). Furthermore, we used the K-fold cross validation method with 5000 simulations as it identifies the lowest mean square error of prediction in large datasets, when the known percentage of data is missing. PCA plots were visualised using the “ggplot2” package in R [94]. Confidence ellipses around each species were plotted using the geom_mark_ellipse function in R.
To examine variation in the traits determined to be the most important in the PCA across the genus-level phylogeny, we created a boxplot of the variable that contributed the most to PC1 beside the phylogeny and included a specimen photo for each provisional species.
To statistically evaluate interspecific pairwise morphometric differences, we compared values of the dominant PCA axis using an ANOVA with post hoc Tukey tests, and we also completed a phylogenetic PCA using the “phytools” package in R [95]. To compare how genetic and morphometric variation changed amongst these species, we compared pairwise distances of the dominant PCA axis with pairwise p-dist calculations of the DNA barcode region using a Mantel test in the package ncf in R [96].

3. Results

We found 18 putative species of Anotylus (BINs) across our elevational gradient in northwestern Costa Rica. While some of these species occurred widely across elevations, others appeared restricted to either dry, rain, or cloud forest (Table 1), and many occurred sympatrically. Diversity in the group increased with elevation, as was shown for Staphylinidae in general by Dolson et al. (2021) [64] and Smith et al. [67]. Provenance metadata for each sample (including collection details, sample images, trace files, and sequences) can be examined at https://doi.org/10.5883/DS-ASANOT (accessed on 23 July 2024) and in Table S1.

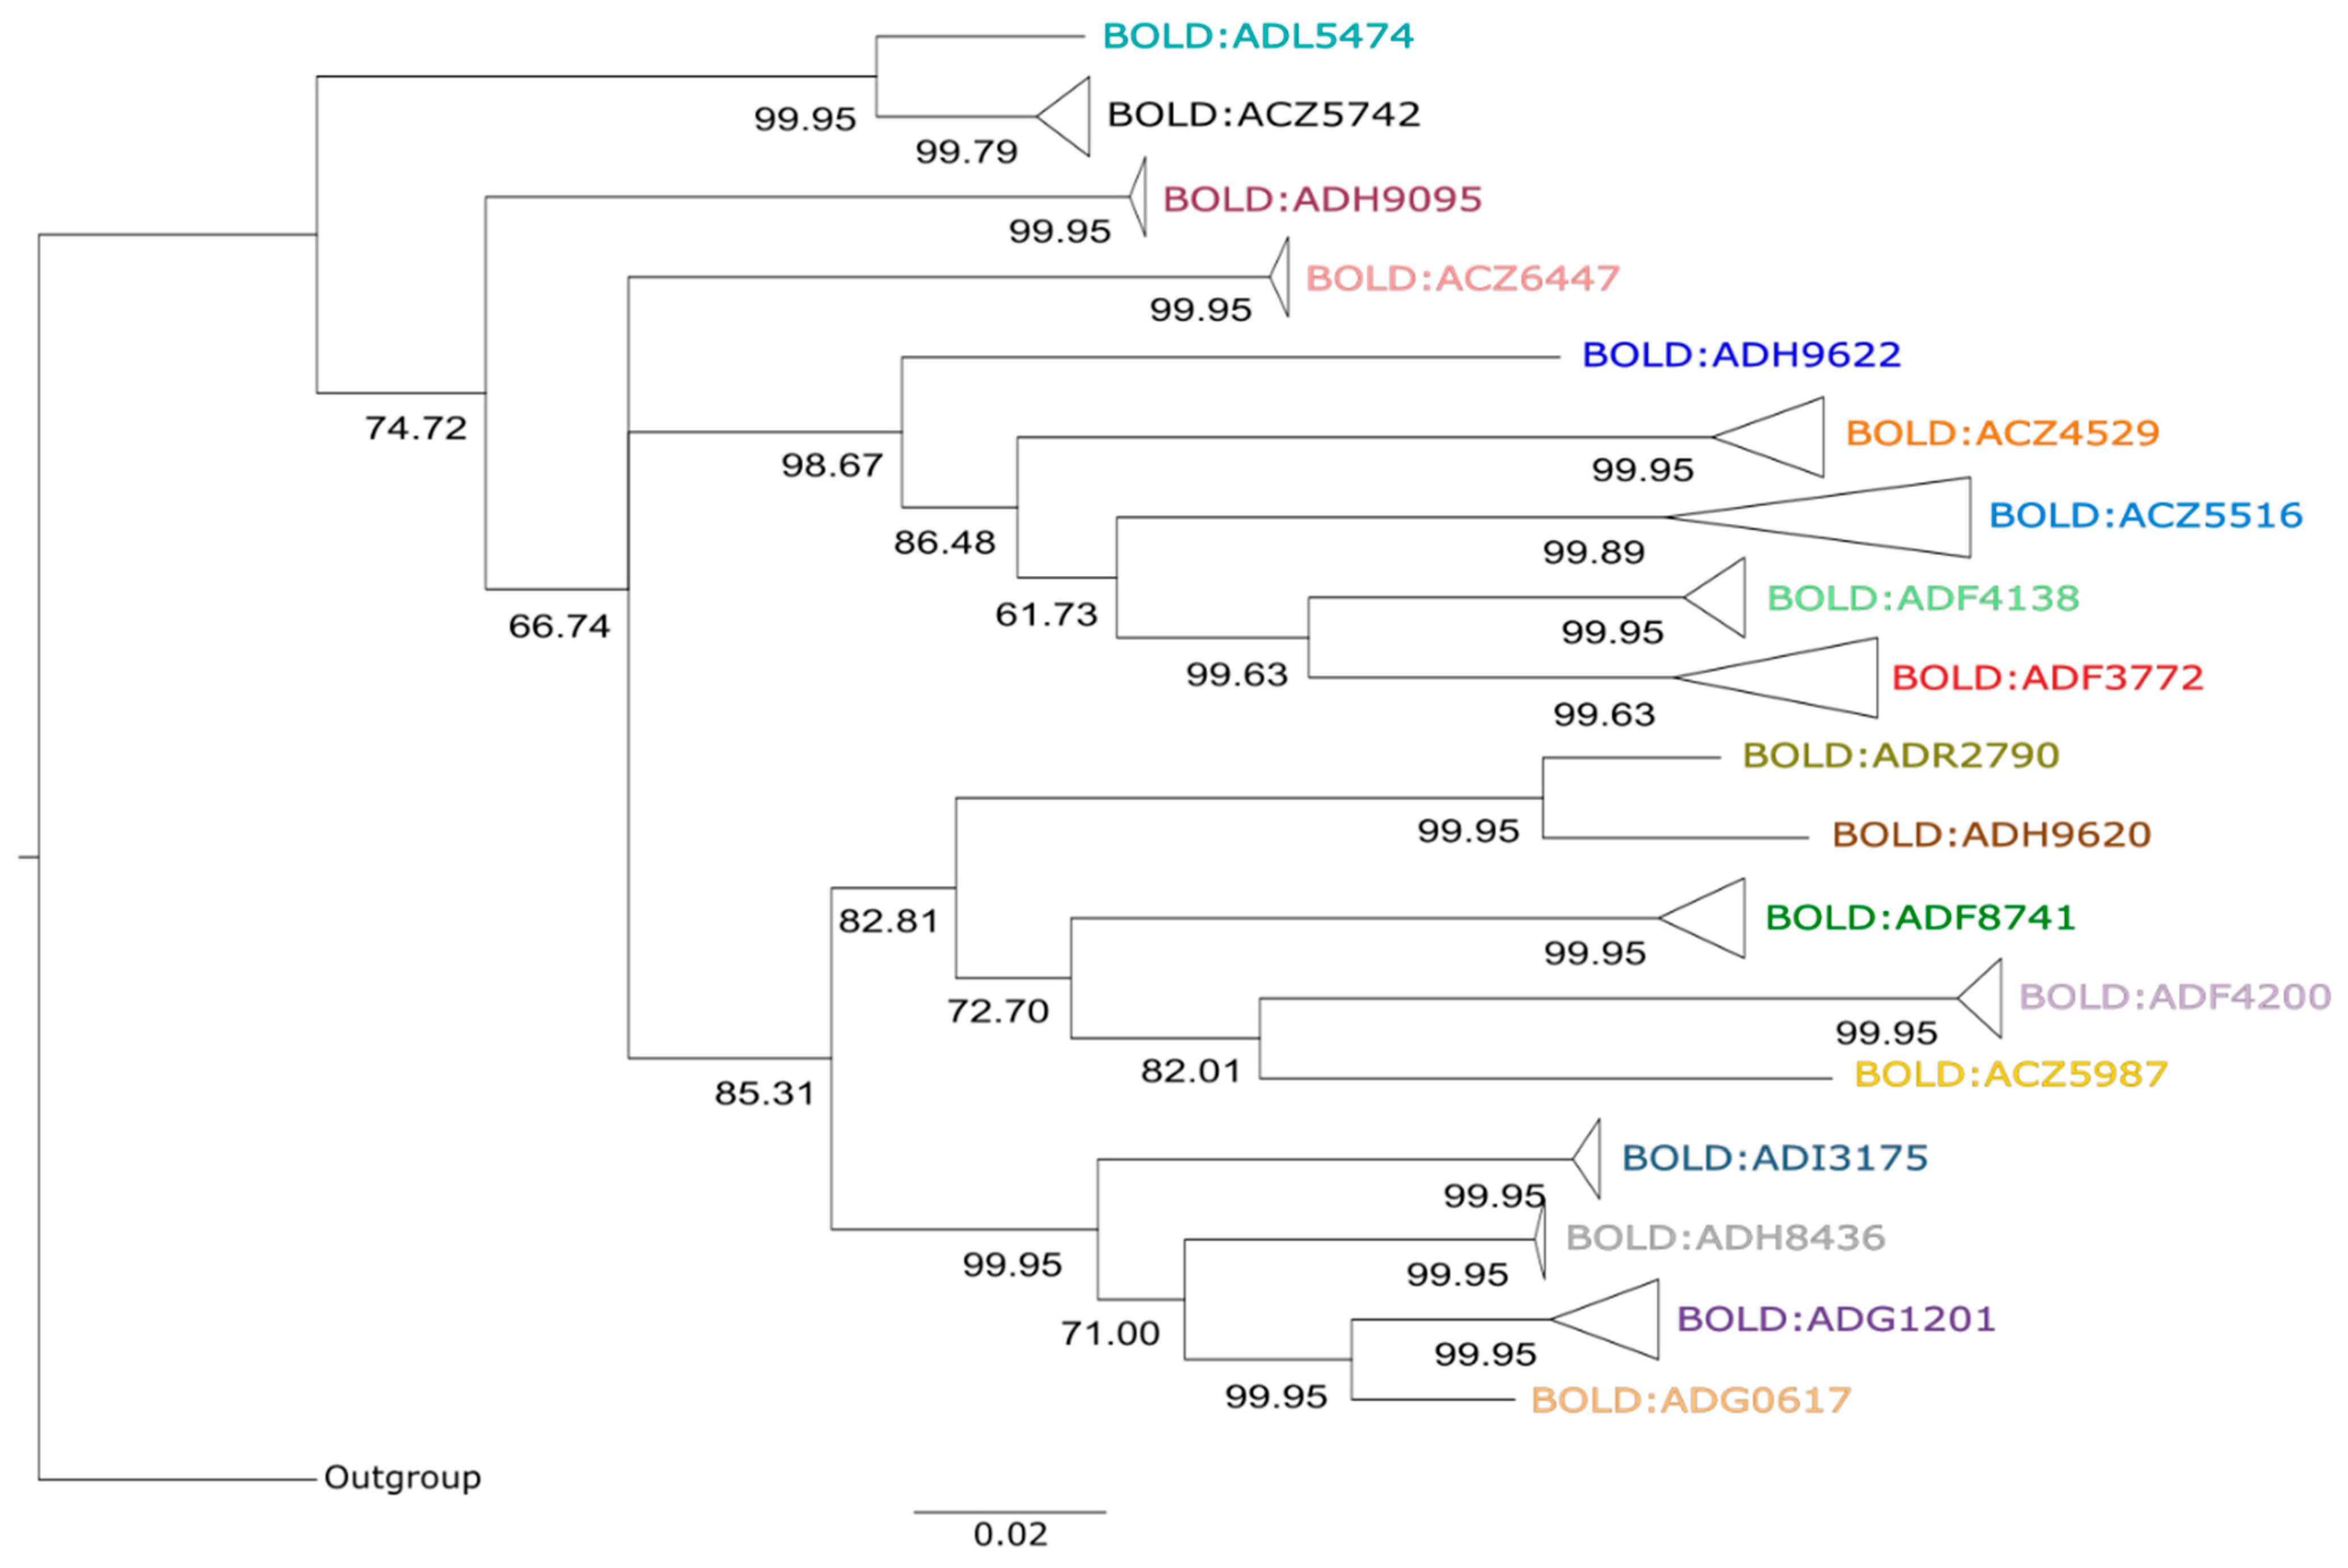
3.1. Genetic Analysis of Anotylus

Average pairwise genetic distances between provisional species was large, ranging from 5.03% (between BOLD:ADG1201 and BOLD:ADG0617) to 27.9% (BOLD:ADH9622 and BOLD:ADR2790), with a median of 19.26%. The best ASAP estimate of species via sequence divergence (asap-score of 2.5) estimated 14 species within the 18 BINs by lumping together the four species pairs with less than 5% interspecific sequence divergence. As these four species pairs are characterised by sympatric elevational distributions (Table 1) and marked (if not always significant) PC1 scores of morphometric differentiation (Table S3), we follow the BIN divisions as the first step in this integrative taxonomy. An ASAP partition that agreed with BIN divisions was one of the ten best partitions (asap-score 7.5). Intraspecific variation was low (median variation 0.38% (excluding doubletons and singletons)). The most abundant species (BOLD:ACZ5516) had the greatest intraspecific variation (0.7%). Bayesian and maximum likelihood phylogenetic examinations of Anotylus provisional species produced nearly identical topologies (Figure 2).

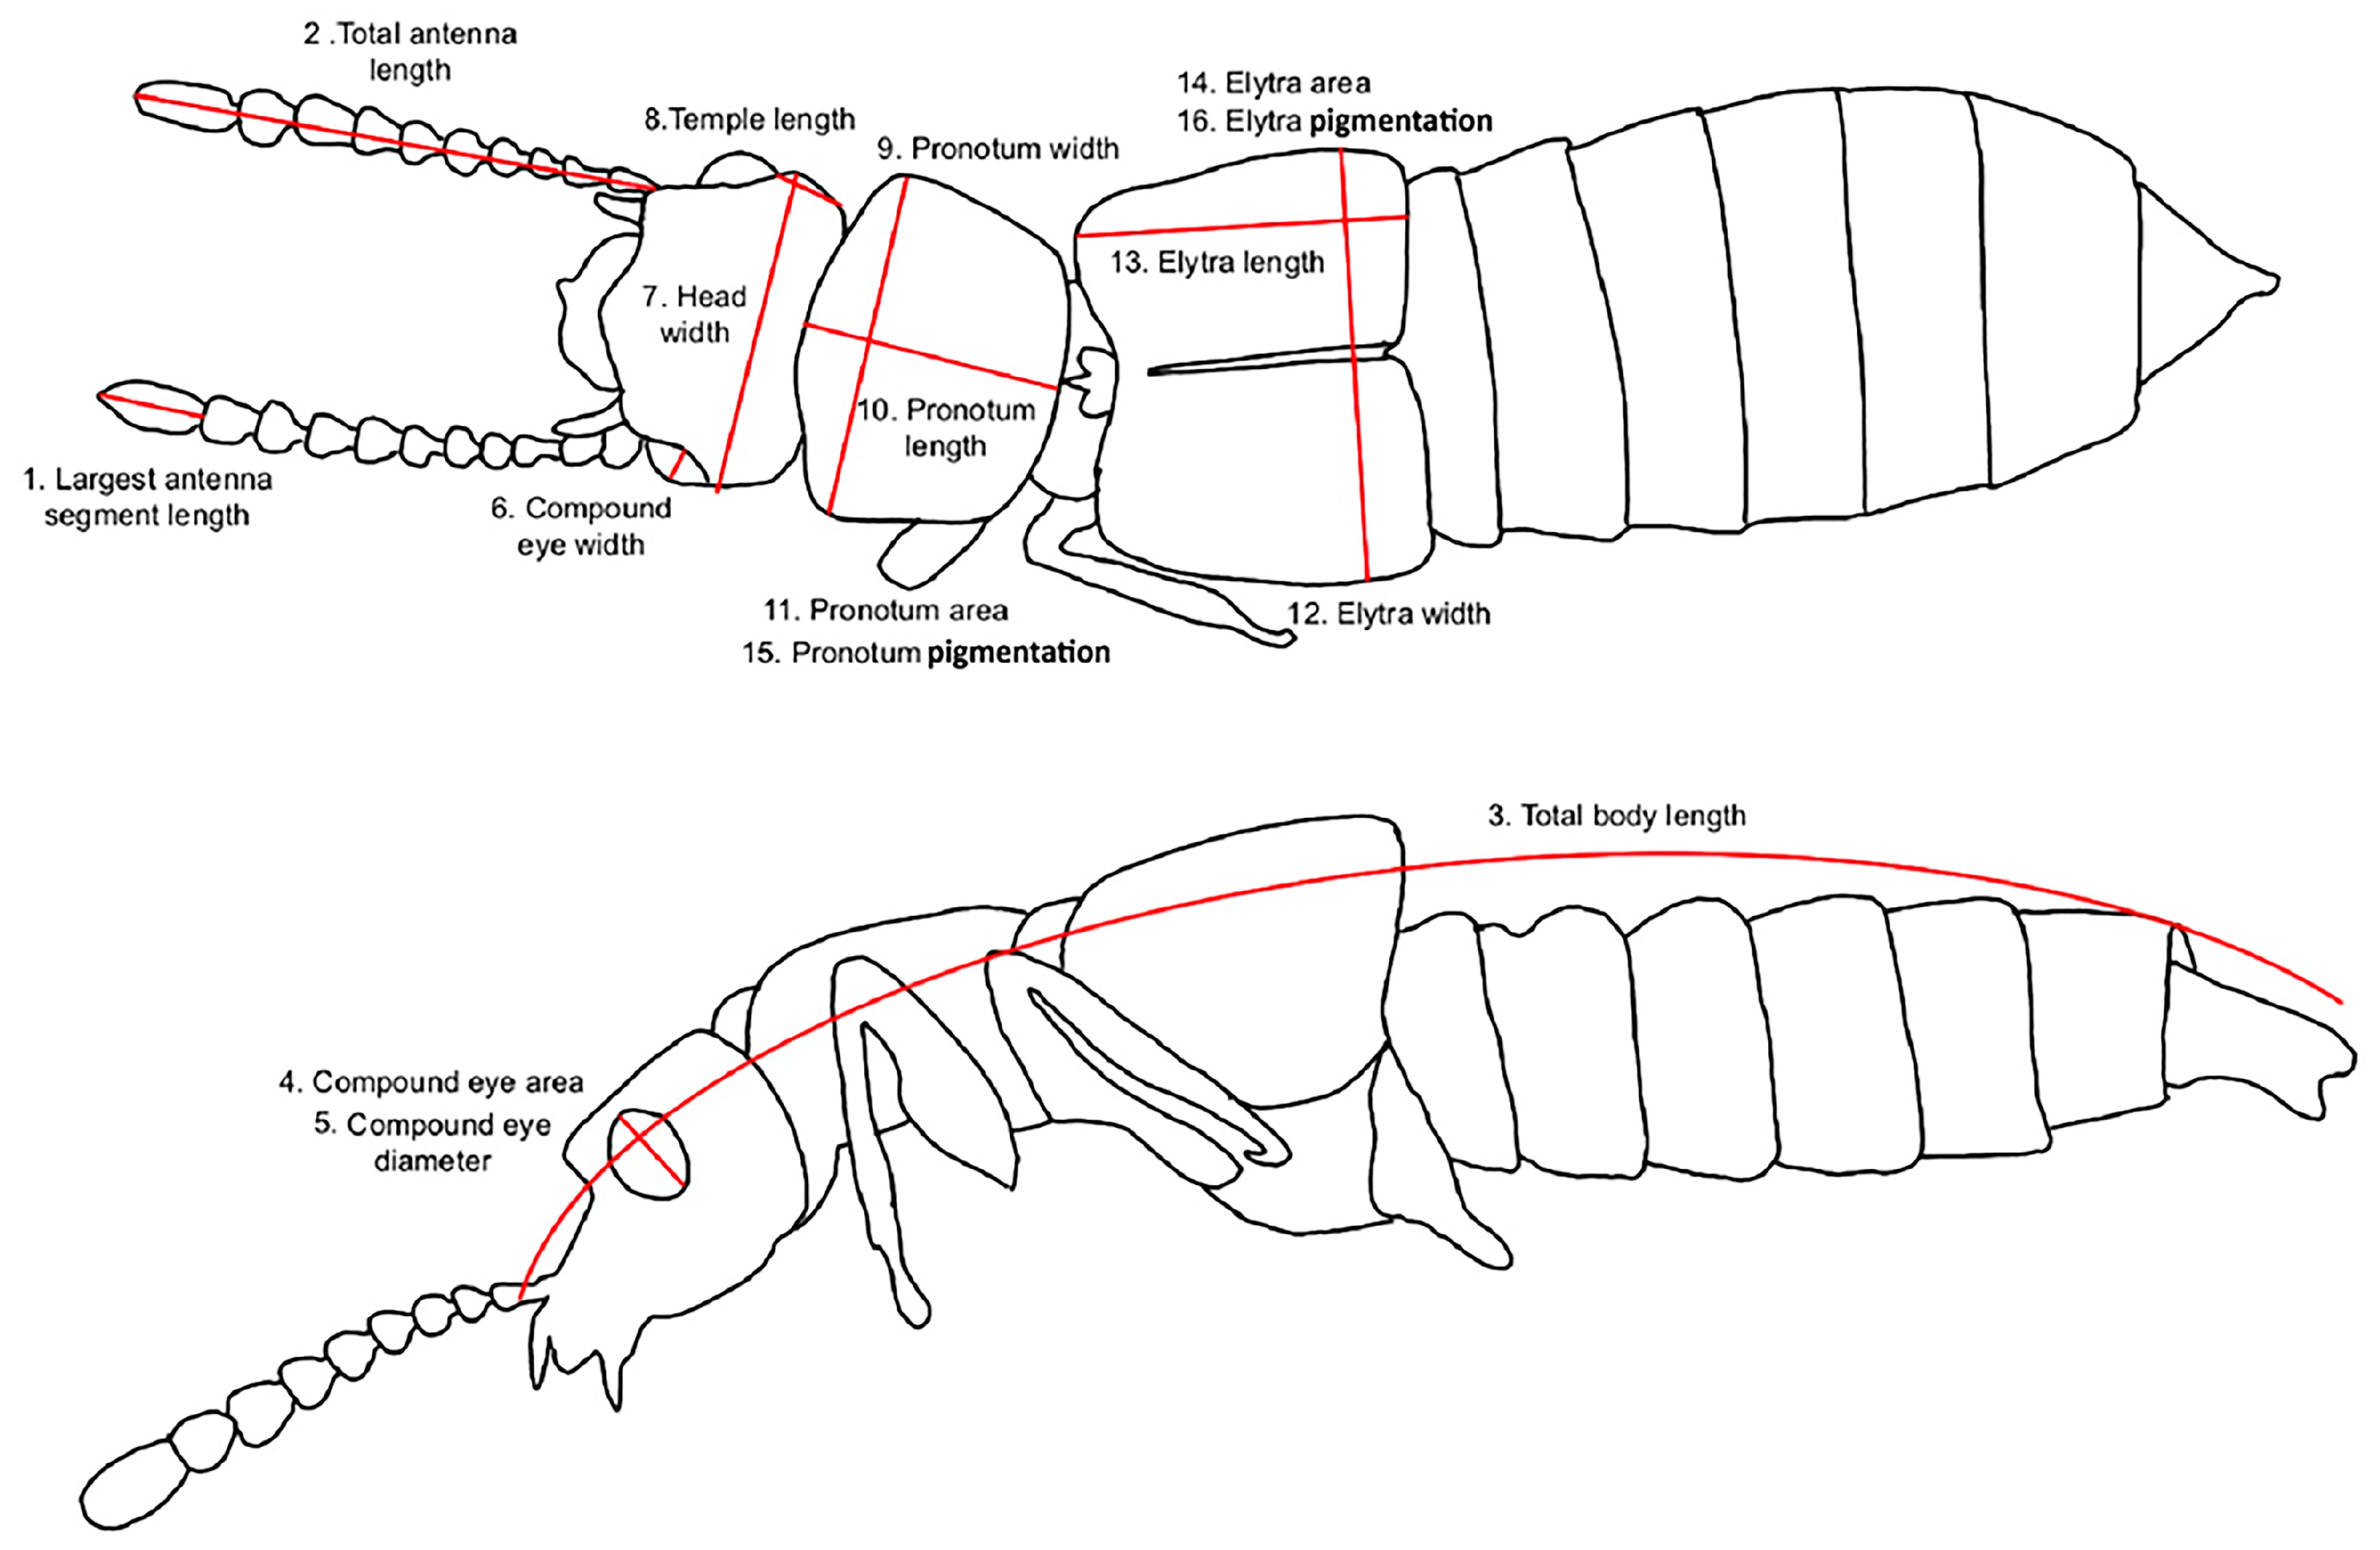
3.2. Morphometric Analysis of Anotylus

The cumulative variation exhibited across the first two principal components (PCs) was 78.97%, with PC1 accounting for 68.73% of total variation, which best represented the first 14 morphological characters, all morphometric. Elytral area was the most variable character in PC1. The remaining two characters, pigmentation of elytra and pronotal length, were represented by PC2, capturing 10.24% of total variation. PC1 had the greatest discriminatory power amongst species, while PC2 primarily accounted for variation within species (Figure 3A). While many of the putative Anotylus species exhibited overlapping morphometric variation (Figure 3A), the five most abundant species were all significantly different from each other along PC1 (Figure 3B, Table S3). Specific measurements are available in Table S2, and pairwise interspecific distance across PC1 (and associated Tukey post hoc test values) in Table S3.

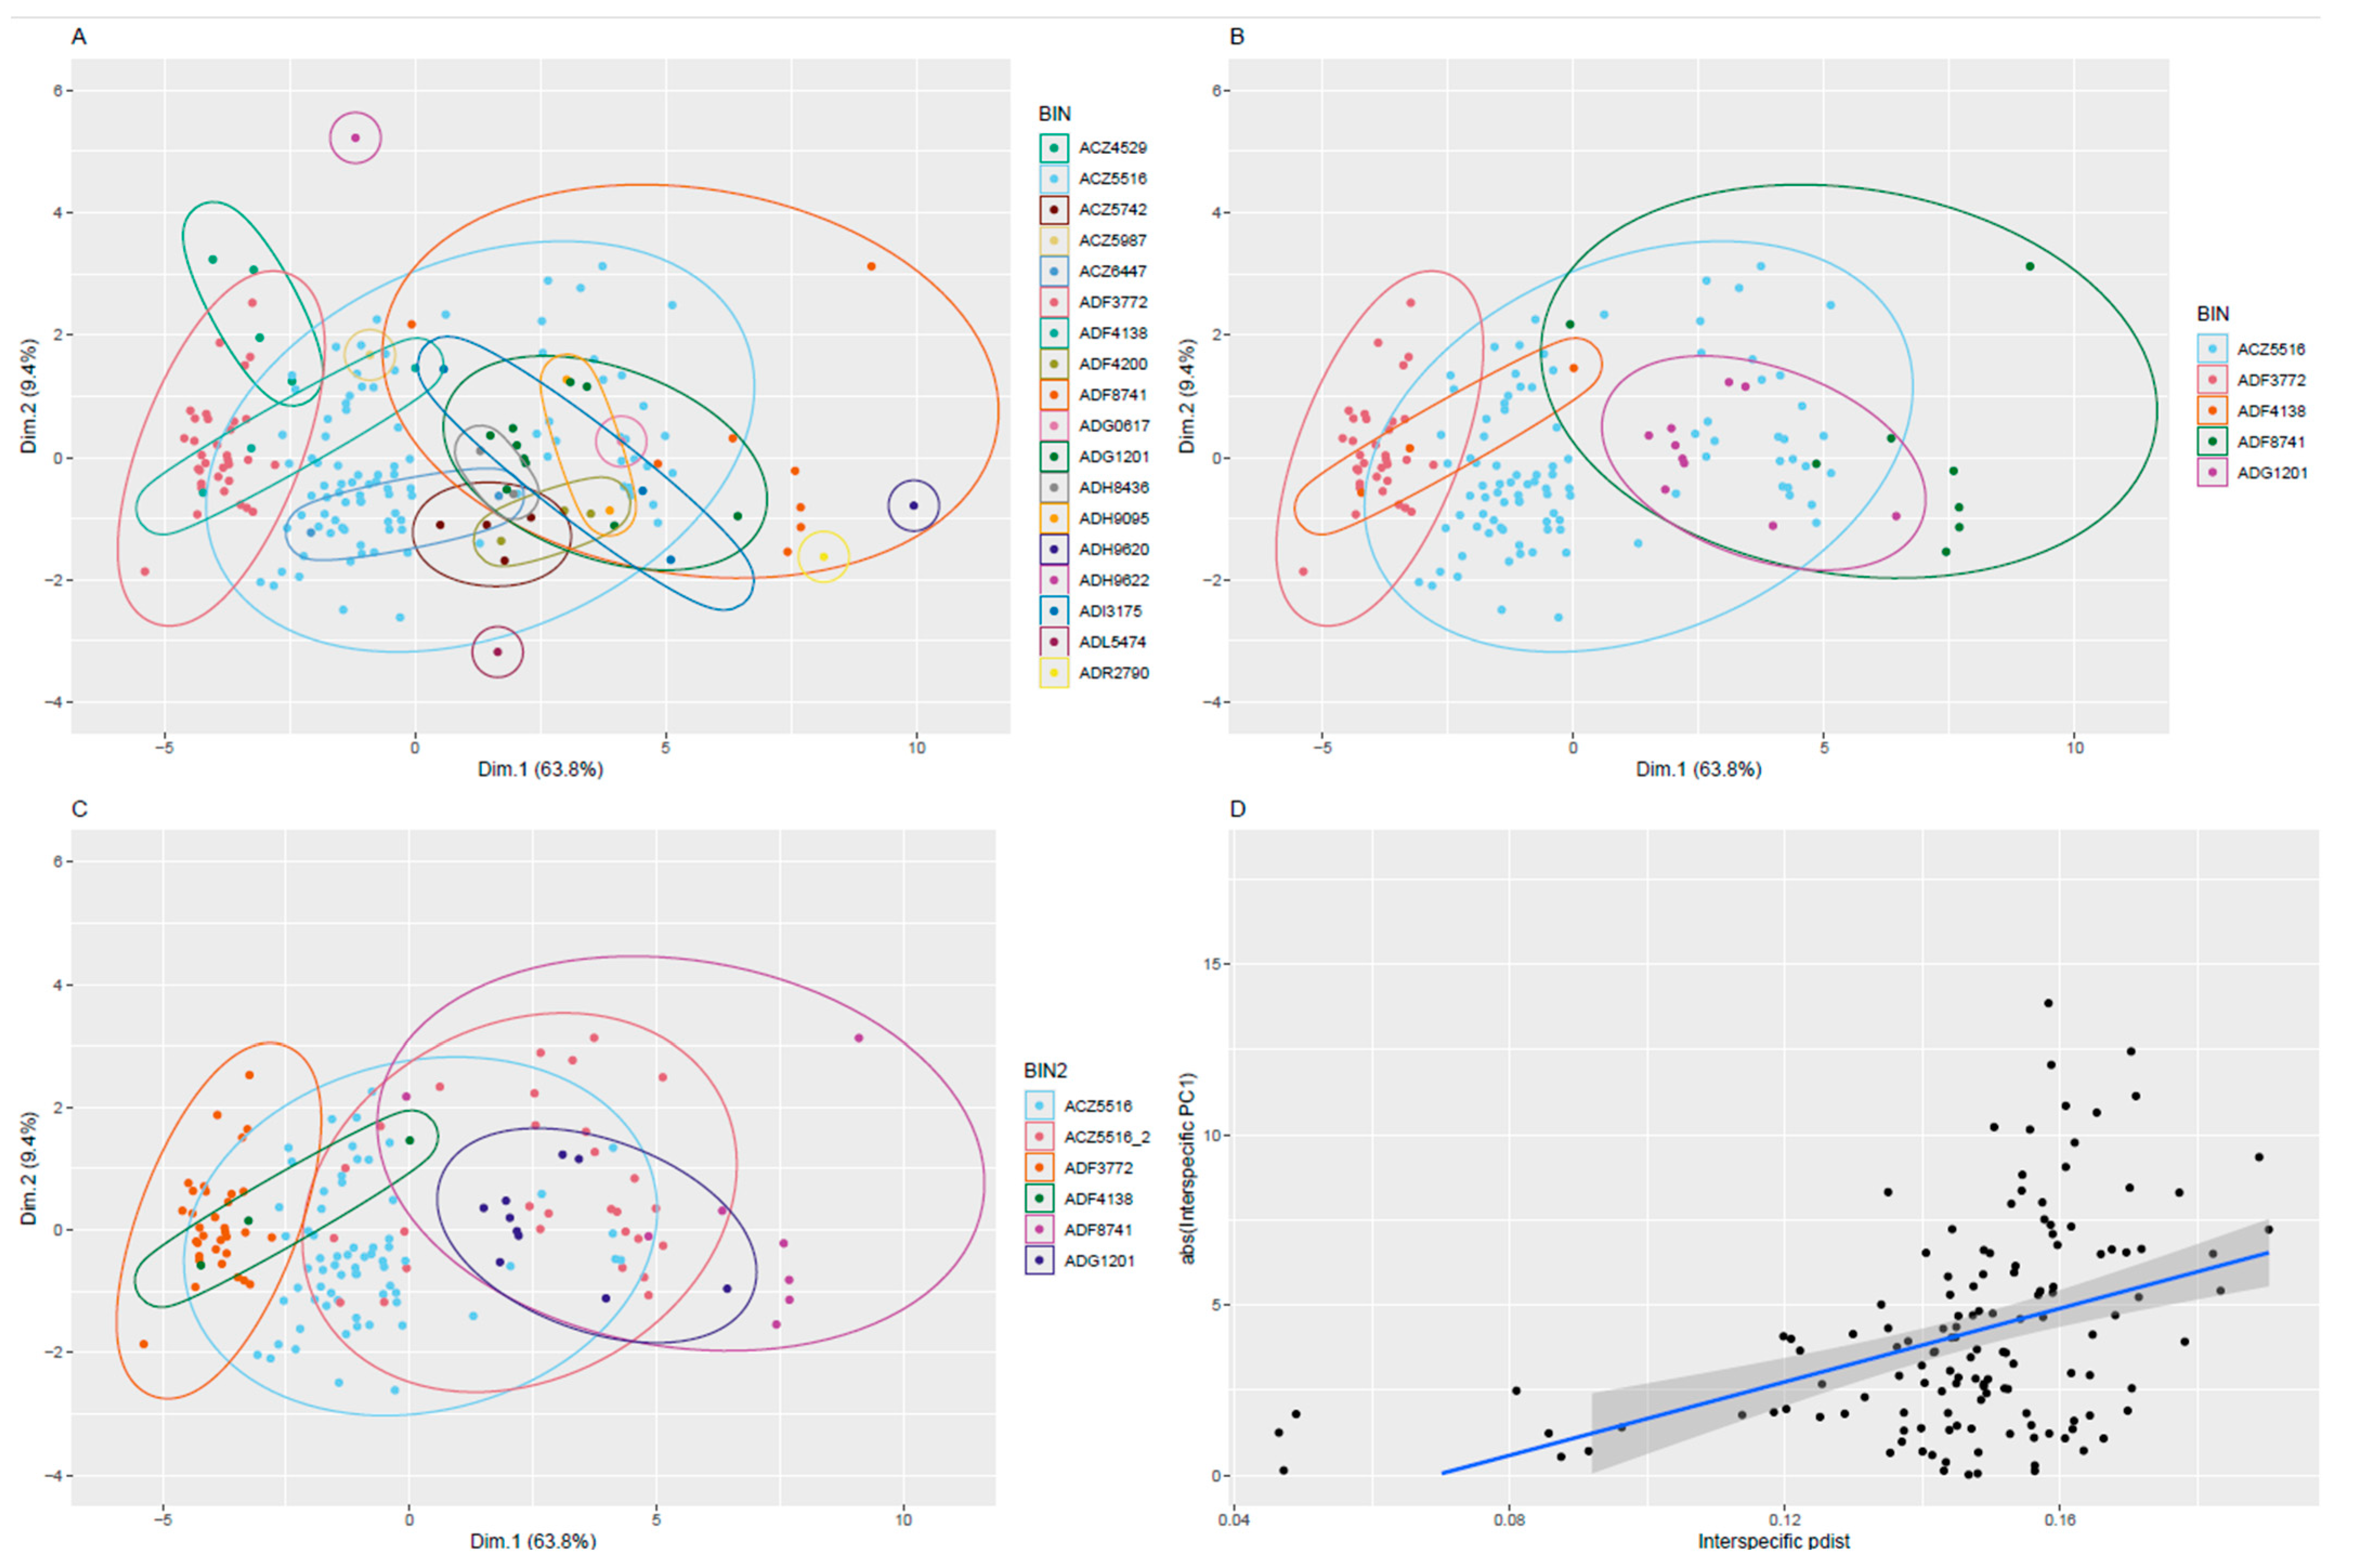
3.3. Comparing Morphometric and Molecular Differences

We identified one putative species with slight (~1%) intraspecific genetic variation whose range extends across nearly the entire elevational gradient (BOLD:ACZ5516). When we explored this genetic variation on the morphometric PCA, we found correspondingly large morphometric variation associated with the genetic differences (Figure 3C). The two intra-BIN genotypes have a nested elevational distribution, with one found between 1000 and 1500 m (with a peak in abundance at 1200), while the more abundant genotype can be found from 300 to 1500 m with a peak in abundance at 1300 m.
Pairwise morphometric variation correlated with genetic variation in the barcode region (Mantel r = 0.387, p = 0.004) (Figure 3D), and a phylogenetic PCA produced similar separation of taxa (Figure S1). While the relationship between genetic and morphometric variation was significant, there were numerous cases where a large genetic difference was associated with only very subtle morphometric differences (Figure 4). Mean interspecific differences in pdist are shown in Table S4.

4. Discussion

Our results demonstrate that the true diversity of Anotylus in Costa Rica is currently severely underestimated. A single elevational transect, on a single volcano, revealed nine times the number of taxa currently listed for the whole country. We believe that none of these new taxa are either of the Anotylus known from Costa Rica. While external adult morphometrics did not allow the unambiguous differentiation of all putative taxa identified by barcodes, we did find statistical support for the separation of most of the well-sampled putative species and a significant positive relationship between molecular and morphometric variation within BINs. Due to the, often decoupled, nature of mitochondrial and nuclear molecular evolution [97,98], we would not necessarily expect that morphometric variation would accumulate at the same rate as mitochondrial variation. Finding that, generally, the most divergent putative species suggested by DNA barcoding are diagnosable using external morphometrics supports the use of DNA barcodes as a first-pass assessment of underdescribed diversity in poorly known taxa such as Neotropical Anotylus, as has been performed and assumed for other tropical species-rich groups [99,100,101,102,103].
Our study explicitly focused on whether easily quantifiable characters, visible on high-resolution photos of adults, could be used to discriminate putative taxa identified by BINs. This approach was reasonably successful, without the examination of male genitalia, which clearly provide an additional, rapidly evolving character set for the discrimination of closely related taxa [104]. Future work on Costa Rican Anotylus will clearly require the integration of morphology and genetics, examination of previously described Neotropical species, and detailed study of genital characters, but our barcode database provides a critical first step. While the informative variation present in male genitalia may help eventually describe some taxa elucidated here, this would not remove the subsequent bias inserted by using a morphological character present in only ~50% of the adults collected to differentiate taxa (i.e., identifying females and immature individuals will not be possible based on characters on the male genitalia). In this case, a method that includes measures across intraspecific variation inherent to sex and age (such as DNA) will perform best across all individuals.

4.1. Anotylus—Diverse and Variable across Elevation

In many ways, the putative Anotylus species recognised here are exemplars of understudied Neotropical diversity—and the broader taxonomic group to which they belong is characterised by insufficient taxonomic resources (or at least resources that are incommensurate with its enormous diversity). The genus has also been an acknowledged taxonomic “receptacle” [57] for species that lack the discriminating features of other groups, meaning that it is likely to be paraphyletic. In the Neotropics, Anotylus is diverse [56,59]; they can be locally abundant and their abundance and diversity change rapidly across abiotic gradients associated with elevation [64]. Individual taxa are, therefore, prone to being overlooked and may be particularly vulnerable to isotherms shifting upslope in the current climate crisis [67]. We note a high degree of sympatry amongst these provisional species. Of our five most frequently collected species, four can be observed at the lower-elevation cloud forest site at 1300 m on Volcan Cacao, while the remaining common species is known only from a different volcano across (approximately) the same elevational range. These observations speak to known elements of Anotylus ecology—namely, that species have small geographic distributions [57] and are often found in sympatry [57]. In other tropical montane systems, Hammond [57] observed that there was a reduction in elytral size that was associated with a reduced capacity for flight with increased elevation. We found that elytral area was one of our most variable morphometric measurements and speculate that while all these species are not likely to move far or frequently, the species with the smallest elytra will be the taxa most restricted to their current elevational band of abiotic conditions, and, therefore, the first that we would lose to approaching high temperatures.

4.2. Cryptic Diversity within Cryptic Diversity

Two distinct morphological groups within a single DNA BIN may point to the existence of recently diverged taxa which are cryptic in a molecular sense. No other BINs demonstrated an intra-BIN division in their morphospace or phylogeny. Such a morphological split might be intraspecific and caused by sexual dimorphism (as has been observed in other Anotylus [59,105]), but this would not explain the corresponding genetic differences. Intraspecific genetic and morphological differences might be explained by separation along a strong elevational gradient, but while the groups exhibit a somewhat nested distribution, each group can be found at largely the same elevations (particularly in the upper elevations; thus, geography is unlikely to be the factor driving divergence. Thus, we feel that this is likely a case where a BIN contains more than one species, as has been observed in other insect groups [106,107]. The discovery of more than one species in one BIN, as demonstrated by their elevation and natural history, is no surprise. For example, in the Astraptes fulgurator, where 10 species were found in one name [108], six of these ten exist in a single BIN, where each can be distinguished by larval color, microecosystem, and barcode cluster within a BIN. Confirming the split we have documented here (and supporting the other provisional species we have erected) would ideally be followed by additional study (e.g., male genitalia and additional molecular markers, as in [61,102,109,110]). While description of these species was beyond the scope of this work, we do note that, from a morphotaxonomic perspective, these external measurements are often included in descriptions but frequently are not definitive. Despite this historic trend, our work highlights the utility that the combination of natural history (often elevation) with a DNA barcode and (comparatively) easy to acquire external morphometrics can offer diagnostic taxonomy [111].

4.3. Rarity

While our collections span a significant elevational transect and time period, half the provisional species identified here (9/18) are represented by fewer than four samples. In tropical ecosystems, it is not uncommon for species to be sampled, and often subsequently described from single specimens (e.g., [112,113,114,115]), and in a recent review, Deng et al. [116] found that more than 20% of the insect species described in a decade were singletons. Such a preponderance of singletons is likely due to a combination of natural rarity and small population sizes and geographic ranges. Singletons can also be a signature of incomplete sampling, and it is therefore possible that some of the 18 provisional species may reflect a limit of sampling and currently unknown estimates of intraspecific variation. However, in cases such as this, where we know where a species lives along a significant abiotic gradient (such as temperature) and we know that they differ markedly in their genetics, it is prudent to adjust our default statistical null expectation from one where we treat samples as being from the same species, until shown otherwise, to where we treat samples that differ in ecology, genetics, and morphology as separate until we collect some new evidence that unifies them. i.e., we accept a larger statistical Type I error (failing to reject a null hypothesis when it is true) by “splitting”, because “lumping” will minimise the Type II error of accepting a null hypothesis when it is, in fact, false. This leads to an underestimation of diversity; furthermore, it fosters an underappreciation for the magnitude of importance for the Type II error (of accepting the same when they are separate) [117]. Doing so improves the visibility of rare species that would historically be overlooked and can help mitigate the bias of underestimating the true species richness within tropical regions.

4.4. Cryptic Species and Protected Areas

In a recent review, Li and Wiens [4] reported that incorporating morphologically cryptic insect species (delimited using molecular methodology) would realistically increase estimated global biodiversity by at least two orders of magnitude—and perhaps more. Our study deals with one genus of small rove beetles on one Costa Rican volcano but shows that even in relatively well-studied tropical areas such as ACG, (semi-)cryptic staphylinid diversity is extensive. What these putative beetle species should be called, how widespread they are in the Neotropics, and how they are differentiated ecologically are all critical questions which remain unresolved—as they are for much of tropical invertebrate biodiversity. Thus, while formal description is beyond the scope of this work, but we anticipate will follow it, we have helped to demonstrate that surveys and subsequent protected area management decisions that utilise DNA-barcode-catalysed inventories of provisional species (such as BINs) are using biologically meaningful (and transparent) units of diversity that, in many cases, will eventually correspond with formally described species.

4.5. Elevational Patterns and Vulnerability in the Climate Crisis

Along tropical montane slopes, there exist a myriad of stable microclimates (until climate change happens)—and species that live here are often not adapted to moving among these microclimates or between adjacent peaks by passing through the other microhabitats separating them [35]. The result is often that the biodiversity of each mountain is unique, and many tropical mountain peaks house endemic species. This is certainly the case of Volcan Cacao, where the higher-elevation sites are characterised by (comparatively) stable cool and wet weather while the sites at lower elevations experience higher variation associated with long hot periods without rain and then relatively wet and warm rainy seasons [67,70,72,118]. At least, this is how temperature variation has divided itself historically across elevation [118]. In the current climate crisis, hot temperatures are occurring more frequently at higher elevations, and precipitation patterns are less dependable, as historic norms show [72]. The provisional species we identified here exist along this finely divided volcanic slope—and their future is likely in unavoidable jeopardy with ongoing climate change in Costa Rica. The diversity of these Anotylus increases into the cloud forest. These historically cold and damp locales likely foster many microhabitats and many opportunities for niche division amongst detritivores and dung eaters like these Anotylus. What can we expect with increased heat and decreased dependence on historical precipitation regimes but reduced opportunities for species that are likely decomposers of decaying plant material and dung? We fear that our elucidation of this diversity may have an elegiac element where future work will struggle to find some of these species again. ACG has experienced declines in insect diversity and abundance over the past two decades, occurring in varied taxa and habitats, and there is no other overarching causative agent that can be implicated beyond the myriad effects of climate change [118]. While these Anotylus are likely to experience such declines, we hope they will be among the survivors within the protected forests of ACG, where contiguous forests may provide sufficient movement opportunity for those species that can move.

Supplementary Materials

The following supporting information can be downloaded at: https://www.mdpi.com/article/10.3390/d16080441/s1, Table S1: Sample information and metadata for the specimens analysed here; Table S2: Morphological measurements; Table S3: Pairwise matrix of interspecific distances of PC1 (beneath diagonal) and Tukey post hoc test values (above diagonal); Table S4: Pairwise matrix of estimated interspecific distances between BINS (pdist). Figure S1: Phylogenetic PCA of BINs.

Author Contributions

Conceptualization, M.A.S., K.D.U. and R.P.; methodology, M.A.S., D.H.J., W.H., R.P., K.D.U. and D.T.B.; validation, M.A.S., K.D.U., D.T.B. and R.P.; formal analysis, M.A.S., K.D.U. and R.P.; investigation, M.A.S. and K.D.U.; resources, M.A.S.; data curation, M.A.S.; writing—original draft preparation, K.D.U.; writing—review and editing, M.A.S., R.P., D.T.B., D.H.J., W.H. and K.D.U.; visualization, M.A.S. and K.D.U.; supervision, M.A.S., R.P. and D.T.B.; project administration, M.A.S.; funding acquisition, M.A.S., D.H.J., W.H., R.P. and D.T.B. All authors have read and agreed to the published version of the manuscript.

Funding

Research in ACG was supported by grants to M.A.S. by the Natural Sciences and Engineering Research Council of Canada (NSERC) and the Canada Foundation for Innovation (CFI). The Government of Costa Rica, the Guanacaste Dry Forest Conservation Fund (GDFCF), and its individual private donors, and especially the Wege Foundation, provided valuable funding for portions of this research.

Institutional Review Board Statement

All specimens were collected, exported and DNA barcoded under Costa Rican government permits issued to BioAlfa (Janzen & Hallwachs 2019) (R-054-2022-OT-CONAGEBIO; R-019-2019-CONAGEBIO; National Published Decree #41767), JICA-SAPI #0328497 (2014) and DHJ and WH (ACG-PI-036-2013; R-SINAC-ACG-PI-061-2021; Resolución Nº001-2004 SINAC; PI-028-2021). Research permits to M.A.S. for work conducted in ACG: Yearly research permits are granted by the Área de Conservación Guanacaste: ACG-PI-36-2008, ACG-PI-12-2009, ACG-PI-01-2010, ACG-PI-044-2011, ACG-PI-013-2012, ACG-PI-008-2013, ACG-PI-051-2014, ACG-PI-008-2015, PI-093-2016, ACG-PI-055-2016, PI-073-2017, ACG-PI-044-2017, PI-018-2018, R-SINAC-ACG-PI-023-2018, ACG-128-2019, R-SINAC-ACG-PI-055-2019, SINAC-ACG-PI-026-2022, SINAC-ACG-PI-012-2023, SINAC-ACG-PI-004-2024 and CPI-SINAC-PNI-SE-001-2019.

Data Availability Statement

All sample metadata, including collection information, specimen images, and DNA sequences and trace files are available here: https://doi.org/10.5883/DS-ASANOT (accessed on 23 July 2024).

Acknowledgments

All authors emphatically and gratefully acknowledge the support of the paraprofessional and parataxonomist team from Área de Conservación Guanacaste, Costa Rica. All authors gratefully acknowledge the support of the staff of the Área de Conservación Guanacaste in protecting and managing this area, and in enabling this research. We gratefully acknowledge the enthusiasm and diligence of the students and volunteers from the Smith Lab at the University of Guelph who spent many hours sorting through mixed species field-lots from ACG.

Conflicts of Interest

The authors declare no conflicts of interest. The funders had no role in the design of the study; in the collection, analyses, or interpretation of data; in the writing of the manuscript; or in the decision to publish the results.

References

  1. Mora, C.; Tittensor, D.P.; Adl, S.; Simpson, A.G.B.; Worm, B. How many species are there on Earth and in the ocean? PLoS Biol. 2011, 9, e1001127. [Google Scholar] [CrossRef] [PubMed]
  2. Bánki, O.; Roskov, Y.; Döring, M.; Ower, G.; Hernández Robles, D.R.; Plata Corredor, C.A.; Stjernegaard Jeppesen, T.; Örn, A.; Vandepitte, L.; Hobern, D.; et al. Catalogue of Life Checklist. Version 2024-05-20. 2024. Available online: https://www.checklistbank.org/dataset/296511/about (accessed on 2 June 2024).
  3. Costello, M.J.; May, R.M.; Stork, N.E. Can We Name Earth’s Species before They Go Extinct? Science 2013, 339, 413–416. [Google Scholar] [CrossRef] [PubMed]
  4. Li, X.; Wiens, J.J. Estimating Global Biodiversity: The Role of Cryptic Insect Species. Syst. Biol. 2023, 72, 391–403. [Google Scholar] [CrossRef] [PubMed]
  5. Deichmann, J.L.; Mulcahy, D.G.; Vanthomme, H.; Tobi, E.; Wynn, A.H.; Zimkus, B.M.; McDiarmid, R.W. How many species and under what names? Using DNA barcoding and GenBank data for west Central African amphibian conservation. PLoS ONE 2017, 12, e0187283. [Google Scholar] [CrossRef] [PubMed]
  6. Suzán, G.; Marcé, E.; Giermakowski, J.T.; Mills, J.N.; Ceballos, G.; Ostfeld, R.S.; Armién, B.; Pascale, J.M.; Yates, T.L. Experimental Evidence for Reduced Rodent Diversity Causing Increased Hantavirus Prevalence. PLoS ONE 2009, 4, e5461. [Google Scholar] [CrossRef] [PubMed]
  7. Noss, R.F. Indicators for Monitoring Biodiversity: A Hierarchical Approach. Conserv. Biol. 1990, 4, 355–364. [Google Scholar] [CrossRef]
  8. Bortolus, A. Error cascades in the biological sciences: The unwanted consequences of using bad taxonomy in ecology. Ambio 2008, 37, 114–118. [Google Scholar] [CrossRef] [PubMed]
  9. Wilkins, J.S. Species: A History of the Idea; University of California Press: Berkeley, CA, USA, 2011; p. 320. [Google Scholar]
  10. Padial, J.M.; De la Riva, I. Taxonomic inflation and the stability of species lists: The perils of ostrich’s behavior. Syst. Biol. 2006, 55, 859–867. [Google Scholar] [CrossRef] [PubMed]
  11. Packer, L.; Grixti, J.C.; Roughley, R.E.; Hanner, R. The status of taxonomy in Canada and the impact of DNA barcoding. Can. J. Zool.-Rev. Can. Zool. 2009, 87, 1097–1110. [Google Scholar] [CrossRef]
  12. Barnosky, A.D.; Matzke, N.; Tomiya, S.; Wogan, G.O.U.; Swartz, B.; Quental, T.B.; Marshall, C.; McGuire, J.L.; Lindsey, E.L.; Maguire, K.C.; et al. Has the Earth’s sixth mass extinction already arrived? Nature 2011, 471, 51–57. [Google Scholar] [CrossRef]
  13. Wagner David, L.; Grames Eliza, M.; Forister Matthew, L.; Berenbaum May, R.; Stopak, D. Insect decline in the Anthropocene: Death by a thousand cuts. Proc. Natl. Acad. Sci. USA 2021, 118, e2023989118. [Google Scholar] [CrossRef] [PubMed]
  14. Seymour, M.; Roslin, T.; deWaard, J.R.; Perez, K.H.J.; D’Souza, M.L.; Ratnasingham, S.; Ashfaq, M.; Levesque-Beaudin, V.; Blagoev, G.A.; Bukowski, B.; et al. Global arthropod beta-diversity is spatially and temporally structured by latitude. Commun. Biol. 2024, 7, 552. [Google Scholar] [CrossRef] [PubMed]
  15. Giam, X.; Scheffers, B.R.; Sodhi, N.S.; Wilcove, D.S.; Ceballos, G.; Ehrlich, P.R. Reservoirs of richness: Least disturbed tropical forests are centres of undescribed species diversity. Proc. R. Soc. B Biol. Sci. 2011, 279, 67–76. [Google Scholar] [CrossRef] [PubMed]
  16. Vieites, D.R.; Wollenberg, K.C.; Andreone, F.; Kohler, J.; Glaw, F.; Vences, M. Vast underestimation of Madagascar’s biodiversity evidenced by an integrative amphibian inventory. Proc. Natl. Acad. Sci. USA 2009, 106, 8267–8272. [Google Scholar] [CrossRef] [PubMed]
  17. Titley, M.A.; Snaddon, J.L.; Turner, E.C. Scientific research on animal biodiversity is systematically biased towards vertebrates and temperate regions. PLoS ONE 2017, 12, e0189577. [Google Scholar] [CrossRef] [PubMed]
  18. Godfray, H.C.J.; Clark, B.R.; Kitching, I.J.; Mayo, S.J.; Scoble, M.J. The Web and the Structure of Taxonomy. Syst. Biol. 2007, 56, 943–955. [Google Scholar] [CrossRef] [PubMed]
  19. Wheeler, Q.D.; Raven, P.H.; Wilson, E.O. Taxonomy: Impediment or Expedient? Science 2004, 303, 285. [Google Scholar] [CrossRef] [PubMed]
  20. Moura, M.R.; Jetz, W. Shortfalls and opportunities in terrestrial vertebrate species discovery. Nat. Ecol. Evol. 2021, 5, 631–639. [Google Scholar] [CrossRef] [PubMed]
  21. Zhang, Z.-Q. Animal Biodiversity: An Outline of Higher-Level Classification and Survey of Taxonomic Richness; Magnolia Press: Auckland, New Zealand, 2011; p. 237. [Google Scholar]
  22. Pante, E.; Schoelinck, C.; Puillandre, N. From Integrative Taxonomy to Species Description: One Step beyond. Syst. Biol. 2015, 64, 152–160. [Google Scholar] [CrossRef] [PubMed]
  23. Clark, J.A.; May, R.M. Taxonomic Bias in Conservation Research. Science 2002, 297, 191–192. [Google Scholar] [CrossRef]
  24. Cardoso, P.; Erwin, T.L.; Borges, P.A.V.; New, T.R. The seven impediments in invertebrate conservation and how to overcome them. Biol. Conserv. 2011, 144, 2647–2655. [Google Scholar] [CrossRef]
  25. Wilson, E.O. The Biological Diversity Crisis: Despite unprecedented extinction rates, the extent of biological diversity remains unmeasured. BioScience 1985, 35, 700–706. [Google Scholar] [CrossRef]
  26. Brunke, A.J.; Chatzimanolis, S. A revision of Haematodes Laporte and Weiserianum Bernhauer (Coleoptera: Staphylinidae: Staphylininae: Xanthopygina). PeerJ 2018, 6, e4582. [Google Scholar] [CrossRef] [PubMed]
  27. Liu, T.-t.; Hiroki, O.; Munetoshi, M. Revision of the intertidal rove beetle genus Bryothinusa from Japan (Coleoptera: Staphylinidae: Aleocharinae). Acta Entomol. Musei Natl. Pragae 2021, 61, 163–201. [Google Scholar] [CrossRef]
  28. Janak, J.; Bordoni, A. Revision of the genus Thyreocephalus and description of Afrus gen. nov. of Africa south of the Sahara (Coleoptera: Staphylinidae: Staphylininae). Zootaxa 2015, 4038, 1–94. [Google Scholar] [CrossRef]
  29. Sikes, D.S.; Thayer, M.K.; Newton, A.F. Large carrion and burying beetles evolved from Staphylinidae (Coleoptera, Staphylinidae, Silphinae): A review of the evidence. ZooKeys 2024, 1200, 159–182. [Google Scholar] [CrossRef] [PubMed]
  30. Brunke, A.J.; Hansen, A.K.; Salnitska, M.; Kypke, J.L.; Predeus, A.V.; Escalona, H.; Chapados, J.T.; Eyres, J.; Richter, R.; Smetana, A.; et al. The limits of Quediini at last (Staphylinidae: Staphylininae): A rove beetle mega-radiation resolved by comprehensive sampling and anchored phylogenomics. Syst. Entomol. 2021, 46, 396–421. [Google Scholar] [CrossRef]
  31. Chatzimanolis, S. A revision of the neotropical beetle genus Isanopus Sharp, 1876 (Coleoptera: Staphylinidae: Staphylinini). J. Nat. Hist. 2008, 42, 1765–1792. [Google Scholar] [CrossRef]
  32. Betz, O.; Irmler, U.; Klimaszewski, J.; Gusarov, V.I.; Chatzimanolis, S.; Asenjo, A.; Brunke, A.J.; Clarke, D.J.; Lipkow, E.; Buffam, J.; et al. Biology of Rove Beetles (Staphylinidae): Life History, Evolution, Ecology and Distribution; Betz, O., Irmler, U., Klimaszewski, J., Eds.; Springer International Publishing: Cham, Switzerland, 2018. [Google Scholar]
  33. Brunke, A.J.; Bouchard, P.; Douglas, H.B.; Pentinsaari, M. Coleoptera of Canada. ZooKeys 2019, 819, 361–376. [Google Scholar] [CrossRef]
  34. Basset, Y.; Novotny, V.; Miller, S.E.; Weiblen, G.D.; Missa, O.; Stewart, A.J.A. Conservation and biological monitoring of tropical forests: The role of parataxonomists. J. Appl. Ecol. 2004, 41, 163–174. [Google Scholar] [CrossRef]
  35. Janzen, D.H. Why mountain passes are higher in the tropics. Am. Nat. 1967, 101, 233–249. [Google Scholar] [CrossRef]
  36. Irmler, U.; Klimaszewski, J.; Betz, O. Introduction to the biology of rove beetles. In Biology of Rove Beetles (Staphylinidae): Life History, Evolution, Ecology and Distribution; Springer: Cham, Switzerland, 2018; pp. 1–4. [Google Scholar]
  37. Tihelka, E.; Thayer, M.K.; Newton, A.F.; Cai, C. New Data, Old Story: Molecular Data Illuminate the Tribal Relationships among Rove Beetles of the Subfamily Staphylininae (Coleoptera: Staphylinidae). Insects 2020, 11, 164. [Google Scholar] [CrossRef] [PubMed]
  38. Lohse, G.A.; Klimaszewski, J.; Smetana, A. Revision of Arctic Aleocharinae of North America (Coleoptera: Staphylinidae). Coleopt. Bull. 1990, 44, 121–202. [Google Scholar]
  39. Sakchoowong, W.; Nomura, S.; Ogata, K.; Chanpaisaeng, J. Diversity of pselaphine beetles (Coleoptera: Staphylinidae: Pselaphinae) in eastern Thailand. Entomol. Sci. 2008, 11, 301–313. [Google Scholar] [CrossRef]
  40. Belskaya, E.A.; Kolesnikova, A.A. Species composition and ecological characteristics of rove beetles (Coleoptera, Staphylinidae) in the southern taiga of the Middle Urals. Entomol. Rev. 2011, 91, 599–610. [Google Scholar] [CrossRef]
  41. Moore, I.; Legner, E.F. Intertidal rove beetles (Coleoptera: Staphylinidae). Mar. Insects 1976, 1976, 521–551. [Google Scholar]
  42. Rodriguez, J.J.; Fernández-Triana, J.L.; Smith, M.A.; Janzen, D.H.; Hallwachs, W.; Erwin, T.L.; Whitfield, J.B. Extrapolations from field studies and known faunas converge on dramatically increased estimates of global microgastrine parasitoid wasp species richness (Hymenoptera: Braconidae). Insect Conserv. Divers. 2013, 6, 530–536. [Google Scholar] [CrossRef]
  43. Forbes, A.A.; Bagley, R.K.; Beer, M.A.; Hippee, A.C.; Widmayer, H.A. Quantifying the unquantifiable: Why Hymenoptera, not Coleoptera, is the most speciose animal order. BMC Ecol. 2018, 18, 21. [Google Scholar] [CrossRef] [PubMed]
  44. Janzen, D.; Hallwachs, W.; Pereira, G.; Blanco, R.; Masis, A.; Chavarria, M.M.; Chavarria, F.; Guadamuz, A.; Araya, M.; Smith, M.A.; et al. Using DNA-barcoded Malaise trap samples to measure impact of a geothermal energy project on the biodiversity of a Costa Rican old-growth rain forest. Genome 2020, 63, 407–436. [Google Scholar] [CrossRef]
  45. Hebert, P.D.N.; Ratnasingham, S.; Zakharov, E.V.; Telfer, A.C.; Levesque-Beaudin, V.; Milton, M.A.; Pedersen, S.; Jannetta, P.; deWaard, J.R. Counting animal species with DNA barcodes: Canadian insects. Philos. Trans. R. Soc. B Biol. Sci. 2016, 371, 20150333. [Google Scholar] [CrossRef]
  46. Parker, J. Staphylinids. Curr. Biol. 2017, 27, R49–R51. [Google Scholar] [CrossRef] [PubMed]
  47. Andersen, R.S.; Ashe, J.S. Leaf litter inhabiting beetles as surrogates for establishing priorities for conservation of selected tropical montane cloud forests in Honduras, Central America (Coleoptera; Staphylinidae, Curculionidae). Biodivers. Conserv. 2000, 9, 617–653. [Google Scholar] [CrossRef]
  48. Klimaszewski, J.; Brunke, A.J.; Work, T.T.; Venier, L. Rove Beetles (Coleoptera, Staphylinidae) as Bioindicators of Change in Boreal Forests and Their Biological Control Services in Agroecosystems: Canadian Case Studies. In Biology of Rove Beetles (Staphylinidae): Life History, Evolution, Ecology and Distribution; Betz, O., Irmler, U., Klimaszewski, J., Eds.; Springer International Publishing: Cham, Switzerland, 2018; pp. 161–181. [Google Scholar]
  49. Bohac, J. Staphylinid beetles as bioindicators. Agric. Ecosyst. Environ. 1999, 74, 357–372. [Google Scholar] [CrossRef]
  50. Makranczy, G. Systematics and phylogenetic relationships of the genera in the Carpelimus group (Coleoptera: Staphylinidae: Oxytelinae). Ann. Hist. Nat. Musei Natl. Hung. 2006, 98, 29–120. [Google Scholar]
  51. Kishimoto, H.; Adachi, I. Predation and oviposition by predatory Stethorus japonicus, Oligota kashmirica benefica, and Scolothrips takahashii in egg patches of various spider mite species. Entomol. Exp. Et Appl. 2008, 128, 294–302. [Google Scholar] [CrossRef]
  52. Kollat-Palenga, I.; Basedow, T. Aphid feeding of predatory Staphylinidae on different strata (soil surface and wheat seedlings) in laboratory experiments/Blattlausfraß bei räuberischen Staphylinidae auf der Bodenoberfläche und auf Weizenpflanzen im Laborversuch. Z. Für Pflanzenkrankh. Und Pflanzenschutz J. Plant Dis. Prot. 2000, 107, 643–648. [Google Scholar]
  53. Pohl, G.; Langor, D.; Klimaszewski, J.; Work, T.; Paquin, P. Rove beetles (Coleoptera: Staphylinidae) in northern Nearctic forests. Can. Entomol. 2008, 140, 415–436. [Google Scholar] [CrossRef]
  54. Gusarov, V.I. Phylogeny of the Family Staphylinidae Based on Molecular Data: A Review. In Biology of Rove Beetles (Staphylinidae): Life History, Evolution, Ecology and Distribution; Betz, O., Irmler, U., Klimaszewski, J., Eds.; Springer International Publishing: Cham, Switzerland, 2018; pp. 7–25. [Google Scholar]
  55. Lü, L.; Zhou, H.Z. Taxonomy of the genus Oxytelus Gravenhorst (Coleoptera: Staphylinidae: Oxytelinae) from China. Zootaxa 2012, 3576, 1–63. [Google Scholar] [CrossRef]
  56. Herman, L.H. Phylogeny and reclassification of the genera of the rove-beetle subfamily Oxytelinae of the world (Coleoptera, Staphylinidae). Bull. AMNH 1970, 142, 345–454. [Google Scholar]
  57. Hammond, P.M. A review of the genus Anotylus C.G. Thomson (Coleoptera: Staphylinidae). Bull. Br. Mus. Entomol. 1976, 33, 139–187. [Google Scholar]
  58. Herman, L. Catalog of the Staphylinidae. Am. Mus. Nat. Hist. Bull. 2001, 265, 1–426. [Google Scholar]
  59. Makranczy, G. Four new Neotropical species of Anotylus with an interesting sexual dimorphism (Coleoptera, Staphylinidae: Oxytelinae). Ann. Hist. Nat. Musei Natl. Hung. 2011, 103, 43–64. [Google Scholar]
  60. Herman, L.H. Catalog of the Staphylinidae (Insecta: Coleoptera). 1758 to the End of the Second Millennium III. Oxyteline Group. Bull. Am. Mus. Nat. Hist. 2001, 2001, 1067–1806. [Google Scholar] [CrossRef]
  61. Burns, J.; Janzen, D.H.; Hallwachs, W.; Hajibabaei, M.; Hebert, P. Genitalia, DNA barcodes, and life histories synonymize telles with thracides—A genus in which telles arcalaus looks out of place (Hesperiidae: Hesperiinae). J. Lepid. Soc. 2009, 63, 141–153. [Google Scholar]
  62. Bernhauer, M. Neue Staphyliniden aus Kostarika. Zool. Anz. 1942, 138, 1–27. [Google Scholar]
  63. Makranczy, G. Review of the Anotylus cimicoides species group (Coleoptera: Staphylinidae: Oxytelinae). Acta Zool. Acad. Sci. Hung. 2017, 63, 143–262. [Google Scholar] [CrossRef]
  64. Dolson, S.J.; Loewen, E.; Jones, K.; Jacobs, S.R.; Solis, A.; Hallwachs, W.; Brunke, A.J.; Janzen, D.H.; Smith, M.A. Diversity and phylogenetic community structure across elevation during climate change in a family of hyperdiverse neotropical beetles (Staphylinidae). Ecography 2021, 44, 740–752. [Google Scholar] [CrossRef]
  65. Ratnasingham, S.; Hebert, P.D. A DNA-based registry for all animal species: The barcode index number (BIN) system. PLoS ONE 2013, 8, e66213. [Google Scholar] [CrossRef]
  66. Smith, M.A.; Hallwachs, W.; Janzen, D.H. Diversity and phylogenetic community structure of ants along a Costa Rican elevational gradient. Ecography 2014, 37, 720–731. [Google Scholar] [CrossRef]
  67. Smith, M.A.; Warne, C.; Pare, K.; Dolson, S.; Loewen, E.; Jones, K.; McPhee, M.; Stitt, L.; Janke, L.; Smith, R.M.; et al. Communities of Small Terrestrial Arthropods Change Rapidly Along a Costa Rican Elevation Gradient. In Neotropical Gradients and Their Analysis; Myster, R.W., Ed.; Springer International Publishing: Cham, Switzerland, 2023; pp. 255–307. [Google Scholar]
  68. Dolson, S.J.; McPhee, M.; Viquez, C.F.; Hallwachs, W.; Janzen, D.H.; Smith, M.A. Spider diversity across an elevation gradient in Área de Conservación Guanacaste (ACG), Costa Rica. Biotropica 2020, 52, 1092–1102. [Google Scholar] [CrossRef]
  69. Warne, C.P.K.; Hallwachs, W.; Janzen, D.H.; Smith, M.A. Functional and genetic diversity changes through time in a cloud forest ant assemblage. Biotropica 2020, 52, 1084–1091. [Google Scholar] [CrossRef]
  70. Janzen, D.; Hallwachs, W. Área de Conservación Guanacaste, northwestern Costa Rica: Converting a tropical national park to conservation via biodevelopment. Biotropica 2020, 52, 1017–1029. [Google Scholar] [CrossRef]
  71. Janzen, D.H.; Hallwachs, W. Biodiversity Conservation History and Future in Costa Rica: The Case of Area de Conservacion Guanacaste (ACG). In Costa Rican Ecosystems; Kappelle, M., Ed.; University of Chicago Press: Chicago, IL, USA, 2016; pp. 290–341. [Google Scholar]
  72. Smith, M.A. Temperature, precipitation and soil characteristics of Volcan Cacao—Area de Conservacion Guanacaste (ACG), Costa Rica. 2023. Available online: https://borealisdata.ca/dataset.xhtml?persistentId=doi:10.5683/SP3/LQYQJZ (accessed on 5 February 2024).
  73. Ivanova, V.N.; Dewaard, J.R.; Hebert, P.D.N. An inexpensive, automation-friendly protocol for recovering high-quality DNA. Mol. Ecol. Notes 2006, 6, 998–1002. [Google Scholar] [CrossRef]
  74. Smith, M.A.; Fisher, B.L. Invasions, DNA barcodes, and rapid biodiversity assessment using ants of Mauritius. Front. Zool. 2009, 6, 31. [Google Scholar] [CrossRef] [PubMed]
  75. Brunke, A.; Newton, A.; Klimaszewski, J.; Majka, C.; Marshall, S. Staphylinidae of Eastern Canada and Adjacent United States. Key to Subfamilies; Staphylininae: Tribes and Subtribes, and Species of Staphylinina. Can. J. Arthropod Identif. 2011, 12, 1–110. [Google Scholar] [CrossRef]
  76. Navarrete-Heredia, J.L.; Newton, A.F.; Thayer, M.K.; Chandler, D.S. Guia Ilustrada Para los Generos de Staphylinidae (Coleoptera) de Mexico; Universidad de Guadalajara y CONABIO: Coyoacan, Mexico, 2002; pp. 1–371. [Google Scholar]
  77. Ratnasingham, S.; Hebert, P.D.N. BOLD: The Barcode of Life Data System (www.barcodinglife.org). Mol. Ecol. Notes 2007, 7, 355–364. [Google Scholar] [CrossRef] [PubMed]
  78. Puillandre, N.; Brouillet, S.; Achaz, G. ASAP: Assemble species by automatic partitioning. Mol. Ecol. Resour. 2021, 21, 609–620. [Google Scholar] [CrossRef] [PubMed]
  79. Tamura, K.; Stecher, G.; Kumar, S. MEGA11: Molecular Evolutionary Genetics Analysis Version 11. Mol. Biol. Evol. 2021, 38, 3022–3027. [Google Scholar] [CrossRef] [PubMed]
  80. Edgar, R.C. MUSCLE: Multiple sequence alignment with high accuracy and high throughput. Nucleic Acids Res. 2004, 32, 1792–1797. [Google Scholar] [CrossRef]
  81. Tavaré, S. Some probabilistic and statistical problems in the analysis of DNA sequences. Lect. Math. Life Sci. 1986, 17, 57–86. [Google Scholar]
  82. Kearse, M.; Moir, R.; Wilson, A.; Stones-Havas, S.; Cheung, M.; Sturrock, S.; Buxton, S.; Cooper, A.; Markowitz, S.; Duran, C.; et al. Geneious Basic: An integrated and extendable desktop software platform for the organization and analysis of sequence data. Bioinformatics 2012, 28, 1647–1649. [Google Scholar] [CrossRef] [PubMed]
  83. Huelsenbeck, J.P.; Ronquist, F. MRBAYES: Bayesian inference of phylogenetic trees. Bioinformatics 2001, 17, 754–755. [Google Scholar] [CrossRef] [PubMed]
  84. Rambaut, A. FigTree-Version 1.4. 3, a Graphical Viewer of Phylogenetic Trees. 2017. Available online: http://tree.bio.ed.ac.uk/software/figtree/ (accessed on 2 June 2024).
  85. Hammond, P.M. The crassicornis species-group of the genus Anotylus (Staphylinidae). Syst. Entomol. 1976, 1, 19–51. [Google Scholar] [CrossRef]
  86. Wang, L.-F.; Zhou, H.-Z. Taxonomy of Anotylus nitidifrons group (Coleoptera: Staphylinidae: Oxytelinae) and five new species from China. Zootaxa 2020, 4861, 23–42. [Google Scholar] [CrossRef] [PubMed]
  87. Schneider, C.A.; Rasband, W.S.; Eliceiri, K.W. NIH Image to ImageJ: 25 years of image analysis. Nat. Methods 2012, 9, 671–675. [Google Scholar] [CrossRef] [PubMed]
  88. Prodanov, D. Color Histogram. 2010. Available online: https://imagej.net/ij/plugins/color-histogram.html (accessed on 2 June 2024).
  89. R_Core_Team R: A Language and Environment for Statistical Computing. R Foundation for Statistical Computing, Vienna, Austria. 2023. Available online: https://www.R-project.org/ (accessed on 2 June 2024).
  90. Lê, S.; Josse, J.; Husson, F. FactoMineR: An R Package for Multivariate Analysis. J. Stat. Softw. 2008, 25, 1–18. [Google Scholar] [CrossRef]
  91. Josse, J.; Husson, F. missMDA: A Package for Handling Missing Values in Multivariate Data Analysis. J. Stat. Softw. 2016, 70, 1–31. [Google Scholar] [CrossRef]
  92. Kiers, H.A.L. Weighted least squares fitting using ordinary least squares algorithms. Psychometrika 1997, 62, 251–266. [Google Scholar] [CrossRef]
  93. Verbanck, M.; Josse, J.; Husson, F. Regularised PCA to denoise and visualise data. Stat. Comput. 2015, 25, 471–486. [Google Scholar] [CrossRef]
  94. Wickham, H. ggplot2: Elegant Graphics for Data Analysis; Springer-Verlag: New York, NY, USA, 2016. [Google Scholar]
  95. Revell, L.J. phytools 2.0: An updated R ecosystem for phylogenetic comparative methods (and other things). PeerJ 2024, 12, e16505. [Google Scholar] [CrossRef]
  96. Bjornstad, O.N. ncf: Spatial Nonparametric Covariance Functions; R package version 1.1-4. 2012. Available online: http://CRAN.R-project.org/package=ncf (accessed on 2 June 2024).
  97. Ballard, J.W.O.; Rand, D.M. The population biology of mitochondrial DNA and its phylogenetic implications. Annu. Rev. Ecol. Evol. Syst. 2005, 36, 621–642. [Google Scholar] [CrossRef]
  98. Dong, Z.; Wang, Y.; Li, C.; Li, L.; Men, X. Mitochondrial DNA as a Molecular Marker in Insect Ecology: Current Status and Future Prospects. Ann. Entomol. Soc. Am. 2021, 114, 470–476. [Google Scholar] [CrossRef]
  99. Smith, M.A.; Fernandez-Triana, J.L.; Eveleigh, E.; Gomez, J.; Guclu, C.; Hallwachs, W.; Hebert, P.D.N.; Hrcek, J.; Huber, J.T.; Janzen, D.; et al. DNA barcoding and the taxonomy of Microgastrinae wasps (Hymenoptera, Braconidae): Impacts after 8years and nearly 20,000 sequences. Mol. Ecol. Resour. 2013, 13, 168–176. [Google Scholar] [CrossRef] [PubMed]
  100. Janzen, D.H.; Hallwachs, W.; Blandin, P.; Burns, J.M.; Cadiou, J.-M.; Chacon, I.; Dapkey, T.; Deans, A.R.; Epstein, M.E.; Espinoza, B.; et al. Integration of DNA barcoding into an ongoing inventory of complex tropical biodiversity. Mol. Ecol. Resour. 2009, 9, 1–26. [Google Scholar] [CrossRef] [PubMed]
  101. Hajibabaei, M.; Janzen, D.H.; Burns, J.M.; Hallwachs, W.; Hebert, P.D.N. DNA barcodes distinguish species of tropical Lepidoptera. Proc. Natl. Acad. Sci. USA 2006, 103, 968–971. [Google Scholar] [CrossRef] [PubMed]
  102. Smith, M.A.; Wood, D.M.; Janzen, D.H.; Hallwachs, W.; Hebert, P.D. DNA barcodes affirm that 16 species of apparently generalist tropical parasitoid flies (Diptera, Tachinidae) are not all generalists. Proc. Natl. Acad. Sci. USA 2007, 104, 4967–4972. [Google Scholar] [CrossRef] [PubMed]
  103. Smith, M.A.; Woodley, N.E.; Janzen, D.H.; Hallwachs, W.; Hebert, P.D.N. DNA barcodes reveal cryptic host-specificity within the presumed polyphagous members of a genus of parasitoid flies (Diptera: Tachinidae). Proc. Natl. Acad. Sci. USA 2006, 103, 3657–3662. [Google Scholar] [CrossRef] [PubMed]
  104. Ortiz, A.S.; Rubio, R.M.; Guerrero, J.J.; Garre, M.J.; Serrano, J.; Hebert, P.D.N.; Hausmann, A. Close congruence between Barcode Index Numbers (bins) and species boundaries in the Erebidae (Lepidoptera: Noctuoidea) of the Iberian Peninsula. Biodivers Data J. 2017, e19840. [Google Scholar] [CrossRef] [PubMed]
  105. Yue, Y.; Makranczy, G.; Ren, D. A Mesozoic species of Anotylus (Coleoptera, Staphylinidae, Oxytelinae) from Liaoning, China, with the earliest evidence of sexual dimorphism in rove beetles. J. Paleontol. 2012, 86, 508–512. [Google Scholar] [CrossRef]
  106. Hendrich, L.; Morinière, J.; Haszprunar, G.; Hebert, P.D.N.; Hausmann, A.; Köhler, F.; Balke, M. A comprehensive DNA barcode database for Central European beetles with a focus on Germany: Adding more than 3500 identified species to BOLD. Mol. Ecol. Resour. 2015, 15, 795–818. [Google Scholar] [CrossRef]
  107. Janzen, D.H.; Hallwachs, W.; Burns, J.M.; Hajibabaei, M.; Bertrand, C.; Hebert, P.D.N. Reading the Complex Skipper Butterfly Fauna of One Tropical Place. PLoS ONE 2011, 6, e19874. [Google Scholar] [CrossRef] [PubMed]
  108. Hebert, P.D.N.; Penton, E.H.; Burns, J.M.; Janzen, D.H.; Hallwachs, W. Ten species in one: DNA barcoding reveals cryptic species in the neotropical skipper butterfly Astraptes fulgerator. Proc. Natl. Acad. Sci. USA 2004, 101, 14812–14817. [Google Scholar] [CrossRef] [PubMed]
  109. Burns, J.M.; Janzen, D.H.; Hajibabaei, M.; Hallwachs, W.; Hebert, P.D.N. DNA barcodes of closely related (but morphologically and ecologically distinct) species of skipper butterflies (Hesperiidae) can differ by only one to three nucleotides. J. Lepid. Soc. 2007, 61, 138–153. [Google Scholar]
  110. Smith, M.A.; Rodriguez, J.J.; Whitfield, J.B.; Deans, A.R.; Janzen, D.H.; Hallwachs, W.; Hebert, P.D. Extreme diversity of tropical parasitoid wasps exposed by iterative integration of natural history, DNA barcoding, morphology, and collections. Proc. Natl. Acad. Sci. USA 2008, 105, 12359–12364. [Google Scholar] [CrossRef]
  111. Sharkey, M.J.; Janzen, D.H.; Hallwachs, W.; Chapman, E.G.; Smith, M.A.; Dapkey, T.; Brown, A.; Ratnasingham, S.; Naik, S.; Manjunath, R.; et al. Minimalist revision and description of 403 new species in 11 subfamilies of Costa Rican braconid parasitoid wasps, including host records for 219 species. ZooKeys 2021, 1013, 1–665. [Google Scholar] [PubMed]
  112. Coddington, J.; Agnarsson, I.; Miller, J.; Kuntner, M.; Hormiga, G. Undersampling bias: The null hypothesis for singleton species in tropical arthropod surveys. J. Anim. Ecol. 2009, 78, 73–84. [Google Scholar] [CrossRef]
  113. Stork, N.E.; Grimbacher, P.S. Beetle assemblages from an Australian tropical rainforest show that the canopy and the ground strata contribute equally to biodiversity. Proc. R. Soc. B Biol. Sci. 2006, 273, 1969–1975. [Google Scholar] [CrossRef] [PubMed]
  114. Lim, G.; Balke, M.; Meier, R. Determining Species Boundaries in a World Full of Rarity: Singletons, Species Delimitation Methods. Syst. Biol. 2011, 61, 165–169. [Google Scholar] [CrossRef]
  115. Escobar, F.; Lobo, J.M.; Halffter, G. Altitudinal variation of dung beetle (Scarabaeidae: Scarabaeinae) assemblages in the Colombian Andes. Glob. Ecol. Biogeogr. 2005, 14, 327–337. [Google Scholar] [CrossRef]
  116. Deng, J.; Guo, Y.; Cheng, Z.; Lu, C.; Huang, X. The Prevalence of Single-Specimen/Locality Species in Insect Taxonomy: An Empirical Analysis. Diversity 2019, 11, 106. [Google Scholar] [CrossRef]
  117. Smith, M.A.; Eveleigh, E.S.; McCann, K.S.; Merilo, M.T.; McCarthy, P.C.; Rooyen, K.I.V. Barcoding a Quantified Food Web: Crypsis, Concepts, Ecology and Hypotheses. PLoS ONE 2011, 6, e14424. [Google Scholar] [CrossRef] [PubMed]
  118. Janzen, D.H.; Hallwachs, W. To us insectometers, it is clear that insect decline in our Costa Rican tropics is real, so let’s be kind to the survivors. Proc. Natl. Acad. Sci. USA 2021, 118, e2002546117. [Google Scholar] [CrossRef] [PubMed]
Figure 1. Key morphological measurements are labelled on a sample specimen. Red lines indicate how the measurement was taken. Measurements of areas (4, 11, and 14) were recorded using the area visible in images. Pigmentation (15 and 16) was measured by taking the average of three cross-sections of the character.
Diversity 16 00441 g001
Figure 2. The phylogeny of ACG Anotylus calculated using maximum likelihood, with bootstrap support values indicated. Different species indicated in different colours.
Diversity 16 00441 g002
Figure 3. Morphological variation in ACG Anotylus. (A) PCA of all individuals and all taxa. (B) PCA of 5 most abundant taxa. (C) PCA of 5 most abundant taxa that includes the BOLD:ACZ5166 split and (D) scatter plot of the pairwise relationship between genetic and morphometric variation.
Diversity 16 00441 g003
Figure 4. Phylogenetic tree of putative ACG Anotylus species with a corresponding boxplot of their elytral area variation (identical topology and bootstrap values to Figure 2) and specimen photos (images not to scale).
Diversity 16 00441 g004
Table 1. The number of individuals and the elevational ranges (metres) for each ACG Anotylus species in BOLD as of June 2024.
BINCountMean Elevation (m)Median Elevation (m)Maximum Elevation (m)Minimum Elevation (m)
BOLD:ACZ55161161220.9611801480304
BOLD:ACZ5742111177.5513041458304
BOLD:ACZ598711046.00104610461046
BOLD:ACZ6447101009.7011281128323
BOLD:ADF3772471017.9411841314700
BOLD:ADF4138131850.008311280820
BOLD:ADF420041254.25126213041189
BOLD:ADF8741101232.20124713131050
BOLD:ADG061711314.00131413141314
BOLD:ADG1201151329.20131014821000
BOLD:ADH843621343.501343.514851202
BOLD:ADH909521187.501187.511891186
BOLD:ADH962011300.00130013001300
BOLD:ADH96227889.2910111011420
BOLD:ADI317541216.00119013041180
BOLD:ADL547421232.501232.514601005
BOLD:ADR27904823.751047119011
Disclaimer/Publisher’s Note: The statements, opinions and data contained in all publications are solely those of the individual author(s) and contributor(s) and not of MDPI and/or the editor(s). MDPI and/or the editor(s) disclaim responsibility for any injury to people or property resulting from any ideas, methods, instructions or products referred to in the content.

