Article

Lake Champlain Zooplankton Community Dynamics Following an Extreme Flood Event

Lake Champlain Research Institute, SUNY Plattsburgh, Plattsburgh, NY 12901, USA
*
Author to whom correspondence should be addressed.
Diversity 2024, 16(8), 451; https://doi.org/10.3390/d16080451
Submission received: 8 July 2024 / Revised: 18 July 2024 / Accepted: 23 July 2024 / Published: 31 July 2024

Abstract

:
Lake Champlain, the sixth largest freshwater lake in the U.S., is a deep thermally stratified temperate zone lake system. Recently, flood events have impacted the Northeastern U.S. more frequently than in past decades, resulting in increased turbidity and other impacts in northern temperate lakes. This study represents an unprecedented analysis of the impacts of major spring and summer flooding in 2011 on Lake Champlain zooplankton communities. Few studies exist on flood impacts on lake systems, especially in natural un-impounded lakes. Our results illustrate the impacts of large-scale flooding on planktonic communities in deep stratified temperate lakes and the differential responses among species based on autecological traits. Community responses include flood-adapted increase during the flood event (Ceriodaphnia reticulata and Eubosmina coregoni), a flood-intolerant decline (Asplanchna spp. and Keratella cochlearis) or a delayed flood intolerance (Daphnia retrocurva, Mesocyclops edax, and Polyarthra spp.). Our results suggest that large, temperate lakes such as Lake Champlain will experience community shifts in zooplankton composition during future extreme flood events associated with climate change-related weather patterns in the Northeastern U.S.

1. Introduction

As extreme flood events are expected to become more common in the Northeastern U.S. due to climate change [1], it is important to understand the possible consequences in large, deep stratified lakes. The influence of flooding on zooplankton communities has been well studied in reservoirs [2,3,4], estuaries [5] and floodplain lakes [6], but there has been little to no research on temperate natural lakes such as Lake Champlain.
During the spring of 2011, Lake Champlain experienced an extreme spring flooding event with Lake water levels exceeding all recorded data records. As a result of the heavy snowfall during the winter and extensive early-season rain events, Lake Champlain reached its highest recorded water level of 31.45 m (103.19 ft) in 2011 [7], with a 15% increase in surface area and 12.7% increase in volume [8]. The spring flood pulse occurred roughly a month later than the previous year and lasted longer in 2011, into mid-July, than in non-flood years (Figure 1). A second anomalous flood pulse occurred in 2011 when Tropical Storm Irene impacted the Champlain Valley in late August.
The major flooding of 2011 deposited large amounts of sediment into the lake; in one week in April, the Winooski River deposited as much phosphorus as it normally does in six months [8]. Increased turbidity associated with flooding may alter the thermal structure, light availability, and distribution and abundance of planktonic communities of Lake Champlain. Each 2011 flood event can be characterized as a relatively short term “pulse” disturbance in Lake Champlain [9], while the entire 2011 season most likely can be viewed as a “press” disturbance impacting the entire growth season.
Previous work, conducted mainly in impounded lakes, suggests that floods decrease overall zooplankton density. It is not clear whether this trend is due to decreases in reproduction or zooplankton mortality [4]. Godlewska et al. [4] found that populations of rotifers, such as Keratella cochlearis, increased after flood events, whereas copepod and cladoceran populations declined. Of the cladocerans, populations of Diaphanosoma spp. fared relatively well during floods, while others such as Daphnia spp. populations declined [3]. Because Daphnia filter feed indiscriminately, the addition of suspended sediments to water causes the ingestion rates of food items to decrease as they are replaced by sediment [2].
Little is known about how zooplankton communities in large, deep temperate lakes respond to flooding; therefore, we sought to describe the impacts of the 2011 Lake Champlain floods. The objective of this study was to assess the impact of 2011 flooding on the zooplankton community structure in Lake Champlain by comparing seasonal and annual patterns in zooplankton population dynamics between pre-flood, flood and post-flood periods. We also assessed which zooplankton ecological traits were associated with flood conditions and pre-flood or post-flood conditions.

2. Materials and Methods

2.1. Study Sites

Lake Champlain is the sixth largest freshwater lake in the United States. Located between Vermont and New York, it flows 120 miles from the Hudson–Champlain Canal in the south to its outlet, the Richelieu River in the north, with a water residence time of approximately three years. Although it is generally categorized as an oligo-mesotrophic system and has an average depth of 19.4 m, Lake Champlain has several hydrologically distinct basins [10].
Three stations have been selected for this study to represent the condition of the main deep lake (Figure 2). Station 9, the southernmost station, is 87 m deep (Table 1). Station 19, located at the widest portion of the lake outside of Burlington, VT, is 100 m deep. Station 36, located off Grand Isle, is 50 m deep.

2.2. Field and Laboratory Methods

All field methods followed procedures from the Lake Champlain Basin Program’s Long-Term Monitoring work plan [11,12]. Zooplankton samples were taken as a whole water-column vertical tow with a 153-micron mesh net bi-weekly between May and October in 2010, 2011, 2012, and 2013. All field samples were fixed in 10% formalin. Water clarity was estimated using a Secchi disk reading [12].
In the lab, samples were sub-sampled using a 1 mL Stenson-Hempel pipette and counted in a Sedgwick Rafter cell on an inverted light microscope. Standard keys used to identify the organisms to the lowest taxonomic unit possible include Balcer et al. [13], Stemberger [14], and Grothe and Grothe [15].

2.3. Data Analysis

Because traditional taxonomic categories do not capture all the information about compositional changes, examining functional traits, rather than species, may better detect community shifts. This analysis is already used for other organisms including stream insects [16], phytoplankton [17], and, more recently, crustacean zooplankton [18]. This study contributes qualitative functional information about rotifer ecological traits along with expanded trait information on crustacean zooplankton (see Appendix B).
We ran a nested ANOVA model to test for differences in average Secchi depth and maximum epilimnion depth across years in SPSS [19]. Site was a random factor nested within the fixed factor year, and Secchi/epilimnion depths were the dependent variables. The cutoff value we used was α = 0.05.
To determine zooplankton species associations with samples from pre- and post-flood years by season, we used two-dimensional non-metric multidimensional scaling (NMDS) ordinations [20] with a Bray–Curtis dissimilarity index using the R “vegan” package in R.6.1 [21]. Ordination techniques were used to detect broad-scale patterns present in community composition. Species occurring in fewer than 5% of samples overall and within months were eliminated from the ordination to avoid disproportionately affecting the ordinations. We ran ordinations for pre-flood, flood, and post-flood data (2010–2012) by month, June through September, to investigate possible seasonal changes. Data were Wisconsin square root transformed for the analysis.
We created a trait matrix for both crustacean and rotifer zooplankton by conducting a literature search concerning common life-history traits of zooplankton as in Barnett et al. [17]. For example, inferences about the trophic status of the lake were made by observing densities of eutrophic indicator rotifer species (e.g., Polyarthra spp., Conochilus spp. unicornis, Asplanchna spp., and Ploesoma spp.; and, to a lesser extent, Keratella cochlearis, Polyarthra euryptera, and Ploesoma spp.) [22]. The species–by-sample matrix was transformed into a trait-by-sample matrix by weighting densities with traits and affinities as in Lamouroux et al. [23]. To assess community responses based on ecological traits, we ran trait-based NMDS ordinations for early (June/July) and late (August/September) seasons for the pre-flood (2010), flood (2011) and post-flood (2012) years.

3. Results

Zooplankton taxa richness remained constant throughout the duration of this study. All years had 11 copepod species and 10 cladoceran species; the flood year had 14 rotifer taxa, while the year following had 12. On average, copepods and cladocerans maintained similar densities in 2010 and 2011; in 2012, copepod densities decreased by 35% and cladoceran densities increased by 53%. Meanwhile, rotifer densities decreased by nearly 75% during the 2011 flood year and increased to half of the pre-flood density in 2012. In 2013 rotifer density increased 184% from the density in 2012, copepod density remained the same as the year prior, and cladocerans decreased by nearly 20%.

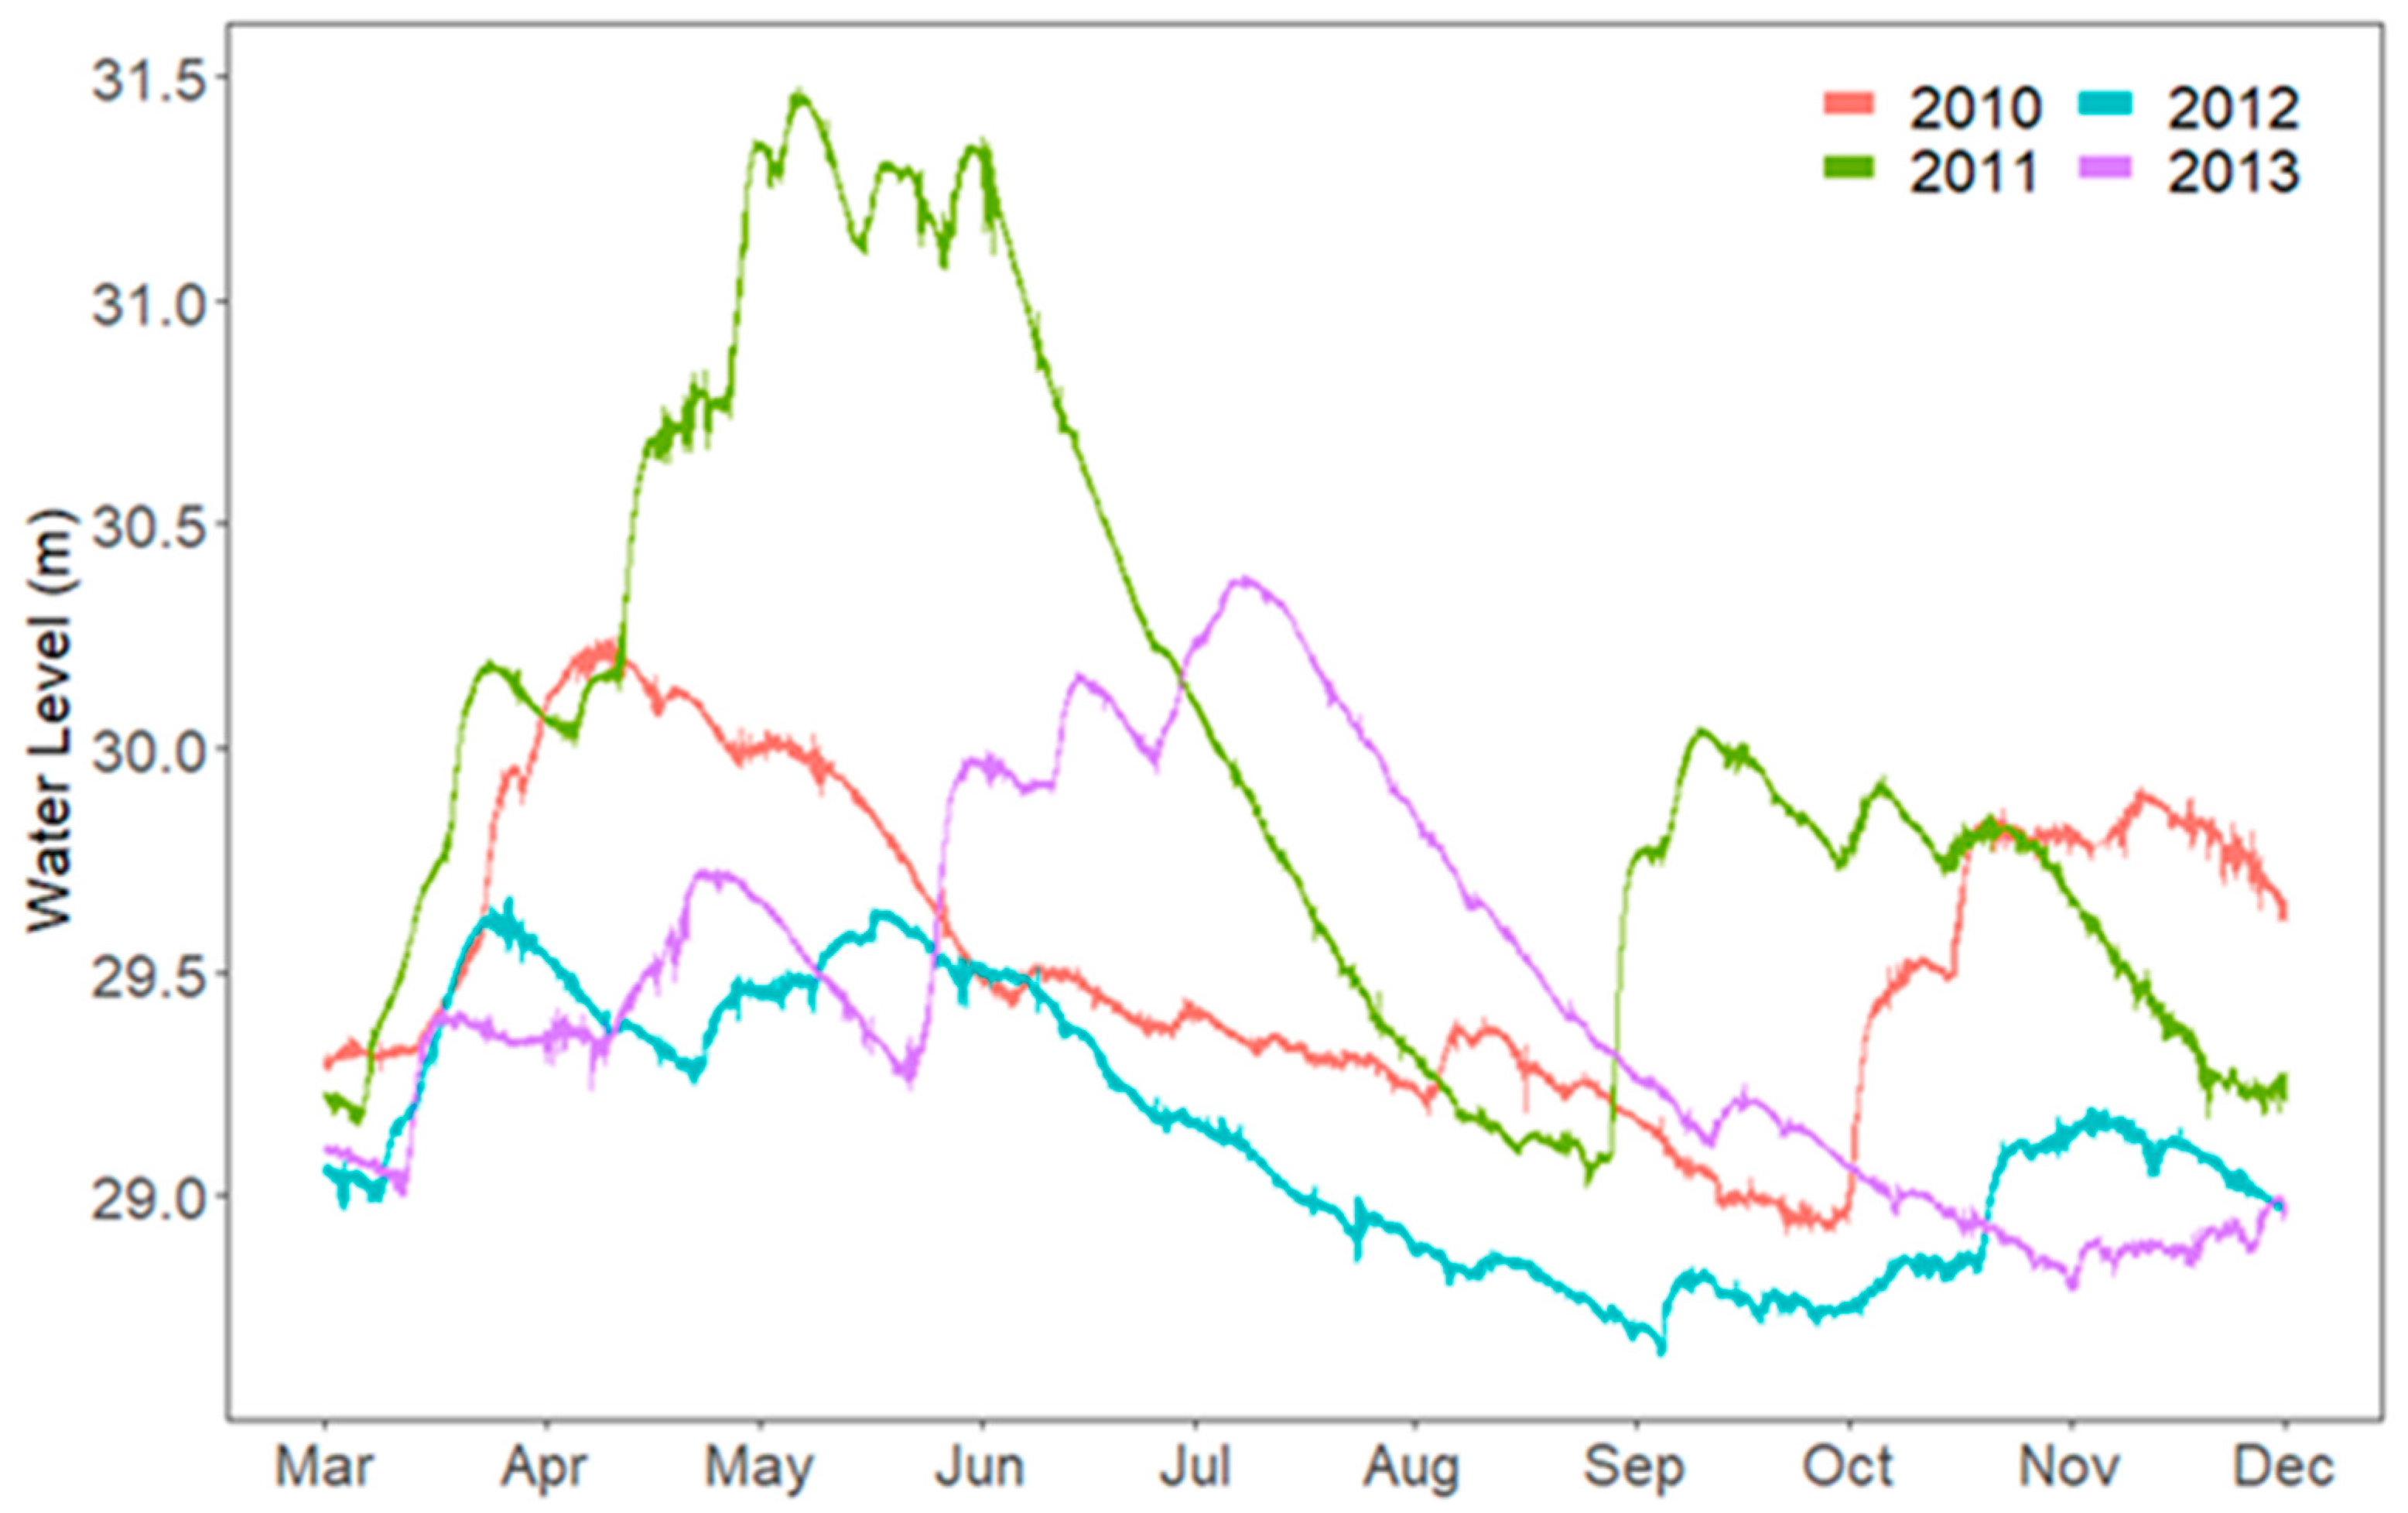
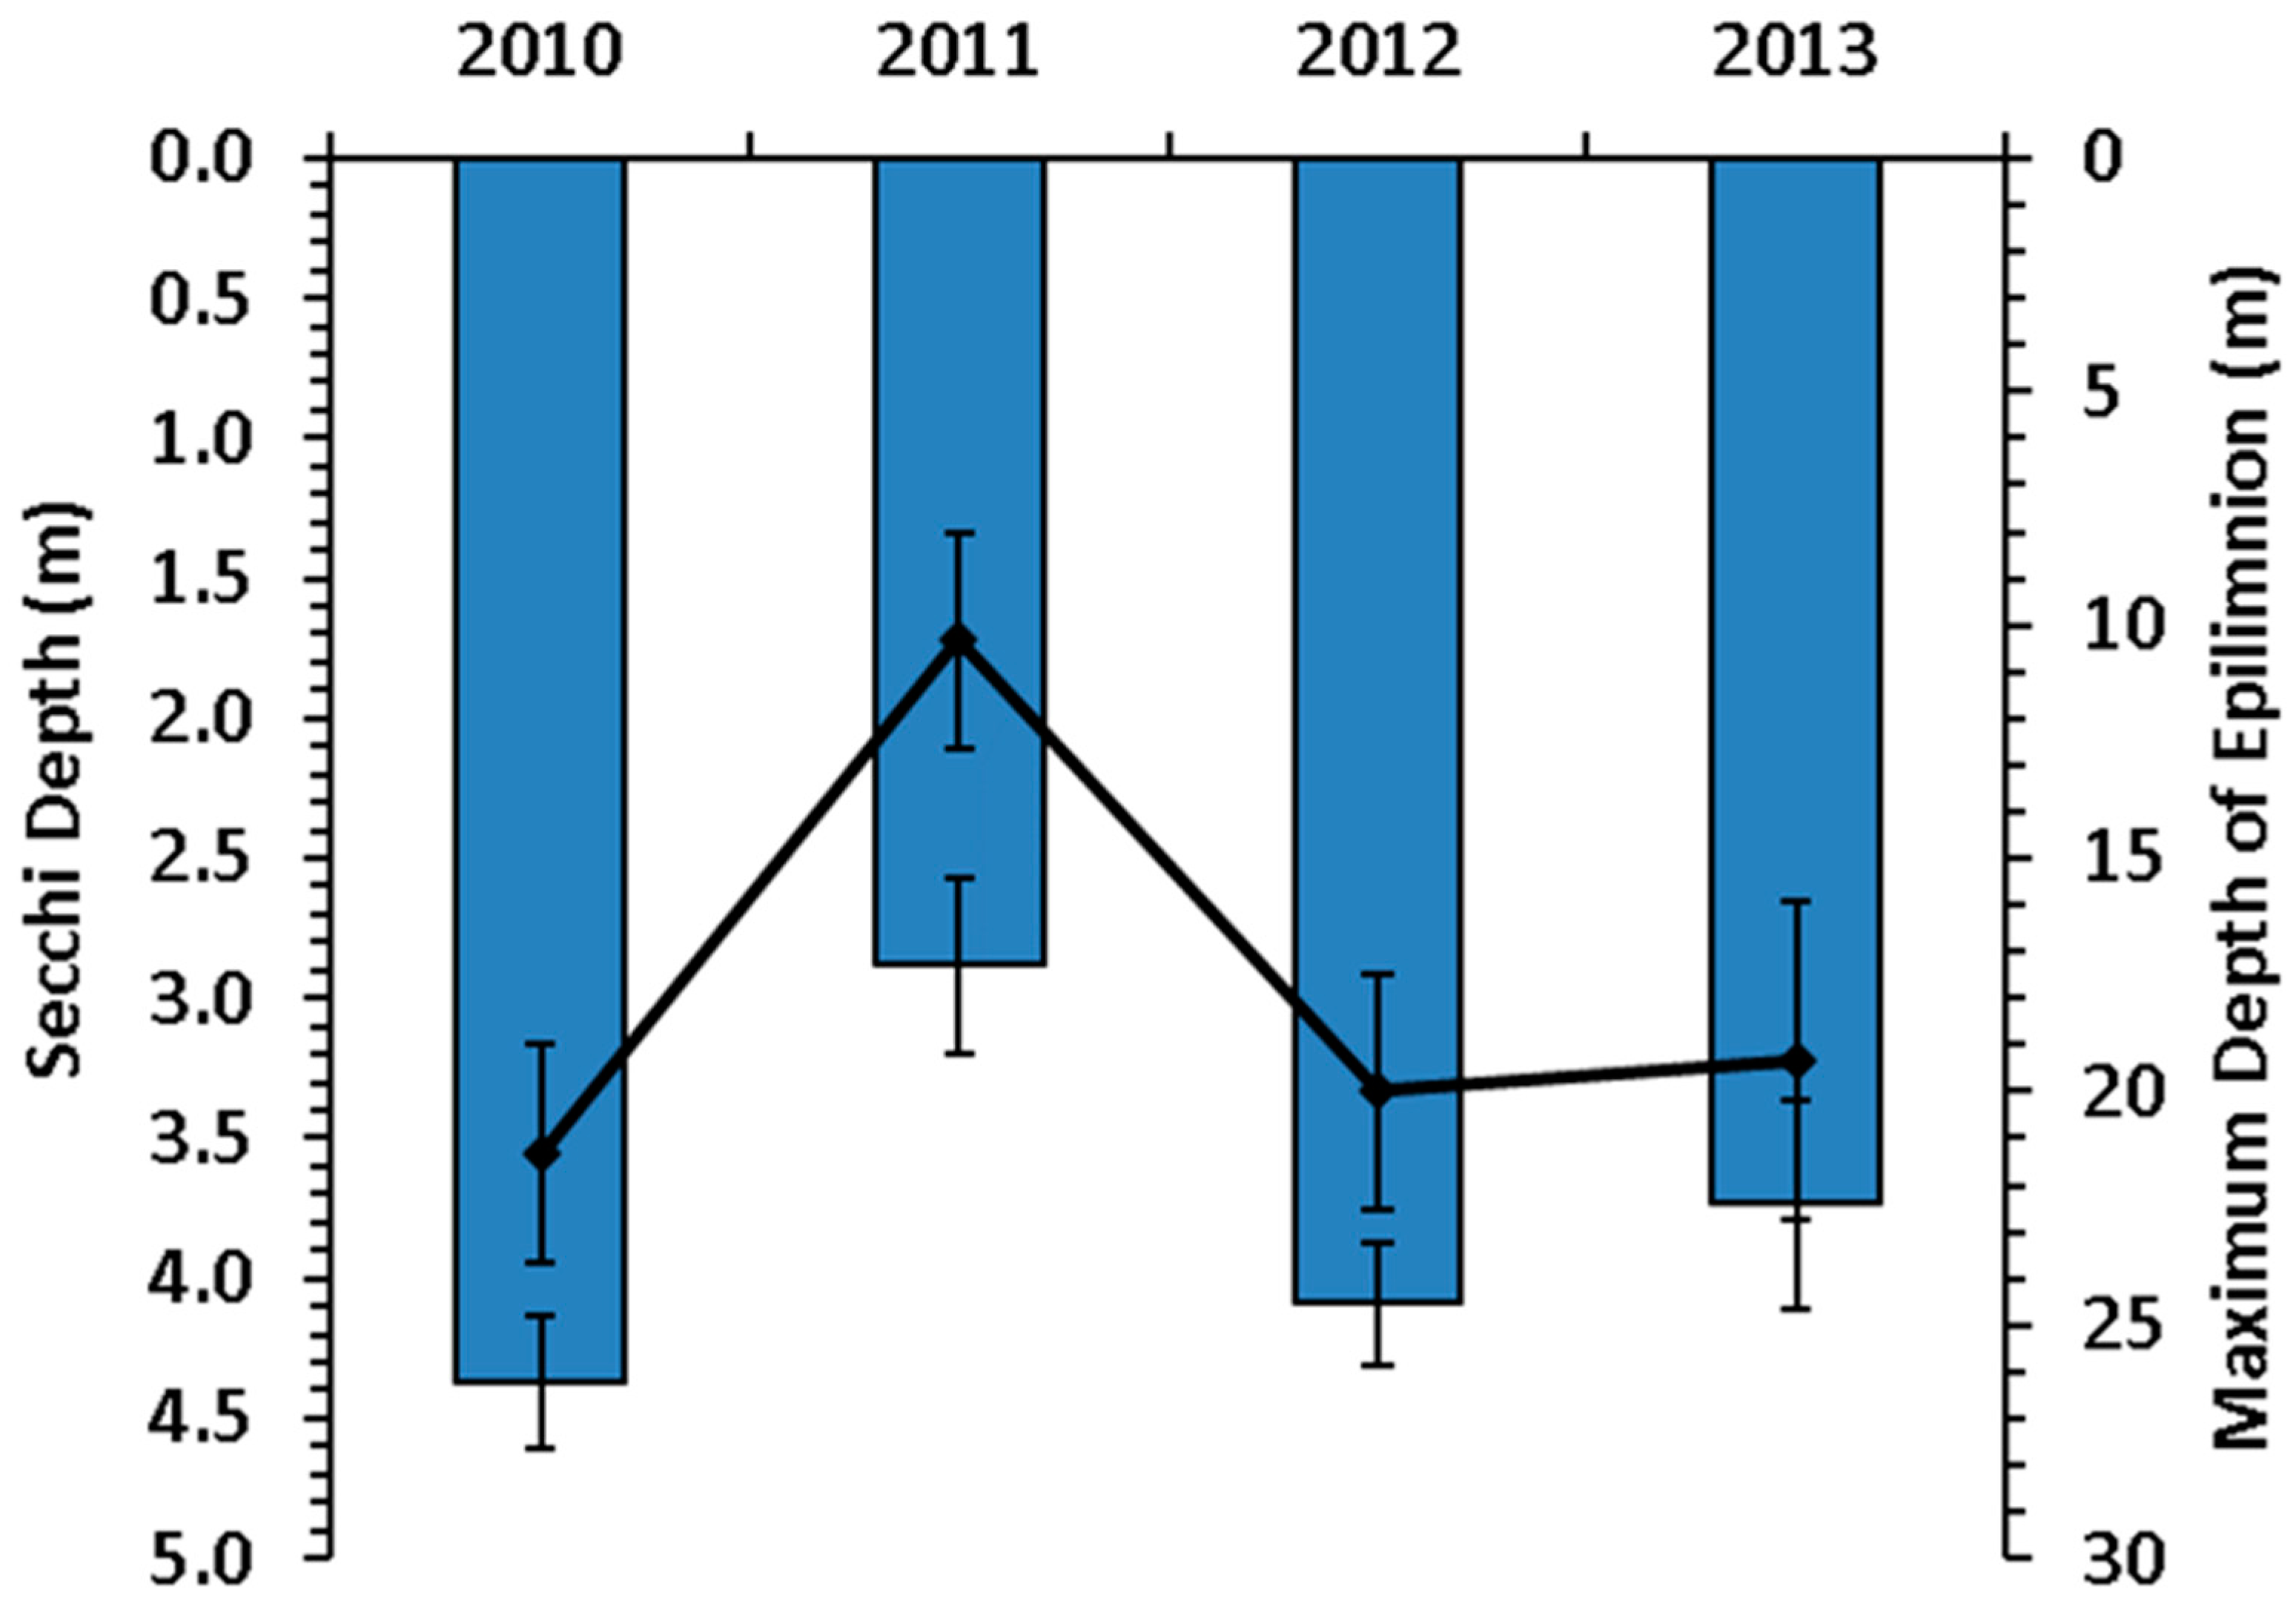
3.1. Secchi and Epilimnion Depth

A nested ANOVA showed that Secchi depth among the three sites was on average shallower in 2011 than in pre- or post-flood years (F = 4.566, p < 0.0001; Figure 3). Patterns in Secchi depth suggest that the 2011 flood year was more turbid than other years. The shallower Secchi depths were accompanied by a trend toward a shallower epilimnion (F = 3.216, p = 0.112). The flooding events of 2011 resulted in reduced epilimnion thickness and a shallower thermocline depth in Lake Champlain during the summer growing season.

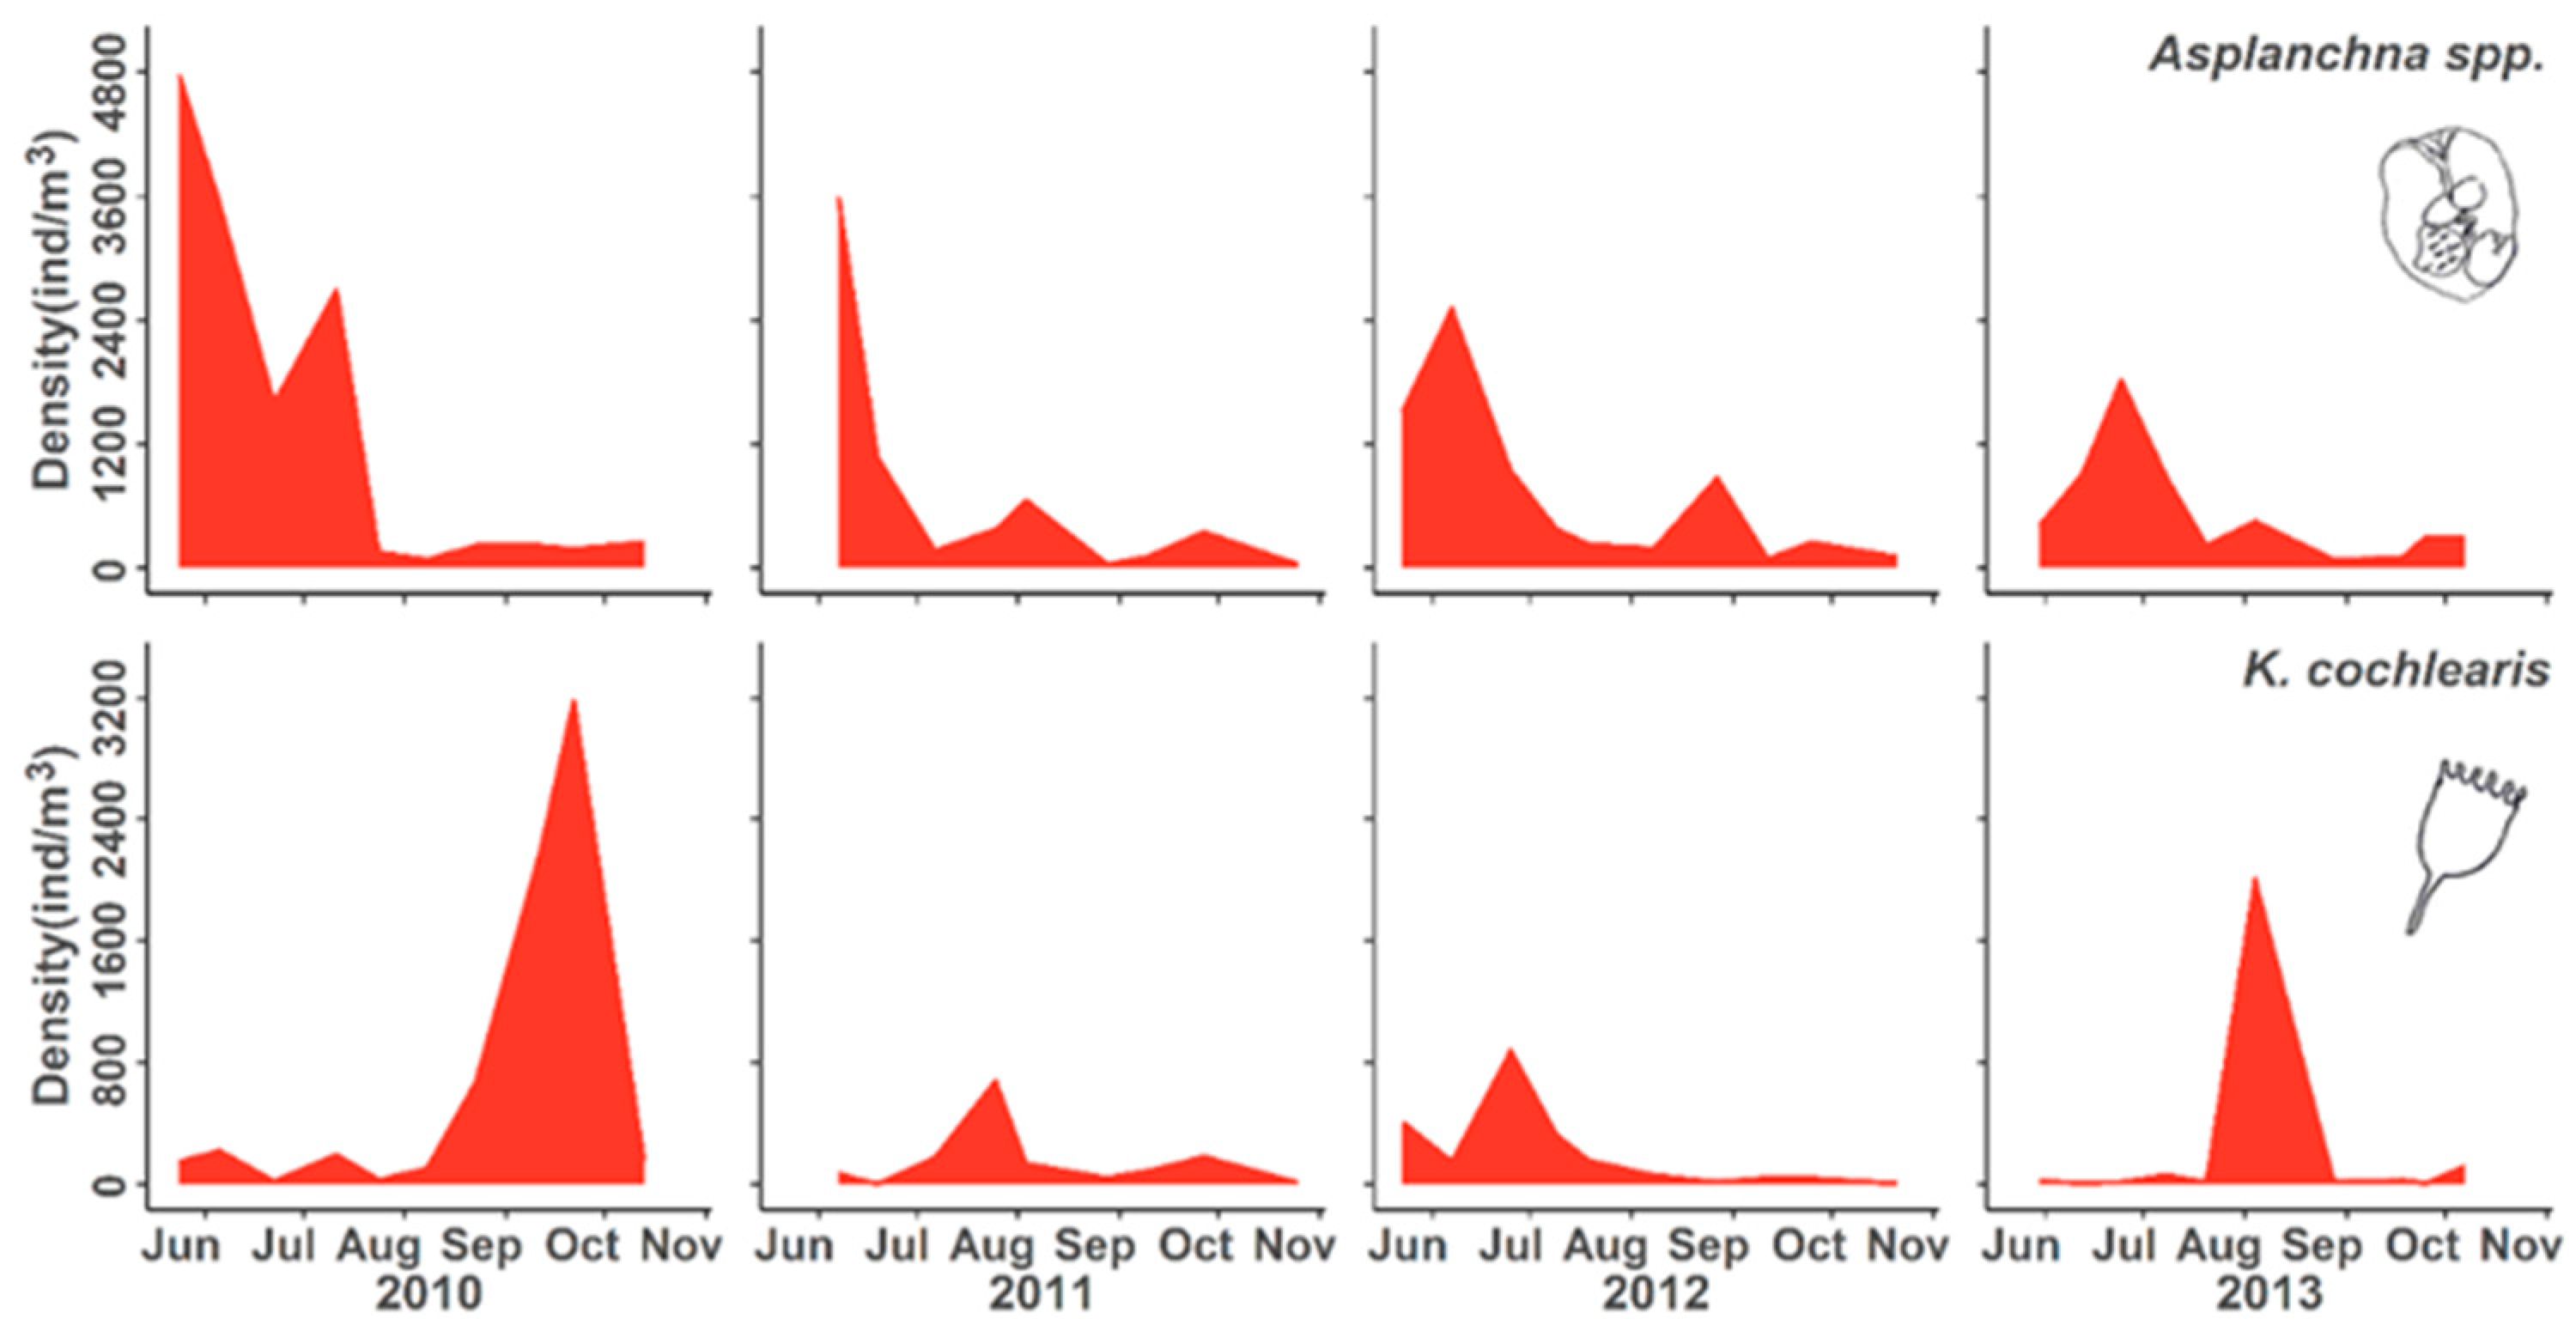
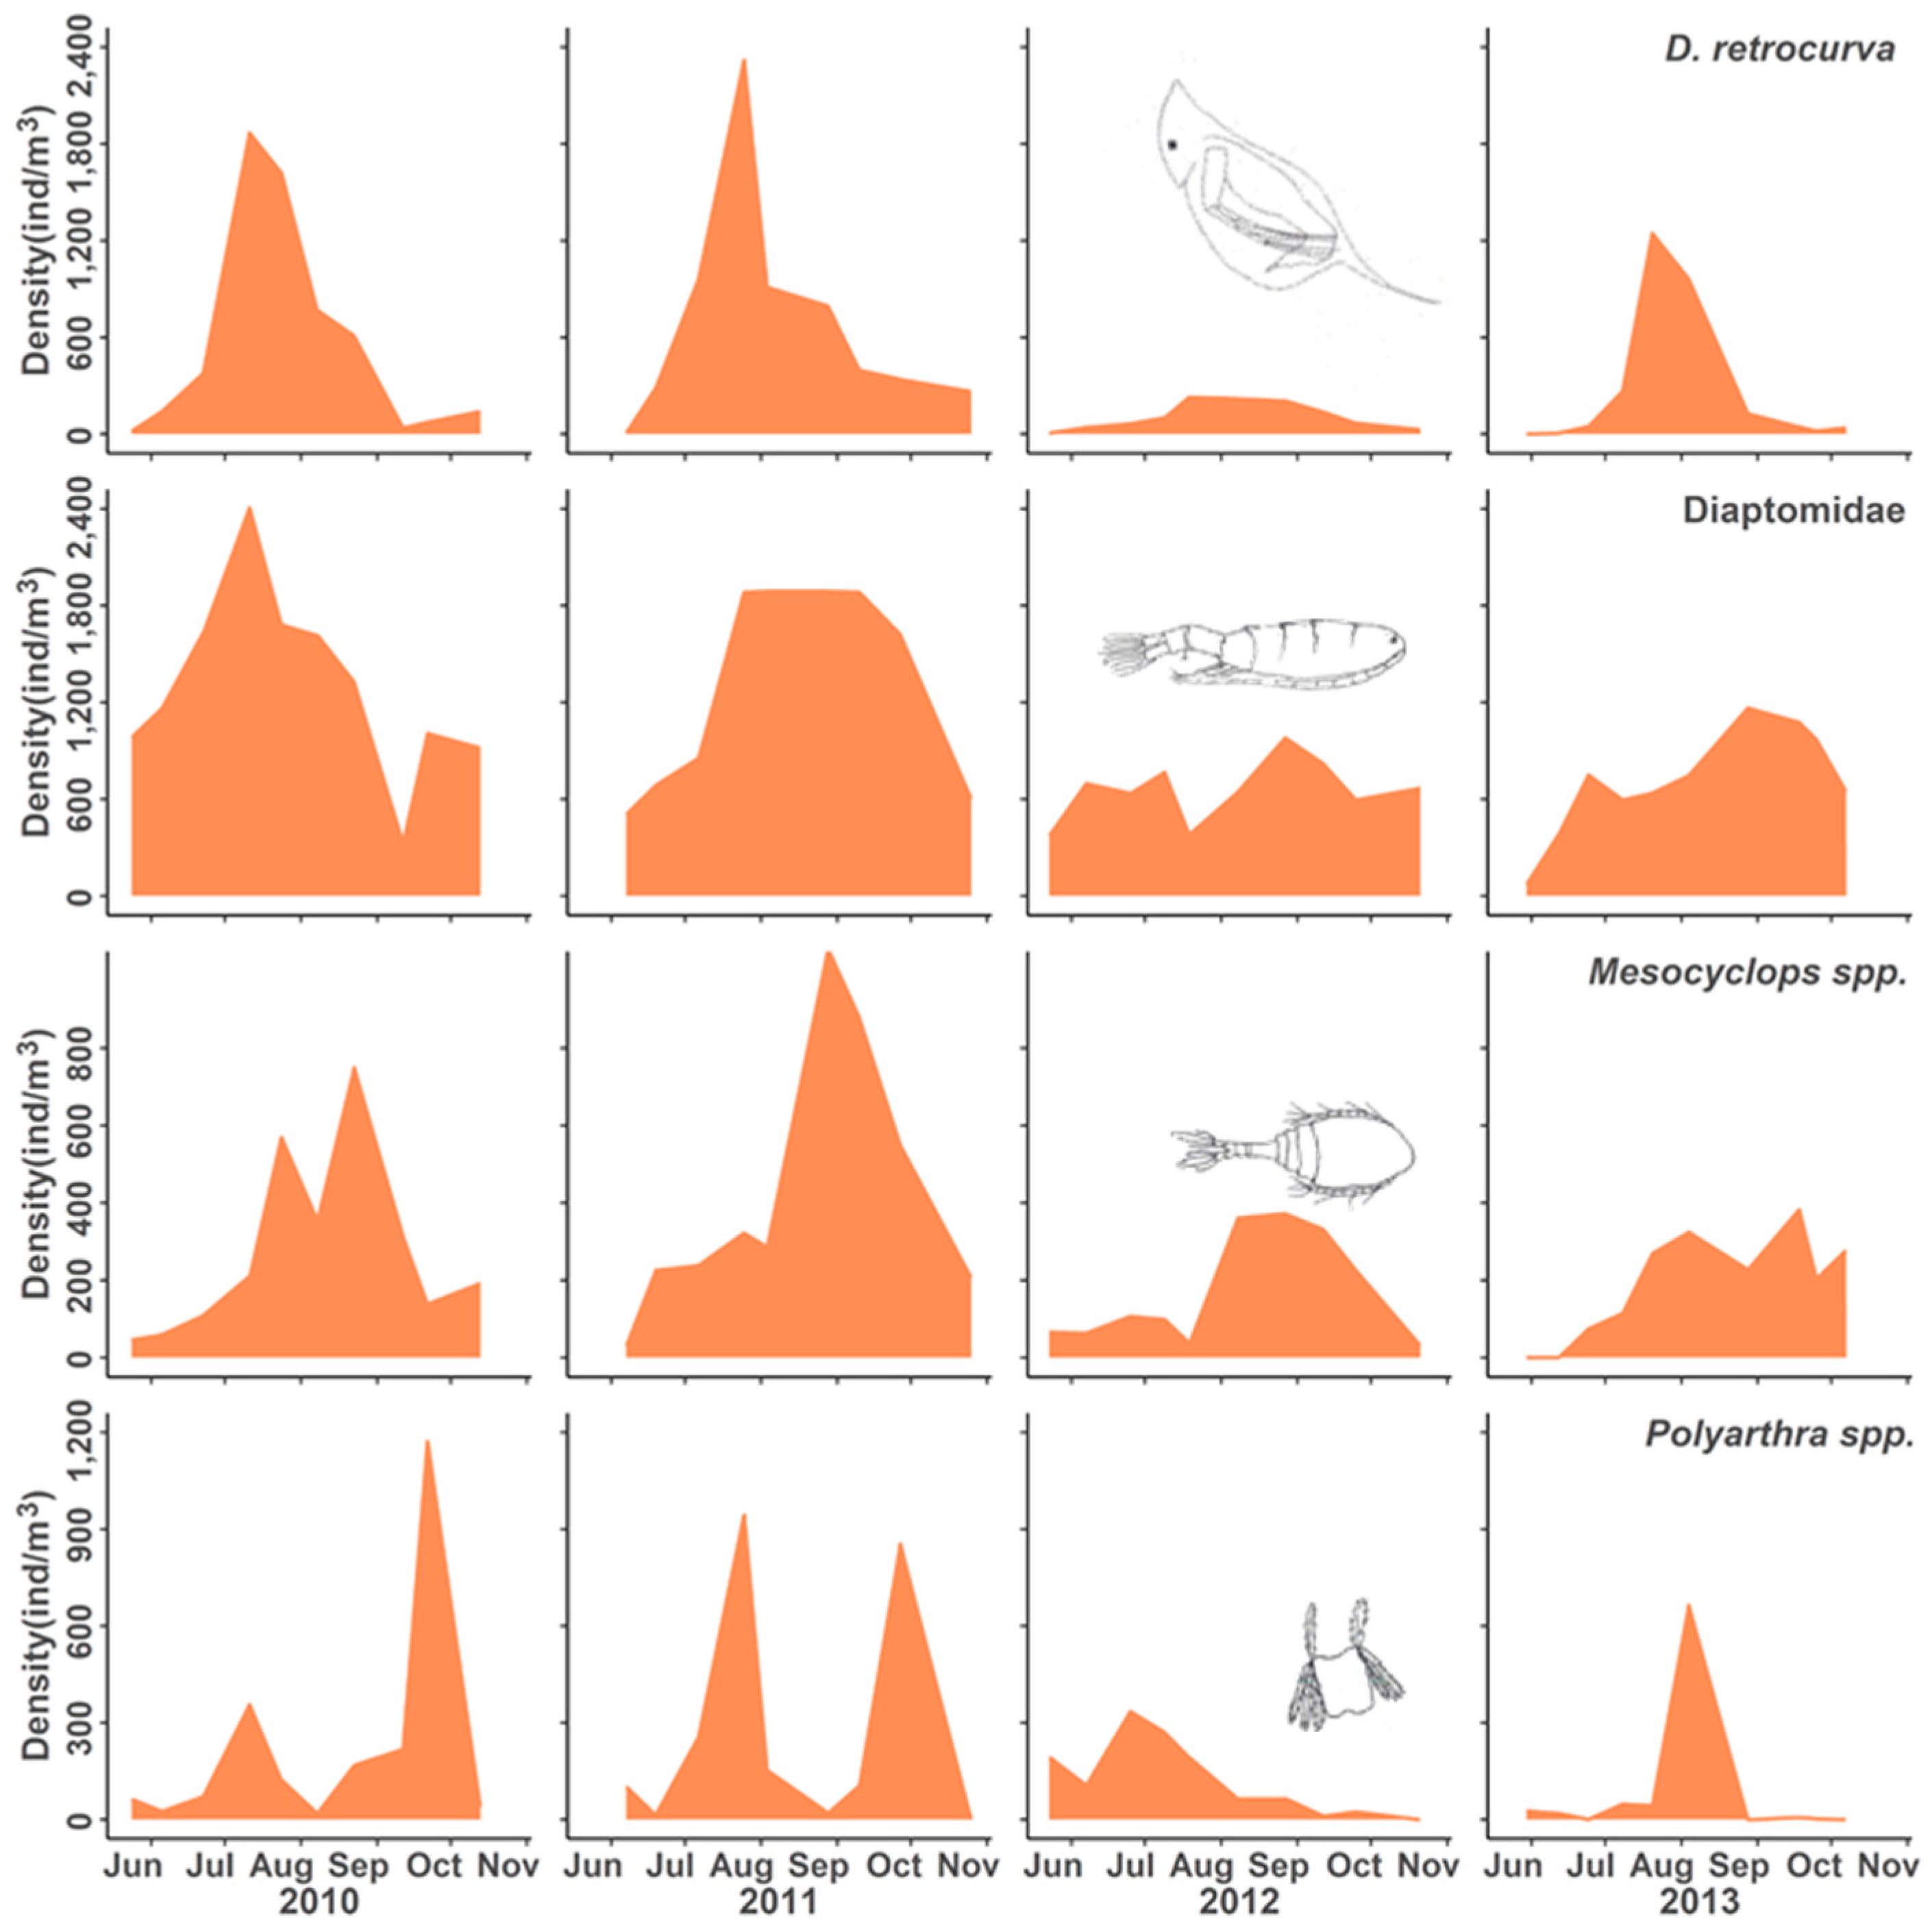
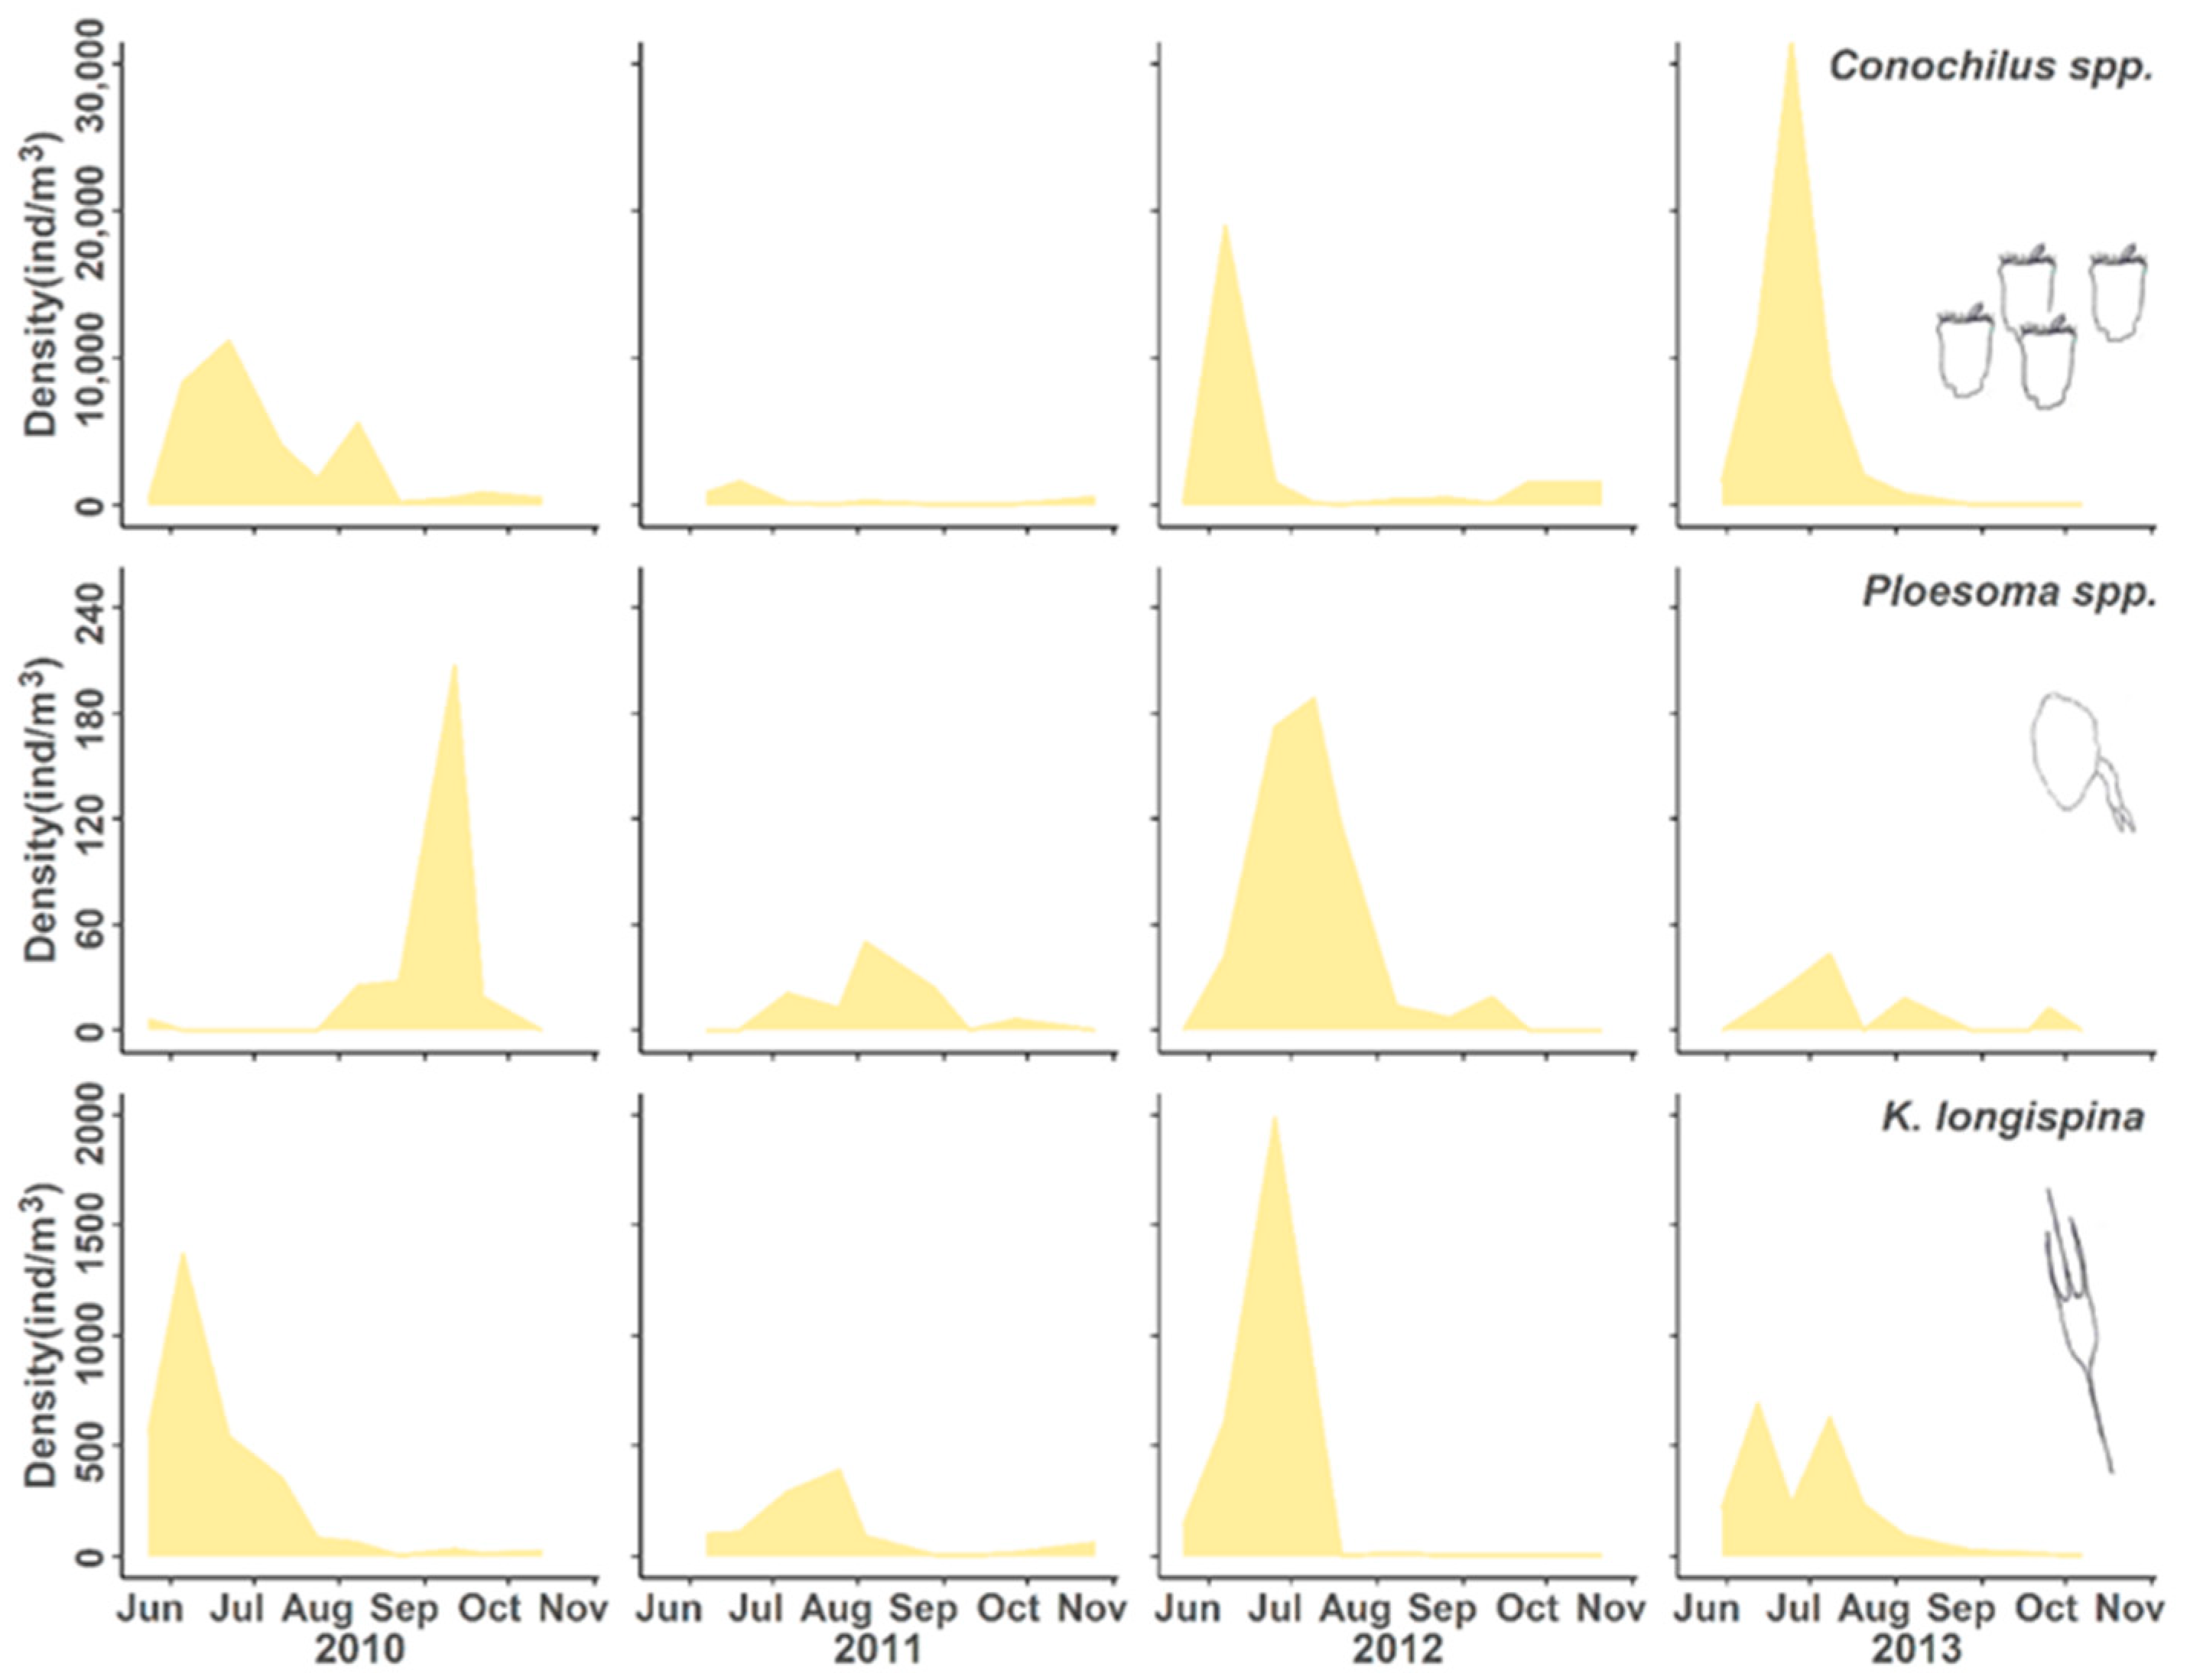
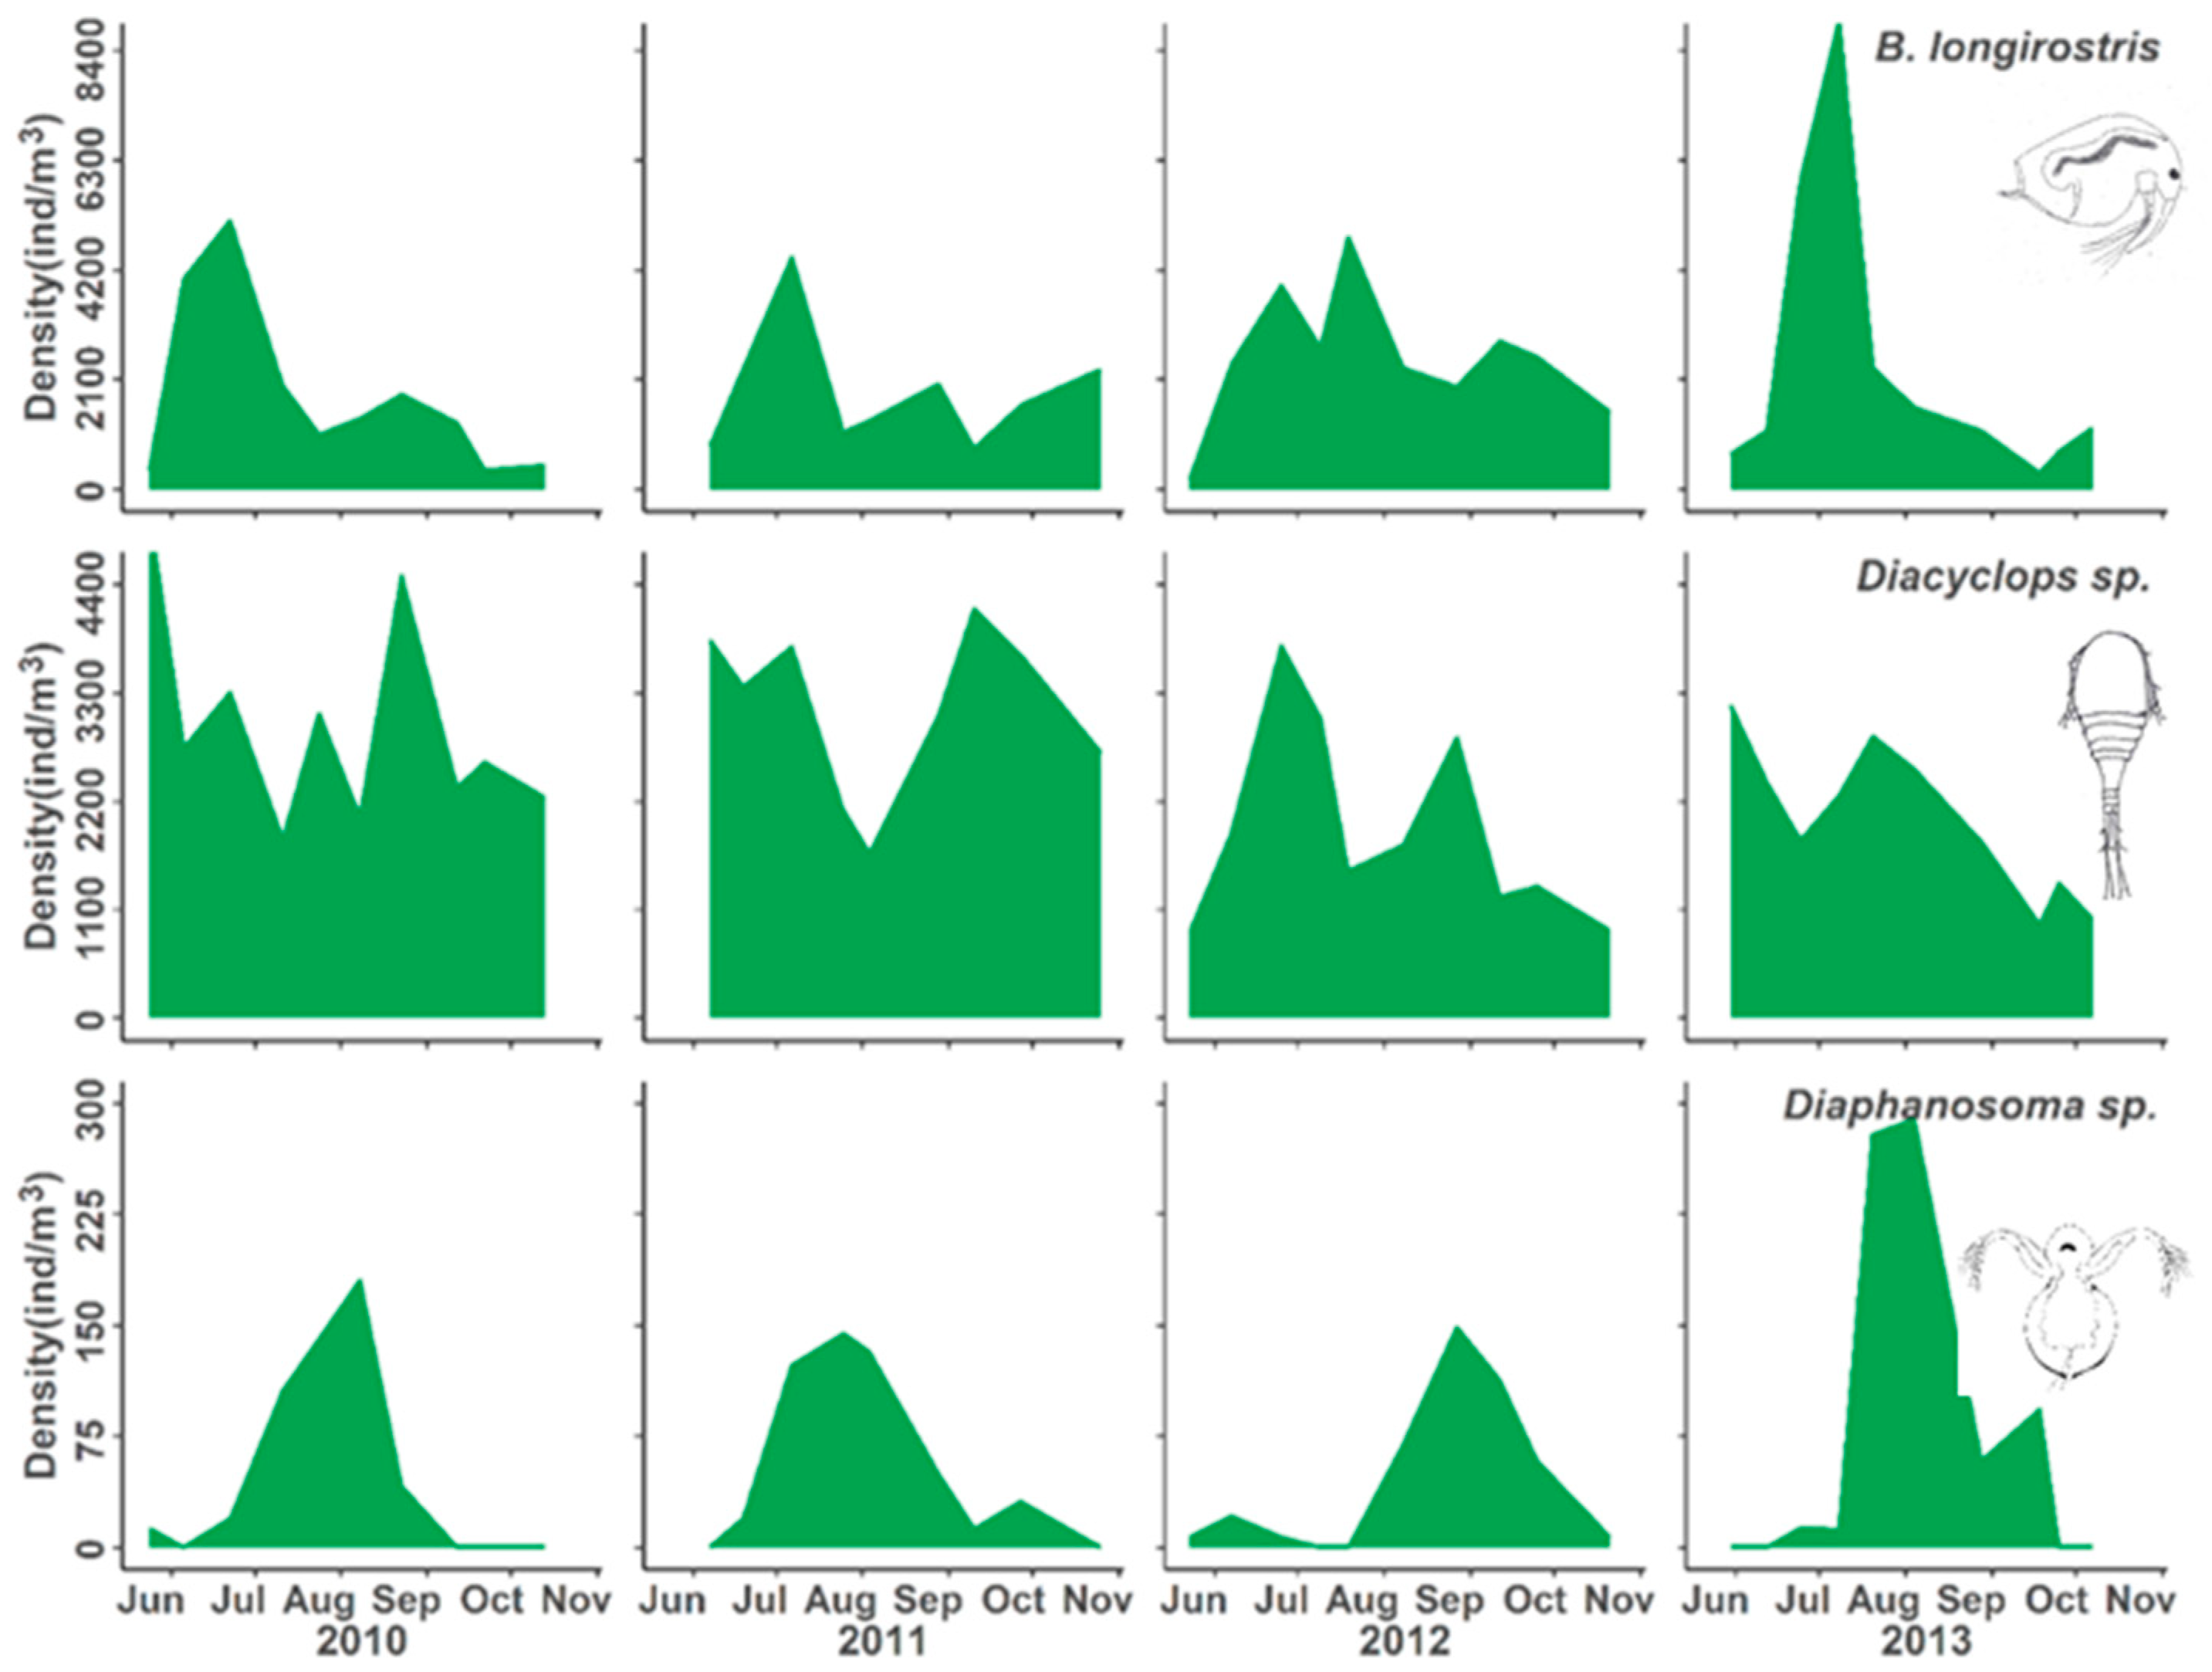
3.2. Population Responses to Flooding

Zooplankton densities fluctuated seasonally in Lake Champlain but can be grouped according to their overall trends across the three years of this study. Individual taxa responded differently within groups; responses were either immediate or delayed, and densities decreased, increased, or were consistent across all three years (Table 2).
One group, characterized by an immediate decline lasting through 2012, was composed completely of rotifers. Asplanchna spp. and Keratella cochlearis maintained spring peak abundance in 2011, prior to major flooding, but had no secondary peak during the flood event (Figure 4). Keratella cochlearis experienced increased early season declines in 2013, but their overall densities increased with their peak abundance shifting to August (Figure 4). In addition to a decline in late season densities during (2011) and after (2012) the flood year, Asplanchna spp. populations were reduced early in the season during both post-flood years (2012, 2013).
Taxa that had a delayed decline in 2012 include the cyclopoid copepod Mesocyclops edax, the cladoceran Daphnia retrocurva, the calanoid copepod family Diaptomidae, and the rotifer genus Polyarthra (Figure 5). Population densities of these groups were similar between 2010 and 2011 but were reduced in 2012. D. retrocurva density decreased on average by 90% between 2011 and 2012, while the copepods had a more modest decline of roughly 50–60%. Population density of D. retrocurva increased in 2013 relative to 2012, while the copepod densities remained similar between the two years after the floods. Polyarthra spp. had two short peak density periods during July and September in 2010 and 2011 reaching between 900 and 1200 ind/m3. In 2012 peak abundance occurred in late June at a 60% decline from previous years (Figure 5).
Several taxa exhibited immediate flood impacts in 2011 followed by immediate recovery in subsequent years. Kellicottia longispina, Ploesoma spp., and Conochilus spp. demonstrated 70–85 percent declines in abundance immediately in 2011 and rebounded to pre-flood densities in 2012 (Figure 6). In 2010, Ploesoma spp. density was most prominent in September. The year of the flood, Ploesoma spp. peak density was in August, and the year after (2012) it shifted earlier to primarily June and July. Kellicottia longispina exhibited a 70 percent decline in peak summer abundance in the 2011 flood year with recovery in 2012 to pre-flood densities. Conochilus densities continued to increase in 2013 as Ploesoma spp. and Kellicottia longispina densities were reduced once again.
Three species responded neutrally to the flood with little to no discernible changes in density. The population densities of the copepod Diacyclops thomasi and the cladocerans Bosmina longirostris and Diaphanosoma spp. remained fairly constant through the pre-flood (2010), flood (2011), and post-flood (2012, 2013) years. Bosmina longirostris densities remained similar in 2010, 2011, and 2012 but exhibited a slight increase in the early/mid-season density peak in 2013 (Figure 7).
Two cladocerans, Eubosmina coregoni and Ceriodaphnia reticulata, and a cyclopoid copepod, Tropocyclops prasinus mexicanus, seemed to exhibit a delayed benefit from the flood event, despite density declines of the latter two species during the flood year; populations increased the year following the flood (2012) to greater densities than observed in pre-flood conditions (Figure 8). Post-flood increases in density also occurred primarily during the late season (August–October) in 2012. Ceriodaphnia reticulata populations increased 15-fold between 2011 and 2012. These delayed population increases were not maintained in 2013 as densities for all taxa returned to pre-flood levels (Figure 8).

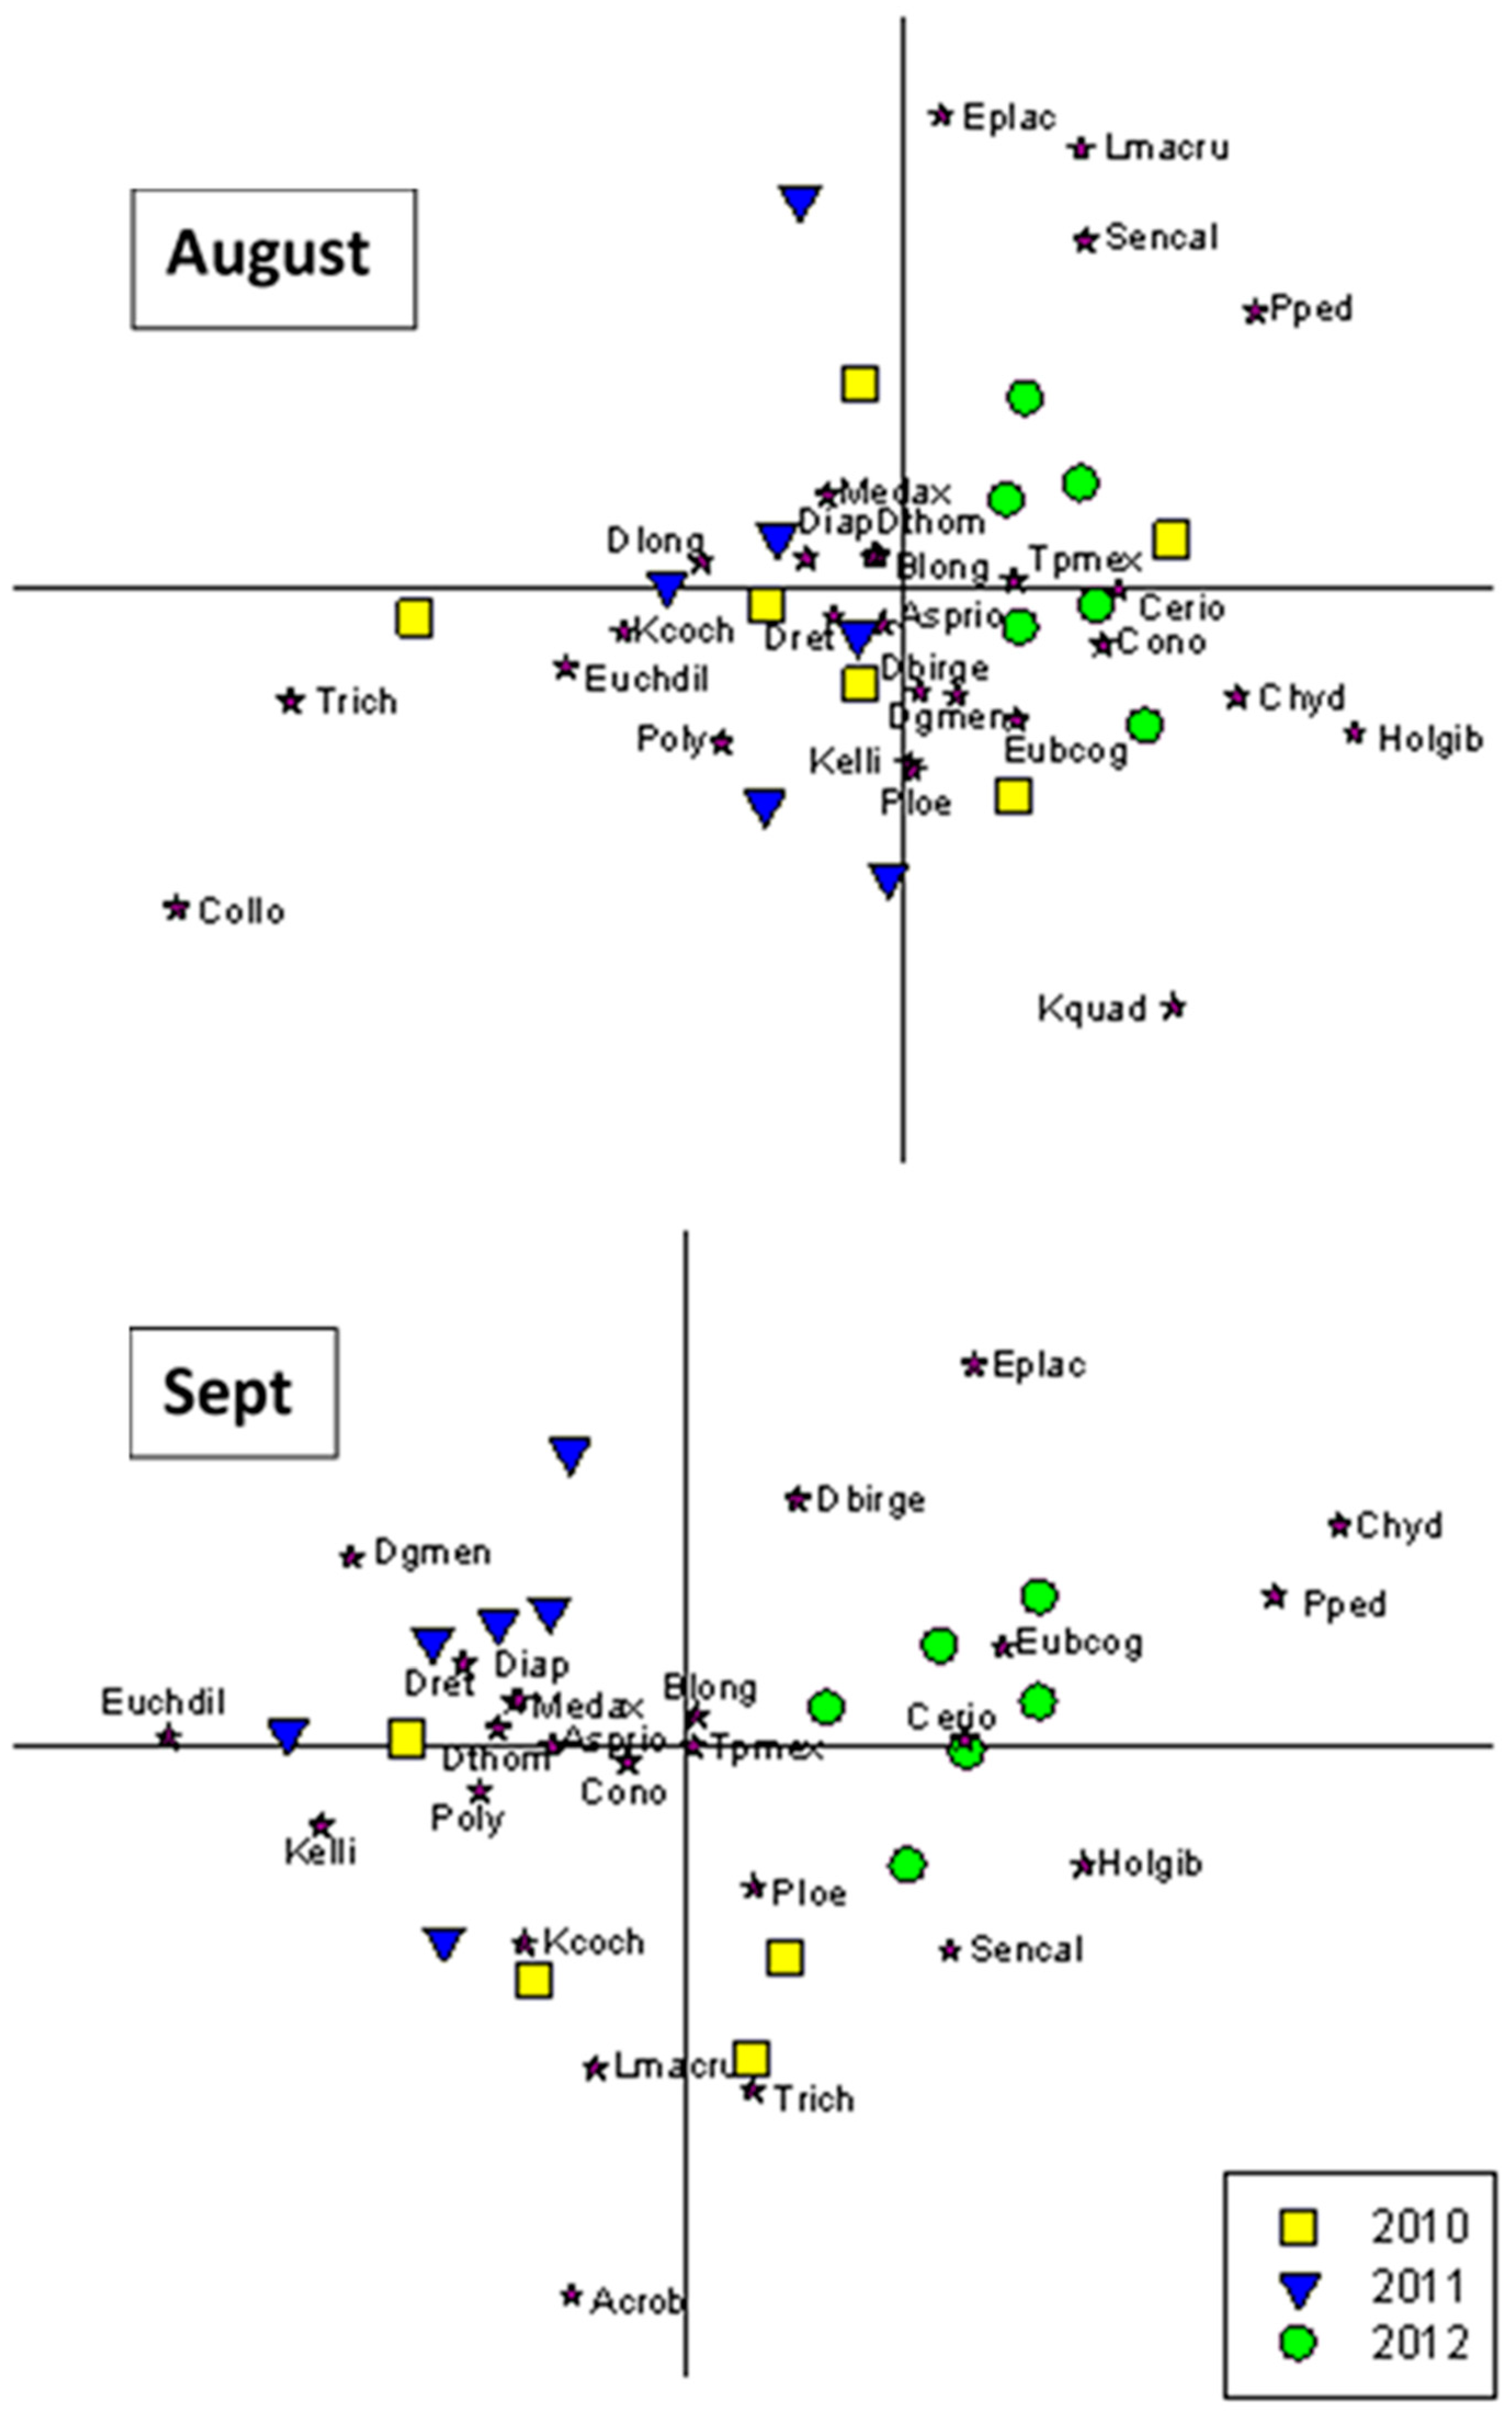
3.3. Community Composition Ordinations

Shifts in community composition as revealed via NMDS were seasonal in nature, with points clustering by month and year (Figure 9 and Figure 10). June and July showed separation among pre-flood, flood, and post-flood years, particularly in 2012 (Figure 9). August showed less separation between pre-flood, flood, and post-flood years while September illustrated more distinct community shifts between years (Figure 10). The family Diaptomidae, along with Mesocyclops edax and members of the genus Daphnia (D. longiremis, D. retrocurva, and D. galeata mendotae) were consistently associated with 2010 and 2011 samples illustrating their low abundance in 2012 following the flood event. Chydorus spp., Ploesoma spp., Senecella calanoides, and Epischura lacustris were most associated with 2012. However, some species shifted associations by month. Keratella spp. and Polyarthra spp. were associated with June 2012 samples only, but in later months were more associated with 2010 and 2011 samples, illustrating a seasonal shift in peak abundance to earlier in the season during the 2012 post-flood year. Holopedium gibberum, Ceriodaphnia, Tropocyclops p. mexicanus, and Eubosmina spp. were associated with 2010 and 2011 in June and July, but increased abundance during 2012 in August and September reflecting a post-flood increase and shift to later season peak abundance.

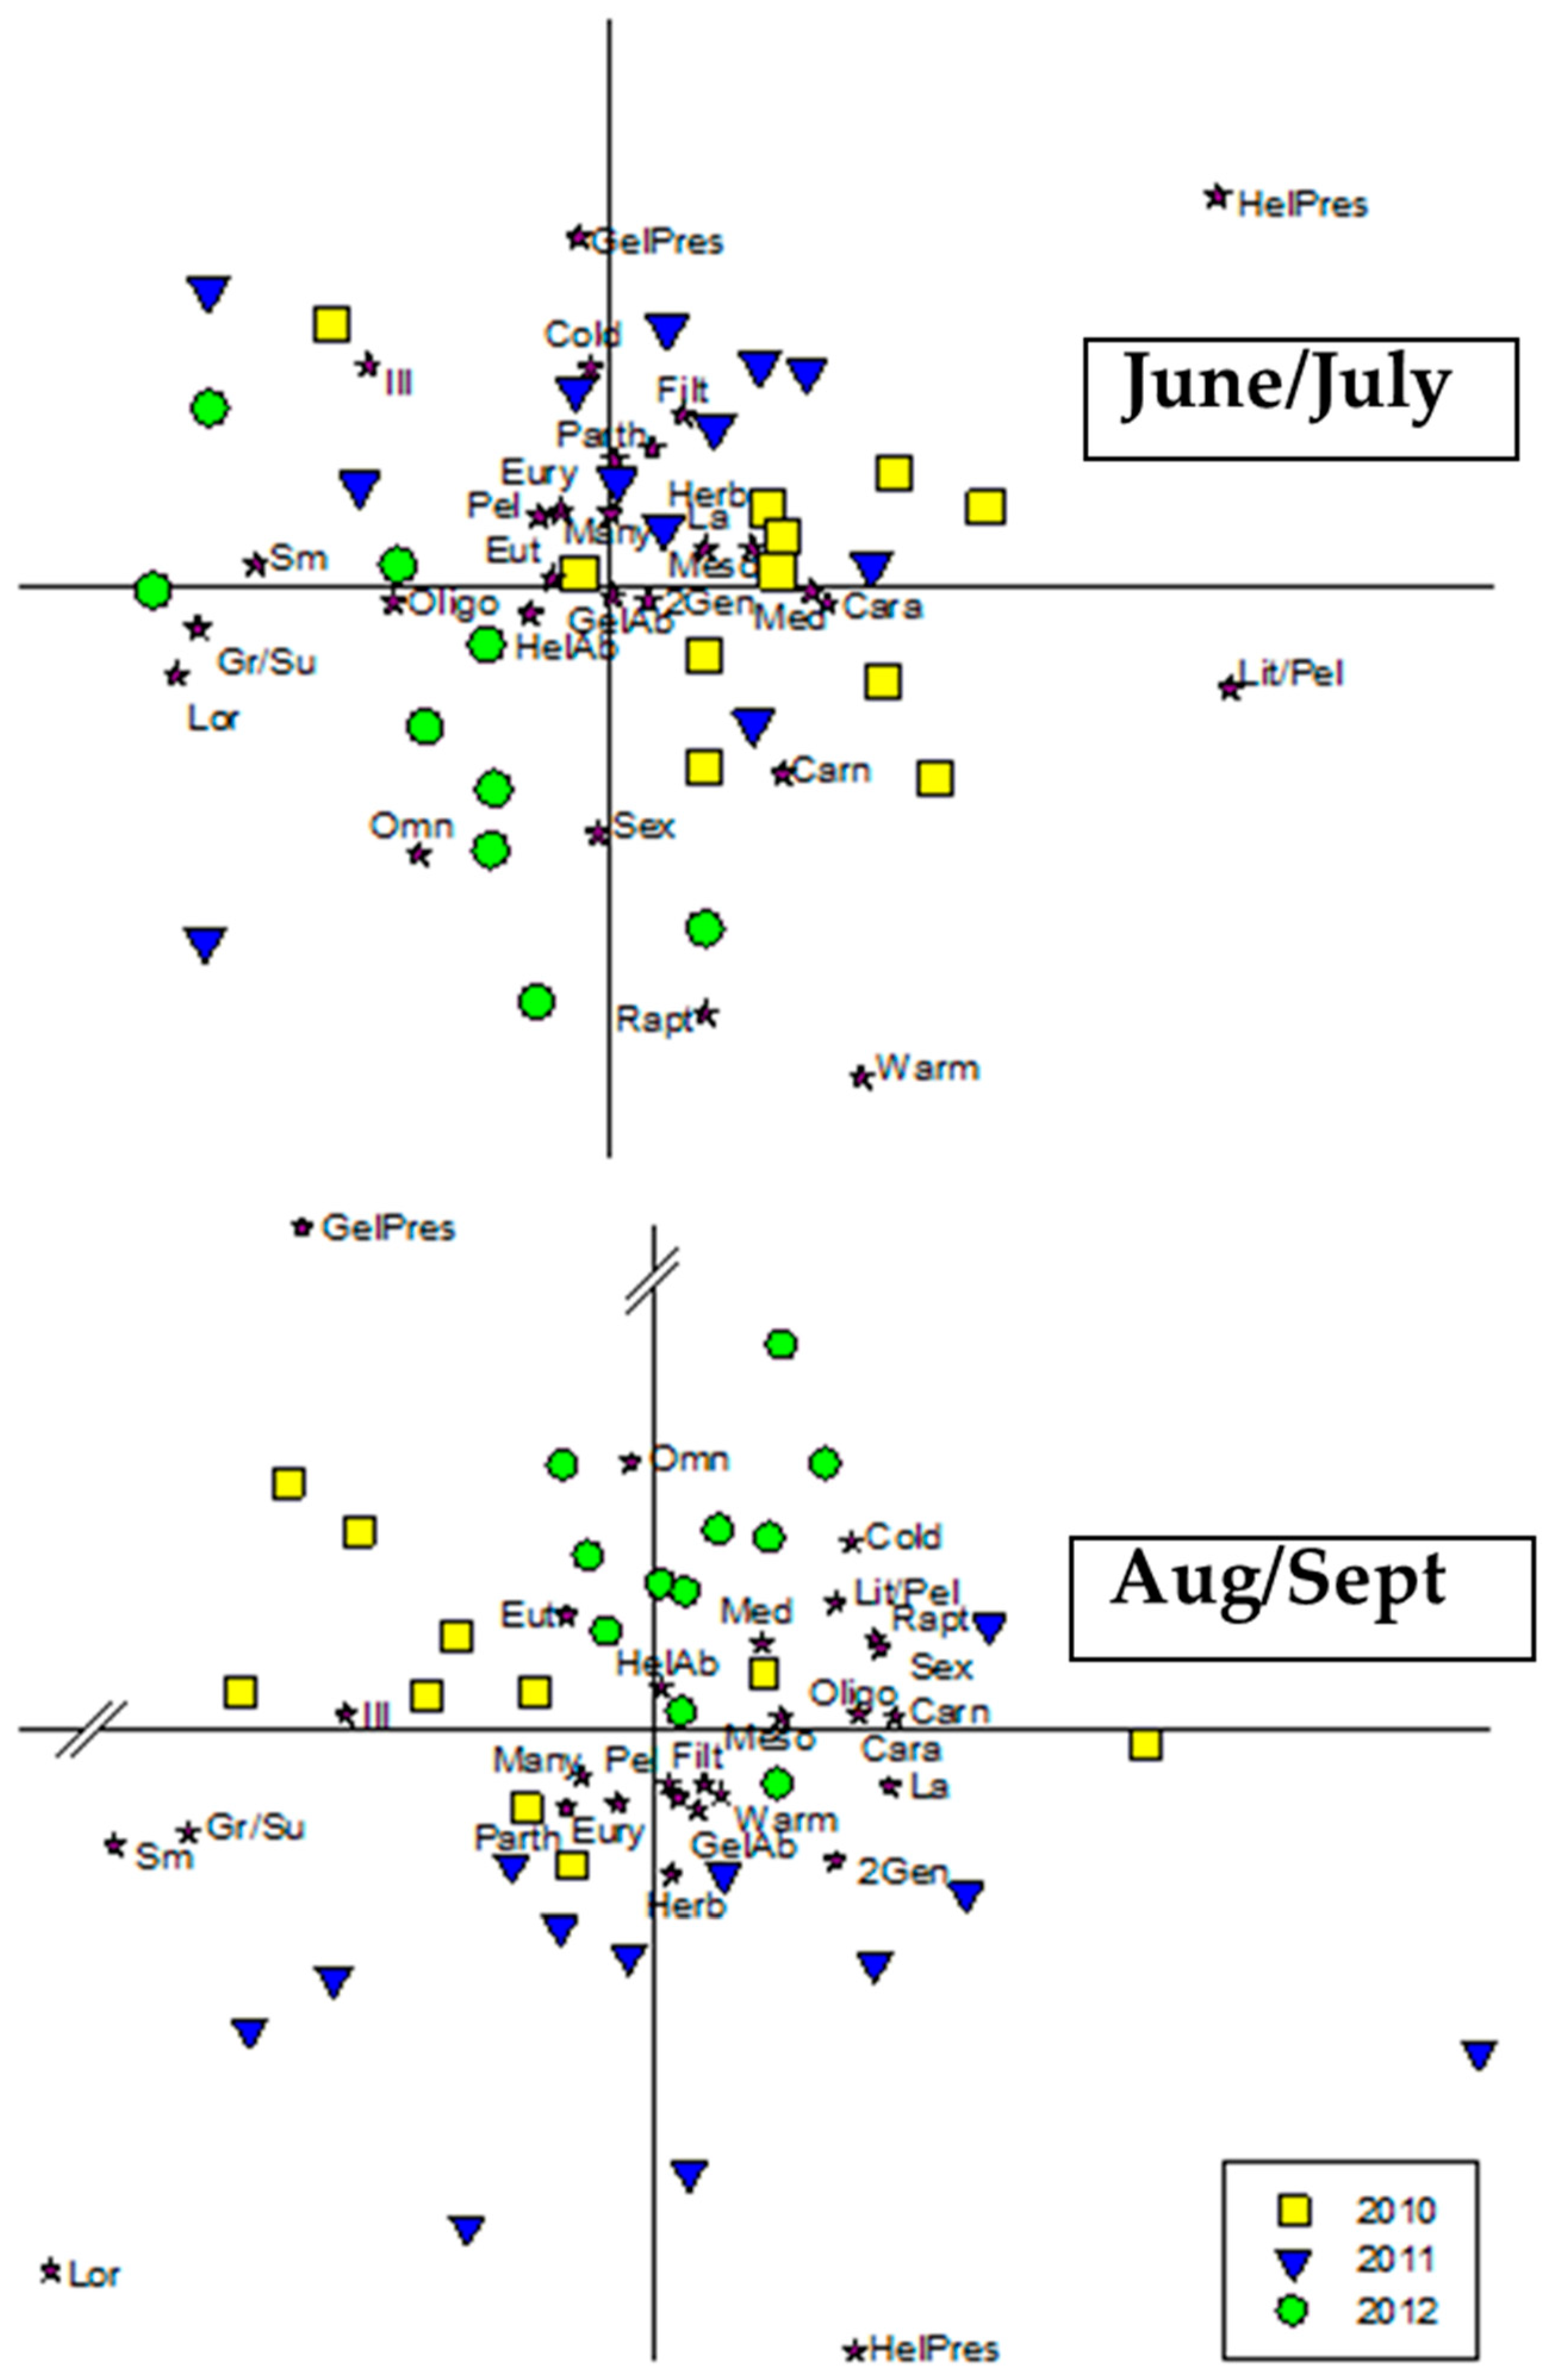
3.4. Ecological Traits

In an analysis of traits, year correlated with an NMDS axis for the June/July subset (Figure 11; p = 0.001; stress = 0.14) and for the August/September subset (Figure 11; p = 0.044; stress = 0.16). A summary of traits and trait states used can be found in Table 3. Traits regarding temperature and trophic preferences were centered and not strongly associated with any particular year. Small body sizes, illoricate (soft) bodies, living in both littoral and pelagic areas, and feeding by grasping or sucking, all traits associated with rotifers, were associated most with 2010 and 2011 samples. Helmet presence, a trait pertaining to the genus Daphnia, decreased in 2011 along with presence of a gelatinous sheath. Zooplankton traits that increased the year following the flood event (2012) included omnivory, sexual reproduction, and raptorial feeding (Figure 11).

4. Discussion

4.1. Population Dynamics

The results of this study suggest that flooding in large lakes may have predictable impacts on zooplankton community structure. Flood responses varied among copepods, cladocerans, and rotifers; therefore, the best categorization in response patterns is in their timing and direction. The floods elicited either an immediate or a delayed response, and either an increase or a decrease in density; in some cases, no response was seen. The timing of responses can likely be attributed to the species’ generation times. Sexually reproducing uni- or bivoltine zooplankton (e.g., Diaptomids and Mesocyclops edax) may take longer to respond to a disturbance than rotifers reproducing parthenogenetically many times a year (e.g., Asplanchna spp. and Conochilus spp.). The direction of responses can be attributed to species autecology, which in turn could alter the zooplankton community structure.

4.2. Negative Responses to Flood Event

Individuals exhibiting an immediate and apparently lasting decrease were the rotifers Asplanchna spp. and Kellicottia cochlearis. Both taxa maintained their early/mid-summer density peaks while losing their mid/late-summer peaks. This suggests that the flooding may have had a negative effect on the later portions of their seasonality. Other work has shown that rotifers and daphnids share the same resources [24] which might explain the lack of a return by K. cochlearis and Asplanchna spp. What remains to be seen, however, is how these species will respond to repeated, more frequent flood events. Rotifers such as Conochilus spp., Ploesoma spp., and K, longispina, which exhibited an immediate decline followed by recovery, can be expected to suffer during future flood events, but rebound shortly after.
Kellicottia longispina’s patterns of spring/early-summer population peaks remained constant across years but was reduced in the 2011 flood year suggesting the floods had a short-term impact on peak density in 2011. Responses of Asplanchna spp. and Polyarthra spp. suggest that individuals with normal mid- to late-summer density peaks were more affected by the flood event than those with spring density peaks.
Taxa that showed a delayed decrease include the cladoceran Daphnia retrocurva, the bivoltine cyclopoid Mesocyclops edax, the Rotifer Polyarthra spp., and the calanoid copepod family Diaptomidae. Given their longer life cycles, a lag time in response is expected for Diaptomids. Calanoid feeding rates can be reduced in high turbidity, leading to lower egg production rates [25] that likely would not be reflected in the population until the following year. The maintained population decreases observed in M. edax and Diaptomids observed in 2013 suggests that population declines associated with floods may extend two or more years for some taxa in temperate stratified lake systems.
Declines in members of the genus Daphnia were not immediate; populations decreased by 80–90% the year following the floods (2012). Previous studies have suggested that Daphnia species do not fare well in turbid conditions [26,27]. Given that Secchi depths at all sites were significantly shallower in 2011, this may explain the crash of the dominant Daphnia in the lake, D. retrocurva, as an increase in sediment turbidity inhibits its ability to feed [1]. Simultaneously, populations of Ceriodaphnia reticulata saw a 15-fold increase. Daphnia and Ceriodaphnia are competitors that exploit similar resources [28], making it likely that the latter was allowed to flourish once released from competition with the former. Due to their larger size, Daphnia are more efficient filter-feeders than Ceriodaphnia and are likely the dominant competitors under normal conditions [29]. The competitive release was short lived as D. retrocurva populations recovered in 2013 while Ceriodaphnia populations returned to lower abundance levels similar to those observed in 2010.

4.3. Positive Responses to the Flood Event

Few zooplankton populations increased during the 2011 flood year. Populations of Eubosmina coregoni, Ceriodaphnia reticulata, and Tropocyclops prasinus mexicanus, however, increased in the first post-flood year (2012). These species likely increased in abundance due to competitive release associated with Daphnia population declines. Eubosmina coregoni may possess traits which aid in survival in turbid conditions, as the species showed minimal population declines during the 2011 flood year, while shifting their peak density slightly later in the season.

4.4. Neutral Responses to the Flood Event

A handful of taxa, Diacyclops thomasi, Diaphanosoma spp., and Bosmina longirostris, showed no obvious response in their densities and appeared largely unaffected by the floods. These results suggest that these three species may be well adapted to flood events and are likely to maintain stable populations in future flood years. Diacyclops thomasi has long been the dominant copepod in Lake Champlain [10,11,30]. Bosmina longirostris likely fared well due to its filtration mechanism which allows it to feed more selectively than Daphnia [31], reducing the inhibitory effects of suspended solids on their feeding efficiency. Past work has shown that Diaphanosoma are more tolerant of turbidity than other cladocerans and may even increase their population density in turbid conditions [2,32].

4.5. Shifts in Community Composition

The 2011 Lake Champlain floods resulted in variable shifts in zooplankton community composition. We observed an overall decrease in density during and after the flood similar to previous studies in other systems [4]. Overall, copepod densities decreased the year following the flood, likely because of their comparatively long life cycles. Tropocyclops prasinus mexicanus densities increased, Diacyclops thomasi densities stayed the same, while Mesocyclops edax and diaptomid calanoid densities decreased. Cladoceran densities increased overall, largely a product of Ceriodaphnia populations increasing during Daphnia declines, with Bosmina longirostris populations remaining consistent. No rotifers increased during the flood; after several species declined, only populations of Conochilus spp., Ploesoma spp., and K. longispina showed recovery the year following the floods.

4.6. Ecological Traits

Data from traits analysis further support population-level dynamics discussed above. No rotifer species favored flood conditions, which is manifested in the association of rotifer traits with 2010 and 2011. Temperature (“warm”, “eury”, and “cold”) and trophic (“oligo”, “meso”, and “eu”) traits were similarly associated in the ordinations, suggesting that the flooding did not result in major changes in temperature or water quality conditions. The lack of a response from the oligotrophic, cold stenotherm Notholca laurentiae corroborates this. In each ordination, having a helmet (a Daphnia trait) decreased in 2012, which agrees with the observed population-level collapse of Daphnia retrocurva; this is expected as presence of a helmet is associated with a taxon (Daphnia spp.) known to not tolerate turbid conditions [3,26].
Based on the results from this study, we suggest a new suite of traits regarding species’ ability to withstand floods (Table 4). Those decreasing during or in the aftermath of the flooding can be considered “flood intolerant.” Those not responding are “flood tolerant,” and those increasing “flood adapted”. Findings from Threlkeld [3] also suggest that flood tolerance varies by species in reservoirs.

4.7. Ecological Comparison with Other Lakes

The bulk of studies related to the effects of flooding are limited to floodplain lakes and impoundments, producing several confounding factors that would not be present if this study occurred in a natural deep lake [33,34,35,36]. Flooding in floodplain lakes causes increased interconnectivity with the river system, altering abiotic conditions associated with their shoreline and littoral zones [33,34]. Floodplain lakes are often in subtropical regions where periods of interconnectivity with surrounding waterbodies is historically frequent [33,35] and are far shallower than Lake Champlain. It is due to these many ecological differences between a temperate stratified lake system, such as Lake Champlain, and other studies of community structure in flood periods in systems such as floodplain lakes or impoundments that caution is advised when comparing this study to others.

5. Conclusions

This study has provided valuable insight into zooplankton community responses to a flood in a large northern temperate lake. Overall zooplankton densities decreased during flooding; response time was likely a product of life cycle length, and response direction was a result of each species’ autecology. Turbidity associated with the flood event likely resulted in the delayed decline in the genus Daphnia, which released Ceriodaphnia from competition and allowed it to flourish in 2012. Taxa either showed a flood-adapted response (Ceriodaphnia reticulata and Eubosmina coregoni), a flood-intolerant response (Asplanchna spp. and Keratella cochlearis) or flood intolerance with a delay or fast recovery (Table 4). These results are also reflected in patterns in species traits. This study provides useful information on flood responses among zooplankton in large lakes in addition to previous work on reservoirs, rivers, and estuaries. Large, temperate lakes such as Lake Champlain are likely to exhibit similar zooplankton responses observed herein under future climate change scenarios where extreme flood events are predicted to increase in frequency and intensity.

Author Contributions

Conceptualization, T.M. and E.H.-P.; Data curation, T.M., E.H.-P. and Z.C.; Formal analysis, T.M., E.H.-P., M.A. and Z.C.; Funding acquisition, T.M.; Investigation, T.M. and E.H.-P.; Methodology, T.M. and L.M.; Project administration, T.M.; Resources, T.M.; Supervision, T.M.; Validation, T.M.; Visualization, T.M., E.H.-P., M.A. and Z.C.; Writing—original draft, T.M. and E.H.-P.; Writing—review and editing, T.M., M.A., Z.C. and L.M. All authors have read and agreed to the published version of the manuscript.

Funding

The data used in this research were collected and funded by the Lake Champlain Basin Program Long-Term Monitoring program.

Data Availability Statement

Data for this study are available from the Lake Champlain Long-term Monitoring program upon request.

Acknowledgments

We thank all of the LCRI staff and students who contributed to field sampling or laboratory analysis of zooplankton samples.

Conflicts of Interest

The authors declare no conflicts of interest.

Appendix A. Tables of Abbreviations

Table A1. Abbreviations for species in density ordinations.
AbbreviationMeaning
AcrobAcanthocyclops robustus
AscAscomorpha spp.
AsprioAsplanchna spp.
BcalyBrachionus calyciflorus
BlongBosmina longirostris
CerioCeriodaphnia reticulata
ChydChydorus sphaericus
ColloCollotheca spp.
ConoConochilus spp. unicornis
DbirgeDiaphanosoma birgei
DgmenDaphnia galeata mendotae
DiapDiaptomidae
DlongDaphnia longiremis
DretDaphnia retrocurva
DthomDiacyclops thomasi
EplacEpischura lacustris
ErgErgasilus spp.
EubcogEubsomina coregoni
EuchdilEuchlanis dilatata
FilFilinia terminalis
HolgibHolopedium gibberum
KcochKeratella cochlearis
KelliKellicottia longispina
KquadKeratella quadrata
LecLecane spp.
LmacruLimnocalanus macrurus
MedaxMesocyclops edax
MonMonostyla spp.
NlaurNotholca laurentiae
PloePloesoma spp.
PolyPolyarthra spp.
PpedPolyphemus pediculus
SencalSenecella calanoides
SynchSynchaeta spp.
TpmexTropocyclops prasinus mexicanus
TrichTrichocerca spp.
Table A2. Abbreviations of traits from trait ordinations.
AbbreviationMeaning
HerbPrimary consumer (herbivore, bacteriovore)
OmnOmnivore
CarnCarnivore
FiltFilter feeding
GrSuGrasping/sucking
RaptRaptorial feeding
LitLittoral
LitPelLittoral or pelagic
PelPelagic
ColdCold
EuryEurytherm
WarmWarm
OligoOligotrophic
MesoMesotrophic
EutEutrophic
1Gen1 Generation per year
2Gen2 Generations per year
ManyMultiple generations per year
SexSexual reproduction (exclusive)
ParthParthenogenetic reproduction
IllIlloricate
LorLoricate
CarWith carapace
GelAbGelatinous sheath absent
GelPresGelatinous sheath present
SmSmall (<0.5 mm)
MedMedium (0.5–1.0 mm)
LaLarge (>1.0 mm)
HelAbHelmet absent
HelPresHelmet present

Appendix B. Species Traits Summary Tables

Table A3. Cladoceran trait matrix. Sources are listed in the references [36,37,38,39,40,41,42,43,44,45,46,47,48,49,50,51,52,53,54,55,56].
SpeciesTrophic GroupFeeding ModeHabitatThermalLake ProductivityGenerations
Per Year
ReproductionArmorGelatinous SheathSize BinHelmet
Bosmina longirostrisherbivore (37)filtration (37)pelagic (37)cold-adapted eurytherm (13)meso-eutrophic (37)multi (13)parthenogenetic (13)carapace (13)absent (13)0.5–1 mmno (37)
Eubosmina coregoniherbivore (37)filtration (37)pelagic (37)warm-adapted eurytherm (13)mesotrophic (13)multi (13)parthenogenetic (13)carapace (13)absent (13)0.5–1 mmno (37)
Ceriodaphnia reticulataherbivore (37)filtration (37)both (51)warm-adapted eurytherm (13)meso-eutrophic (56)multi (13)parthenogenetic (13)carapace (13)absent (13)0.5–1 mmno (37
Daphnia longiremisherbivore (13)filtration (37)both (13)cold stenotherm (13,48,49)oligo-mesotrophic (13,55)multi (13)parthenogenetic (13)carapace (13)absent (13)0.5–1 mmyes (37)
Daphnia galeata mendotaeherbivore (37)filtration (37)pelagic (37)warm-adapted eurytherm (13)oligo-mesotrophic (13)multi (13)parthenogenetic (13)carapace (13)absent (13)>1 mmyes (37)
Daphnia retrocurvaherbivore (37)filtration (37)pelagic (37)warm-adapted eurytherm (13)mesotrophic (13)multi (13)parthenogenetic (13)carapace (13)absent (13)>1 mmyes (37)
Chydorus sphaericusherbivore (37)filtration (37)littoral (37)Warmeutrophic (55)multi (13)parthenogenetic (13)carapace (13)absent (13)<0.5 mmno (37)
Diaphanosoma birgeiherbivore (37)filtration (37)pelagic (13)warm-adapted eurytherm (13)mesotrophic (13)multi (13)parthenogenetic (13)carapace (13)absent (13)>1 mmno (37)
Holopedium gibberumomnivore (13)filtration (37)pelagic (37)cold (13)oligo-mesotrophic (13)multi (13)parthenogenetic (13)carapace (13)present (13)>1 mmno (37)
Polyphemus pediculuscarnivore (37)raptorial (37)both (13,51)warm-adapted eurytherm (13)mesotrophictwo (13)parthenogenetic (13)reduced carapace (13)absent (13)>1 mmno (37)
Table A4. Copepod trait matrix. Sources are listed in the references [36,37,38,39,40,41,42,43,44,45,46,47,48,49,50,51,52,53,54,55,56].
SpeciesTrophic GroupFeedingHabitatThermalLake ProductivityGenerations Per YearReproductionArmorGelatinous SheathSizeHelmet
Diacyclops thomasi
Cyclopoid
Omnivore-carnivore (37)raptorial (37)pelagic (13)eurytherm (13)mesotrophic (13)two (13)sexual (13)carapace (13)absent (13)>1 mmno (13)
Mesocyclops edaxOmnivore-carnivore (37)raptorial (37)both (13)eury-warm (13)mesotrophictwo (13)sexual (13)carapace (13)absent (13)>1 mmno (13)
Tropocyclops prasinus mexicanusOmnivore-herbivore (37)raptorial (37)pelagic (50)warm-adapted eurytherm (13,39)mesotrophicmulti (13)sexual (13)carapace (13)absent (13)0.5–1 mmno (13)
Acanthocyclops robustusomnivore (37)raptorial (37)both (13,50)warm-adapted eurytherm (13)meso-eutrophic (13)multi (3)sexual (13)carapace (13)absent (13)>1 mmno (13)
Ergasilus spp.ectoparasite (43,50)graspingpelagic (43,52)warm-adapted eurytherm (54)mesotrophic (43)one (43)sexual (13)carapace (13)absent (13)>1 mmno (13)
Epischura lacustrisomnivore (40)raptorial (40)littoral (13)eury (13)oligotrophic (13)one (13)sexual (13)carapace (13)absent (13)>1 mmno (13)
Diaptomidaeherbivore (40)filtration (13)pelagic (13)cold-adapted eurytherm (1)oligo-mesotrophic (55)two (13)sexual (13)carapace (13)absent (13)>1 mmno (13)
Senecella calanoidesomnivore (40)filtrationpelagic (13)cold stenotherm (13,55)oligotrophic (13)one (39)sexual (13)carapace (1)absent (13)>1 mmno (13)
Limnocalanus macrurusOmnivore-carnivore (40,53)raptorial (40)pelagic (13)cold stenotherm (13,49,55)oligotrophic (13)one (39)sexual (13)carapace (13)absent (13)>1 mmno (13)
Table A5. Rotifer trait matrix. Sources are listed in the references [36,37,38,39,40,41,42,43,44,45,46,47,48,49,50,51,52,53,54,55,56].
SpeciesTrophic GroupFeedingHabitatThermalLake ProductivityGenerations Per YearReproductionArmorGelatinousSize (µm)Trophi
Ascomorpha ecaudisherbivore (46)sucking (46)littoral (14)eurythermal (45)mesotrophic (41)multi (46)parthenogenetic (14)illoricate (14)absent (14)130–200virgate (14)
Ascomorpha ovalisherbivore (46)sucking (46)littoral (14)eurythermal (45)mesotrophic (41)multi (46)parthenogenetic (14)loricate (14)absent (14)95–150virgate (14)
Ascomorpha saltansherbivore (46)sucking (46)littoral (14)eurythermal (45)mesotrophic (41)multi (46)parthenogenetic (14)thin lorica (14)absent 146)100–200virgate (14)
Asplanchna spp. omnivore (14)grasping (46)pelagic (47)eurythermal (42)eu-mesotrophic (41)multi (46)parthenogenetic (14)illoricate (14)absent (14)420–1500incudate (14)
Brachionus calyciflorusherbivore (14)filtration (46)littoral (14)eurythermal (42)eutrophic (41)multi (46)parthenogenetic (14)loricate (14)absent (14)180–570malleate (14)
Collotheca mutabilisomnivore (14)trapping (46)pelagic (38)eurythermal (42)mesotrophic (42)multi (46)parthenogenetic (14)illoricate (14)present (14,46)178–315uncinate (14)
Conochilus spp. unicornisherbivore (38)filtration (46)pelagic (38)eurythermal (45)eu-mesotrophic (42)multi (46)parthenogenetic (14)illoricate (14)present (14,46)200–450malleoramate (14)
Euchlanis dilatataherbivore (38)filtration (46)littoral (38)warm (45)eutrophic (14)multi (46)parthenogenetic (14)loricate (14)absent (14)200–270malleate (14)
Filinia terminalisherbivore (14)filtration (46)pelagic (46)cold (42)mesotrophic (42)multi (46)parthenogenetic (14)illoricate (14)absent (14) malleoramate (14)
Kellicottia longispinaherbivore (38)filtration (46)pelagic (38)cold-adapted eurytherm (14)oligotrophic (41)multi (46)parthenogenetic (14)loricate (14)absent (14)400–860malleate (14)
Keratella cochlearisherbivore (38)filtration (46)pelagic (38)eury (44,45)mesotrophic (41)multi (46)parthenogenetic (14)loricate (14)absent (14)115–200malleate (14)
Keratella quadrataherbivore (38)filtration (46)pelagic (38)eury (14)mesotrophic (41)multi (46)parthenogenetic (14)loricate (14)absent (14)224–385malleate (14)
Monostyla spp.herbivore (38)filtration (38)littoral (38)warm (14)eutrophic (14)multi (46)parthenogenetic (14)loricate (14)absent (14)78–142malleate (14)
Notholca laurentiaeherbivore (46)filtration (46)pelagic (14)cold (14,42,38)oligotrophic (41)multi (46)parthenogenetic (14)loricate (14)absent (14)192–250malleate (14)
Ploesoma spp.omnivore (38)grasping (46)pelagic (38)warm (42)oligotrophic (41)multi (46)parthenogenetic (14)loricate (14)absent (14)150–600virgate (14)
Polyarthra spp.herbivore (38)grasping (46)pelagic (38)eury (42)mesotrophic (14)multi (46)parthenogenetic (14)illoricate (14)absent (14)72–200virgate (14)
Synchaeta spp.herbivore (38)grasping (46)pelagic (38)eury (42mesotrophic (41)multi (46)parthenogenetic (14)loricate (14)absent (14)90–600virgate (14)
Trichocerca spp.omnivore (14)sucking (46)littoral (14)eury (42)eu-mesotrophic (14)multi (46)parthenogenetic (14)ill/lor (14)absent (14)85–310virgate (14)

References

  1. Milly, P.C.D.; Wetherald, R.T.; Cunne, K.A.; Delworth, T.L. Increasing risk of great floods in a changing climate. Nature 2002, 415, 514–517. [Google Scholar] [CrossRef] [PubMed]
  2. Arruda, J.A.; Marzolf, G.R.; Faulk, R.T. The role of suspended sediments in the nutrition of zooplankton in turbid reservoirs. Ecology 1983, 64, 1225–1235. [Google Scholar] [CrossRef]
  3. Threlkeld, S.T. Life table responses and population dynamics of four cladoceran zooplankton during a reservoir flood. J. Plankton Res. 1986, 8, 639–647. [Google Scholar] [CrossRef]
  4. Godlewska, M.; Mazurkiewicz-Boron, G.; Pociecha, A.; Wilk-Wozniak, E.; Jelonek, M. Effects of flood on the functioning of the Dobczyce reservoir ecosystem. Hydrobiologia 2003, 504, 305–313. [Google Scholar] [CrossRef]
  5. Muylaert, K.; Vyverman, W. Impact of a flood event on the planktonic food web of the Schelde estuary (Belgium) in spring 1998. Hydrobiologia 2006, 559, 385–394. [Google Scholar] [CrossRef]
  6. Paidere, J.; Gruberts, D.; Škute, A.; Druvietis, I. Impact of two different flood pulses on planktonic communities of the largest floodplain lakes of the Daugava River (Latvia). Hydrobiologia 2007, 592, 303–314. [Google Scholar] [CrossRef]
  7. USGS. 2012. USGS 04294500 Lake Champlain at Burlington, VT. Available online: http://waterdata.usgs.gov/nwis/nwisman/?site_no=04294500&agency_cd=USGS (accessed on 20 April 2012).
  8. Howland, W.G. The Floods of 2011—A Quick View. Lake Champlain Basin Program. 2011. Available online: http://www.lcbp.org/2011Flood.htm (accessed on 14 March 2012).
  9. Lake, P.S. Disturbance, patchiness, and diversity in streams. J. N. Am. Benthol. Soc. 2000, 19, 573–592. [Google Scholar] [CrossRef]
  10. Myer, G.E.; Gruendling, G.K. Limnology of Lake Champlain; Lake Champlain Basin Study: Boston, MA, USA, 1979; 407p. [Google Scholar]
  11. Mihuc, T.B.; Dunlap, F.; Binggeli, C.; Myers, L.; Pershyn, C.; Groves, A.; Waring, A. Long-term patterns in Lake Champlain’s zooplankton: 1992–2010. J. Great Lakes Res. 2012, 38, 49–57. [Google Scholar] [CrossRef]
  12. Smeltzer, E.; Shambaugh, A.D.; Stangel, P. Environmental change in Lake Champlain revealed by long-term monitoring. J. Great Lakes Res. 2012, 38, 6–18. [Google Scholar] [CrossRef]
  13. Balcer, M.; Korda, N.; Dodson, S.A. Guide to the Identification and Ecology of the Common Crustacean Species; The University of Wisconsin Press: Madison, WI, USA, 1984; pp. 74–101. [Google Scholar]
  14. Stemberger, R.S. A Guide to the Rotifers of the Laurentian Great Lakes; US EPA: Cincinnati, OH, USA, 1979; 200p. [Google Scholar]
  15. Grothe, D.W.; Grothe, D.R. An Illustrated Key to the Planktonic Rotifers of the Laurentian Great Lakes; US EPA: Chicago, IL, USA, 1977; 91p. [Google Scholar]
  16. Doledec, S.; Chessel, D.; Gimaret-Carpentier, G. Niche separation in community analysis: A new method. Ecology 2000, 81, 2914–2927. [Google Scholar] [CrossRef]
  17. Weithoff, G.; Beisner, B.E. Measures and Approaches in Trait-Based Phytoplankton Community Ecology—From Freshwater to Marine Ecosystems. Front. Mar. Sci. 2019, 6, 40. [Google Scholar] [CrossRef]
  18. Barnett, A.J.; Finlay, F.; Beisner, B.E. Functional diversity of crustacean zooplankton communities: Towards a trait-based classification. Freshw. Biol. 2007, 52, 796–813. [Google Scholar] [CrossRef]
  19. SPSS Inc. SPSS for Windows, Version 14.0; SPSS Inc.: Chicago, IL, USA, 2006. [Google Scholar]
  20. Clarke, K.R.; Ainsworth, M. A method of linking multivariate community structure to environmental variables. Mar. Ecol. Prog. Ser. 1993, 92, 205–219. [Google Scholar] [CrossRef]
  21. Oksanen, J.F.; Blanchet, G.; Kindt, R.; Legendre, P.; Minchin, P.R.; O’Hara, R.B.; Simpson, G.L.; Solymos, P.; Stevens, M.H.H.; Wagner, H. vegan: Community Ecology Package. R Package Version 2.0-5. 2012. Available online: http://CRAN.R-project.org/package-vegan (accessed on 1 November 2012).
  22. Gannon, J.E.; Bricker, K.S.; Bricker, F.J. Zooplankton Community Composition in Green Bay, Lake Michigan; US EPA: Chicago, IL, USA, 1982; 93p. [Google Scholar]
  23. Lamouroux, N.; Dolédec, S.; Gayraud, S. Biological traits of stream macroinvertebrate communities: Effects of microhabitat, reach and basin filters. J. North Am. Benthol. Soc. 2004, 23, 449–466. [Google Scholar] [CrossRef]
  24. Gilbert, J.J. Competition between rotifers and Daphnia. Ecology 1985, 66, 1943–1950. [Google Scholar] [CrossRef]
  25. Kang, H.K. Effects of suspended sediments on reproductive responses of Paracalanus sp. (Copepoda: Calanoida) in the laboratory. J. Plankton Res. 2012, 34, 626–635. [Google Scholar] [CrossRef]
  26. Dejen, E.; Vijverberg, J.; Nagelkerke, L.A.J.; Sibbing, F.A. Temporal and spatial distribution of microcrustacean zooplankton in relation to turbidity and other environmental factors in a large tropical lake (L. Tana, Ethiopia). Hydrobiologia 2004, 513, 39–49. [Google Scholar] [CrossRef]
  27. Hart, R.C. Zooplankton abundance, community structure and dynamics in relation to inorganic turbidity, and their implications for a potential fisher in subtropical Lake le Roux, South Africa. Freshw. Biol. 1986, 16, 351–371. [Google Scholar] [CrossRef]
  28. Lynch, M. Predation, competition, and zooplankton community structure: An experimental study. Limnol. Oceanogr. 1979, 24, 253–272. [Google Scholar] [CrossRef]
  29. Brooks, J.L.; Dodson, S.I. Predation, Body Size, and Composition of Plankton: The effect of a marine planktivore on lake plankton illustrates theory of size, competition, and predation. Science 1965, 150, 28–35. [Google Scholar] [CrossRef]
  30. Muenscher, W.G. Plankton studies in the Lake Champlain watershed. In A Biological Survey of the Lake Champlain Watershed; Supplement to the 19th Annual Report; NY State Conservation Dept.: New York, NY, USA, 1929. [Google Scholar]
  31. DeMott, W.R.; Kerfoot, W.C. Competition among cladocerans: Nature of the interaction between Bosmina and Daphnia. Ecology 1982, 63, 1949–1966. [Google Scholar] [CrossRef]
  32. Kirk, K.L.; Gilbert, J.J. Suspended clay and the population dynamics of planktonic rotifers and cladocerans. Ecology 1990, 71, 1741–1755. [Google Scholar] [CrossRef]
  33. Okogwu, O.I.; Nwani, C.D.; Ugwumba, A.O. Seasonal variations in the abundance and biomass of microcrustaceans in relation to environmental variables in two shallow tropical lakes within the cross river floodplain, Nigeria. Acta Zool. Litu. 2009, 19, 205–215. [Google Scholar] [CrossRef]
  34. Napiórkowski, P.; Napiórkowska, T. The impact of catastrophic flooding on zooplankton. Pol. J. Environ. Stud. 2014, 23, 409–417. [Google Scholar]
  35. Dube, T.; DeNecker, L.; Van Vuren, J.H.; Wepene, V.; Smit, N.J.; Brendonck, L. Spatial and temporal variation of invertebrate community structure in flood-controlled tropical floodplain wetlands. J. Freshw. Ecol. 2017, 32, 1–15. [Google Scholar] [CrossRef]
  36. Zhou, M.; Zhou, Z.; Chen, W. Effects of Floods on Zooplankton Community Structure in the Huayanghe Lake. Diversity 2023, 15, 250. [Google Scholar] [CrossRef]
  37. Pedruski, M.T. The Effects of Habitat Connectivity and Regional Heterogeneity on Artificial Pond Metacommunities. Master’s Thesis, Queens University, Kingston, ON, Canada, 2008. [Google Scholar]
  38. Carter, J.C.H. Life cycles of Limnocalanus macrurus and Senecella calanoides, and seasonal abundance and vertical distributions of various planktonic copepods, in Parry Sound, Georgian Bay. J. Fish. Res. Board Can. 1969, 26, 2543–2560. [Google Scholar] [CrossRef]
  39. Wong, C.K. A study of the relationships between the mouthparts and food habits in several species of freshwater calanoid copepods. Can. J. Zool. 1984, 62, 1588–1595. [Google Scholar] [CrossRef]
  40. Sladecek, V. Rotifers as indicators of water quality. Hydrobiologia 1983, 100, 169–201. [Google Scholar] [CrossRef]
  41. Jersabek, C.D.; Bolortsetseg, E. Mongolian rotifers (Rotifera, Monogononta)—A checklist with annotations on global distribution and autecology. Proc. Acad. Nat. Sci. Phila. 2010, 159, 119–168. [Google Scholar] [CrossRef]
  42. Bricker, K.S.; Gannon, J.E.; Roberts, L.S.; Torke, B.G. Observations on the ecology and distribution of free-living Ergasilidae (Copepoda, Cyclopoida). Crustaceana 1987, 35, 313–317. [Google Scholar] [CrossRef]
  43. May, L. Rotifer occurrence in relation to water temperature in Loch Leven, Scotland. Hydrobiologia 1983, 104, 311–315. [Google Scholar] [CrossRef]
  44. Berzins, B.; Pejler, B. Rotifer occurrence in relation to water temperature. Hydrobiologia 1989, 175, 223–231. [Google Scholar] [CrossRef]
  45. Ruttner-Kolisko, A. Plankton Rotifers: Biology and Taxonomy; Kolisko, G., Translator; E. Schweizerbart’sche Verlagsbuchhandlung: Stuttgart, Germany, 1974; 145p. [Google Scholar]
  46. Preißler, K. Do rotifers show “avoidance of the shore”? Oecologia 1977, 27, 253–260. [Google Scholar] [CrossRef] [PubMed]
  47. Berzins, B.; Bertilsson, J. Occurrence of limnic micro-custaceans in relation to pH and humic content in Swedish water bodies. Hydrobiologia 1990, 199, 65–71. [Google Scholar] [CrossRef]
  48. Bertilsson, J.; Berzins, B.; Pejler, B. Occurrence of limnic micro-crustaceans in relation to temperature and oxygen. Hydrobiologia 1995, 299, 163–167. [Google Scholar] [CrossRef]
  49. Smith, K.; Fernando, C.H. A Guide to the Freshwater Calanoid and Cyclopoid Copepod Crustacean of Ontario; Department of Biology, University of Waterloo: Waterloo, ON, Canada, 1978. [Google Scholar]
  50. Brandlova, J.; Brandl, Z.; Fernando, C.H. The Cladocera of Ontario with remarks on some species and distribution. Can. J. Zool. 1972, 50, 1373–1403. [Google Scholar] [CrossRef]
  51. Hogue, C.C.; Sutherland, D.R.; Christensen, B.M. Ecology of metazoan parasites infecting Catostomus spp. (Catostomidae) from southwestern Lake Superior. Can. J. Zool. 1993, 71, 1646–1652. [Google Scholar] [CrossRef]
  52. Bowers, J.A.; Warren, G.J. Predaceous feeding by Limnocalanus macrurus upon Diaptomus ashlandi. J. Great Lakes Res. 1977, 3, 234–236. [Google Scholar] [CrossRef]
  53. Cloutman, D.G.; Becker, D.A. Some ecological aspects of Ergasilus centarchidarum Wright (Crustacea: Copepoda) on largemouth and spotted bass in Lake Fort Smith, Arkansas. J. Parasitol. 1977, 63, 372–376. [Google Scholar] [CrossRef]
  54. Gannon, J.E.; Stemberger, R.S. Zooplankton (especially crustaceans and rotifers) as indicators of water quality. Trans. Am. Microsc. Soc. 1978, 97, 16–35. [Google Scholar] [CrossRef]
  55. Weber, C.I. Methods for Measuring the Acute Toxicity of Effluents and Receiving Waters to Freshwater and Marine Organisms; US EPA: Cincinnati, OH, USA, 1993; 253p. [Google Scholar]
  56. Berzins, B.; Pejler, B. Rotifer occurrence in relation to pH. Hydrobiologia 1987, 147, 107–116. [Google Scholar] [CrossRef]
Figure 1. Annual hydrograph of Lake Champlain water level (m) at the USGS Burlington Gage for 2010–2013.
Diversity 16 00451 g001
Figure 2. Bathymetry map of Lake Champlain and associated sampling sites, all located within the main lake region along the North-South trench which is 50-100 m in depth.
Diversity 16 00451 g002
Figure 3. Average Secchi depth (bars, left axis) and average maximum thermocline depth (line, right axis) of Split Rock, Main Lake, and Grand Isle. Error bars represent SE.
Diversity 16 00451 g003
Figure 4. Seasonality of species that showed an immediate lasting decrease in response to the flood event; note the differences in scale on the y-axis.
Diversity 16 00451 g004
Figure 5. Seasonality of species that decreased in density in 2012, a year after the extreme flooding events in Lake Champlain (2011); note the differences in scale by the y-axis.
Diversity 16 00451 g005
Figure 6. Seasonality of species declining during the flood and recovering after; note the difference in scale on the y-axis.
Diversity 16 00451 g006
Figure 7. Seasonality of species showing little to no response from the extreme flood events of 2011; note the differences in scale on the y-axis.
Diversity 16 00451 g007
Figure 8. Seasonality of species that increased in density in 2012, one year after the flooding; note the differences in scale on the y-axis.
Diversity 16 00451 g008
Figure 9. Nonparametric multidimensional scaling (NMDS) ordinations based on zooplankton densities averaged across all sites for June (k = 2, stress = 0.20, 33 tries; top) and July (k = 2, stress = 0.15, 4 tries; bottom). Taxa names can be found in Appendix A.
Diversity 16 00451 g009
Figure 10. NMDS ordinations based on zooplankton densities averaged across all sites for August (k = 2, stress = 0.21, 24 tries; top) and September (k = 2, stress = 0.15, 10 tries; bottom). Taxa names can be found in Appendix A.
Diversity 16 00451 g010
Figure 11. NMDS ordinations of trait-weighted densities for June/July (k = 2, stress = 0.14, 2 tries; top) and August/September (k = 2, stress = 0.16, 12 tries; bottom). Trait and taxa names can be found in Appendix A.
Diversity 16 00451 g011
Table 1. Zooplankton and water quality sampling stations, their locations, and average depths.
Station #Station NameLatitudeLongitudeDepth (m)
9Split Rock44°14.53′73°24.77′87
19Main Lake44°28.26′73°17.95′100
36Grand Isle44°45.37′73°21.30′50
Table 2. Summary of zooplankton responses to the flooding based on their density trends across the three years. The last three columns indicate a decrease “v”, increase “^” or stable trend “>” relative to the density patterns over the course of the study period.
CategoryTaxonResponse2010201120122013
Asplanchnid RotiferAsplanchna spp.Decrease^vvv
Brachionid rotiferKeratella cochlearisDecrease^vvv
DaphnidaeDaphnia retrocurvaDelayed decrease^^vv
Calanoid copepodDiaptomidaeDelayed decrease^^vv
Cyclopoid copepodMesocyclops edaxDelayed decrease> ^vv
Synchaetid rotiferPolyarthra spp.Delayed decrease^> vv
Conochilid rotiferConochilus spp.Decrease, recovery^v^^
Synchaetid rotiferPloesoma spp.Decrease, recovery^v^^
Brachionid rotiferKellicottia longispinaDecrease, recovery> v^>
Bosminidae Bosmina longirostrisNeutral> > > >
Cyclopoid copepodDiacyclops thomasiNeutral> > > >
SididaeDiaphanosoma birgeiNeutral> > > >
DaphnidaeCeriodaphnia reticulataDelayed increasevv^>
BosminidaeEubosmina coregoniDelayed increasevv^>
Cyclopoid copepodTropocyclops prasinus mexicanusDelayed increase> v^>
Table 3. Traits and trait states used in the analysis.
TraitTrait States
Trophicherbivore (primary consumer), omnivore, carnivore
Feeding modefiltration, grasping/sucking, raptorial
Habitatlittoral, littoral/pelagic, pelagic
Thermalcold, eurytherm, warm
Lake productivityoligotrophic, mesotrophic, eutrophic
Generations per yearone, two, many
Reproductionsexual, parthenogenetic
Armorilloricate, loricate, carapace
Gelatinous sheathabsent, present
Size class<0.5 mm, 0.5–1 mm, >1 mm
Helmetabsent, present
Note: The traits “trophic”, “thermal”, and “lake productivity” allowed for intermediates, thereby splitting densities between traits. For example, a cold-adapted eurytherm would have their densities split between the states “cold” and “eurytherm”.
Table 4. Suggested traits for ability of taxa to withstand flooding conditions.
CategoryTaxonFlood Adaptation
Asplanchnid rotiferAsplanchna spp.Flood intolerant
Brachionid rotiferKeratella cochlearis
Daphnid cladoceranDaphnia retrocurvaDelayed Flood intolerant
Calanoid copepodDiaptomidae
Cyclopoid copepod
Synchaetid rotifer
Mesocyclops edax
Polyarthra spp.
Conochilid rotiferConochilus spp. unicornisFlood intolerant Fast recovery
Synchaetid rotifer
Brachionid rotifer
Ploesoma spp.
Kellicottia longispina
Bosminid cladoceranBosmina longirostrisFlood tolerant
Cyclopoid copepodDiacyclops thomasi
Sidid cladoceranDiaphanosoma birgei
Daphnid cladoceranCeriodaphnia reticulataFlood adapted
Bosminid cladoceranEubosmina coregoni
Cyclopoid copepodTropocyclops prasinus mexicanus
Disclaimer/Publisher’s Note: The statements, opinions and data contained in all publications are solely those of the individual author(s) and contributor(s) and not of MDPI and/or the editor(s). MDPI and/or the editor(s) disclaim responsibility for any injury to people or property resulting from any ideas, methods, instructions or products referred to in the content.

