Abstract
Drought stress is one of the biggest hardships in wheat cultivation because of the strong negative relationship between water deficit and crop yields owing to a lower grain weight, a shorter grain-filling period, a slower grain-filling rate, and reduced grain quality. Genotype–environment interaction (GEN:ENV) generates hardships in selecting wheat genotypes and ideotypes due to biased genetic estimates. Diverse strategies have been proposed to respond to the urgent need for concurrent improvements in yield performance and stability. This study’s purpose was to appraise genetic variation and GEN:ENV effects on yield and yield components to discover drought-stress-tolerant genotypes and ideotypes. This study evaluated 20 genotypes in three consecutive seasons under non-stressful and drought-stress conditions in a total of six ENVs. The broad-sense heritability ranged from 0.54 to 0.82 based on expected mean squares and ranged from 0.60 to 0.90 based on plot mean, but in the other three ways, it was usually greater than 0.90. The high values of () revealed the effect that broad-sense heritability has on the expression of traits. G01, G03, G06, G07, G08, G10, G12, G13, G16, G17, and G18 were stable genotypes for grain yield (GY), according to additive main effects and a multiplicative interaction biplot for the six ENVs. Based on scores in the weighted average of absolute scores biplot (WAASB), G02, G04, G05, G08, G10, and G18 were selected as stable and high-performance for GY, and they were all selected as the best genotype groups using the WAASB-GY superiority index. From the results obtained from principal component analysis and hierarchical clustering and from the tolerance discrimination indices, G02, G04, G05, G18, and G19 are genotypes that produce a suitable yield under non-stressful and drought-stress conditions. In essence, combining approaches that take into consideration stability and high performance can contribute significantly to enhancing the reliability of recommendations for novel wheat genotypes.
1. Introduction
The average annual increase in the world’s population is 1.1% [1,2], which is far faster than even the experts predicted [3]. This is reflected in the increase in the rate of food consumption. Even though agricultural research has achieved great leaps forward in increasing the world’s food production, its achievements are being increasingly exposed to instability for various reasons, the most important being climate change [4,5]. The main effects of climate change, such as heat, drought, salinity, floods, humidity, decreasing groundwater table and resources, and unexpected high or low rainfall, hinder improvements in crop production, particularly under conditions of limited resources. Water is the most limiting abiotic factor for plant life through photosynthesis [6,7]. Water-deficit stress is a dominant climate factor that damages crop production, especially within the period of reproduction and grain filling. It is a danger to food security, and water-deficit stress affects, in an increasingly negative manner, the sustainable production of wheat. Reduced production has become more intense as global temperatures have risen, particularly around the Mediterranean basin [4,7,8,9]. Scientific studies have confirmed that drought stress in wheat causes changes in morpho-physio-biochemical characters and in the capacity for genetic reduction, causing negative changes in the final product, such as reduced grain weight, a shorter grain-filling period, a slower grain-filling rate, and reduced grain quality [4,6,10].
Water-deficit-related tissue damage in crops is a substantial cause of yield loss in agricultural output worldwide owing to the strong negative relationship between water deficit and crop yields [4,10,11]. Therefore, more research is necessary to promote the development/discovery of new factors that can improve drought tolerance in crops to meet the heightened food demands of the world’s population. To ensure global food security, global food policy must provide multiple priorities at the same time and stimulate greater cooperative investigation and the creation of new or improved wheat genotypes that are tolerant to drought stress [12,13]. A plant’s ability to overcome drought stress is due to appropriate environmental and agricultural conditions and/or genetic factors that improve its ability to save water as the flow of water from roots to leaves decreases and as the water through transpiration decreases when stomata open [6]. A sustainable way to mitigate drought-stress damage is to provide/generate tolerant varieties via examining many genotypes to identify tolerant genotypes and then transferring the tolerance traits into commercially cultivated varieties to combine them into model varieties that are both high-yielding and drought-stress-tolerant [7,14,15].
Evaluation of the genotypes under drought stress is important to identify the best ones, in terms of high quantity and quality, to select them as promising commercial varieties. These can be used for continuous improvement in prospective breeding programs for wheat tolerant to drought stress and for genetic stability, given that drought is a polygenic trait and more sensitive to environmental conditions [16,17]. Due to this, genotype performance in wheat may be different from one season to another (from strength to weakness or conversely). In this regard, more efforts should be made to determine which genotypes are stable across sites that are evaluated in many locations for a few seasons until satisfactory results are observed by farmers [18,19,20]. Yield and yield components are affected by a multitude of factors during the growing season and are primarily impacted by water deficits and light periods. Thus, scientists are trying to understand interactions (GEN:ENV) between genotype (GEN) and environment (ENV) through genetic studies using a novel model, which became known as the WAAS biplot (WAASB, which combines in one unique index the advantages of AMMI and BLUP (best linear unbiased pre-diction)) to determine ideal genotypes based on a combination of high performance and stability, as suggested in [21,22]. The WAASB is more reliable and provides more comprehensible results. The WAASB evaluates the outperforming genotypes that combine high performance and stability in a two-dimensional plot of the model which considers all of the interaction principal component axes (IPCAs) of GEI effects [8,14,22,23,24]. However, selecting the best drought-tolerant genotypes is the most challenging for breeders. Thus, many scholars have suggested several stress-tolerance indices, but few are most beneficial for the stress-tolerant genotype-selection process [15,25,26]. These scholars have pointed out that the high values for MP (mean productivity index), STI (stress-tolerance index), GMP (geometric mean productivity), HM (harmonic mean), YSI (yield stability index), and YI (yield index), as well as low values for TOL (tolerance index), SSI (stress susceptibility index), RSI (relative stress index), and PYR (percent yield reduction) are preferable for discovering genotypes that are stable and tolerant [25,27,28]. In this study, 20 wheat genotypes were evaluated for three seasons under non-stressful and drought-stress conditions, in a total of six environments. I observed that the genotypes’ production was reduced in cases under drought stress. The absolute and predicted values for yield and yield components coupled with drought-stress indices for grain yield traits were used for choosing and identifying drought-tolerant genotypes. Therefore, this study aimed the use different modern statistical methods that complement each other to (i) determine the best genotypes that combine high productivity and stability under drought stress, (ii) validate the competency of drought indices in screening tolerant genotypes, and (iii) assess the relationships between the various indices.
2. Materials and Methods
2.1. Experiment Description
The twenty wheat genotypes (six varieties and 14 doubled haploid lines (DHLs [29])) as listed in Tables S1 and S2. They were planted in six environments (ENV) from 2018/19 to 2020/21 for three seasons (SEA) in a row as reflected in Table 1. The experiments were separated into two (non-stress and drought-stress) treatments in three blocks (randomized complete block design) in the three seasons. Texture soil type, plot area, seedling rate, fertilizing rates, methods added to them, and weather conditions (Table S3) as described in detail in previous studies [14,20].

Table 1.
Codes used and description of test for production environments.
2.2. Yield and Yield Components Parameters
The data of four traits: yield and three yield components, were evaluated. The number of spikes (NS, m−2) was assessed before harvest. The three (number of kernels (NKS, spike−1), thousand kernel weight (HKW, g), and grain yield (GY, ton ha−1)) traits were assessed after harvest. The traits were measured by the recommendations described [7].
2.3. Statistical Analyses
The variance components were acquired with the restricted maximum likelihood (REML) [30], and the random effects significance was assessed with the likelihood ratio test (LRT), which compared the GEN of two models, one containing all the random terms and the other with one dismiss of the random terms, using a chi-square (χ2) test. Five broad-sense heritability calculations were obtained:
- (1)
- Expected mean squares-based heritability (h2ems) =
- (2)
- Genotype mean-based heritability (h2gm) =
- (3)
- Plot mean-heritability (h2pm) =
- (4)
- Cullis heritability (h2cullis) =
- (5)
- Piepho heritability (h2piepho) =
Additionally, the other parameters:
- -
- Genotypic coefficient of variation (CVgen) = ) × 100
- -
- Coefficient of determination of GEN:ENV effects (R2) =
- -
- Residual coefficient of variation (CVres) = ) × 100
- -
- Genotype–environment correlation (rgen-env) =
- -
- CV ratio =
Here, gen, gen:env and res refers to the genotypic variance, the genotype × environment and the residual (error), respectively; b and env refers to the number of blocks and environments, respectively. is the mean standard error of the genotypic BLUPs, is the mean variance of difference of two best linear unbiased estimators (BLUE). is the overall mean. All these parameters were described by Sampaio Filho et al. [31].
Data of four traits from six ENVs underwent AMMI analysis, which combined ANOVA and PCA (principal component analysis) jointly [19]. The additive main effects of GENs and ENVs were fitted in the regular ANOVA and its subsequent PCA which interprets the non-additive effects (GEN:ENV). AMMI analysis was used to identify stable GENs with each ENV [32] and has a high prediction ability between the predicted (AMMI model) and absolute values [33]. AMMI biplots were established by the main effect of trait means against the PCA1 and then between PCA1 vs. PCA2 [19]. WASSB analysis for adaptability and stability using the mean performance of genotypes, which has the power to assimilate a linear mixed-effects model structure, shows a new graph for the simultaneous choosing of genotypes with its capacity to identify GEN:ENV by stability indices of parametric and non-parametric [21,22,31].
To calculate drought-tolerance indices for the GY trait the following formulas were used, as presented by Lamba et al. [25] and Bennani et al. [34]. Stress tolerance (TOL) = , stress-tolerance index (STI) = modified stress-tolerance index (STIm) = (, stress susceptibility percentage index (SSPI) = stress susceptibility index (SSI) = , yield index (YI) = , yield stability index (YSI) = , relative drought index (RDI) = , mean productivity (MP) = )/2, geometric mean productivity (GMP) = ), harmonic mean (HM) = )), mean relative performance (MRP) = , percent yield Reduction (PYR) = , Relative efficiency index (REI) = , abiotic-tolerance index (ATI) = , stress/non-stress production index (SNPI) = stress-weighted performance index (SWPI) = and relative drought effect (RDE) = .
and are the GY of genotypes while, and are the mean GY of all genotypes under non-stress and drought-stress conditions, respectively.
Statistics analyses of computer-generated packages in RStudio, R version 4.3.3 (R Core Team 2023), and XLSTAT package (vers. 2019.1) were carried out. The package R used was “metan” as per Olivoto and Lúcio [35]. Stress indices computation and the analyses of principal component (PCA), hierarchical cluster (HCA), and discriminant (DA) were conducted in XLSTAT package (vers. 2019.1).
3. Results
3.1. Deviance Analysis and Genetic Parameters
The LRT test detected significant effects (p < 0.001) for GEN and GEI, which signals the presence of genetic variability; this may cause genotype classification changes from one agronomic trait to another (Table 2). This underscores the importance of carrying out an assessment of genotype performance that takes into account environmental changes (Figure 1 and Figure 2). During breeding programs, it is necessary to accurately establish all genetic details to select genotype properly to strengthen the reliability and validity of the derived findings of the results obtained. The data obtained (variance components) using the REML were divided into percentages of their contribution in to the studied traits. The value played a crucial role in the total phenotypic variance; proportions ranged from 53.90% for NS (moderate) to 81.60% for TKW (high). The value exhibited a range from 8.13% for TKW to 36.00% for NS (this does not neglect the role it plays), and the value contributed low ratios that ranged from 6.44% to 13.30 (Table 2). The h2ems values ranged from moderate for NS and NKS (0.54 and 0.64) to high for TKW and GY (0.82 and 0.73). For h2pm, the values were mixed and varied from 0.60 for NS to 0.90 for TKW. The values of h2gm were high, ranging from 0.97 to 0.98. In the same context, the estimates h2piepho and h2cullis were very high and very similar for all traits, ranging from 0.97 to 0.98, except for the GY trait, where h2cullis was 0.87. The (As) values were high (>94.00%). The (rgen-env) values ranged from 0.44 (moderate) to 0.78 (high). The (CVgen) values exhibited a wide range, from 10.90% for NS to 17.30% for GY. On the other hand, the (CVres) values ranged from 4.72% for NS to 5.34% for NKS. In addition, the ratio (CVgen/res) showed values greater than 1 for all traits.
Table 2.
Deviance analysis, estimated variance components and genetic parameters for GY of 20 wheat genotypes evaluated in six environments.
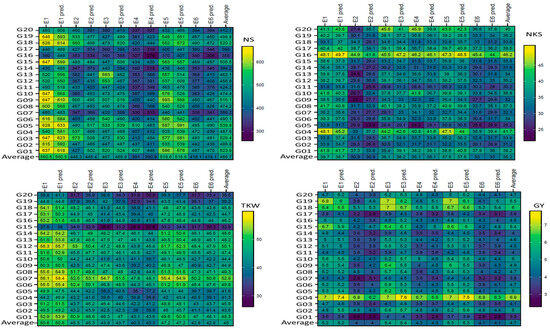
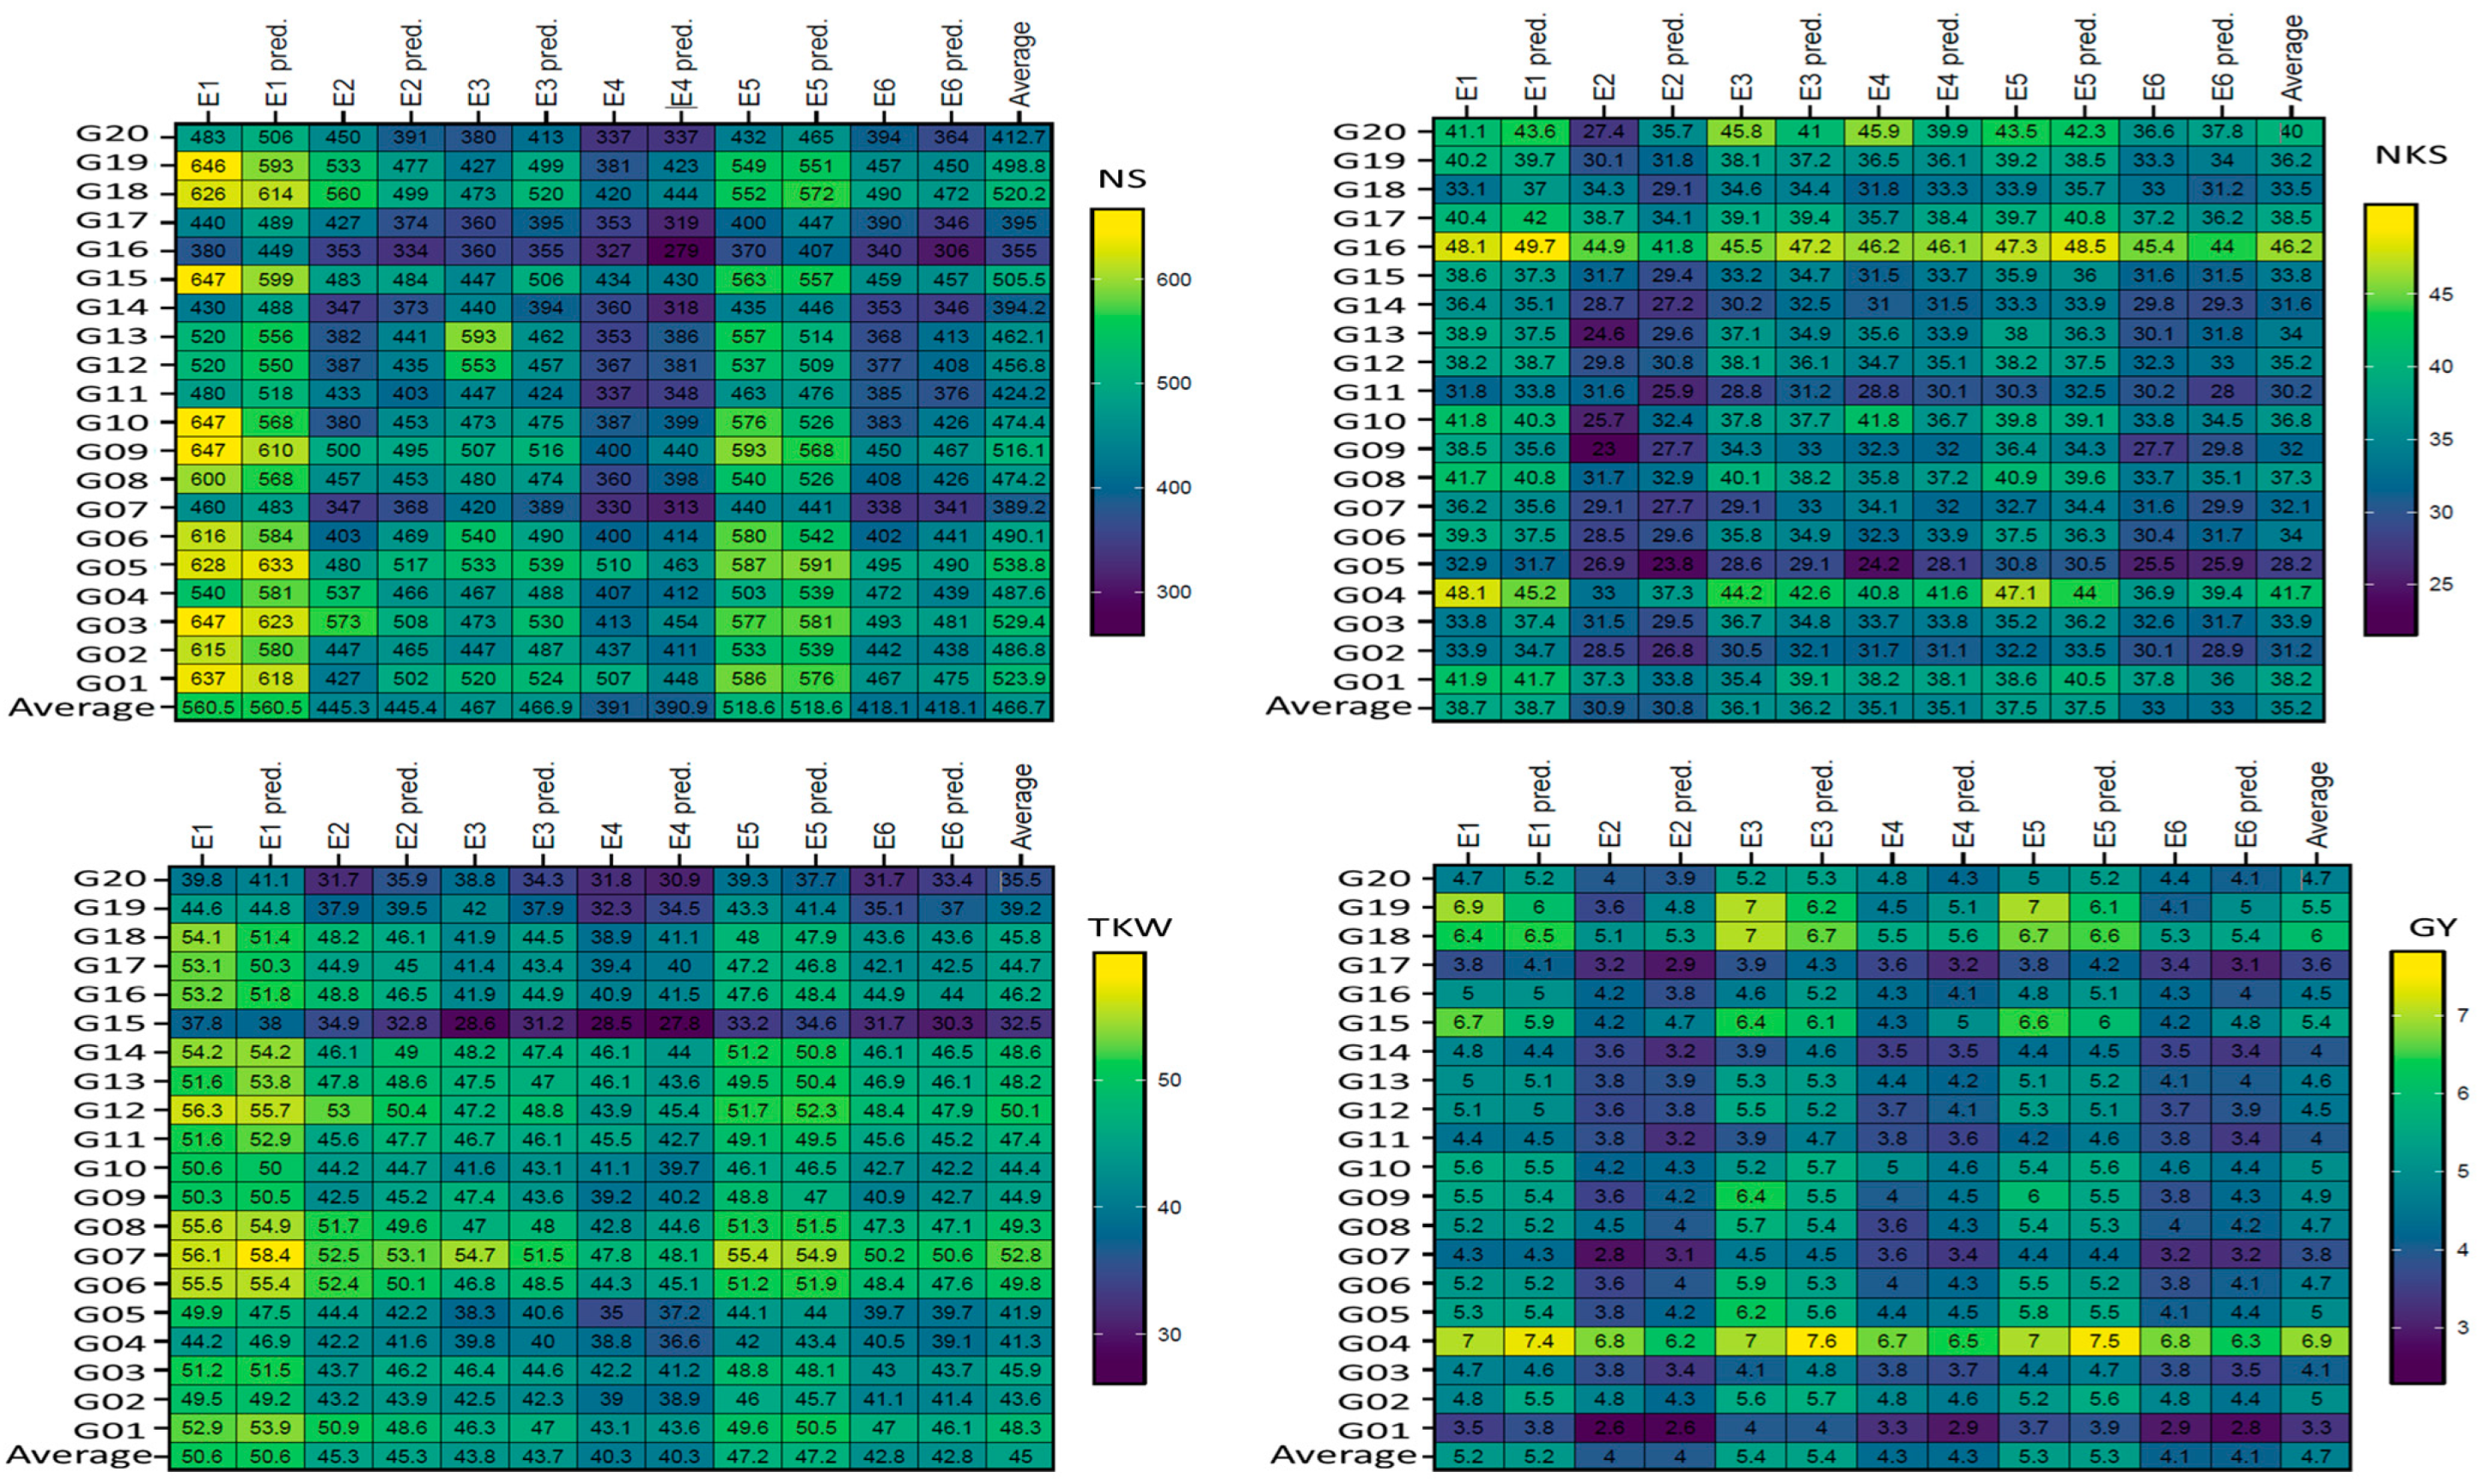
Figure 1.
Plotting the mean performance of absolute values and predicted by AMMI model of the four traits in six environments (E) for 20 wheat genotypes. The comparisons used t-test. Abbreviations as described in materials and methods.
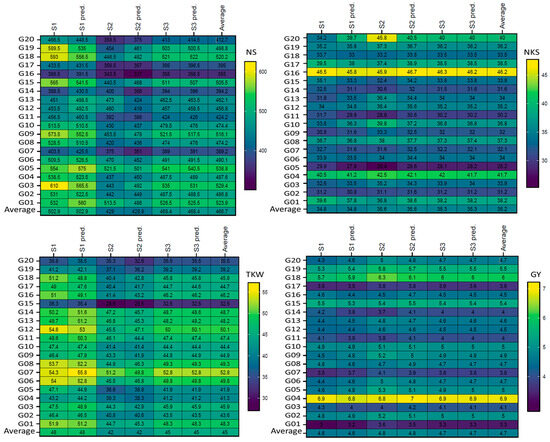
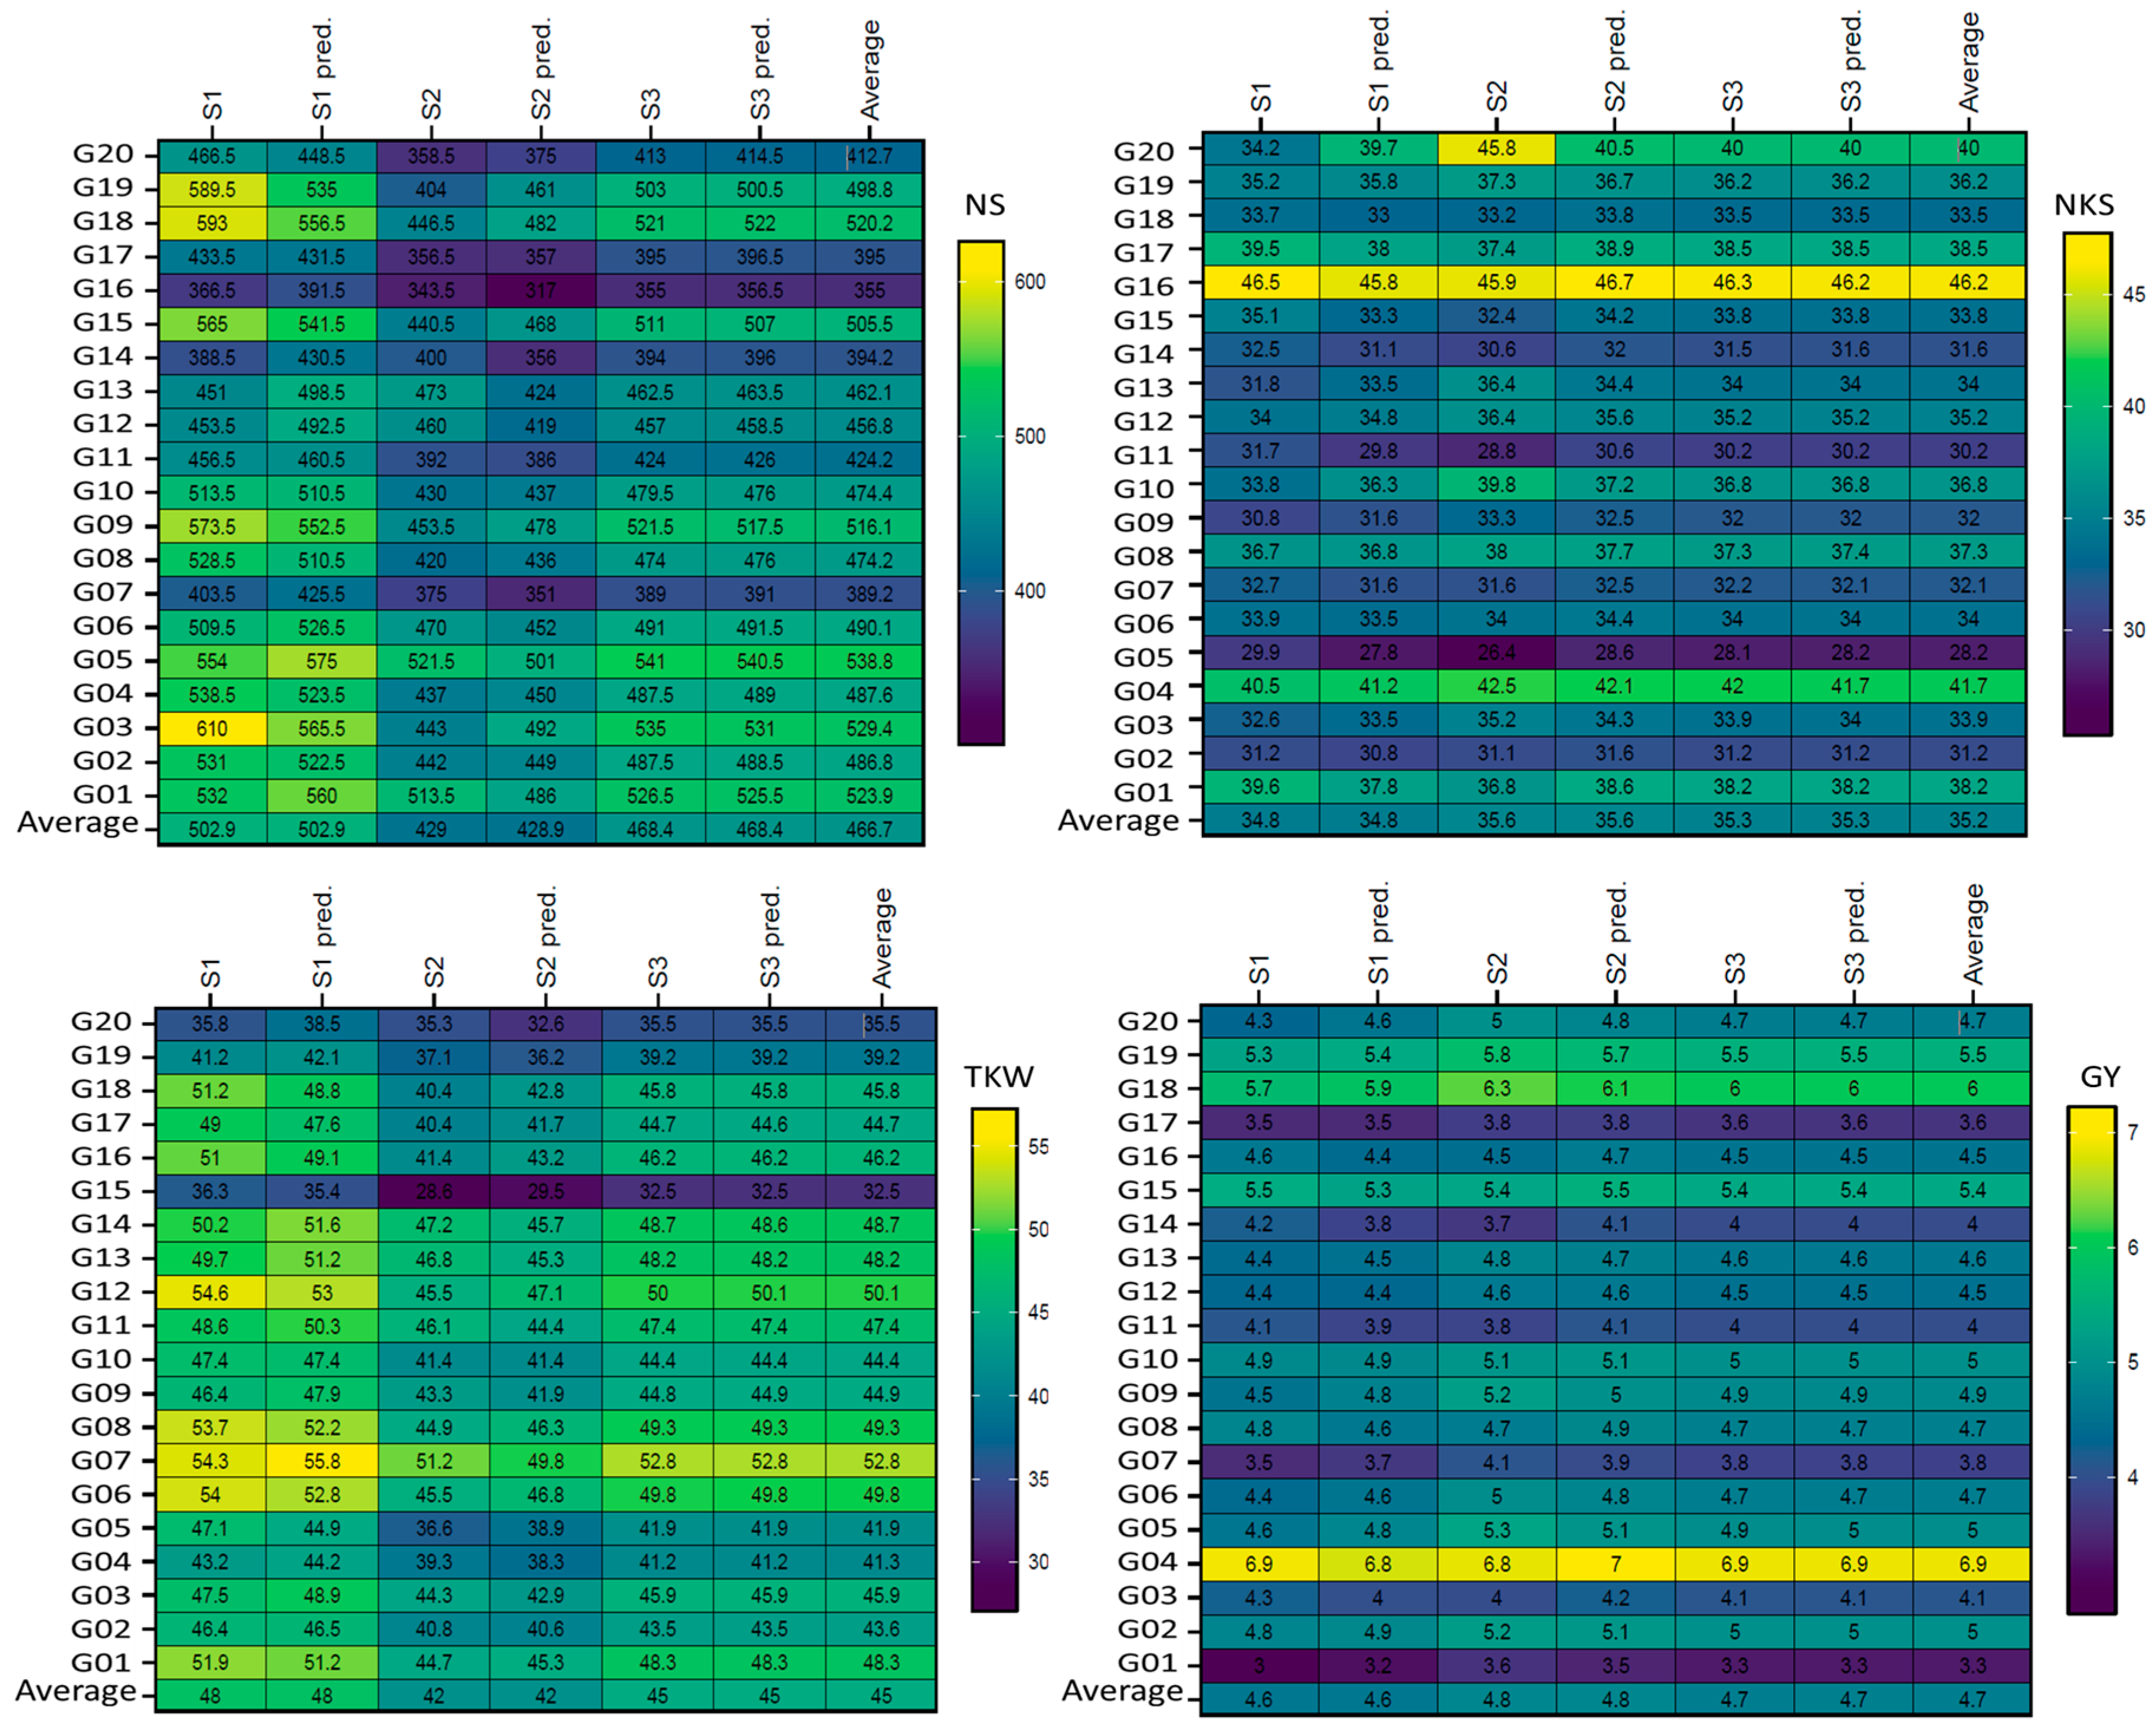
Figure 2.
Plotting the mean performance of absolute values and predicted by AMMI model of the four traits as the mean across one season (S) for 20 wheat genotypes. The comparisons used t-test. Abbreviations as described in materials and methods.
3.2. AMMI Analysis
The AMMI-ANOVA analysis for yield and yield components under six environments (three seasons × two treatments) was performed for 20 wheat genotypes (Table 3). The analysis signaled that all traits studied were significantly (p < 0.001) severely affected by environment (ENV), genotype (GEN), and GEN:ENV. GEN greatly contributed to three (NKS, TKW, and GY) traits (by about 45.69%, 56.58, and 48.19, respectively) and by 29.34% (less than ENV) for the NS trait of the total variation. The remainder of the total variations contributed by ENV and GEN:ENV were 35.35% and 15.92 for NS, 18.69 and 14.67 for NKS, 25.33 and 6.53 for TKW, and 24.80 and 12.12, respectively. The highly significant influences of ENV revealed highly varying responses among GENs across the different ENVs. The water shortage across ENVs was a major reason for the GEN:ENV effect. The classification of GENs across the ENVs indicates that the GEN:ENV was a crossover type and had a large influence on GEN performance. The AMMIs succeeded in partitioning the SS treatment into three components (IPCA1–IPCA3) at a percentage of 100.00%, which was significant. The IPCA1 was highly significant (p < 0.01) and explained the interaction pattern (the percentage ranged from 54.00 (NS) to 79.10 (GY)) better than other interaction axes; it was followed in significance by IPCA2, which ranged from 13.00 (GY) to 30.90 (NS). The IPCA3 percentage ranged from 7.90 (GY) to 30.90 (NS) of the total GEN:ENV variation (Table 3).
Table 3.
AMMI analysis of variance for yield and yield components among 20 wheat genotypes in six environments.
3.3. Mean Performance of Genotypes as Absolute and Predicted Values
Figure 1 displays the genotypes’ mean performance in the comparison between the absolute values with the predicted AMMI model for six ENVs. In general, the results did not show significant (according to the t-test) differences for genotypes within the non-stressful (ENV1, ENV3, and ENV5) environments or drought (ENV2, ENV4, and ENV6) environments, but clear differences were observed between non-stressful and drought-stress environments, as shown in Figure 1. The absolute values and predicted values showed significant differences in the six ENVs for the four traits (NS, NKS, TKW, and GY); the maximum differences were observed in five (ENV1, ENV2, ENV3, ENV4, and ENV6) environments between the absolute values and predicted NS trait, as shown in genotypes G01, G03, G04, G06, G10, G12, G13, G14, G15, G16, G17, G18, G19, and G20, but were not observed in ENV5. For NKS, the differences were observed in four (ENV2, ENV3, ENV4, and ENV5) environments for 10 genotypes (G04, G05, G07, G09, G10, G11, G13, G17, G18, and G20). Concerning the TKW trait, four (ENV1, ENV4, ENV5, and ENV6) environments did not show any clear differences between the absolute values and predicted values, except for one genotype (G20) in ENV2. In addition, ENV3 showed minor differences. The maximum differences were observed in genotype G19 in five (ENV1, ENV2, ENV3, ENV5, and ENV6) environments in the GY trait; however, these were not observed in ENV4. Figure 2 presents the plotting with three seasons (S); clear differences were observed between them for both absolute values and predicted values in the four traits (NS, NKS, TKW, and GY). Further, the maximum differences were observed in two (S1 and S2) seasons between the absolute values and predicted values in the NS trait of the same S, which was observed in six genotypes (G03, G12, G13, G14, G18, and G19) but not observed in S3. For the NKS trait, the three seasons did not produce any clear differences between the absolute values and predicted values, except for one genotype (G20) in S1 and S2. S1 showed a minor difference in the genotype G20 only in the TKW trait. The maximum differences were observed in genotype G09, G11, and G14 in two (S1 and S2) seasons in the GY trait but were not observed in S3.
3.4. AMMI Biplot
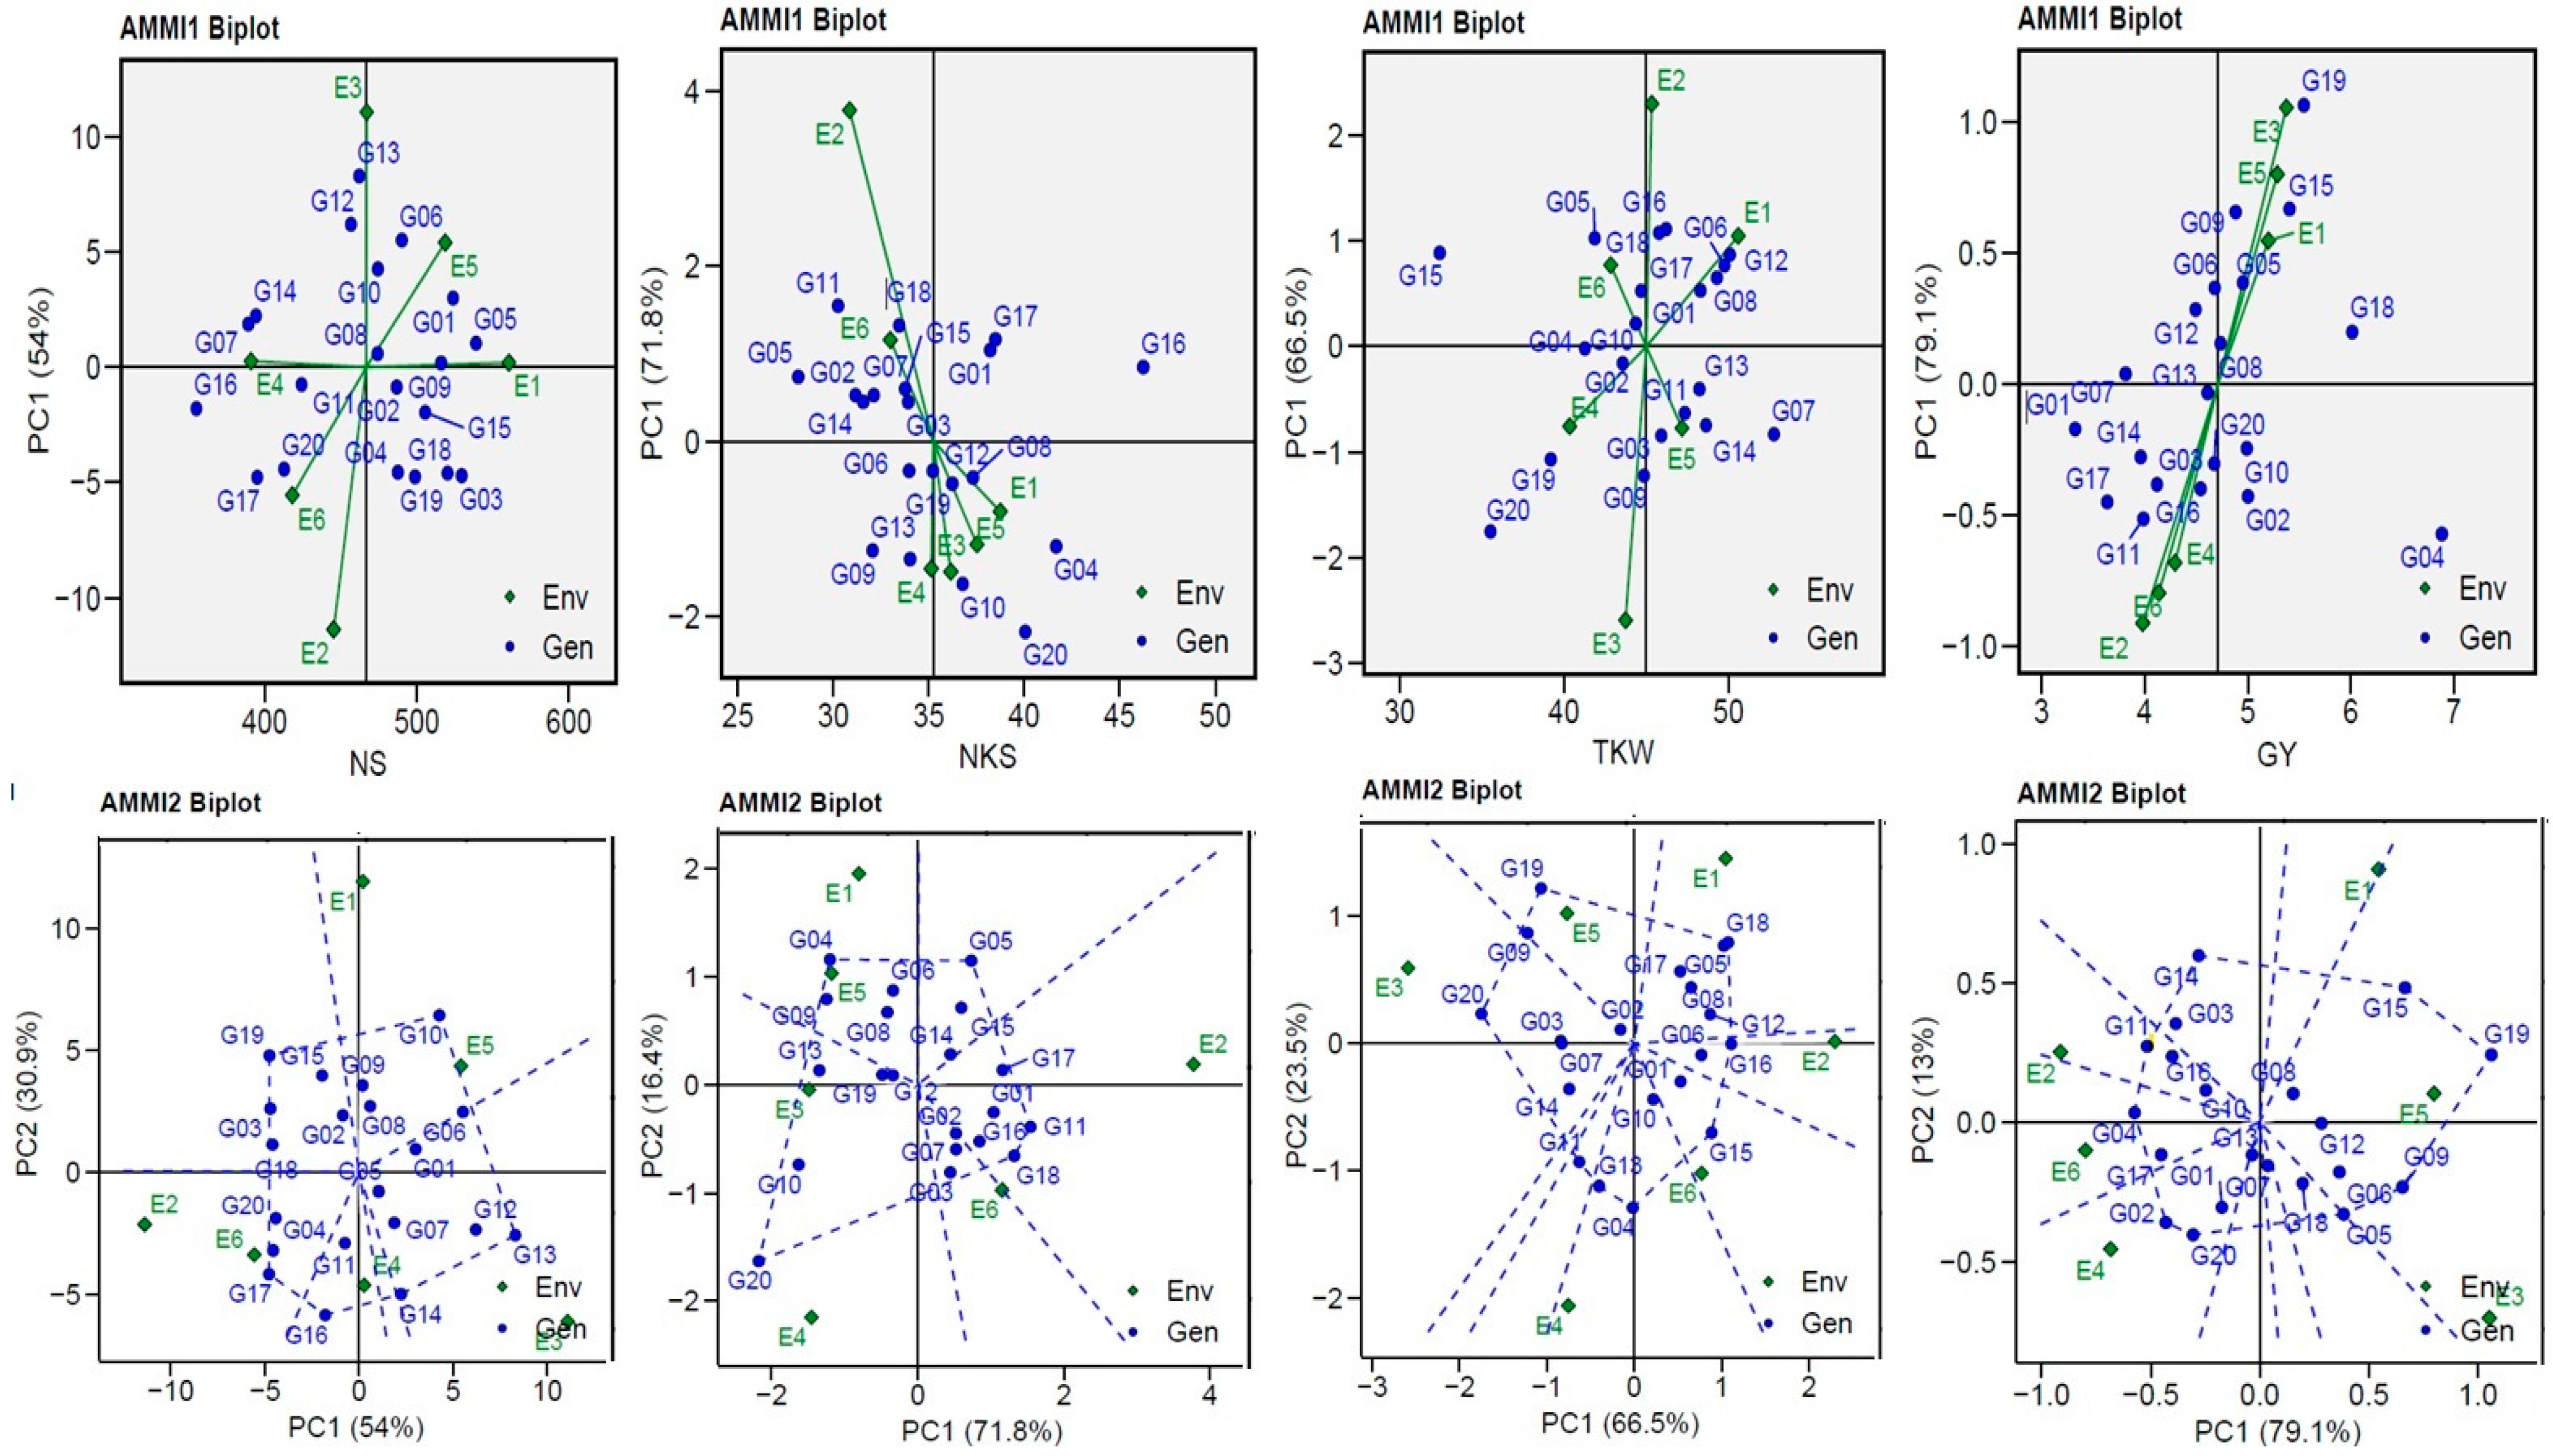
The yield and yield component of the genotypes tested in six environments were visually displayed by AMMI biplots (GGE biplots), which describe the relationship between genotypes and agricultural environments for yield and yield components vs. IPC1 (Figure 3). The environments (ENV2 and ENV3) for the NS trait; ENV2 for the NKS trait; ENV2 and ENV3 for TKW; and ENV1, ENV3, ENV5, and E6 for GY were further from their sources and possessed a longer vector (indicating higher interaction), as opposed to other the environments which were closer to their source and possessed shorter vectors (indicating lower interaction). The AMMI2 biplot for IPCA1 and IPCA2 explained a cumulative variance of 84.90% for the NS trait, 88.2% for the NKS trait, 90.0% for the TKW trait, and 92.10% for the GY trait. The three non-stressful (ENV1, ENV3, and ENV5) environments had mostly positive correlations (the angle between the vectors was less 90°), and the three drought-stress (ENV2, ENV4, and E6) environments showed similar outcomes (Figure 3). This suggests that the GEI effects tend to be in the same range and independent when applying them under comparable circumstances, except for ENV1 with ENV3 for the NS trait, and ENV2 with ENV4 for the NKS and TKW traits, which showed negative correlations (the angle among the vectors was greater than 90°). The plots (Figure 3) show the volume of GEI with the ENV type using the vertical projection from the GEN to the ENV vector. Thus, the nine genotypes (G03, G10, G13, G14, G16, G17, G18, G19, and G20) for NS, five genotypes (G04, G05, G08, G11, and G20) for NKS, nine genotypes (G04, G05, G11, G13, G15, G16, G18, G19, and G20) for TKW, and nine genotypes (G02, G04, G05, G09, G11, G14, G15, G19, and G20) for GY can be considered as unstable in the six environments used.
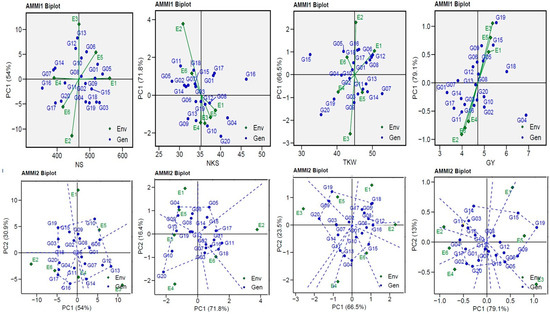
Figure 3.
AMMI1 and AMMI2 Biplot for the NS, NKS, TKW, and GY traits of 20 wheat genotypes evaluated in six environments.
3.5. WAAS Biplot (WAASB)
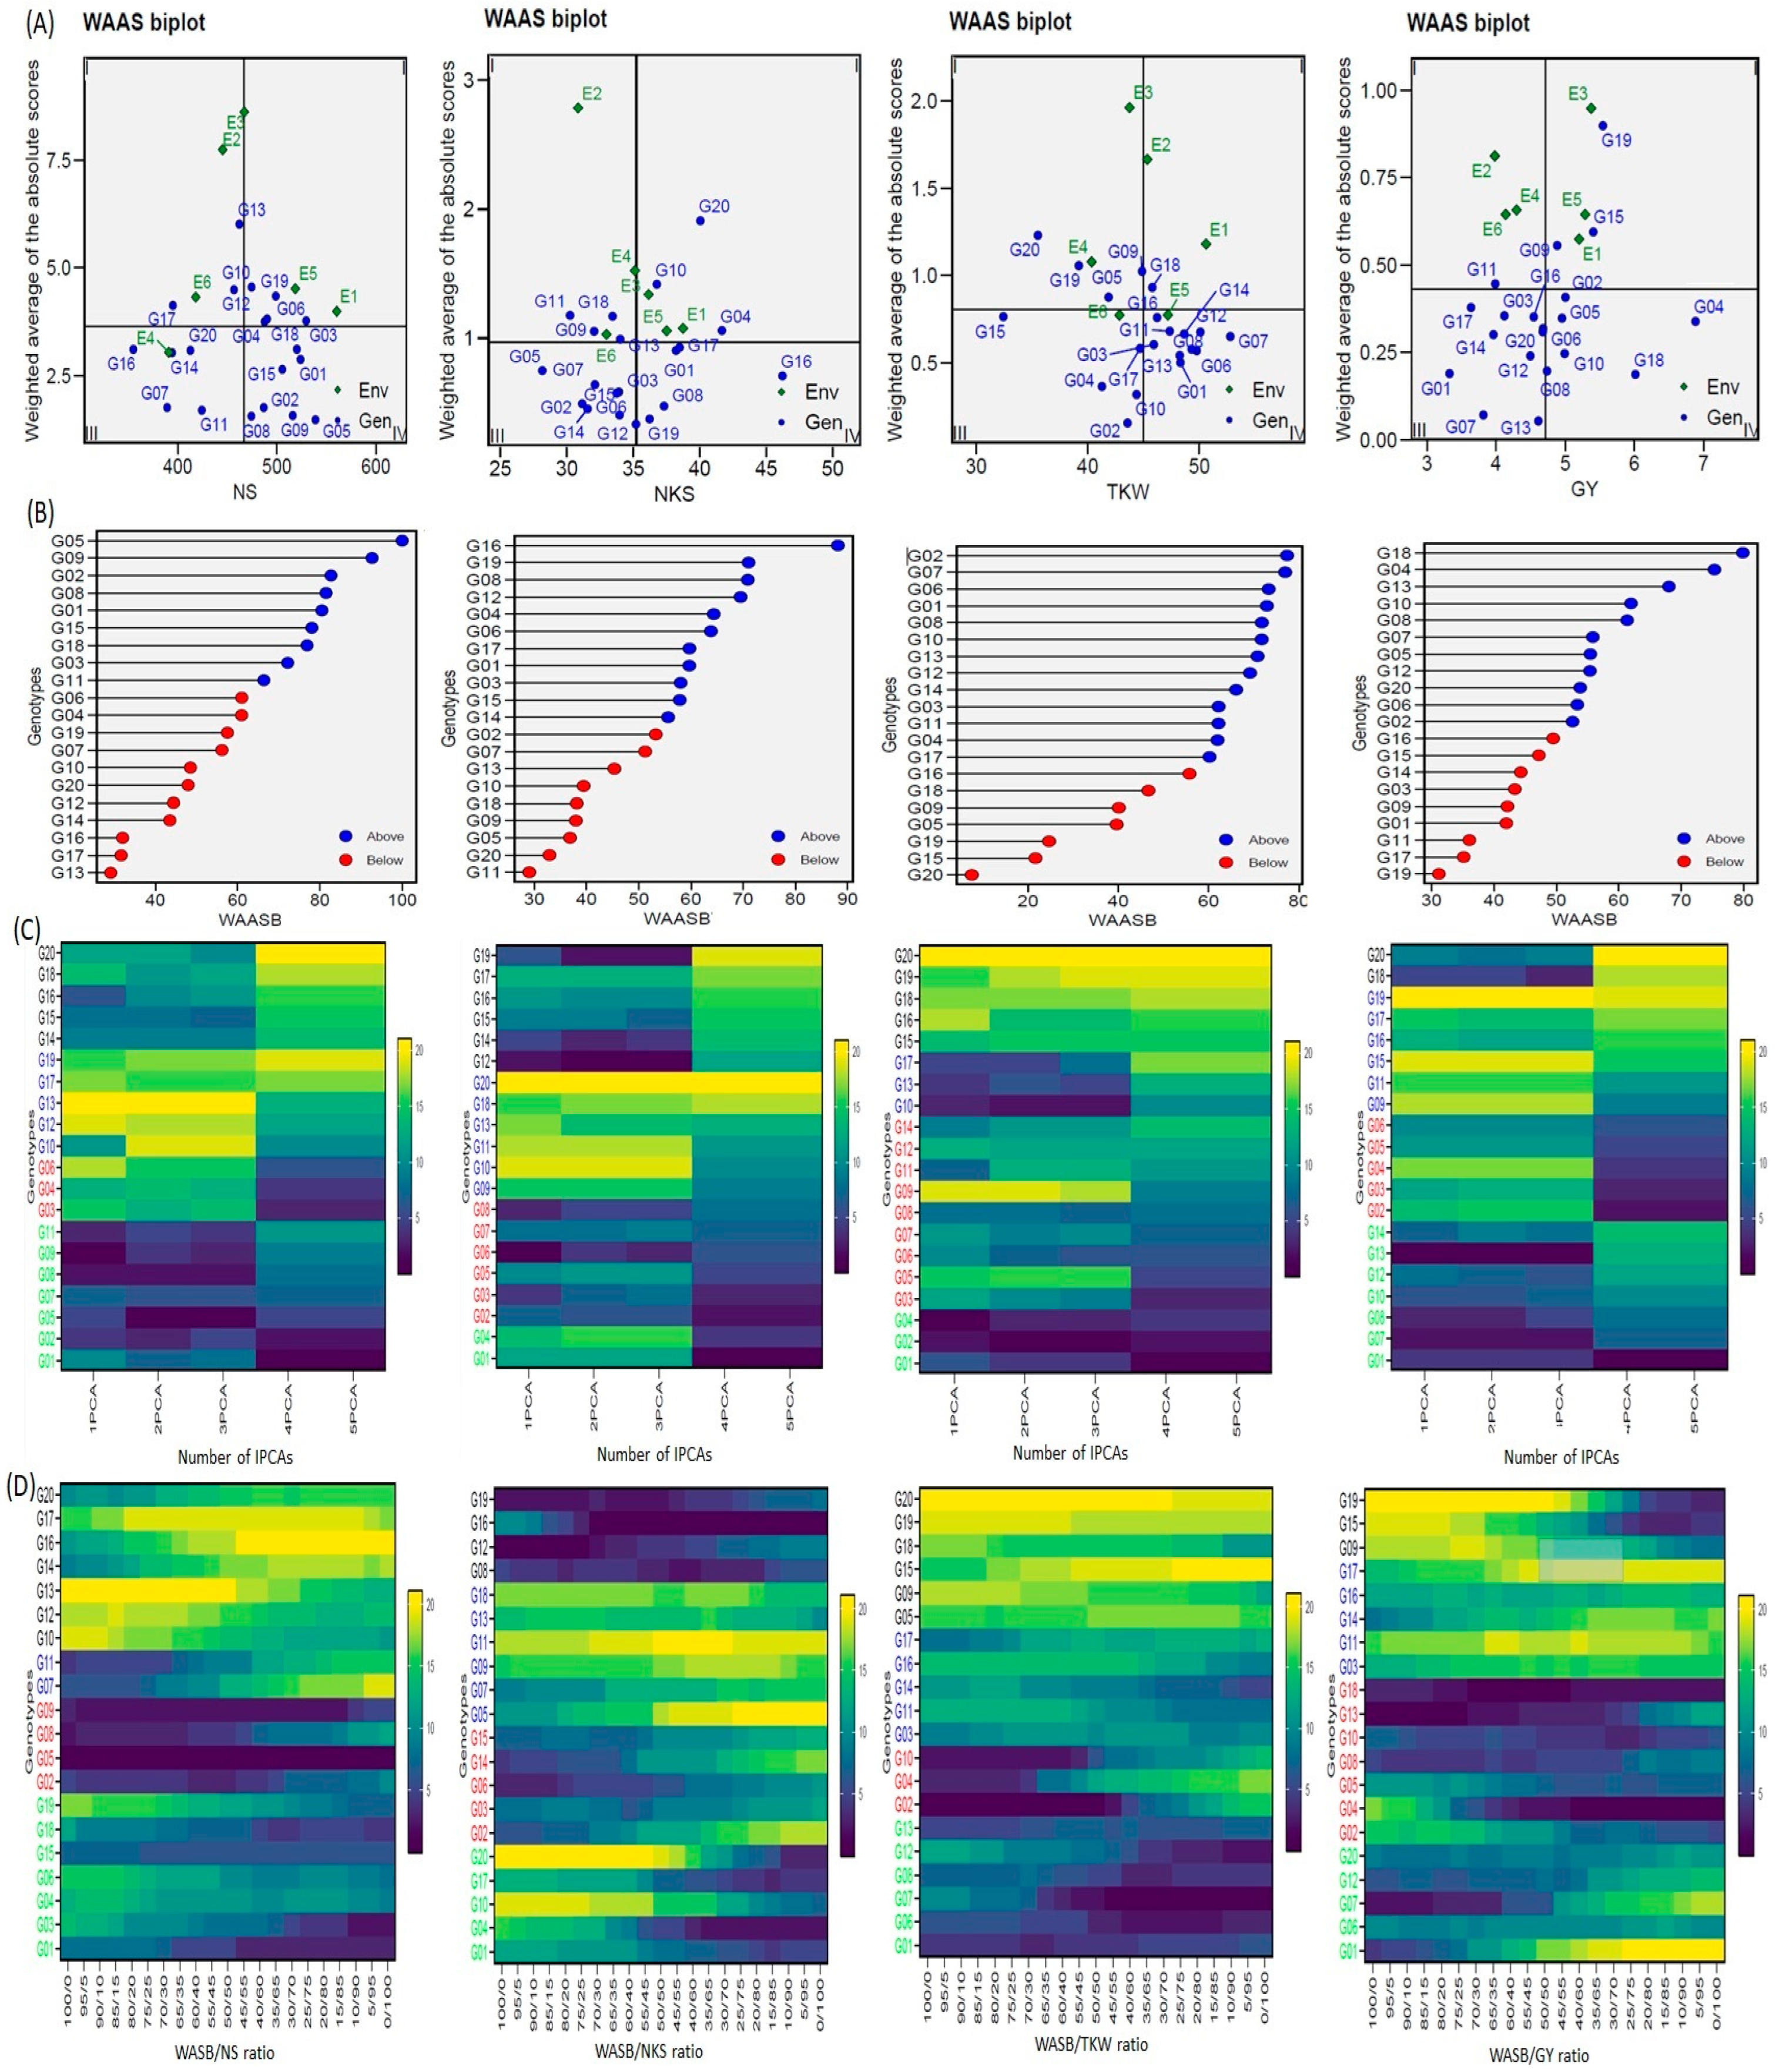
WAASB analyses were used in genotype selection, based on performance and stability, to obtain better and more comprehensive characterizing (genotypes/environment) of yield and yield components (Figure 4). The unstable genotypes sit in Sector I and play the biggest role in the GEI in the ENV, with a high distinction capacity (the GENs and ENVs varied according to traits). The unstable genotypes and highly productive genotypes sat in Sector II, and the environments play a big role in the GEI. In addition, the genotypes and environments varied according to traits. The genotypes that sat in Sector III were adopted on a larger scale, and with a lower performance than average, due to a reduction in WAASB values, suggesting a more stable genotype performance across the environments (the genotypes varied according to traits). Sector IV of the biplot features the genotypes with the highest and most stable performance. Hence, the G01, G02, G05, G08, G09, G15, and G18 genotypes were selected for the NS trait; the G01, G08, G16, G17, and G19 genotypes were selected for the NKS trait; the G01, G03, G07, G08, G11, G12, G13, G14, and G16 genotypes were selected for the TKW trait; and the G02, G04, G05, G08, G10, and G18 genotypes were selected for the GY trait. G08 was available in each of the four traits (Figure 4A). Figure 4B provides the genotype ranking (WAASBY) based on the weights of the stability (WAASB) and mean performance (Y) considering weights of 45 and 55 in NS trait, 55 and 45 in NKS trait, 45 and 55 in TKW trait, 35 and 65 in GY trait, the Y and WAASB, respectively, using IPCA1.
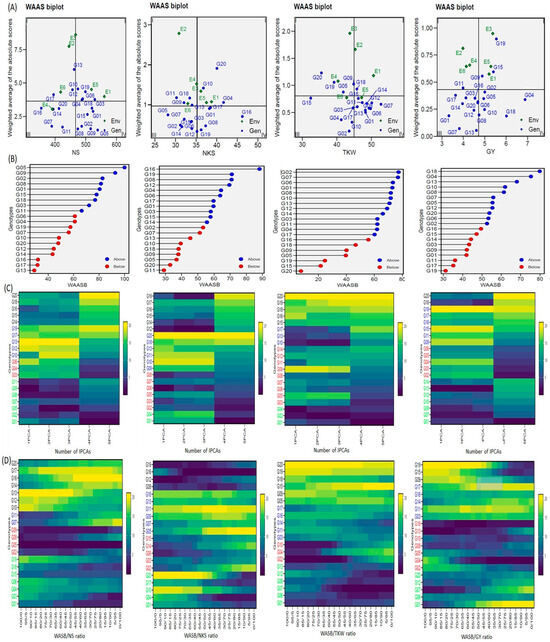
Figure 4.
WAASB analyses for 20 wheat genotypes were evaluated under six environments. (A) The WAAS biplot based on joint interpretation of storage root number (trait) and stability (WAASB), (B) Estimated values WAASB and mean performance (trait) (WAASB trait) for genotypes considering the weights for trait and stability, (C) Heatmap shows the ranks of genotypes concerning the number of IPCA used in the WAAS for the BLUPs of the genotype vs. environment interaction (WAASB) estimation, (D) Ranks of genotypes considering different weights for stability and yielding.
The heatmap (number of IPCAs) can be utilized to display genotype ranking for stability, building upon the number of IPCAs used in the WAASB assessment (Figure 4C). The color (intensity or hue) indicates the relative ranking of the genotype, with darker colors reflecting higher rankings and lighter colors reflecting lower rankings. The genotype ranking was adjusted accordingly IPCAs used in the WAASB assessment, which were conspicuous in three IPCAs for yield trait and yield components. The genotype groups were identified easily, according to those that had the same performance levels and stability, through the use of genotypes colors (Figure 4C). The genotypes G01, G02, G05, G07, G08, G09, and G011; G12, G13, G14, G15, G16, G17, and G019; G01, G07, G08, G10, G12, G13, and G014; and G01, G07, G08, G10, G12, G13, and G14 were more stable and showed the lowest WAASB values within the same cluster for NS, NKS, TKW and GY, respectively (based on three or more IPCAs). The most visible change was in G10 for the TKW trait, and in G06 and G08 for the NKS trait when using the IPCA1. These genotypes were considered the form most stable for these two traits when, alternatively, three or more IPCAs were used. This reflects the ability of the WAASB index to compile the variations of IPCAs that promote stability. The clusters’ WAASB ratio was used to identify groups of genotypes with similar performance; the best group was G02, G05, G08, and G09 for NS, G08, G12, G16 and G19 for NKS, G02, G04, and G10 for TKW, and G02, G04, G05, G08, G10, G13 and G18 for GY. These results were consistent or largely converged with the WAASB results (Figure 4D).
3.6. Drought-Stress-Tolerance Indices in GY Trait
3.6.1. Indices’ Values and Correlation between GY and Stress-Tolerance Indices
The G02 and G04 genotypes are more tolerant (the difference between non-stressful and drought stress is minimal), while the G15 and G19 genotypes are more sensitive (Table S4). The r value between GY under non-stressful (Yp) and drought-stress (Ys) conditions coupled with drought-tolerance indicators for three planting seasons was computed to determine the better-suited tolerance indices (Table 4). The r value was positively significant between Yp and Ys (0.431), suggesting that it can be used to identify high-productivity genotypes in Yp and Ys. SSI, RDE, and PYR had a negative correlation with Ys but a positive correlation with Yp; thus, selection based on these indices will strengthen productivity under non-stressed environments but decrease productivity under less stressful environments. YSI showed a positive and significant association with Ys but a negative association with Yp. Therefore, these are more effective indices to classify tolerant and sensitive genotypes. They can also be useful indices for classifying the higher and lower stability of genotypes under Ys. Ten (STI, STIm, YI, MP, GMP, HM, MRP, REI, SWPI, and SNPI) indices showed positive and significant associations with Yp and Ys, so they can be utilized for detecting genotypes that are highly productive in both cases (Table 4).
Table 4.
Correlation between GY and stress-tolerance indices.
3.6.2. PCA and Biplot Analysis
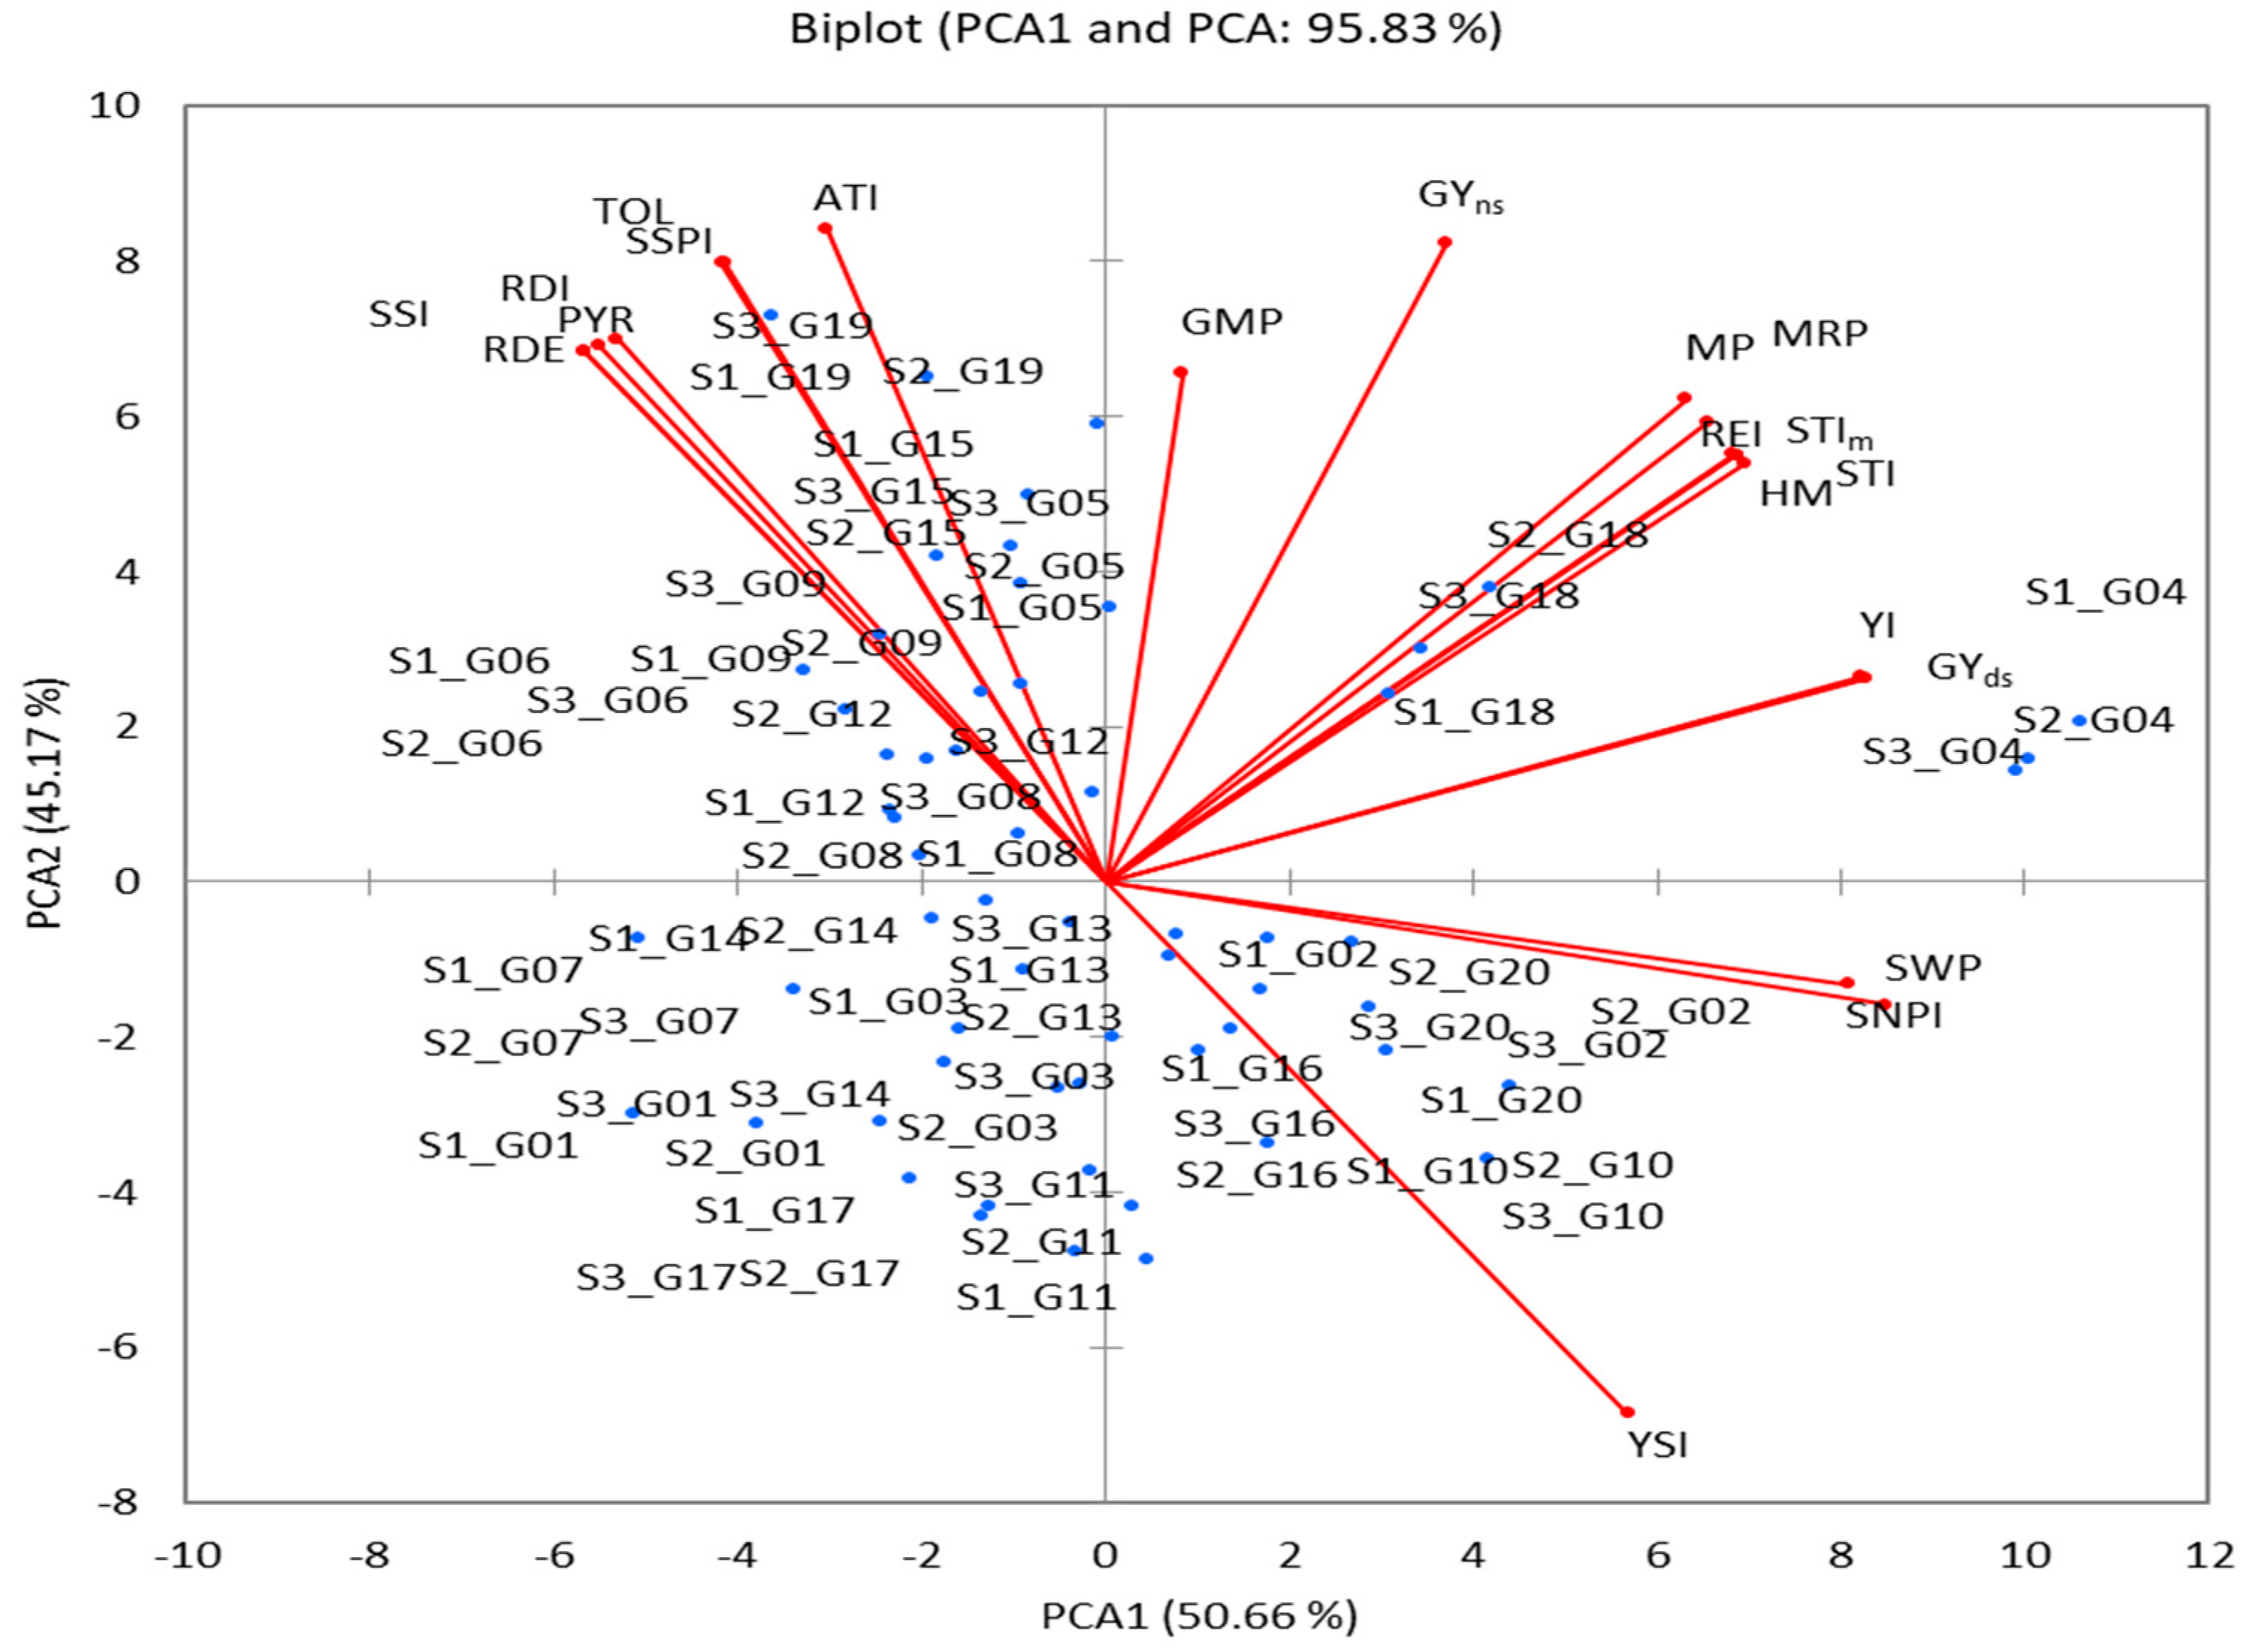
PCA was performed using GY mean performance of (Yp and Ys) and the 18 drought-tolerance indicators for the designation of the most important indices and addressed the problems of multicollinearity (r = 1 or close to it) as shown in Table 4. The first two PCAs showed an eigenvalue of >1 and contributed 95.83% of the total variation (PCA1 contributed 50.66%, and PCA2 contributed 45.16% (Table 5)). Out of 20 variables, PCA1 exhibited a positive correlation with 13, PCA2 exhibited a positive correlation with 17, and 10 variables exhibited a positive correlation with PCA1 and PCA2 (Table 5 and Figure 5). However, the squared cosine result values were ≥0.513. This explains why PCA1 was related to 10 variables (GY(s), STI, STIm, YI, MP, HM, MRP, REI, SWPI, and SNPI) and PCA2 was related to the 10 other variables (GY (p), TOL, SSPI, SSI, YSI, RDI, GMP, PYR, RDE, and ATI) (Table 5). PCA1 and PA2 biplots were used to compare genotypes and the correlations among variables (Figure 5). Based on the greater PCA1 being higher (positive) and the PCA2 being lower (negative), genotypes G02, G10, G16, and G20 are stable under Yp and Ys conditions, while genotypes G05, G06, G08, G09, G12, G15, and G19 perform less well or are drought-sensitive under stress. The genotypes G04 and G18 had the highest PCA and were identified as the most drought tolerant; they were influenced by stress indices viz., GMP, STI, STIm, YI, MP, HM, MRP, and REI.
Table 5.
PCA of 20 wheat genotypes for the GY trait and eighteen tolerance indices.

Figure 5.
PCA Biplot based on correlation matrix of 20 wheat genotypes for the GY trait and eighteen tolerance indices.
3.6.3. Hierarchical Clustering and Linear Discriminant Analyses
Based on the PCA results and after addressing the problems of multicollinearity, the indices GMP, STI, MP, HM, MRP, and REI were used to group the genotypes into six clusters (Figure 6). The genotypes that belonged to the same cluster had more parallels, which increased among clusters where higher alterations in the values of variables were noted. Cluster M contained four genotypes (G02, G08, G10, and G15), cluster S contained five genotypes (G06, G09, G12, G13, G16, and G20), cluster HS contained six genotypes (G01, G03, G07, G11, G14, and G17), cluster T contained two genotypes (G05 and G19), and cluster HT contained two genotypes (G04 and G18). Discriminant analysis was used to determine which of the six groups was most credible (Table 6). Discriminant analysis showed that the prior and posterior categories were identical in the 19 genotypes used (% correct = 95%). However, in cross-validation, the prior categories differed, in terms of their posterior results, in six genotypes (proportion of 30%) and were compatible in fourteen genotypes (% correct = 70.00%).
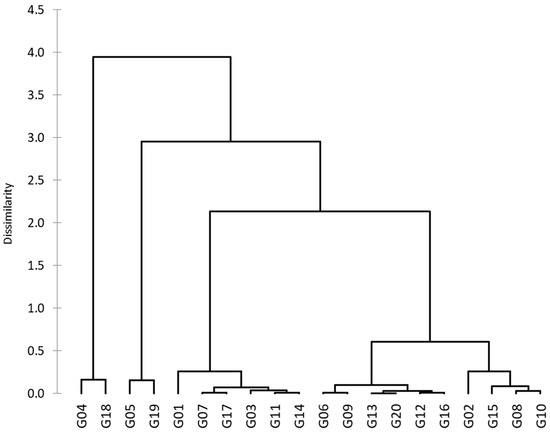
Figure 6.
The hierarchical clustering of 20 wheat genotypes based on the Euclidean distance for six tolerance indices.
Table 6.
Posterior probability of membership in drought groupings by DA with six tolerance indices.
4. Discussion
Worldwide, and particularly in Arab regions, agriculture is confronted with a great number of challenges such as water crises, climate change, and a lack of production, despite many factors that enable agricultural production to achieve sustainable development [36]. Universally, abiotic stress is the most damaging factor to the growth and production of crops. Drought stress is one of the outcomes of climate change that causes significant damage to the growth and productivity of wheat, especially when it occurs during a decisive phase in a plant’s life [9,11,37]. The breeding of highly productive and highly stable drought-tolerant genotypes is the major objective and the primary concern of plant breeders who seek to help humanity achieve food security [14,38]. This study evaluated yield and yield component traits in 20 spring wheat genotypes under two conditions (non-stressful and drought stress) for three seasons and found that drought stress negatively affects the four traits (Figure 1 and Figure 2). GEN:ENV can challenge the efficiency of selection due to varying genotype rankings in METs, notably for genetically complicated traits, to avoid bias and diminishing selection gains necessitates the use of METs [31,39]. This study highlighted the challenge of selecting wheat genotypes that balance stability and high performance through innovative statistical approaches that help us understand genetic parameters and detect genotypes less affected by climate changes. The value (more than 53% from total) exceeded the value (less than 14% from total) for yield and yield component traits, indicating the correct circumstances for genotype selection during the different stages of the breeding program. Approximately 46% of the in the NS trait is attributed to and , reducing heritability (Table 2). The rgen-env value is relatively similar for NS (0.78) and GY (0.77), with studies suggesting that a high value points to simple interaction, while TKW shows lower correlations (0.44). Therefore, a low value is not preferred for choosing genotypes [14,40,41]. The h2ems values of the genotypes ranged from moderate to high, the h2pm values were mixed and high, h2gm values were high, and h2piepho and h2cullis values were very high, showing a dramatic increase in genetic variation (accuracy level of more than 0.94). This high accuracy points to a high predictive capacity for genetic value [8,31,41]. The genotypic CVs were two to three times the residual CVs; therefore, the ratio was greater than 1. This is proof that there was little variation within the environment [14,21].
The AMMI-ANOVA findings showed significant variations in the GEN:ENV for the four traits under the six ENVs (three seasons × two treatments), and the genotypes’ performance in the three seasons was uneven for both treatments but converged under the same treatment (Table 3). In most of the genotypes, the reduction was very clear in yield and yield component traits under drought stress compared to these traits under non-stressful conditions (Figure 1). Earlier studies indicated that wheat genotype performance varied dramatically under stressful condition [8,20,42]. Genotype performance is determined by genetic and environmental factors, and the high ability of multi-environment trials (METs) to demonstrate statistical differences is the critical factor in the selection of genotypes that are the most convenient and reliable in modern breeding programs [42,43]. To achieve this goal, it is necessary to use statistically appropriate models that have high prediction abilities to understand this GEI complexity [14,20,21,43,44,45], which was the focus of our study.
The reliability of predictions for genotype performance (the predicted and absolute values are close together) is decisive in recommending the appropriate genotypes for mega-environments [14,21,46]. The results for the non-stressful (ENV1, ENV3, and ENV5) environments were comparable, and similar findings were observed for the drought stress (ENV2, ENV4, and ENV6) environments. However, the differences were most clearly observed for genotypes in drought-stress environments compared to non-stressful (Figure 1) environments. AMMI-ANOVA for ENVs, GENs, and GEN:ENV indicated highly significant disparities for yield and yield components, suggesting that the GEN performance varies depending on the ENV type (Table 3). The GEN:ENV relationship was of a crossover type and exerted a large influence on GEN performance, so plant breeders are still searching for a genotype with genetic stability. Biplots have the advantage of using all IPCA axes, thus allowing GEN:ENV not maintained in IPCA1 to be included in the genotypes’ ranking [14,21]. In this study, AMMI indicated that the environment SS was partitioned into three significant components (IPCA1–IPCA3) with a percentage of 100.00%.
In this study, I have shown a comparison between the predicted (AMMI model) and absolute values, indicating the greater reliability of MET analysis. Han et al. [33] stated that assessments using the AMMI model are as close as possible to the “true” value; therefore, predictive precision deserves our special attention for model profiling in MET analysis [14,21,47]. I found that the NS trait showed distinct differences compared with NKS, TKW, and GY, which showed minor variations (Figure 1) that were attributed to heritability (Table 2). The TKW and GY traits showed very low variations between predicted and observed values compared to the NS and NKS traits (as a result of heritability). The biplots visualized the genotypes’ ranking [21,23,48]. The AMMI1 biplot explained the interaction between environments, which made it clear that when far away from its origin and when possessing a longer vector, higher interaction was indicated (as in the case of ENV2 and ENV3 for the NS trait; ENV2 for the NKS trait; ENV2 and ENV3 for the TKW trait; and ENV1, ENV3, ENV5, and ENV6 for the GY trait). On the other hand, in environments that were close to their origin and possessed shorter vectors, lower interaction was indicated [13,19,20,42,43,49]. The three non-stressful (ENV1, ENV3, and ENV5) environments had a correlation that was mostly positive (the angle among the vectors was less than 90°), and the three drought-stress (ENV2, ENV4, and ENV6) environments provided similar findings (Figure 3). This suggests that the GEI effects tend to be in the same range and independent when applying them under comparable circumstances, except for ENV1 and ENV3 for the NS trait and ENV2 and ENV4 for the NKS and TKW traits, which demonstrated negative correlations (the angle between the vectors was greater than 90°). The GGE biplot polygon was used to describe the discriminativeness and representativeness (DR) of genotypes in METs, which fall in the top right quartile of the polygon and have high DR. They are considered the most desirable genotypes. A vertical projection from the GEN to the ENV vector indicates the extent of the interaction with the ENVs [14,19,20]. Thus, the eight genotypes for NS, five genotypes for NKS, nine genotypes for TKW, and nine genotypes for GY are considered as unstable with the six environments used, as shown in Figure 3. The G20 genotype was observed to be unstable with the four (NS, NKS, TKW, and GY) traits, the G19 genotype was observed to be unstable with three (NS, TKW, and GY) traits, the G16 was observed to be unstable with the NS and NKS traits, and the G15 genotype was observed to be unstable with the TKW and GY traits.
The novel WAAS biplot (WAASB) model combines the AMMI and BLUP models to demonstrate the GEI, which has a unique way of selecting the genotypes with the best performance and stability by taking into account all IPCAs from the singular value decomposition (SVD) of the matrix of GEI effects, resulting from a linear mixed-effect model [8,13,21,24,40]. Depending on the WAAS and trait values, a WAAS biplot was used to determine high-performing and stable genotypes. These fell in the bottom right quartile (Sector IV) of the biplot (Figure 4). The (trait × WAAS) biplot provides a full explanation of combining the high-performance and stable genotypes in a two-dimensional plot, keeping in mind the five IPCAs (Figure 4C). I believe that this is a promising way to discover high-performance and stable genotypes in prospective studies. Consequently, this method can be utilized in future hybridization programs to choose the donors’ parents. For example, in a future study, I expect to crossbreed the genotype G16 (which demonstrates high performance and is stable for NKS and TKW) with any of the G01, G02, G05, G09, G15, and G18 (high-performance and stable for NS) genotypes to obtain new genotypes combining the three traits into an ideotype (which results in high performance and stable genotypes for GY). This method can lead to minimized superfluous accounts and will make it easier to make recommendations for ideotype cultivars [8,40,50]. The (GY × WAAS) biplot also revealed high-yield and stable genotypes, i.e., G02, G04, G05, G08, G10, and G18 (Figure 4C). The heatmap also revealed stable genotypes based on IPCAs and the WAASB × trait, with darker colors reflecting higher rankings and lighter colors reflecting lower rankings (Figure 4C). The genotype groups were identified easily, according to those that had the same performance levels and stability, through the use of genotype colors [13]. The heatmap (Figure 4D) for genotype ranking (WAASB × trait) based on the weights of the stability (WAASB) and mean performance (trait) were consistent or largely converged with the (WAASB × trait) results [8,13,21]. This is very important in the breeding program, as the breeder may want to confer preference to a high-performance genotype at the cost of stability or, conversely, confer preference to a stable genotype at the cost of performance. Thus, Figure 4 should help breeders and agronomists with decision making and recommendations on the selection of genotypes that have the same mean performance and stability [21]. The stable and high-performance genotypes can be used in the ongoing development of varieties and in prospective breeding programs for the development of high-performance and drought-stress-tolerant varieties.
The AMMI-ANOVA findings showed significant variations in the GEI in this study, and the genotype performance varied under both conditions (non-stressful and drought stress), which revealed that each genotype responded differently to yield and yield components under the two treatments. Based on the variability in genotypes, several ways are used by plant breeders to select high-productivity genotypes under conditions of stress, which are referred to as “selection indices” or stress-tolerance index (STI), utilized in numerous studies to identify genotypes that can stand up to drought stress [25,26,34,51]. Lower values in TOL, SSPI, SSI, ATI, and RDI indicate more tolerant genotypes, while the opposite is true for sensitive genotypes (Table S4). The tolerance level increases with a deficiency in these values, but the results of these values cannot distinguish between genotypes that have higher productivity [25,34]. Consequently, the G02 and G04 genotypes are more tolerant (the difference between their performance under non-stressful conditions and drought-stress conditions is minimal), while the G15 and G19 genotypes are more sensitive. According to Shabani et al. [52] and Erdemcı [53], STI is the most suitable variable for choosing tolerant genotypes. A better genotype performance under non-stressful and drought-stress conditions is indicated by higher values for MP, GMP, and STI. The genotypes G04 and G15 had the highest values. The genotype G04 had the highest productivity under drought stress among all the genotypes. Kamrani et al. [54] and Basavaraj et al. [55] also reported comparable findings and proposed that genotypes that were more productive and more drought-tolerant could be selected using high values of STI, MRP, and GMP as indices. Scientists need access to the most suitable indices for drought-stress tolerance; therefore, I carried out a correlation coefficient analysis for GY under non-stressful (Yp) and drought-stress (Ys) conditions and for drought-stress indices. Yp and Ys both had a positive correlation, so high-performance genotypes were easily identifiable from Yp and Ys (the outcome of Yp is effective for choosing Ys indirectly). The SSI, RDE, and PYR had a negative correlation with Ys but a positive correlation with Yp; thus, selection based on these indices will strengthen productivity in non-stressful environments but decrease productivity in stressful environments (Table 4). In total, 10 indices showed positive and significant association with Yp and Ys. As a result, these indices can be utilized for detecting genotypes that are highly productive in both cases. Our results were compatible with those reported in [25,54,55].
PCA can be used for the selection of the best-yielding genotypes under non-stressful and drought-stress conditions. PCA reveals the links between all variables at once, decreases the number of variables (choosing the best ones), and addresses the problems of multicollinearity [10,56,57]. The first two PCAs showed an eigenvalue of >1 (the basis for the selection of the components) and contributed 95.83% of the total variation (Table 5). PCA1 was positively associated with 13 variables (including major Yp and Ys) which are used to select genotypes of high-yield and drought-tolerant varieties, and PCA2 was positively associated with 17 variables used to select genotypes of drought-sensitive varieties (Table 5 and Figure 5). A PCA1 and PA2 biplot was used to compare genotypes with variables. This biplot illustrated the fact that the genotypes G02, G10, G16, and G20 were stable under Yp and Ys conditions; the genotypes G05, G06, G08, G09, G12, G15, and G19 were drought-sensitive; and the genotypes G04 and G18 were the most drought-tolerant. Based on the drought-tolerance indices (GMP, STI, MP, HM, MRP, REI), the 20 genotypes were grouped into five clusters. The highest value of indices was found in two genotypes (G04 and G18) of cluster HT, followed by two genotypes (G05 and G19) of cluster T (Figure 6). Several researchers have used hierarchical clustering to rank the drought-tolerant genotypes [7,25,58,59,60] without verifying the accuracy of their rankings. To validate the categories, I used discriminant analysis, which showed that previously, (M) differed in terms of the posterior (S) in the genotype (G08), and the identical ratio was 95% (Table 6). However, in cross-validation ranking, previous differences were found in the posterior in six genotypes (a proportion of 30%), and these were compatible in fourteen genotypes (% correct = 70.00%). Therefore, discriminant analysis is regarded as an important statistical instrument for verifying genotype categories [10,12,61]. However, when comparing our previous study [7] with the current one, I found differences in some outputs due to several reasons, including statistical methods, traits used, and the number of seasons. So, the study suggests that combining statistical approaches that consider both stability and high performance can significantly enhance the reliability of recommendations for new wheat genotypes. This information is crucial for breeding programs aiming to develop wheat genotypes that can withstand drought-stress conditions while maintaining high yield and stability.
5. Conclusions
In this study, 20 wheat genotypes in three seasons under non-stressful and drought-stress conditions were evaluated, with a total of six ENVs, and I observed that under drought stress, the genotypes differed in their productivity. Productivity was reduced in cases of water deficit. Multivariate selection yielded an insightful perspective on estimating genetic parameters. The broad-sense heritability ranged from 0.54 to 0.82 based on expected mean squares and ranged from 0.60 to 0.90 based on plot mean, but in the other three ways, it was usually greater than 0.90. The high values of () revealed the effect that it has on the expression of traits. Genotypes varied in their production capacity under non-stressful and drought-stress conditions. The best genotype group (G02, G05, G08, G10, and G18) was selected as stable and high-performance for GY by WAASB and WAASB-GY under the six ENVs. The tolerance indices showed that G02, G04, G05, G18, and G19 are genotypes with a suitable yield under non-stressful and drought-stress conditions. In essence, combining approaches that take into consideration stability and high performance can contribute significantly to enhancing the reliability of recommendations for novel wheat genotypes.
Supplementary Materials
The following supporting information can be downloaded at: https://www.mdpi.com/article/10.3390/d16080489/s1, Tables S1 and S2: Names, codes and pedigree of the 20 bread wheat genotypes; Table S3: Monthly agro-climatological data at the experimental location during the growing seasons. Table S4: Grain yield/plot (ton ha−1), Yp and Ys under non-stressful and drought-stress conditions and stress-tolerance indices of different wheat genotypes.
Funding
The researchers supporting project number RSP2024R298, King Saud University, Riyadh, Saudi Arabia.
Institutional Review Board Statement
Not applicable.
Data Availability Statement
All data is contained within the article or Supplementary Materials.
Acknowledgments
The authors extend their appreciation to the researchers supporting project number RSP2024R298, King Saud University, Riyadh, Saudi Arabia.
Conflicts of Interest
The author declares no conflict of interest.
References
- Farhad, M.; Kumar, U.; Tomar, V.; Bhati, P.K.; Krishnan, N.J.; Barek, V.; Brestic, M.; Hossain, A. Heat stress in wheat: A global challenge to feed billions in the current era of the changing climate. Front. Sustain. Food Syst. 2023, 7, 1203721. [Google Scholar] [CrossRef]
- Bank, T.W. Population Growth (Annual%). 2019. Available online: https://data.worldbank.org/indicator/SP.POP.GROW (accessed on 5 September 2020).
- Yale University. World Population: 2020 Overview. YaleGlobal Online. 2020. Available online: https://archive-yaleglobal.yale.edu/content/world-population-2020-overview (accessed on 6 September 2020).
- Romdhane, W.B.; Al-Ashkar, I.; Ibrahim, A.; Sallam, M.; Al-Doss, A.; Hassairi, A. Aeluropus littoralis stress-associated protein promotes water deficit resilience in engineered durum wheat. Heliyon 2024, 10, e30933. [Google Scholar] [CrossRef]
- Al-Ashkar, I.; Al-Doss, A.; Ullah, N. Accelerating Crop Improvement through Speed Breeding. In Climate-Resilient Agriculture, Vol 1: Crop Responses and Agroecological Perspectives; Springer: Cham, Switzerland, 2023; pp. 821–847. [Google Scholar]
- McElrone, A.J.; Choat, B.; Gambetta, G.A.; Brodersen, C.R. Water uptake and transport in vascular plants. Nat. Educ. Knowl. 2013, 4, 6. [Google Scholar]
- Al-Ashkar, I.; Al-Suhaibani, N.; Abdella, K.; Sallam, M.; Alotaibi, M.; Seleiman, M.F. Combining Genetic and Multidimensional Analyses to Identify Interpretive Traits Related to Water Shortage Tolerance as an Indirect Selection Tool for Detecting Genotypes of Drought Tolerance in Wheat Breeding. Plants 2021, 10, 931. [Google Scholar] [CrossRef]
- Al-Ashkar, I.; Sallam, M.; Almutairi, K.F.; Shady, M.; Ibrahim, A.; Alghamdi, S.S. Detection of High-Performance Wheat Genotypes and Genetic Stability to Determine Complex Interplay between Genotypes and Environments. Agronomy 2023, 13, 585. [Google Scholar] [CrossRef]
- Xu, Z.H.; Lai, X.J.; Ren, Y.; Yang, H.M.; Wang, H.B.; Wang, C.S.; Xia, J.Q.; Wang, Z.L.; Yang, Z.Y.; Geng, H.W.; et al. Impact of Drought Stress on Yield-Related Agronomic Traits of Different Genotypes in Spring Wheat. Agronomy 2023, 13, 2968. [Google Scholar] [CrossRef]
- Sallam, M.; Ghazy, A.; Al-Doss, A.; Al-Ashkar, I. Combining Genetic and Phenotypic Analyses for Detecting Bread Wheat Genotypes of Drought Tolerance through Multivariate Analysis Techniques. Life 2024, 14, 183. [Google Scholar] [CrossRef]
- Barakat, M.; El-Hendawy, S.; Al-Suhaibani, N.; Elshafei, A.; Al-Doss, A.; Al-Ashkar, I.; Ahmed, E.; Al-Gaadi, K. The genetic basis of spectral reflectance indices in drought-stressed wheat. Acta Physiol. Plant. 2016, 38, 227. [Google Scholar] [CrossRef]
- Al-Ashkar, I.; Sallam, M.; Ghazy, A.; Ibrahim, A.; Alotaibi, M.; Ullah, N.; Al-Doss, A. Agro-Physiological Indices and Multidimensional Analyses for Detecting Heat Tolerance in Wheat Genotypes. Agronomy 2023, 13, 154. [Google Scholar] [CrossRef]
- Ahmed, M.S.; Majeed, A.; Attia, K.A.; Javaid, R.A.; Siddique, F.; Farooq, M.S.; Uzair, M.; Yang, S.H.; Abushady, A.M. Country-wide, multi-location trials of Green Super Rice lines for yield performance and stability analysis using genetic and stability parameters. Sci. Rep. 2024, 14, 9416. [Google Scholar] [CrossRef]
- Al-Ashkar, I.; Sallam, M.; Ibrahim, A.; Ghazy, A.; Al-Suhaibani, N.; Ben Romdhane, W.; Al-Doss, A. Identification of Wheat Ideotype under Multiple Abiotic Stresses and Complex Environmental Interplays by Multivariate Analysis Techniques. Plants 2023, 12, 3540. [Google Scholar] [CrossRef]
- Raman, A.; Verulkar, S.; Mandal, N.; Variar, M.; Shukla, V.; Dwivedi, J.; Singh, B.; Singh, O.; Swain, P.; Mall, A.; et al. Drought yield index to select high yielding rice lines under different drought stress severities. Rice 2012, 5, 31. [Google Scholar] [CrossRef] [PubMed]
- Qaseem, M.F.; Qureshi, R.; Muqaddasi, Q.H.; Shaheen, H.; Kousar, R.; Roder, M.S. Genome-wide association mapping in bread wheat subjected to independent and combined high temperature and drought stress. PLoS ONE 2018, 13, e0199121. [Google Scholar] [CrossRef] [PubMed]
- Hamidou, F.; Halilou, O.; Vadez, V. Assessment of Groundnut under Combined Heat and Drought Stress. J. Agron. Crop Sci. 2013, 199, 1–11. [Google Scholar] [CrossRef]
- Al-Ashkar, I.; Alotaibi, M.; Refay, Y.; Ghazy, A.; Zakri, A.; Al-Doss, A. Selection criteria for high-yielding and early-flowering bread wheat hybrids under heat stress. PLoS ONE 2020, 15, e0236351. [Google Scholar] [CrossRef] [PubMed]
- Singamsetti, A.; Shahi, J.; Zaidi, P.; Seetharam, K.; Vinayan, M.; Kumar, M.; Singla, S.; Shikha, K.; Madankar, K. Genotype× environment interaction and selection of maize (Zea mays L.) hybrids across moisture regimes. Field Crops Res. 2021, 270, 108224. [Google Scholar] [CrossRef]
- Al-Ashkar, I.; Sallam, M.; Al-Suhaibani, N.; Ibrahim, A.; Alsadon, A.; Al-Doss, A. Multiple Stresses of Wheat in the Detection of Traits and Genotypes of High-Performance and Stability for a Complex Interplay of Environment and Genotypes. Agronomy 2022, 12, 2252. [Google Scholar] [CrossRef]
- Olivoto, T.; Lúcio, A.D.; da Silva, J.A.; Marchioro, V.S.; de Souza, V.Q.; Jost, E. Mean performance and stability in multi-environment trials I: Combining features of AMMI and BLUP techniques. Agron. J. 2019, 111, 2949–2960. [Google Scholar] [CrossRef]
- Olivoto, T.; Nardino, M.; Meira, D.; Meier, C.; Follmann, D.N.; de Souza, V.Q.; Konflanz, V.A.; Baretta, D. Multi-trait selection for mean performance and stability in maize. Agron. J. 2021, 113, 3968–3974. [Google Scholar] [CrossRef]
- Meier, C.; Meira, D.; Marchioro, V.S.; Olivoto, T.; Klein, L.A.; Souza, V.Q.d. Selection gain and interrelations between agronomic traits in wheat F 5 genotypes. Rev. Ceres 2019, 66, 271–278. [Google Scholar] [CrossRef]
- Pour-Aboughadareh, A.; Sanjani, S.; Nikkhah-Chamanabad, H.; Mehrvar, M.R.; Asadi, A.; Amini, A. Identification of salt-tolerant barley genotypes using multiple-traits index and yield performance at the early growth and maturity stages. Bull. Natl. Res. Cent. 2021, 45, 117. [Google Scholar] [CrossRef]
- Lamba, K.; Kumar, M.; Singh, V.; Chaudhary, L.; Sharma, R.; Yashveer, S.; Dalal, M.S. Heat stress tolerance indices for identification of the heat tolerant wheat genotypes. Sci. Rep. 2023, 13, 10842. [Google Scholar] [CrossRef] [PubMed]
- Kumar, S.; Kumar, H.; Gupta, V.; Kumar, A.; Singh, C.M.; Kumar, M.; Singh, A.K.; Panwar, G.S.; Kumar, S.; Singh, A.K. Capturing agro-morphological variability for tolerance to terminal heat and combined heat–drought stress in landraces and elite cultivar collection of wheat. Front. Plant Sci. 2023, 14, 1136455. [Google Scholar] [CrossRef]
- Pour-Aboughadareh, A.; Yousefian, M.; Moradkhani, H.; Moghaddam Vahed, M.; Poczai, P.; Siddique, K.H. iPASTIC: An online toolkit to estimate plant abiotic stress indices. Appl. Plant Sci. 2019, 7, e11278. [Google Scholar] [CrossRef] [PubMed]
- Al-Ashkar, I.; Alderfasi, A.; El-Hendawy, S.; Al-Suhaibani, N.; El-Kafafi, S.; Seleiman, M.F. Detecting Salt Tolerance in Doubled Haploid Wheat Lines. Agronomy 2019, 9, 211. [Google Scholar] [CrossRef]
- El-Hennawy, M.; Abdalla, A.; Al-Ashkar, I. Production of doubled haploid wheat lines (Triticum aestivum L.) using anther culture technique. Ann. Agric. Sci. 2011, 56, 63–72. [Google Scholar] [CrossRef]
- Dempster, A.P.; Laird, N.M.; Rubin, D.B. Maximum likelihood from incomplete data via the EM algorithm. J. R. Stat. Soc. Ser. B 1977, 39, 1–22. [Google Scholar] [CrossRef]
- Sampaio Filho, J.S.; Olivoto, T.; Campos, M.S.; de Oliveira, E.J. Multi-trait selection in multi-environments for performance and stability in cassava genotypes. Front. Plant Sci. 2023, 14, 1282221. [Google Scholar] [CrossRef] [PubMed]
- Vargas, M.; Crossa, J. The AMMI Analysis and Graphing the Biplot; Biometrics Statistics Unit, CIMMYT: Hyderabad, India, 2000. [Google Scholar]
- Han, B.; Ma, X.; Cui, D.; Wang, Y.; Geng, L.; Cao, G.; Zhang, H.; Han, L. Comprehensive Evaluation and Analysis of the Mechanism of Cold Tolerance Based on the Transcriptome of Weedy Rice Seedlings. Rice 2020, 13, 12. [Google Scholar] [CrossRef]
- Bennani, S.; Nsarellah, N.; Jlibene, M.; Tadesse, W.; Birouk, A.; Ouabbou, H. Efficiency of drought tolerance indices under different stress severities for bread wheat selection. Aust. J. Crop Sci. 2017, 11, 395–405. [Google Scholar] [CrossRef]
- Olivoto, T.; Lúcio, A.D. metan: An R package for multi-environment trial analysis. Methods Ecol. Evol. 2020, 11, 783–789. [Google Scholar] [CrossRef]
- Fu, J.; Bowden, R.L.; Jagadish, S.V.K.; Prasad, P.V.V. Genetic variation for terminal heat stress tolerance in winter wheat. Front. Plant Sci. 2023, 14, 1132108. [Google Scholar] [CrossRef] [PubMed]
- Boliko, M.C. FAO and the Situation of Food Security and Nutrition in the World. J. Nutr. Sci. Vitaminol. 2019, 65, S4–S8. [Google Scholar] [CrossRef] [PubMed]
- Cattivelli, L.; Rizza, F.; Badeck, F.W.; Mazzucotelli, E.; Mastrangelo, A.M.; Francia, E.; Mare, C.; Tondelli, A.; Stanca, A.M. Drought tolerance improvement in crop plants: An integrated view from breeding to genomics. Field Crops Res. 2008, 105, 1–14. [Google Scholar] [CrossRef]
- Farshadfar, E.; Mohammadi, R.; Farshadfar, M.; Dabiri, S. Relationships and repeatability of drought tolerance indices in wheat-rye disomic addition lines. Aust. J. Crop Sci. 2013, 7, 130–138. [Google Scholar]
- Olivoto, T.; Lúcio, A.D.; da Silva, J.A.; Sari, B.G.; Diel, M.I. Mean performance and stability in multi-environment trials II: Selection based on multiple traits. Agron. J. 2019, 111, 2961–2969. [Google Scholar] [CrossRef]
- Szareski, V.J.; Carvalho, I.R.; Kehl, K.; Levien, A.M.; Nardino, M.; Dellagostin, S.M.; Demari, G.H.; Lautenchleger, F.; Villela, F.A.; Pedó, T.; et al. Adaptability and stability of wheat genotypes according to the phenotypic index of seed vigor. Pesqui. Agropecu. Bras. 2018, 53, 727–735. [Google Scholar] [CrossRef]
- Popović, V.; Ljubičić, N.; Kostić, M.; Radulović, M.; Blagojević, D.; Ugrenović, V.; Popović, D.; Ivošević, B. Genotype× environment interaction for wheat yield traits suitable for selection in different seed priming conditions. Plants 2020, 9, 1804. [Google Scholar] [CrossRef] [PubMed]
- Mebratu, A.; Wegary, D.; Mohammed, W.; Teklewold, A.; Tarekegne, A. Genotype× environment interaction of quality protein maize hybrids under contrasting management conditions in Eastern and Southern Africa. Crop Sci. 2019, 59, 1576–1589. [Google Scholar] [CrossRef]
- Senguttuvel, P.; Sravanraju, N.; Jaldhani, V.; Divya, B.; Beulah, P.; Nagaraju, P.; Manasa, Y.; Prasad, A.S.H.; Brajendra, P.; Gireesh, C.; et al. Evaluation of genotype by environment interaction and adaptability in lowland irrigated rice hybrids for grain yield under high temperature. Sci. Rep. 2021, 11, 15825. [Google Scholar] [CrossRef]
- Balla, K.; Karsai, I.; Bonis, P.; Kiss, T.; Berki, Z.; Horvath, A.; Mayer, M.; Bencze, S.; Veisz, O. Heat stress responses in a large set of winter wheat cultivars (Triticum aestivum L.) depend on the timing and duration of stress. PLoS ONE 2019, 14, e0222639. [Google Scholar] [CrossRef]
- Olivoto, T.; Diel, M.I.; Schmidt, D.; Lucio, A.D. MGIDI: A powerful tool to analyze plant multivariate data. Plant Methods 2022, 18, 121. [Google Scholar] [CrossRef]
- Zeng, L.; Shannon, M.C.; Grieve, C.M. Evaluation of salt tolerance in rice genotypes by multiple agronomic parameters. Euphytica 2002, 127, 235–245. [Google Scholar] [CrossRef]
- Liu, X.; Yang, Y.; Hou, S.; Men, Y.; Han, Y. The Integration of Genome-Wide Association Study and Homology Analysis to Explore the Genomic Regions and Candidate Genes for Panicle-Related Traits in Foxtail Millet. Int. J. Mol. Sci. 2022, 23, 14735. [Google Scholar] [CrossRef] [PubMed]
- Ebdon, J.; Gauch, H., Jr. Additive main effect and multiplicative interaction analysis of national turfgrass performance trials: I. Interpretation of genotype× environment interaction. Crop Sci. 2002, 42, 489–496. [Google Scholar]
- Olivoto, T.; Nardino, M. MGIDI: Toward an effective multivariate selection in biological experiments. Bioinformatics 2021, 37, 1383–1389. [Google Scholar] [CrossRef]
- Aberkane, H.; Amri, A.; Belkadi, B.; Filali-Maltouf, A.; Valkoun, J.; Kehel, Z. Contribution of Wild Relatives to Durum Wheat (subsp.) Yield Stability across Contrasted Environments. Agronomy 2021, 11, 1992. [Google Scholar] [CrossRef]
- Shabani, A.; Zebarjadi, A.; Mostafaei, A.; Saeidi, M.; Poordad, S.S. Evaluation of drought stress tolerance in promising lines of chickpea (Cicer arietinum L.) using drought resistance indices. Environ. Stress. Crop Sci. 2018, 11, 289–299. [Google Scholar]
- Erdemcı, İ. Investigation of genotype× environment interaction in chickpea genotypes using AMMI and GGE biplot analysis. Turk. J. Field Crops 2018, 23, 20–26. [Google Scholar] [CrossRef]
- Kamrani, M.; Hoseini, Y.; Ebadollahi, A. Evaluation for heat stress tolerance in durum wheat genotypes using stress tolerance indices. Arch. Agron. Soil Sci. 2018, 64, 38–45. [Google Scholar] [CrossRef]
- Basavaraj, P.; Muralidhara, B.; Manoj, C.; Anantha, M.; Rathod, S.; Raju, C.D.; Senguttuvel, P.; Madhav, M.; Srinivasaprasad, M.; Prakasam, V.; et al. Identification and molecular characterization of high-yielding, blast resistant lines derived from Oryza rufipogon Griff. in the background of ‘Samba Mahsuri’rice. Genet. Resour. 2021, 68, 1905–1921. [Google Scholar] [CrossRef]
- Talebi, R.; Fayaz, F.; Naji, A.M. Effective selection criteria for assessing drought stress tolerance in durum wheat (Triticum durum Desf.). Gen. Appl. Plant Physiol. 2009, 35, 64–74. [Google Scholar]
- Al-Ashkar, I.; Ibrahim, A.; Ghazy, A.; Attia, K.; Al-Ghamdi, A.A.; Al-Dosary, M.A. Assessing the correlations and selection criteria between different traits in wheat salt-tolerant genotypes. Saudi J. Biol. Sci. 2021, 28, 5414–5427. [Google Scholar] [CrossRef] [PubMed]
- Mohi-Ud-Din, M.; Hossain, M.A.; Rohman, M.M.; Uddin, M.N.; Haque, M.S.; Dessoky, E.S.; Alqurashi, M.; Aloufi, S. Assessment of Genetic Diversity of Bread Wheat Genotypes for Drought Tolerance Using Canopy Reflectance-Based Phenotyping and SSR Marker-Based Genotyping. Sustainability 2022, 14, 9818. [Google Scholar] [CrossRef]
- El-Rawy, M.A.; Hassan, M.I. Assessment of genetic diversity in durum and bread wheat genotypes based on drought tolerance and SSR markers. Plant Breed. 2021, 9, 89–103. [Google Scholar] [CrossRef]
- Jha, U.C.; Basu, P.; Singh, D. Genetic variation and diversity analysis of chickpea genotypes based on quantitative traits under high temperature stress. Int. J. Bio-Resour. 2015, 6, 700–706. [Google Scholar] [CrossRef]
- De Leon, T.B.; Linscombe, S.; Gregorio, G.; Subudhi, P.K. Genetic variation in Southern USA rice genotypes for seedling salinity tolerance. Front. Plant Sci. 2015, 6, 374. [Google Scholar] [CrossRef]

Disclaimer/Publisher’s Note: The statements, opinions and data contained in all publications are solely those of the individual author(s) and contributor(s) and not of MDPI and/or the editor(s). MDPI and/or the editor(s) disclaim responsibility for any injury to people or property resulting from any ideas, methods, instructions or products referred to in the content. |
© 2024 by the author. Licensee MDPI, Basel, Switzerland. This article is an open access article distributed under the terms and conditions of the Creative Commons Attribution (CC BY) license (https://creativecommons.org/licenses/by/4.0/).