Article

Modeling the Present and Future Geographical Distribution Potential of Dipteronia dyeriana, a Critically Endangered Species from China

1
College of Life Science, Xinyang Normal University, Xinyang 464000, China
2
Department of Plant Biology, University of Ilorin, Ilorin 1515, Nigeria
*
Author to whom correspondence should be addressed.
These authors contributed equally to this work.
Diversity 2024, 16(9), 545; https://doi.org/10.3390/d16090545
Submission received: 17 July 2024 / Revised: 27 August 2024 / Accepted: 2 September 2024 / Published: 4 September 2024
(This article belongs to the Special Issue Biogeography and Macroecology Hotspots in 2024)

Abstract

:
Climate change will have various impacts on the survival and development of species, and it is important to explore whether plants can adapt to future climate conditions. Dipteronia dyeriana is an endangered species with a narrow distribution in Yunnan, characterized by a small population size. However, studies on its current distribution and the impact of climate change on its future survival and distribution are very limited. In this study, the current and future (2050 and 2090) potential habitats under the SSP1-2.6, SSP3-7.0, and SSP5-8.5 scenarios were predicted using both maximum entropy (MaxEnt) and random forest (RF) models based on the current range points of D. dyeriana, soil, topographical, land cover, and climate data. The results showed that the RF model demonstrated significantly higher AUC, TSS, and Kappa scores than the MaxEnt model, suggesting high accuracy of the RF model. Isothermality (bio_3), minimum temperature of the coldest month (bio_6), and annual precipitation (bio_12) are the main environmental factors affecting the distribution of D. dyeriana. At present, the high suitability area of D. dyeriana is mainly concentrated in the eastern part of Yunnan Province and part of southern Tibet, covering an area of 3.53 × 10⁴ km2. Under future climate change scenarios, the total area suitable for D. dyeriana is expected to increase. Although, the highly suitable area has a tendency to decrease. With regards to land use, more than 77.53% of the suitable land area (29.67 × 10⁴ km2) could be used for D. dyeriana planting under different SSP scenarios. In 2090, the centroid shifts of the two models exhibit a consistent trend. Under the SSP1-2.6 scenario, the centroids transfer to the southeast. However, under the SSP3-7.0 and SSP5-8.5 scenarios, the centroids of high suitability areas migrate toward the northwest. In summary, this study enhances our understanding of the influence of climate change on the geographic range of D. dyeriana and provides essential theoretical backing for efforts in its conservation and cultivation.

1. Introduction

Biodiversity is the basis for human survival and sustainable development. However, climate change has been observed to pose risks to biodiversity [1,2]. Alterations in carbon dioxide (CO2) levels, precipitation, and temperature have modified local conditions, leading to the inadaptation of the resident species [3]. Escalating global warming has precipitated the loss and fragmentation of habitats for numerous plant species [4]. Understanding the potential risks faced by endemic, rare, and endangered species due to climate change is a critical inquiry in conservation research. Therefore, it is imperative to investigate changes in the distribution patterns of vulnerable species in response to future climate conditions.
The Dipteronia Oliv. genus is a remarkable example of a relict woody genus that is endemic to China. Initially, it was classified under Sapindaceae sensu lato based on the APGI and II [5,6], and then assigned to the Aceraceae family based on the distinguishing characteristics of its winged fruit [7]. Only two living species exist within this genus, namely Dipteronia dyeriana Henry and D. sinensis Oliv., making it an ideal taxon for studying species formation and evolution [8,9]. D. dyeriana has been designated as a rare and endangered species by the Red List of Threatened Species. The estimated extent of occurrence of this species is 139 km2, with an area of occupancy ranging between 20 and 32 km2 (Red List of Threatened Species, IUCN) [10]. It is predominantly found in scattered locations in southeastern Yunnan and southwestern Guizhou, typically at forest margins between 2000 and 2500 m [11]. The primary threats to this species include habitat deterioration and low genetic diversity [12].
D. dyeriana is an elegant deciduous tree with significant ornamental and economic values. The fruit, a circular samara with wide wings, undergoes a color transformation from light green to red-yellowish-brown during ripening (Figure 1). The seeds are notably rich in fat, and the oil is edible and has been reported to be useful in industrial applications [8]. Additionally, the chemical constituents of this tree are of interest due to their potential bioactive and anti-tumur properties [13]. Previous studies on D. dyeriana have predominantly focused on phylogeography [14], genetic diversity [15], and morphological development [16]. It is also important to investigate how the habitat of D. dyeriana will change under climate change. Such research will provide a scientific foundation for species introduction and in situ or ex situ conservation efforts.
Species Distribution Models (SDMs), also known as niche models, are mathematical models that utilize species occurrence data in conjunction with environmental factors to predict species distributions [17]. Many different SDMs are based on different algorithmic principles. These models estimate species niche preferences within a multidimensional ecological space and project them into selected space-time ranges. The resulting probabilities reflect the degree of habitat suitability, providing insights into the broad-scale species geographic distribution [18,19].
The MaxEnt model is a probabilistic model based on the principle of maximum entropy and is known for its high predictive accuracy. It does not rely on a priori experience and is widely used to predict species distribution [20,21]. The random forest (RF) model predicts outcomes by constructing multiple decision trees and excels in handling complex data and nonlinear relationships. It is considered one of the best machine learning algorithms applied in various fields [22]. Given the small number and narrow distribution of D. dyeriana, the MaxEnt and RF models are more suitable SDMs.
In this study, we used MaxEnt and RF models to predict the potential distribution of D. dyeriana under current and future climate scenarios, identify the primary climatic factors restricting the species’ geographical range, and propose in situ and ex situ conservation strategies under climate change. The study aims to achieve the following scientific objectives: (1) Which of the MaxEnt and RF models is more accurate in predicting the suitable growing areas of D. dyeriana? (2) The geographic distribution of D. dyeriana may be influenced by multiple climatic factors, which are the primary factors affecting its distribution range? (3) As the climate changes, the suitable habitat of D. dyeriana will undergo spatial shifts; are there any new areas that can be designated as ex situ conservation areas for D. dyeriana? The outcomes of our research will serve as a scientific reference for formulating conservation policies concerning D. dyeriana, including strategies for its introduction and prioritizing conservation areas.

2. Experimental Procedures and Methodology

2.1. Species Occurrence Data

The current occurrence records of D. dyeriana were obtained from the published literature, including studies by Bai et al. [23,24], Gao et al. [25], and Ouyang et al. [26] and databases such as the Flora of China and prominent public databases, namely the Plant Photo Bank of China (PPBC; http://ppbc.iplant.cn/, accessed on 5 June 2024), the Flora Reipublicae Popularis Sinicae (FRPS; http://www.iplant.cn/frps, accessed on 5 June 2024), the Global Biodiversity Information Facility (GBIF; https://www.gbif.org/, accessed on 5 June 2024), and the Chinese Virtual Herbarium (CVH; https://www.cvh.ac.cn/index.php, accessed on 5 June 2024). A total of 58 occurrence records were collected. In order to avoid spatial autocorrelation, only one site closest to the center was selected within the grid of 0.5 km × 0.5 km. Finally, 45 occurrence records remained after thinning. The latitude, longitude, and elevation of the 45 sites were collected and used for model calibration and evaluation in the subsequent analyses.

2.2. Environmental Data Sources

Forty environmental factors that could potentially affect the habitat distribution of D. dyeriana were selected, including 19 bioclimatic factors, 3 topographic factors, and 18 soil factors. All data were chosen at the highest spatial resolution (Table S1). The climatic information was downloaded from WorldClim v2.1 (https://worldclim.org/; accessed on 5 June 2024) [27], a reputable and widely used database. Given that D. dyeriana exists exclusively in China, the entire country was designated as the model prediction background. We utilized the current (1970–2000) and projected future climate variables for 2050 (averaged for 2041–2060) and 2090 (averaged for 2081–2100) to represent the potential distributions of D. dyeriana. Three Shared Socioeconomic Pathways (SSP), namely SSP1-2.6, SSP3-7.0, and SSP5-8.5, were adopted, representing sustainable, local, and normal development conditions, respectively [28,29].
Elevation data were obtained from the WorldClim database with a resolution of 30 arc seconds. Aspect and slope data were extracted using ArcGIS 10.4 software, based on a Digital Elevation Model (DEM). Soil data were obtained from the Harmonized World Soil Database version 2.0 (HWSD v2.0) (https://gaez.fao.org/pages/hwsd; accessed on 5 June 2023) [30]. Eighteen soil factors at depths D2 and D3 (20–40 cm and 40–60 cm) were adopted, including soil moisture content, sand content, pH, and carbonate content. (Table 1). Land use and land cover data were downloaded from the latest 2020 dataset of land use types in China from the Data Centre for Resource and Environmental Sciences of the Chinese Academy of Sciences (http://www.resdc.cn/, accessed on 5 June 2024) [31]. The dataset was loaded into ArcGIS 10.4 and reclassified into four categories: 1. Farmland; 2. Woodland; 3. Grassland; 4. Bare land.
High correlation and collinearity among bioclimatic factors can lead to model overfitting, potentially compromising prediction accuracy. To solve this, Pearson correlation analysis and multicollinearity analysis were performed using SPSS software version 26.0. (Armonk, NY, USA: IBM Corp) to identify environmental factors with correlation coefficients exceeding 0.8. This step aims to ensure the selection of independent factors with the most significant impact on the model while reducing redundancy and enhancing the robustness of the analysis [32]. To further mitigate the effects of multicollinearity, factors with a Variance Inflation Factor (VIF) less than 10 and a tolerance greater than 0.1 were selected, which helped to ensure the independence of the factors included in the model. The selection of factors was determined by correlation analysis, eliminating multiple linearity, and principal component analysis [33]. Finally, 11 factors were chosen to predict the potential habitats of D. dyeriana (Table 1). This rigorous approach aims to enhance the precision and reliability of the projected outcomes.

2.3. RF Modeling and Potential Habitat Evaluation

Random Forest (RF) is a machine learning algorithm whose basic unit is a decision tree, developed by Breiman et al. [34]. We employed the “biomod2” package in R software (version 4.2.2, 2023) to generate 1000 pseudo-absences using the geographic distance method, which involved selecting points located 5 km from the actual site based on geographic distribution data. Species presence points were coded as “1” and pseudo-absence points as “0”. We used the “randomForest” package to model the data. Finally, the obtained “.img” format files were imported into ArcGIS for visualization and subsequent analysis.

2.4. MaxEnt Modeling and Potential Habitat Evaluation

The modeling of D. dyeriana distribution in China was performed using MaxEnt 3.4.4 software [35]. The distribution data and environmental factors were converted into ASCII format using ArcGIS 10.4 software (ESRI, Redlands, CA, USA). The occurrence data were partitioned, and 25% were used as test data, while the remaining 75% were allocated as training data [36]. The algorithm was iterated until convergence or for a maximum of 1000 iterations. Additionally, the internal jackknife method of MaxEnt was employed to test and assess the significance of all environmental parameters in predicting the distribution of D. dyeriana.

2.5. Model Evaluation

We assessed the accuracy of the model using the Area Under the Curve (AUC) of the Receiver Operating Characteristic (ROC), True Skill Statistic (TSS), and Cohen’s Kappa (Kappa) [37,38,39], respectively. AUC, TSS, and Kappa were calculated using the default setting of “biomod2” [40]. AUC values range from 0 to 1, with values above 0.9 indicating good performance. Moreover, the True Skill Statistic (TSS) was evaluated between −1 and +1, where a value of ≤0.5 indicates a failed prediction, and 1 indicates the best possible performance [41]. Additionally, Cohen’s Kappa coefficient, ranging from −1 to +1, was calculated, with +1 indicating excellent performance and ≤0.5, indicating less-than-expected consistency [42]. We performed the Mann-Whitney U test using SPSS software (Armonk, NY: IBM Corp) to detect differences between the MaxEnt and RF models [43].
Species distribution maps were visualized in ASCII format using ArcGIS 10.4 software and then converted to raster format. The reclassification tool in ArcGIS 10.4 software was applied, utilizing the natural intermittent grading method to classify the habitat layers of D. dyeriana. The distribution region of D. dyeriana was subsequently categorized into four classes based on the associated fitness index (FI): high suitability area (FI ≥ 0.5), middle suitability area (0.3 ≤ FI < 0.5), low suitability area (0.1 ≤ FI < 0.3), and unsuitable area (FI < 0.1) [44]. A distinct color represents each of the four regions, enabling clear visualization of the distribution patterns. The SDM toolbox 2.4, was utilized to analyze changes in potential distribution areas over time and the migration of the distribution center [45].

3. Results

3.1. Evaluation of the Accuracy of Simulation Results

The results showed that the MaxEnt and RF models produced high prediction accuracies, with average AUC values of 0.994 and 0.998, respectively (Table 2). Furthermore, the TSS and Kappa values for both the MaxEnt and RF models exceeded 0.67, indicating good performance. The RF model demonstrated higher AUC, TSS, and Kappa values than MaxEnt (Table 2), indicating its superior performance over the MaxEnt model.

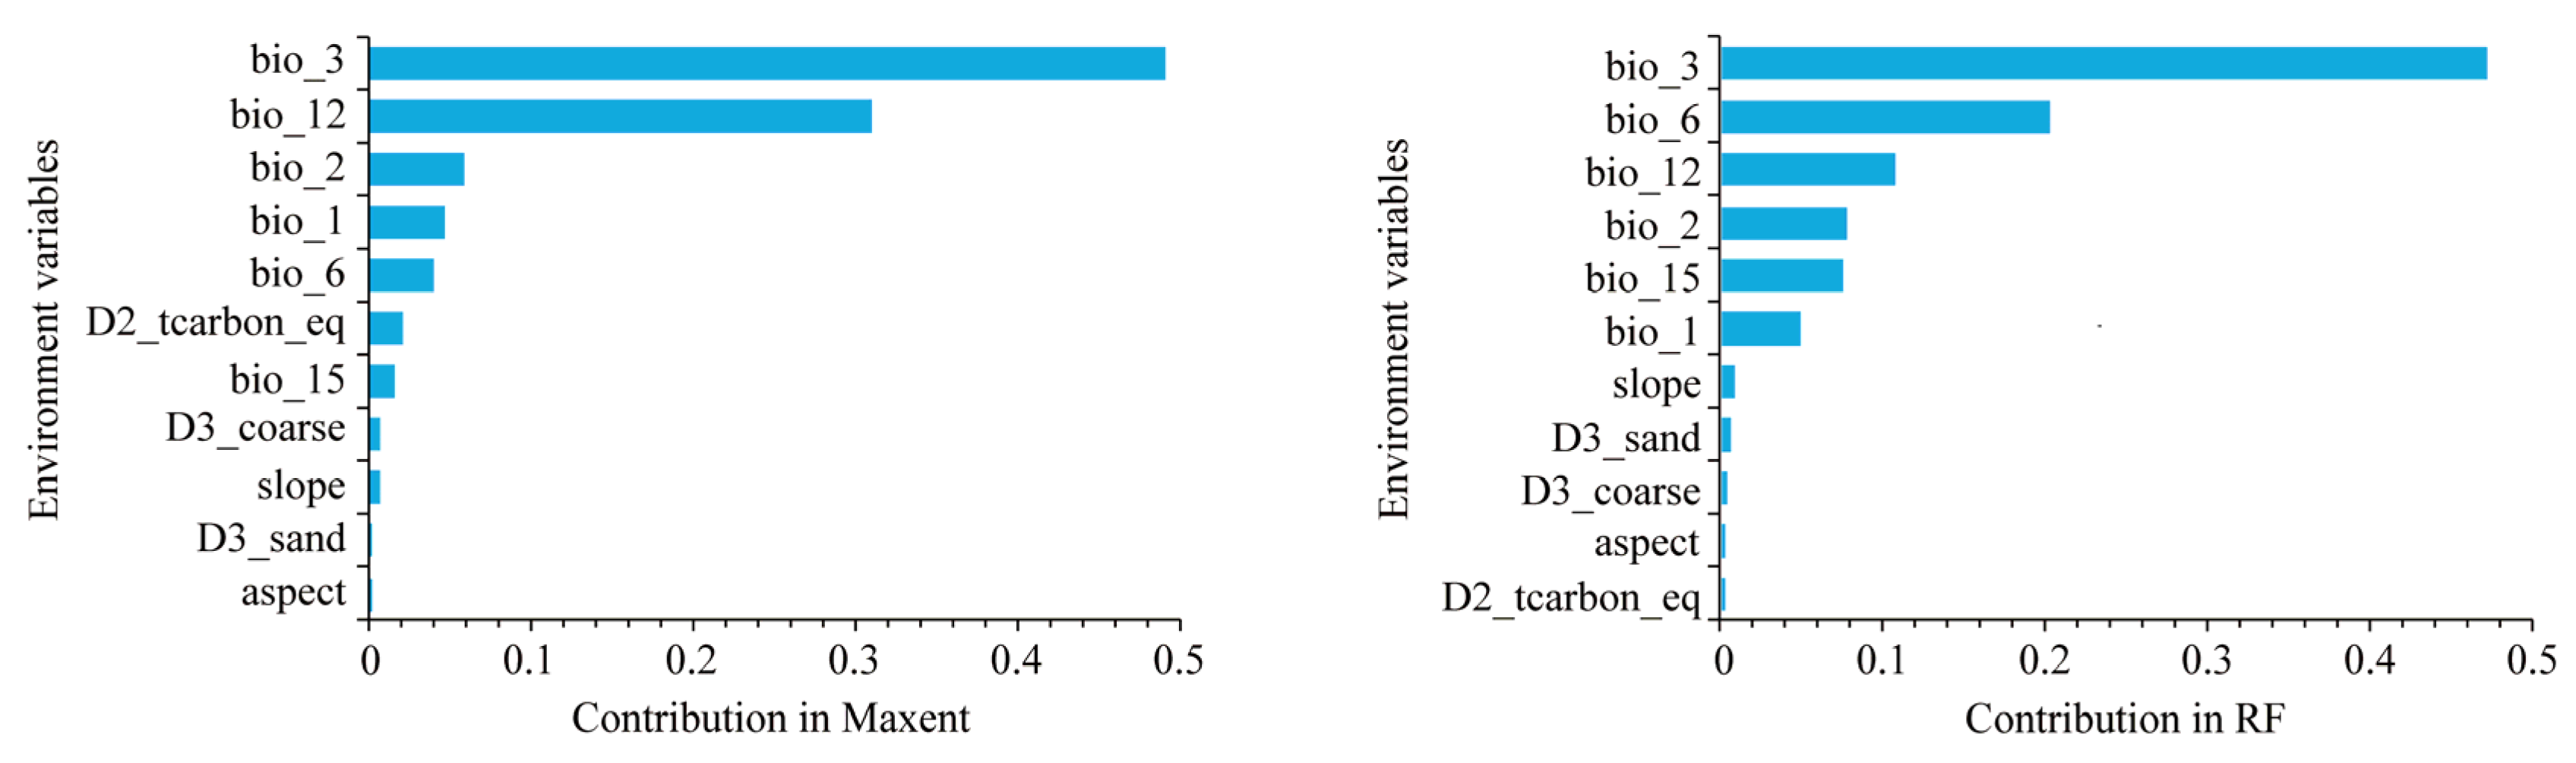
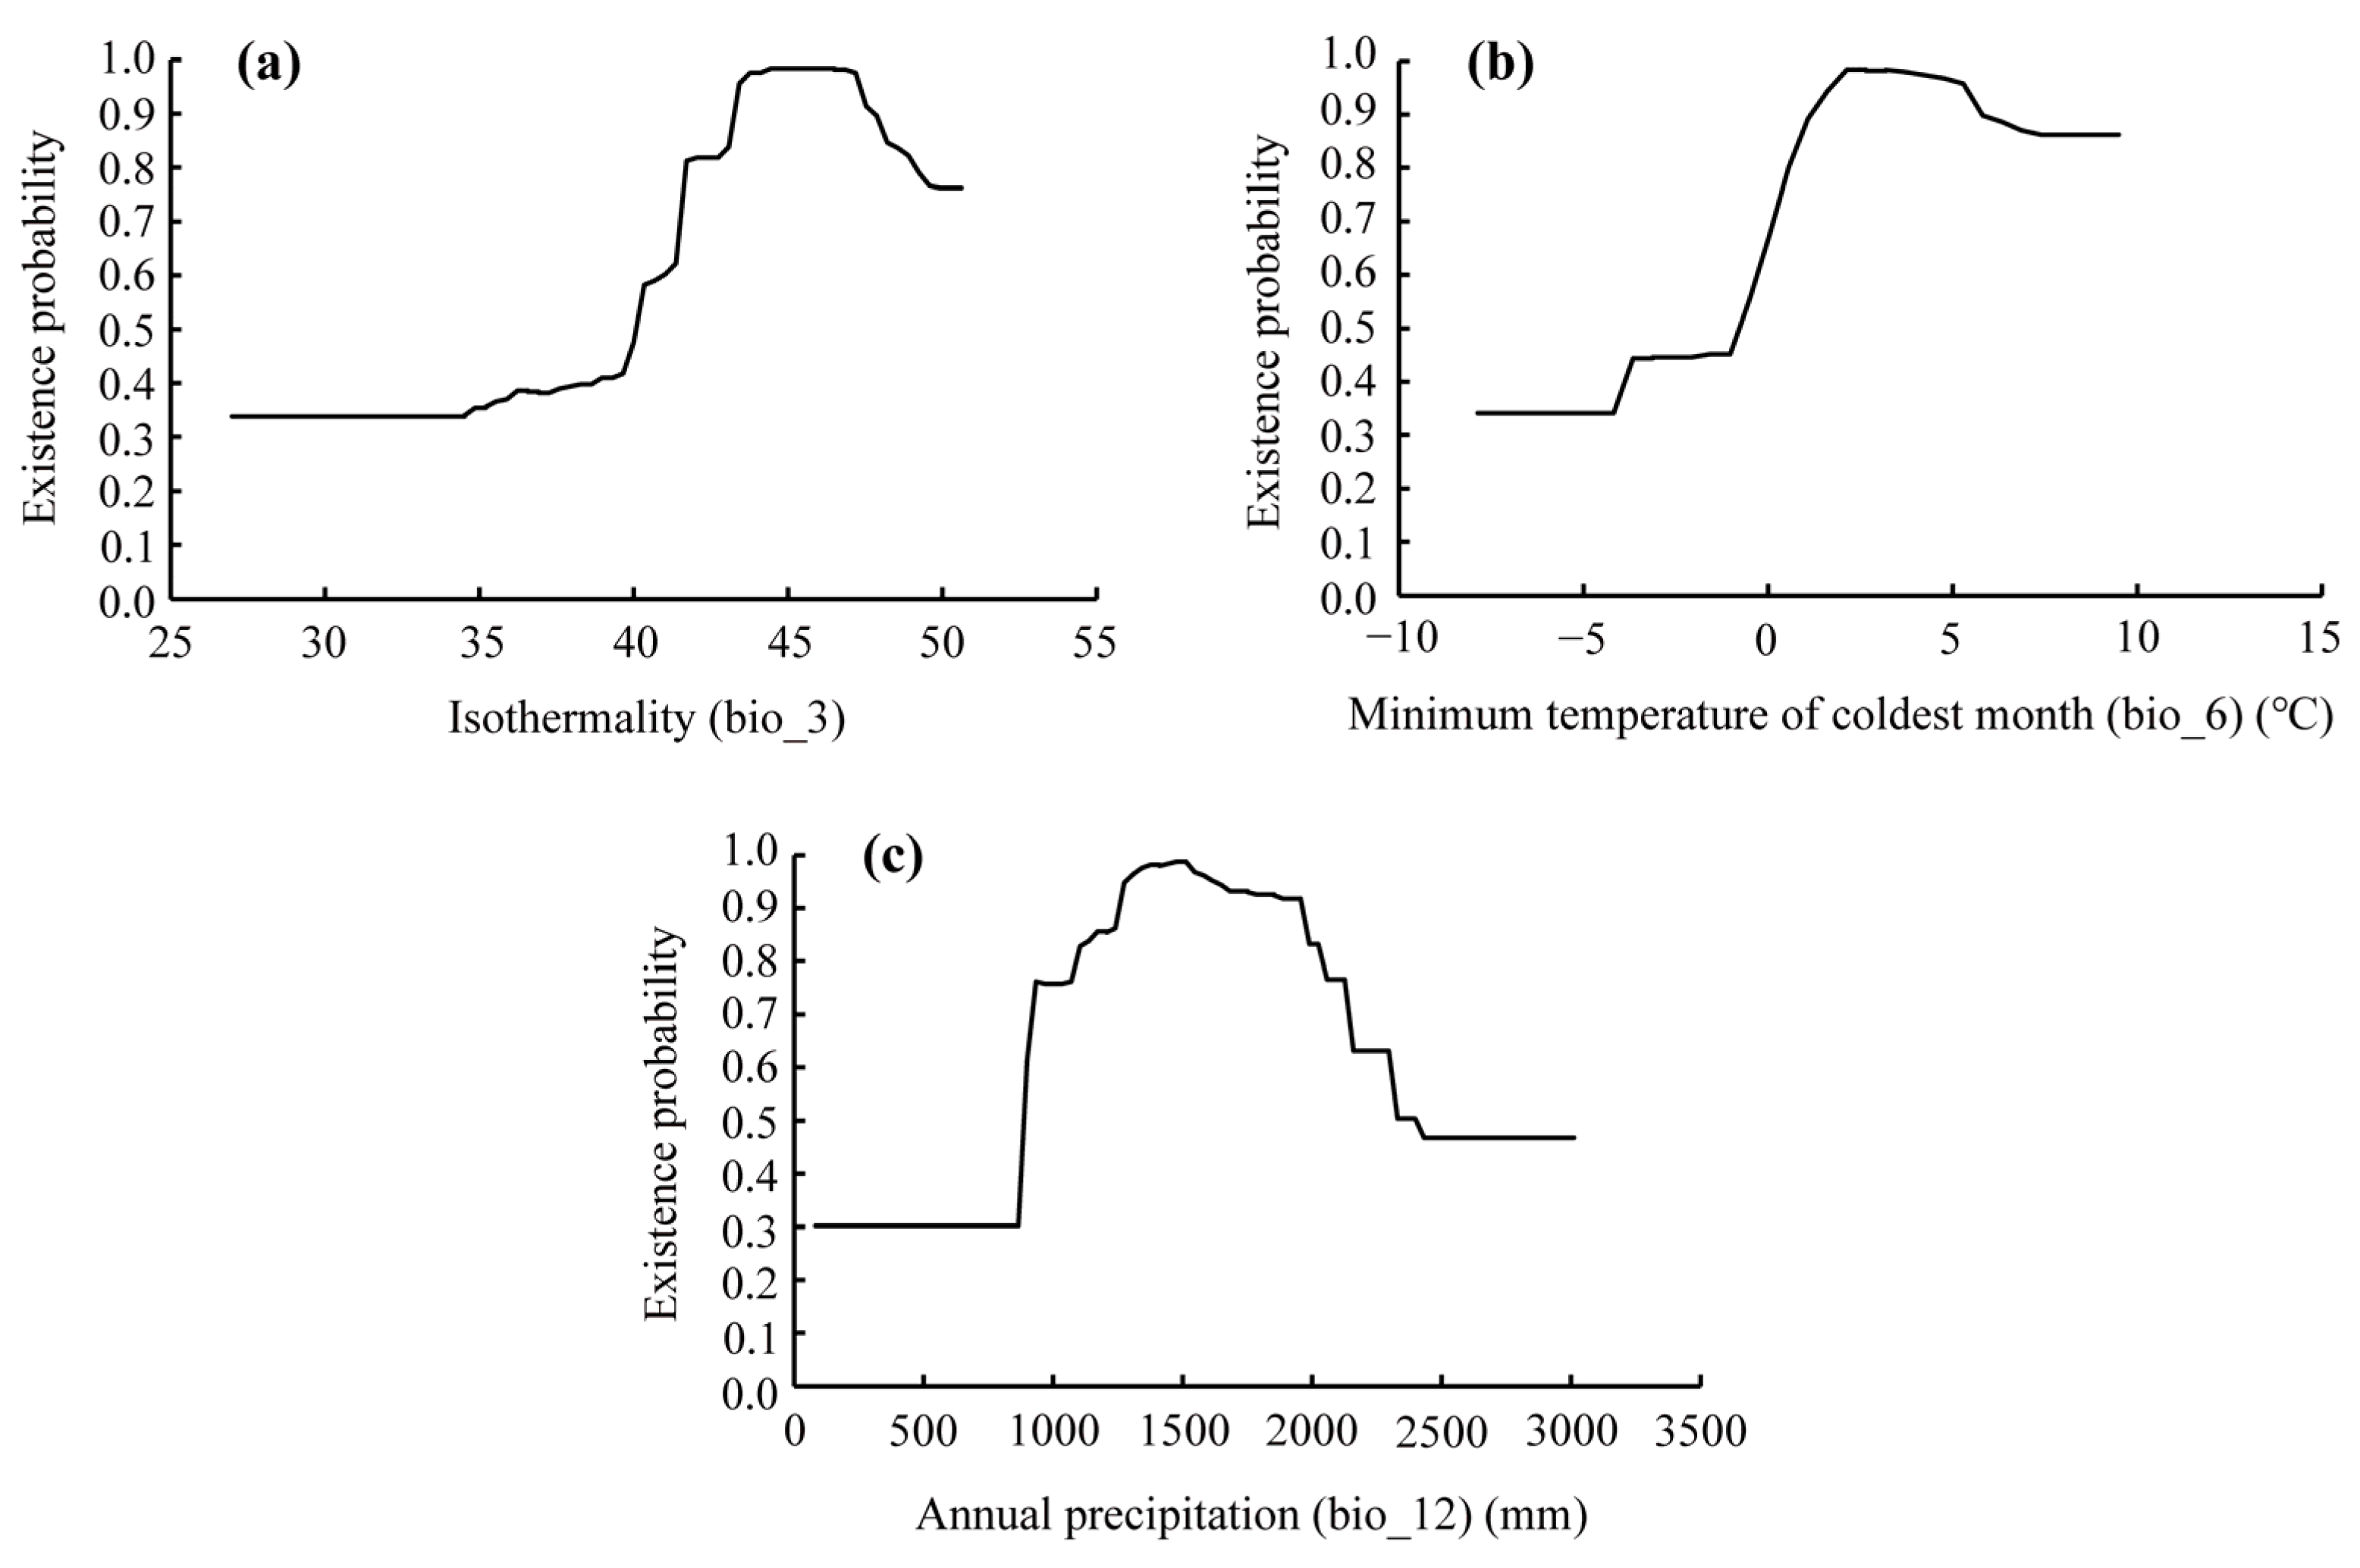
3.2. Environmental Factors in Determining the Distribution of D. dyeriana

This study identified 11 primary environmental factors that significantly influenced the distribution of D. dyeriana (Figure 2). The permutation importance of the two models was different. In the MaxEnt model, climatic variables, soil factors, and topographic factors contributed 96.30%, 2.90%, and 0.80%, respectively. Among these, bio_3 (Isothermality) and bio_12 (Annual Precipitation) were the two most important factors for the distribution of D. dyeriana, with contribution rates of 49.10% and 31.00%, respectively, while the contribution rates of other environmental factors were all less than 10% (Figure 2).
In contrast, in the RF model, climatic variables, soil factors, and topographic factors accounted for 97.97%, 1.04%, and 0.99%, respectively. Bio_3 (47.05%) was also the variable with the maximum influence on the habitat suitability model (RF) for the distribution of D. dyeriana, followed by bio_6 and bio_12, with contribution rates of 20.20% and 10.69%, respectively. In summary, the importance rank of the environmental factors in the distribution of D. dyeriana was climate variables > soil factors > topographic factors. The distribution of D. dyeriana was significantly influenced by bio_3.
The response curve illustrates the relationship between the presence probability of D. dyeriana and environmental factors (Figure 3). The analysis revealed that species viability was significantly enhanced when the probability of presence exceeded 0.5. Specifically, D. dyeriana predominantly occurs when the isothermality (bio_3) is greater than 40.34, the minimum temperature of the coldest month (bio_6) exceeds −0.50 ℃ and annual precipitation (bio_12) ranges from 899.58 to 2398.24 mm.

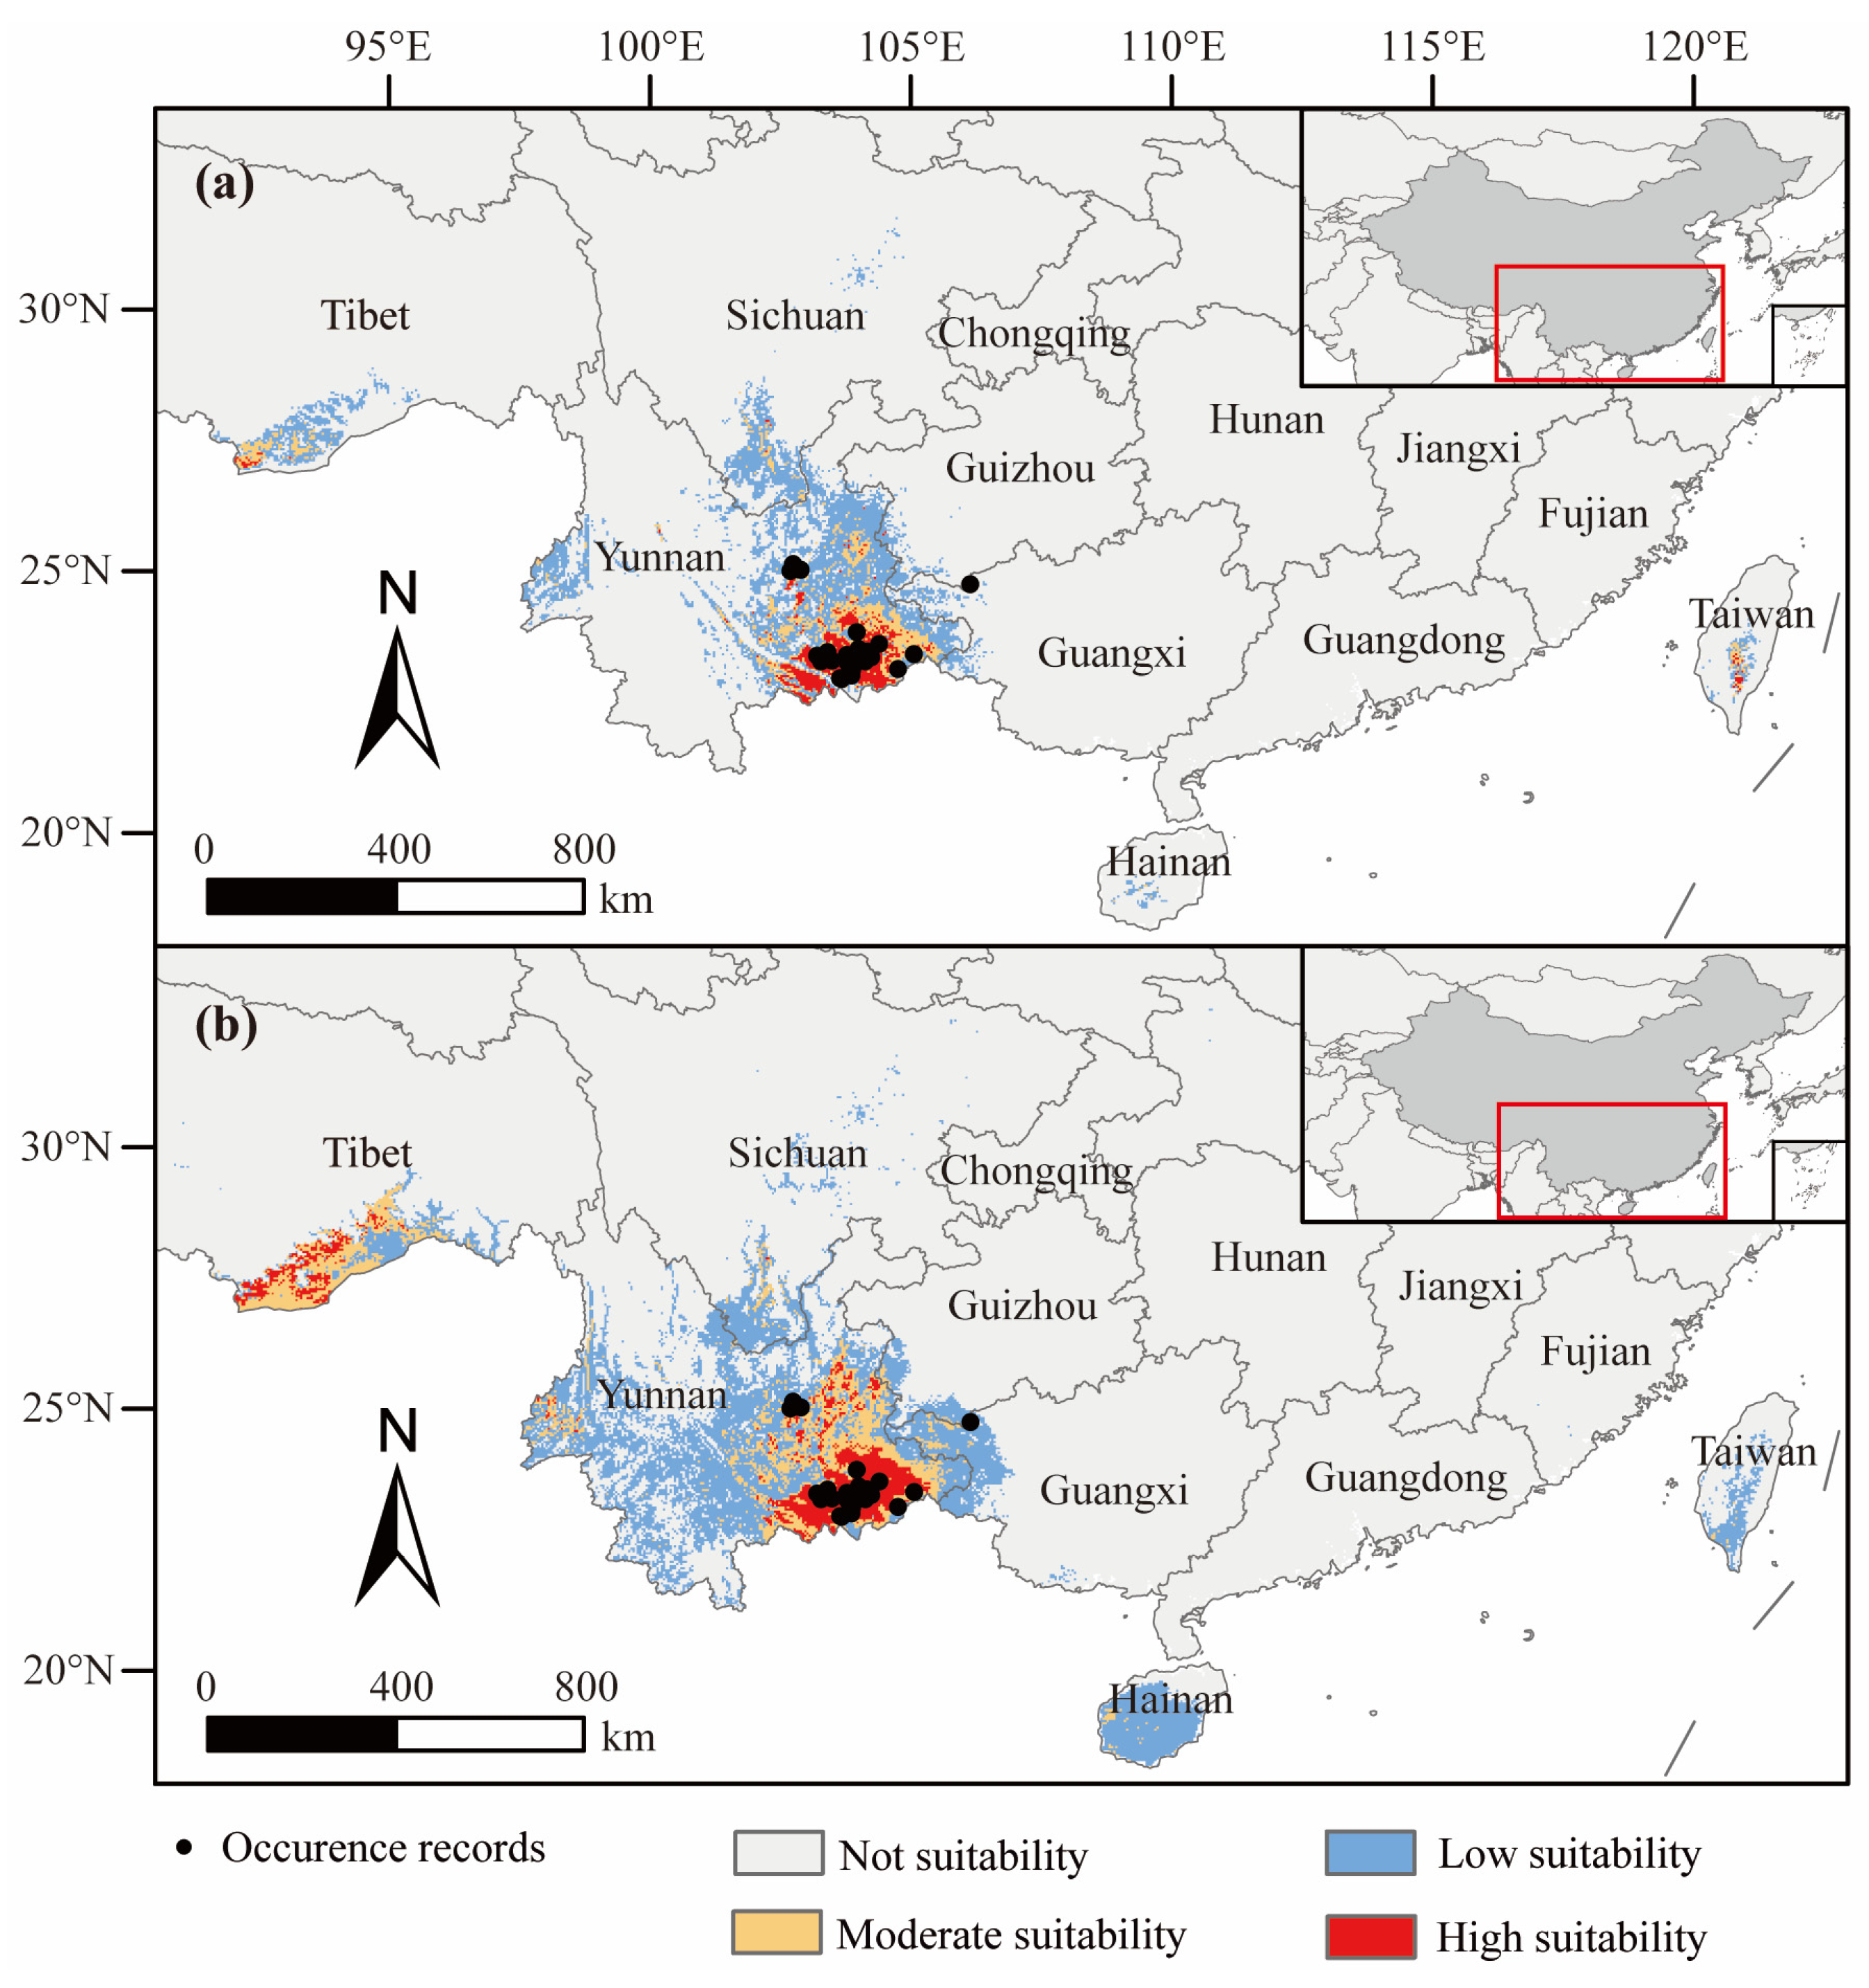
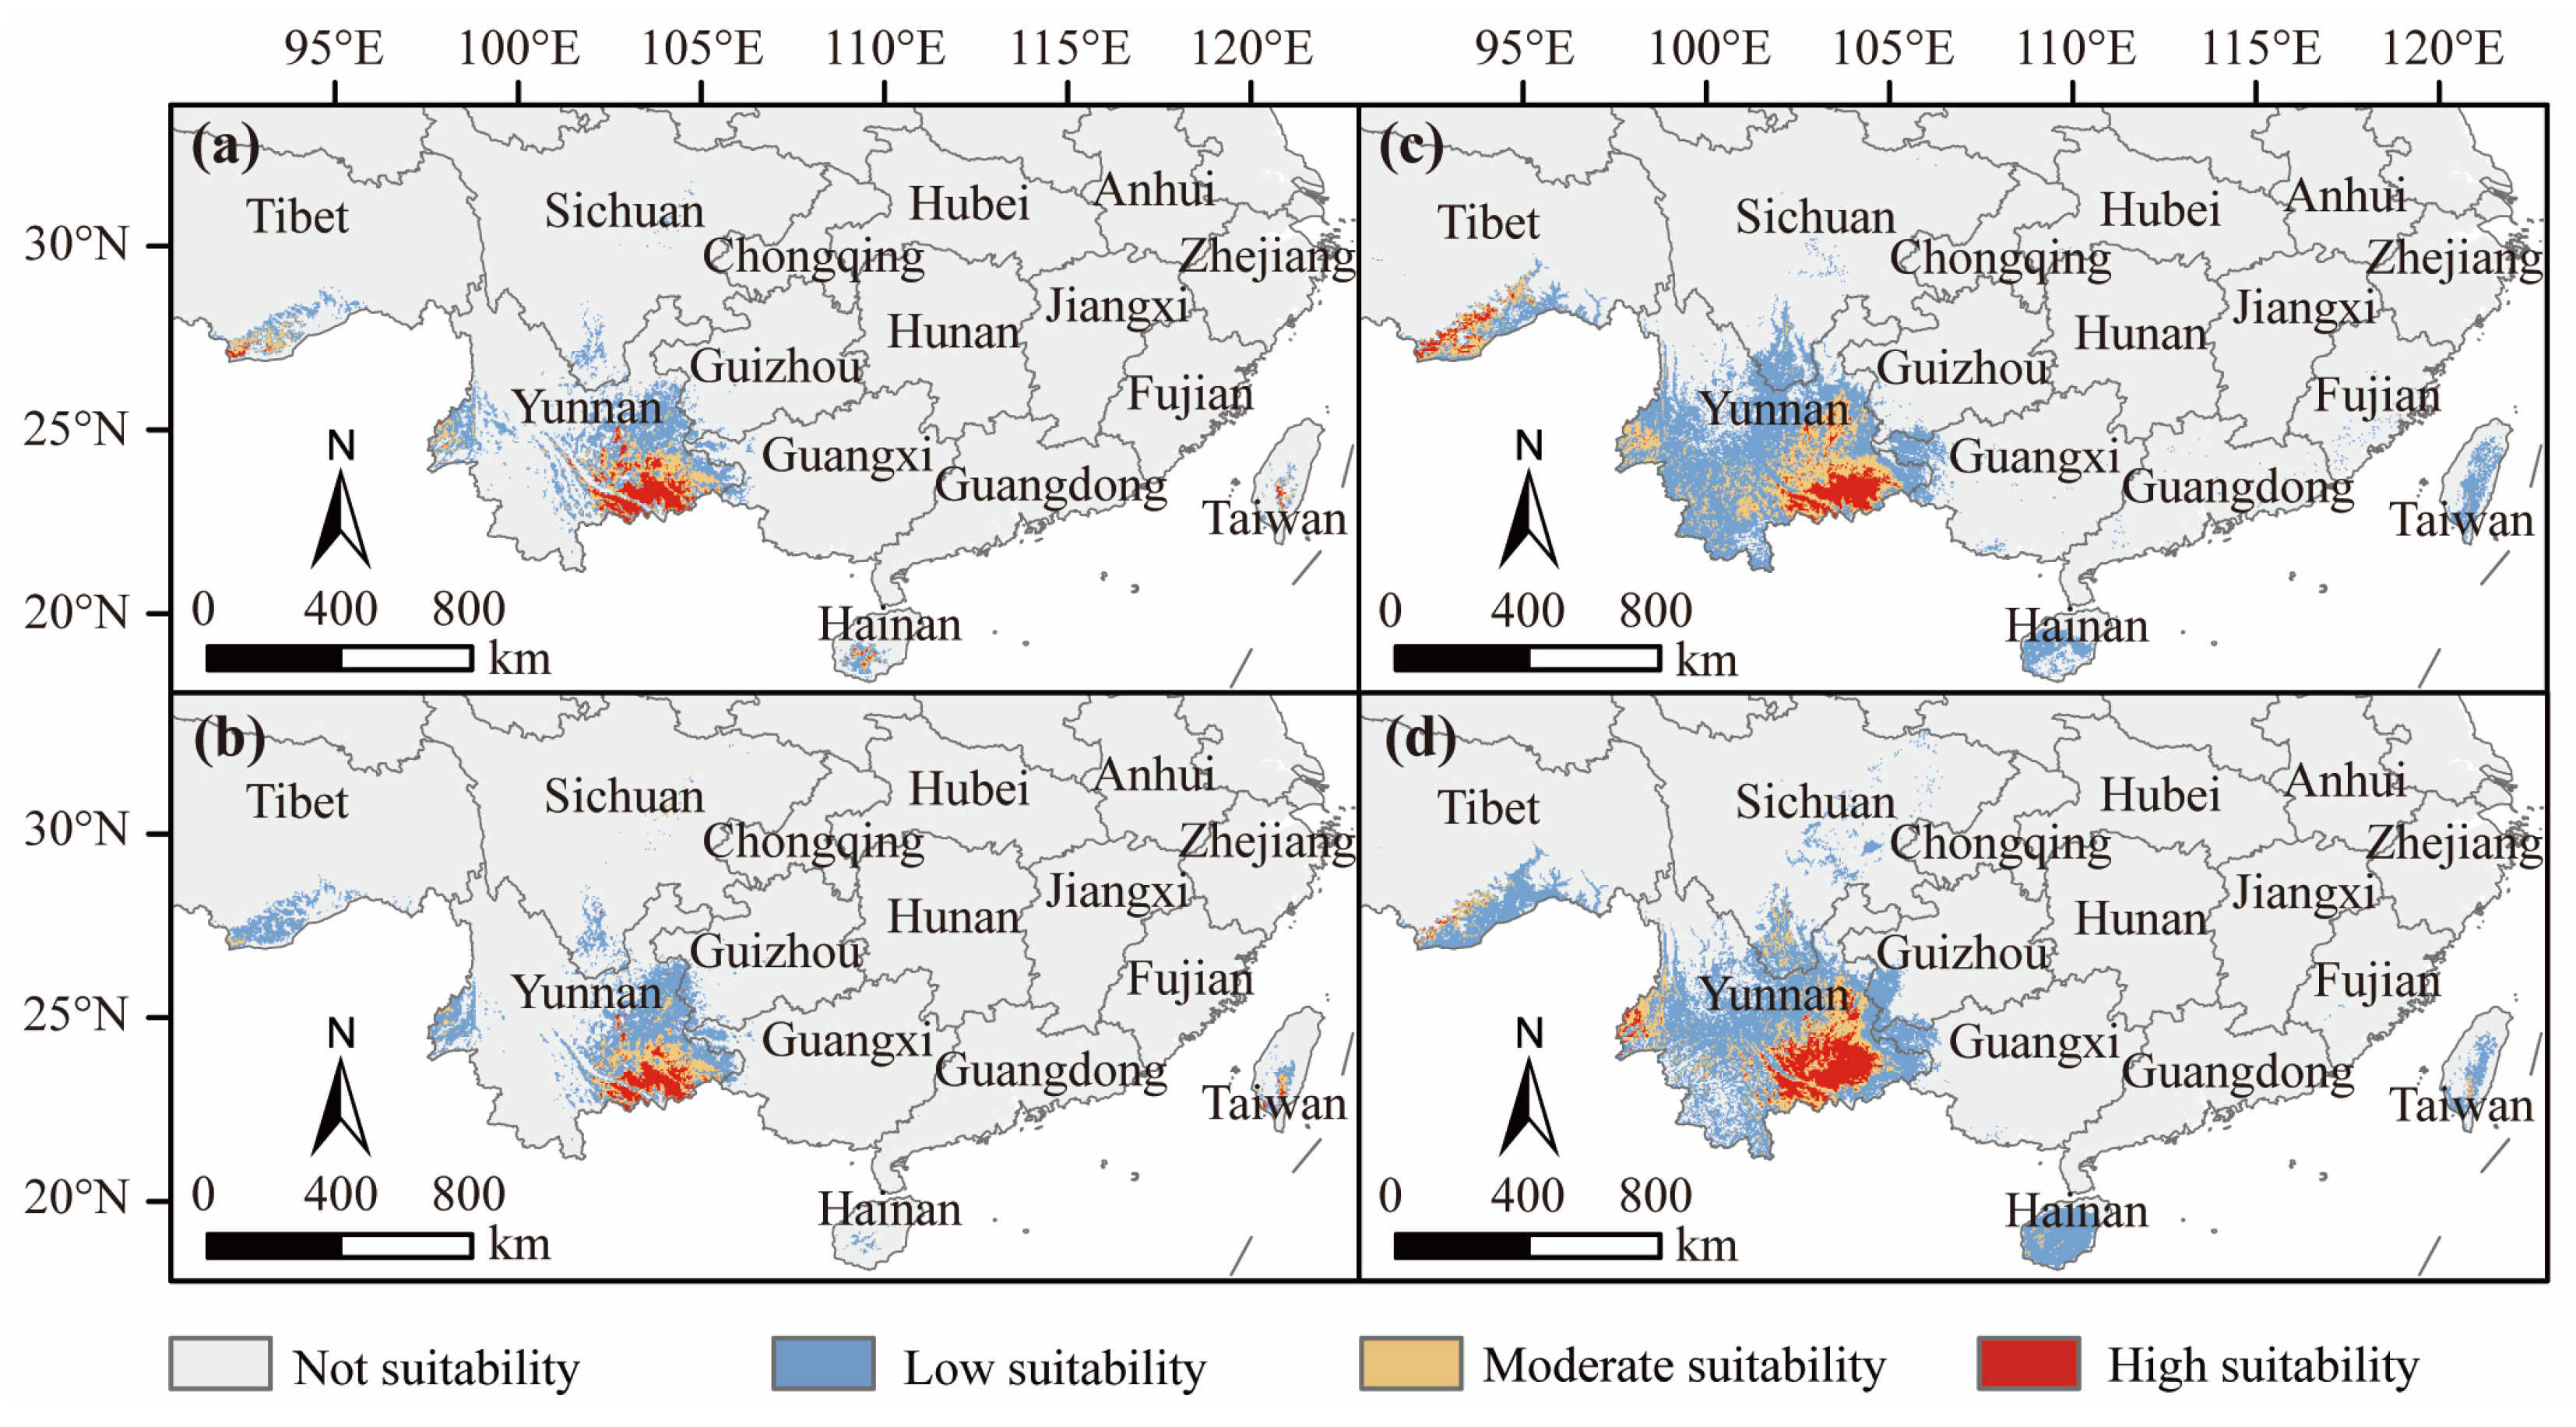
3.3. Suitable D. dyeriana Distribution Areas in the Current Climate

Based on the results of the MaxEnt and RF models (Figure 4, Table 3), all sampling sites were located within the predicted suitable habitat area, and 95% were in highly suitable habitats. The regions of Yunnan, southern Sichuan, and southern Tibet were predicted to be suitable for the growth of D. dyeriana. The MaxEnt model predicted a large area in southeastern Yunnan and southern Tibet suitable for D. dyeriana, with a total suitable area of 15.20 × 10⁴ km2, accounting for 1.58% of the country. Specifically, the highly suitable area covered 1.96 × 10⁴ km2, representing 0.20% of the total national area. Highly suitable habitats were mainly in Wenshan and Honghe in Yunnan Province, as well as in the Rikaze and Shannan regions of Tibet and Panzhihua and Liangshan in Sichuan Province. The RF model predicted a larger suitable area than the MaxEnt model. From the RF model, the suitable area was 31.36 × 10⁴ km2, accounting for 3.27% of the national area, and the highly suitable area was 3.53 × 10⁴ km2, representing 0.37% of the total national area. These areas are primarily concentrated in Wenshan, Honghe, and Qujing in Yunnan Province, as well as in Shannan and Linzhi in Tibet.

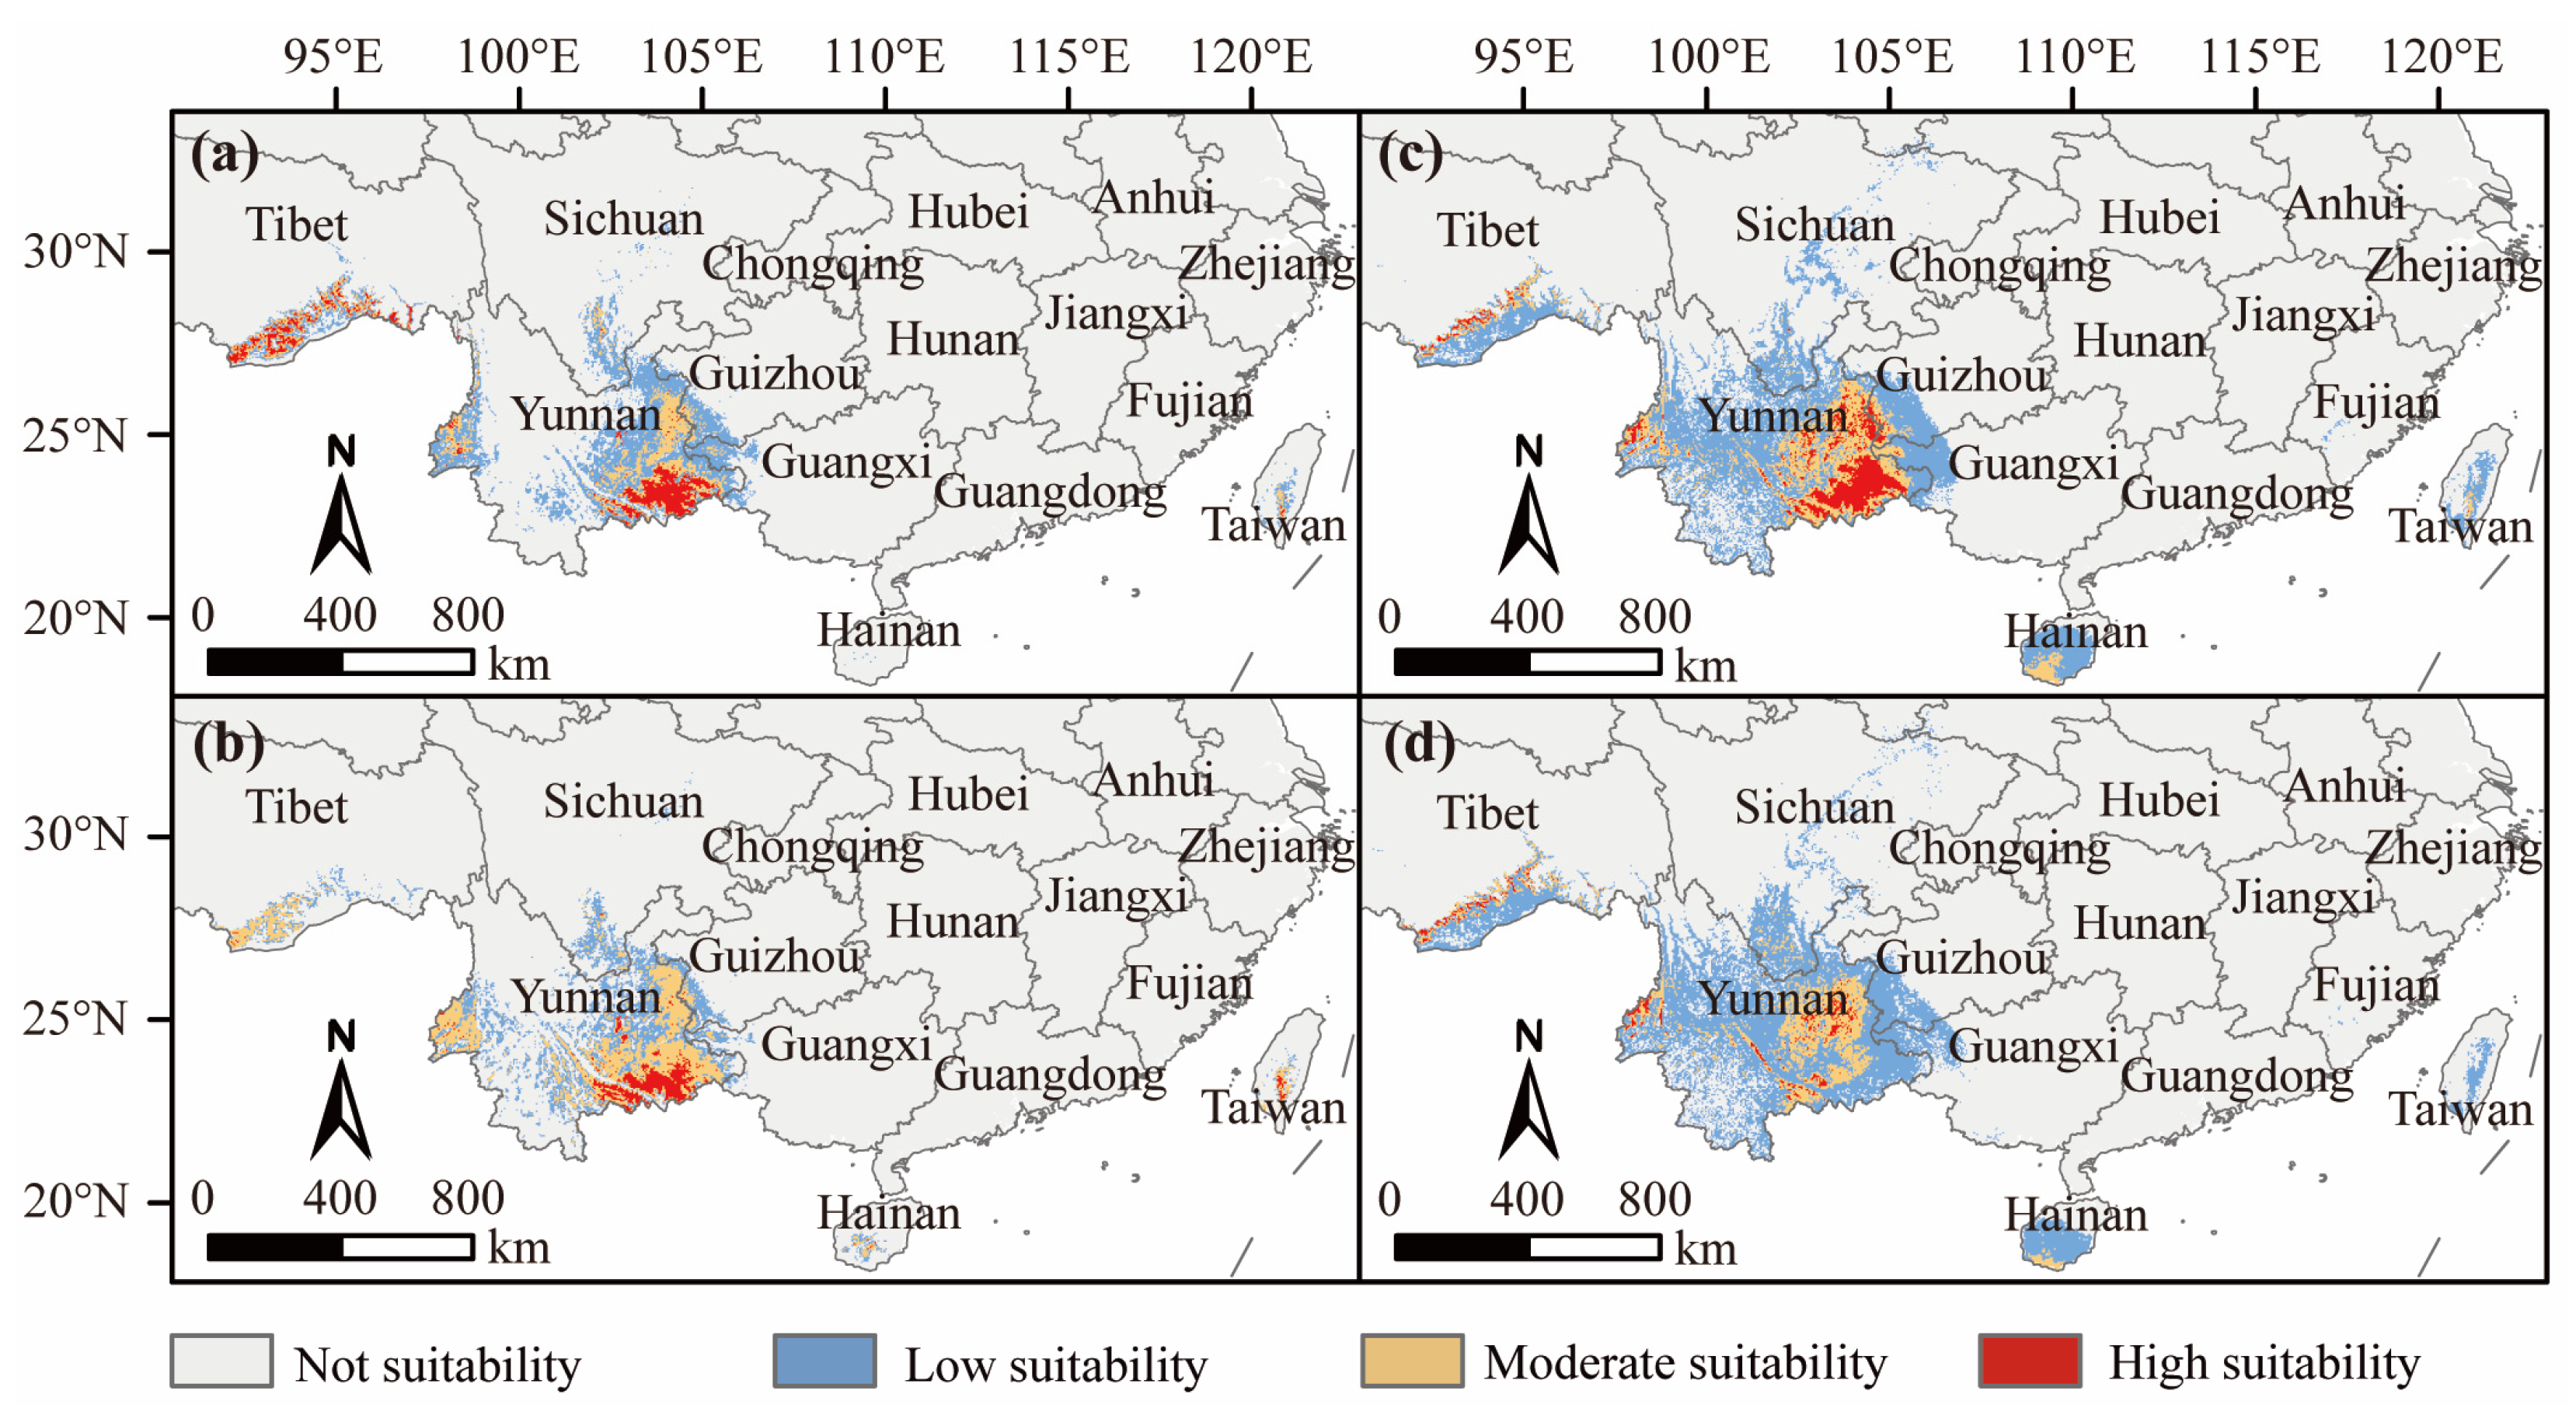
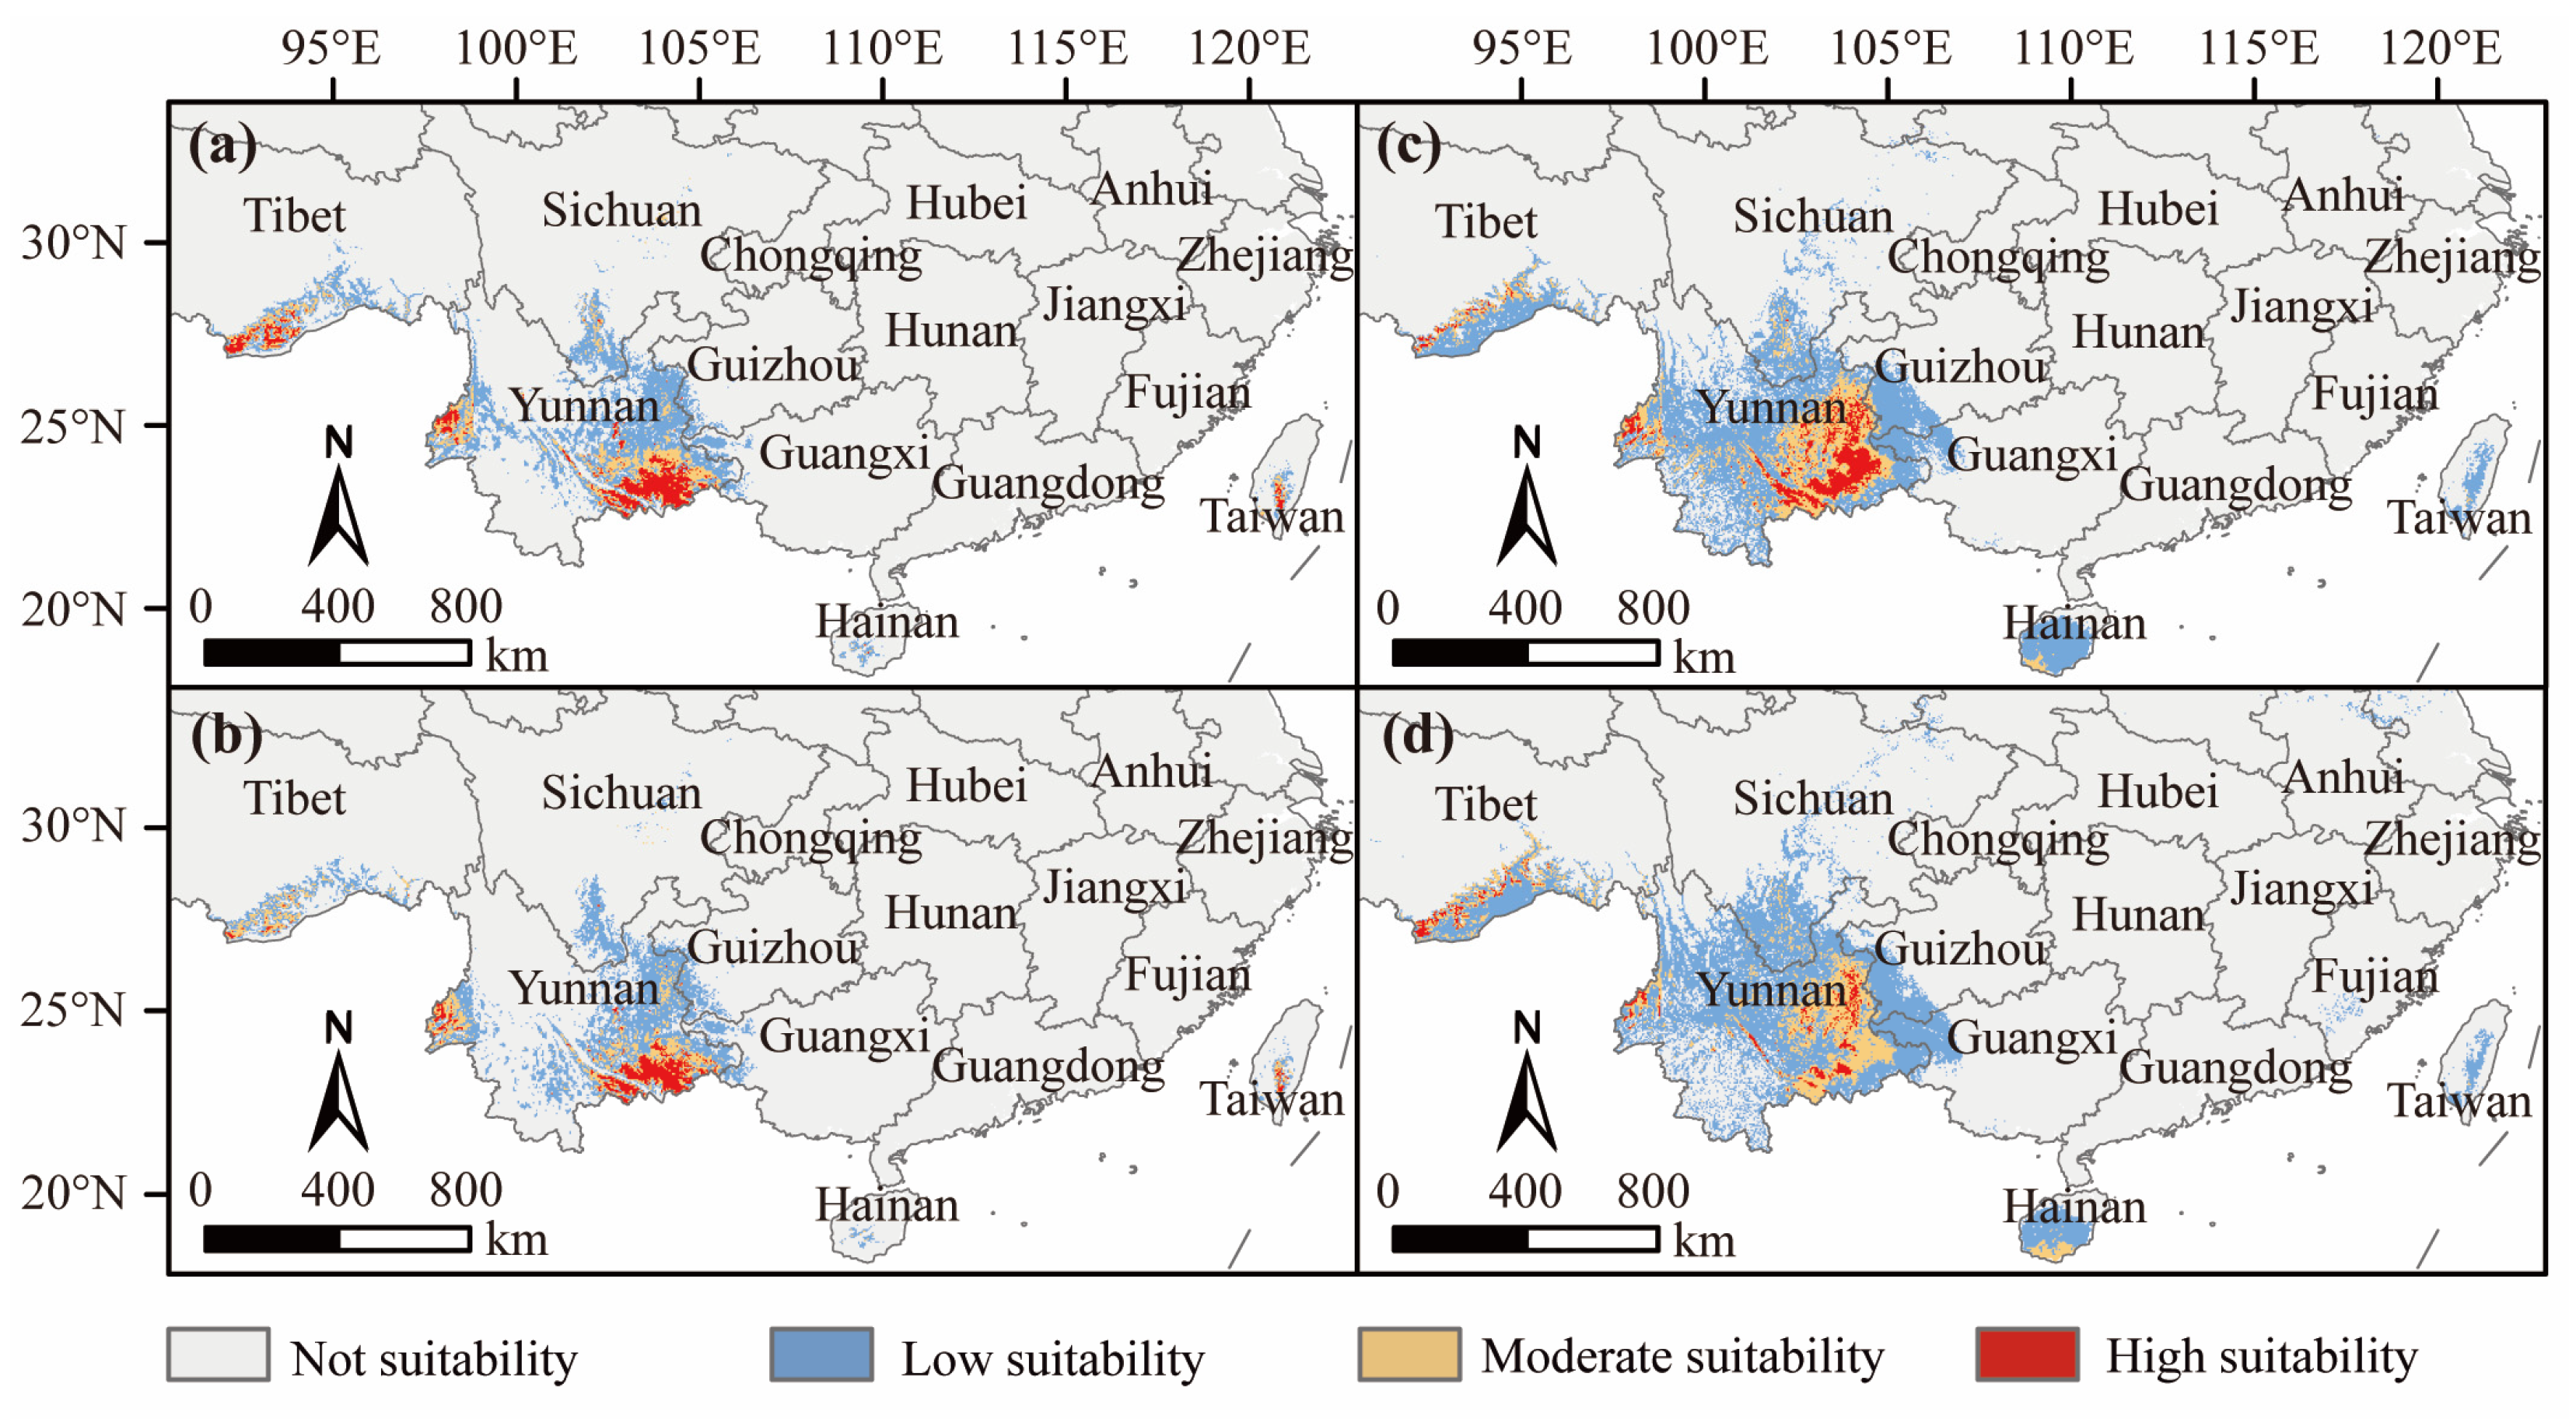
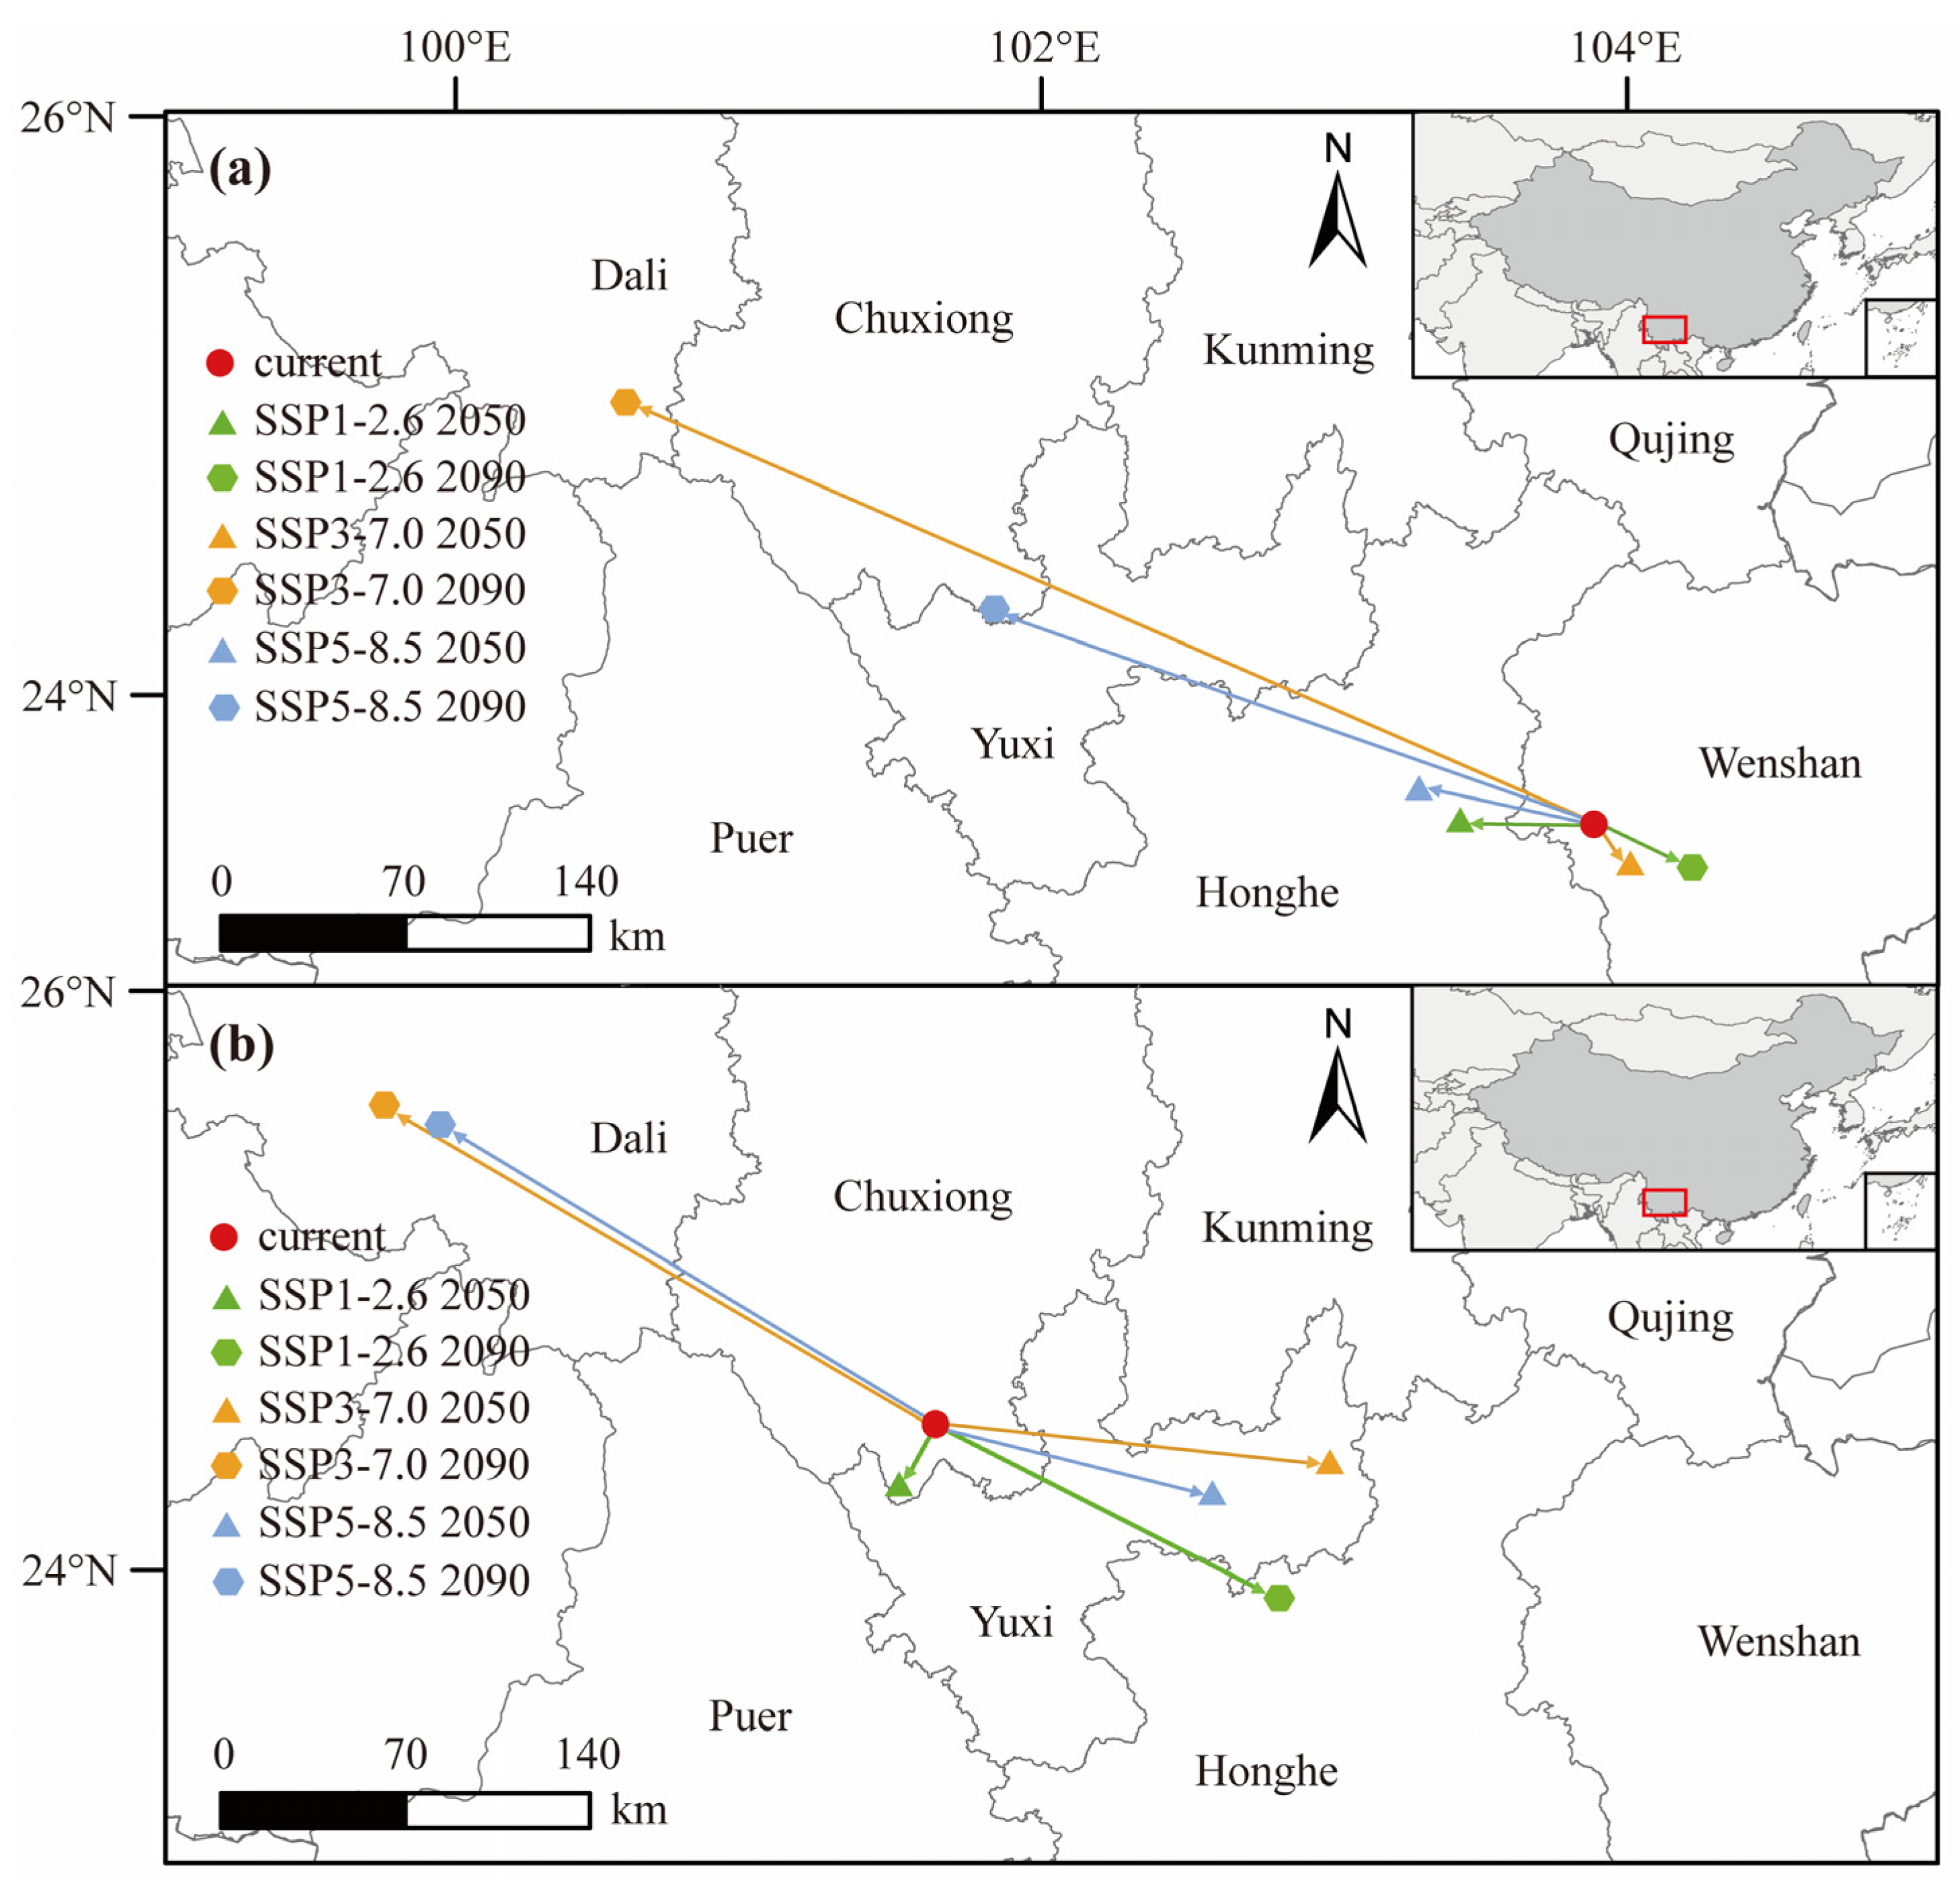
3.4. Suitable D. dyeriana Distribution Areas in the Future

In the SSP1-2.6 scenario, the results from the MaxEnt model indicated that the total suitable habitat area for D. dyeriana will initially increase and then decrease over time. The RF model predicted a continuous increase in the total suitable area from the current period to 2090 (Figure 5, Table 3). The MaxEnt model further predicted that, under future climate change scenarios, the Wenshan and Honghe regions would be highly suitable for D. dyeriana. In 2050 and 2090, moderately suitable areas surrounded the high suitability areas, with areas of 3.18 × 10⁴ km2 and 2.63 × 10⁴ km2, respectively, accounting for 20.80% and 17.66% of the total suitable area. Notably, the RF model predicted an increase in low suitability areas, reaching 3.82 × 10⁴ km2, accounting for 10.61% of the total suitable area.
Similarly, in 2050 (SSP1-2.6 scenario), there was a significant increase in the highly suitable area in Honghe, Yunnan Province, based on the results of the MaxEnt model (Figure 6). Furthermore, scattered increases were observed in central Yunnan, with an overall increase of 0.32 × 10⁴ km2, accounting for 16.33% of the current period (Table 3). However, there was a notable decrease in the highly suitable area in Wenshan, Yunnan Province. In 2090, there is an expected decrease in areas of high suitability, similar to that in 2050. The RF model predicted a decrease in the highly suitable area in Kunming and Wenshan in Yunnan in future periods, but an increase in Honghe. In 2090, the growth of highly suitable areas in the Honghe and Yuxi regions of Yunnan was quite noticeable, with an increase of 8.22% compared to the current period.
In SSP3-7.0 scenario 2050, the highly suitable areas in the MaxEnt model were mainly in the eastern parts of Yunnan, like Wenshan and Honghe, with a high habitat suitability area of 2.97 × 10⁴ km2 (Figure 7). By 2090, the area of high suitability decreased, and moderately suitable areas had emerged in the central and eastern parts of Yunnan and southern Tibet. The model in 2090 predicted that the moderately suitable area was the largest among all scenarios, covering an area of 8.46 × 10⁴ km2. However, results from the RF model predicted that the highly suitable areas were mainly concentrated in Wenshan, Honghe, and Qujing in Yunnan, covering an area of 3.84 × 10⁴ km2, representing the largest highly suitable areas among all future scenarios. The model, however, predicted that by 2090, a large part of the highly suitable area would disappear, leaving sparse distribution in Kunming, Qujing, and Honghe, with a remaining range of 1.24 × 10⁴ km2 (Table 3). Although the overall distribution range of suitable habitats is expected to increase significantly, most areas are low habitat suitability zones.
With global climate warming, under the SSP3-7.0 scenario, the distribution of highly suitable areas for D. dyeriana predicted by the two models showed a short-term increase (Figure 8). The results from the MaxEnt model show that under future scenarios, there is an expected increase in the highly suitable areas in Wenshan of Yunnan Province and south of Tibet. In contrast, the distribution range of highly suitable areas in Yuxi and Yunnan is expected to decrease. By 2090, there is a projected significant decrease in highly suitable areas in the Wenshan region of Yunnan Province. The highly suitable areas and total suitable areas of D. dyeriana will continue to increase. The area of highly suitable habitats will increase by 1.01 × 10⁴ km2 (51.53%) and 5.68 × 10⁴ km2 (37.37%), respectively (Table 3). In the RF model, the highly suitable areas will increase by 0.31 × 10⁴ km2 (8.7%) in 2050 compared to the current period. However, by 2090, in contrast to the MaxEnt prediction results, the highly suitable habitat predicted by the RF model is expected to decrease sharply by 2.29 × 10⁴ km2 (64.87%) compared to the current period. The highly suitable areas in Wenshan, Qujing, Honghe, and Kunming in Yunnan Province will experience range shrinkage.
Under the SSP5-8.5 scenario, the total suitable area predicted by both models showed an increasing trend in the future (Figure 9). In the MaxEnt model, the distribution of low- suitability areas will increase. By 2050, it is projected that habitats with low suitability will be cut across seven provinces, including Guizhou, Yunnan, Sichuan, Tibet, Guangxi, Taiwan, and Hainan. The highly suitable habitats and total suitable area increased significantly compared to the current period, reaching 2.84 × 10⁴ km2 and 20.26 × 10⁴ km2, respectively (Table 3). By 2090, the total suitable area is expected to decrease compared to 2050. In the RF model, by 2050, the highly suitable areas for D. dyeriana were mostly scattered in the Wenshan, Honghe, and Qujing regions of Yunnan Province and were surrounded by moderately suitable areas. By 2090, similar to 2090 under the SSP3-7.0 scenario, the highly suitable area is largely projected to disappear, reducing to 1.50 × 10⁴ km2 (Table 3). Habitat with low suitability in central Yunnan and southern Sichuan are expected to increase.
In future scenarios, the predicted distribution range of highly suitable habitats from the MaxEnt model results is expected to initially increase and then decrease (Figure 10). The number of highly suitable areas in the Dehong region of western Yunnan is expected to increase. However, in 2090, a significant decrease is expected in the highly suitable areas of Qujing and Honghe. In the RF model, the high suitability area in the eastern part of Qujing, Yunnan, is projected to experience a slight increase in 2050. Similarly, in 2090, the highly suitable habitat in the southern part of Honghe, Qujing, and Wenshan will decrease with a range shrinkage of 2.03 × 10⁴ km2 (57.51%).
In both models, the centroids of the areas with high suitability were in the central region of Yunnan Province (Figure 11). In future periods, the centroids of the two models will exhibit similar patterns of movement. In the MaxEnt model, the centroid was located in the west of Wenshan (23.54° N, 103.90° E). Under the SSP1-2.6 scenario, from the current period to 2050 and 2090, the centroids of both models are projected to shift toward the southeast. However, under the SSP3-7.0 and SSP5-8.5 scenarios, from the current period to 2050 and 2090, the centroids of both models will move toward the northwest. The centroid of the highly suitable areas in the RF model was in Chuxiong (24.50° N, 101.64° E). In the SSP3-7.0 2090 and SSP5-8.5 2090, the centroid is predicted to migrate far to Dali (25.50° N–25.58° N, 99.77° E–99.97° E), approximately 223.41 km and 201.71 km northwestward, respectively.

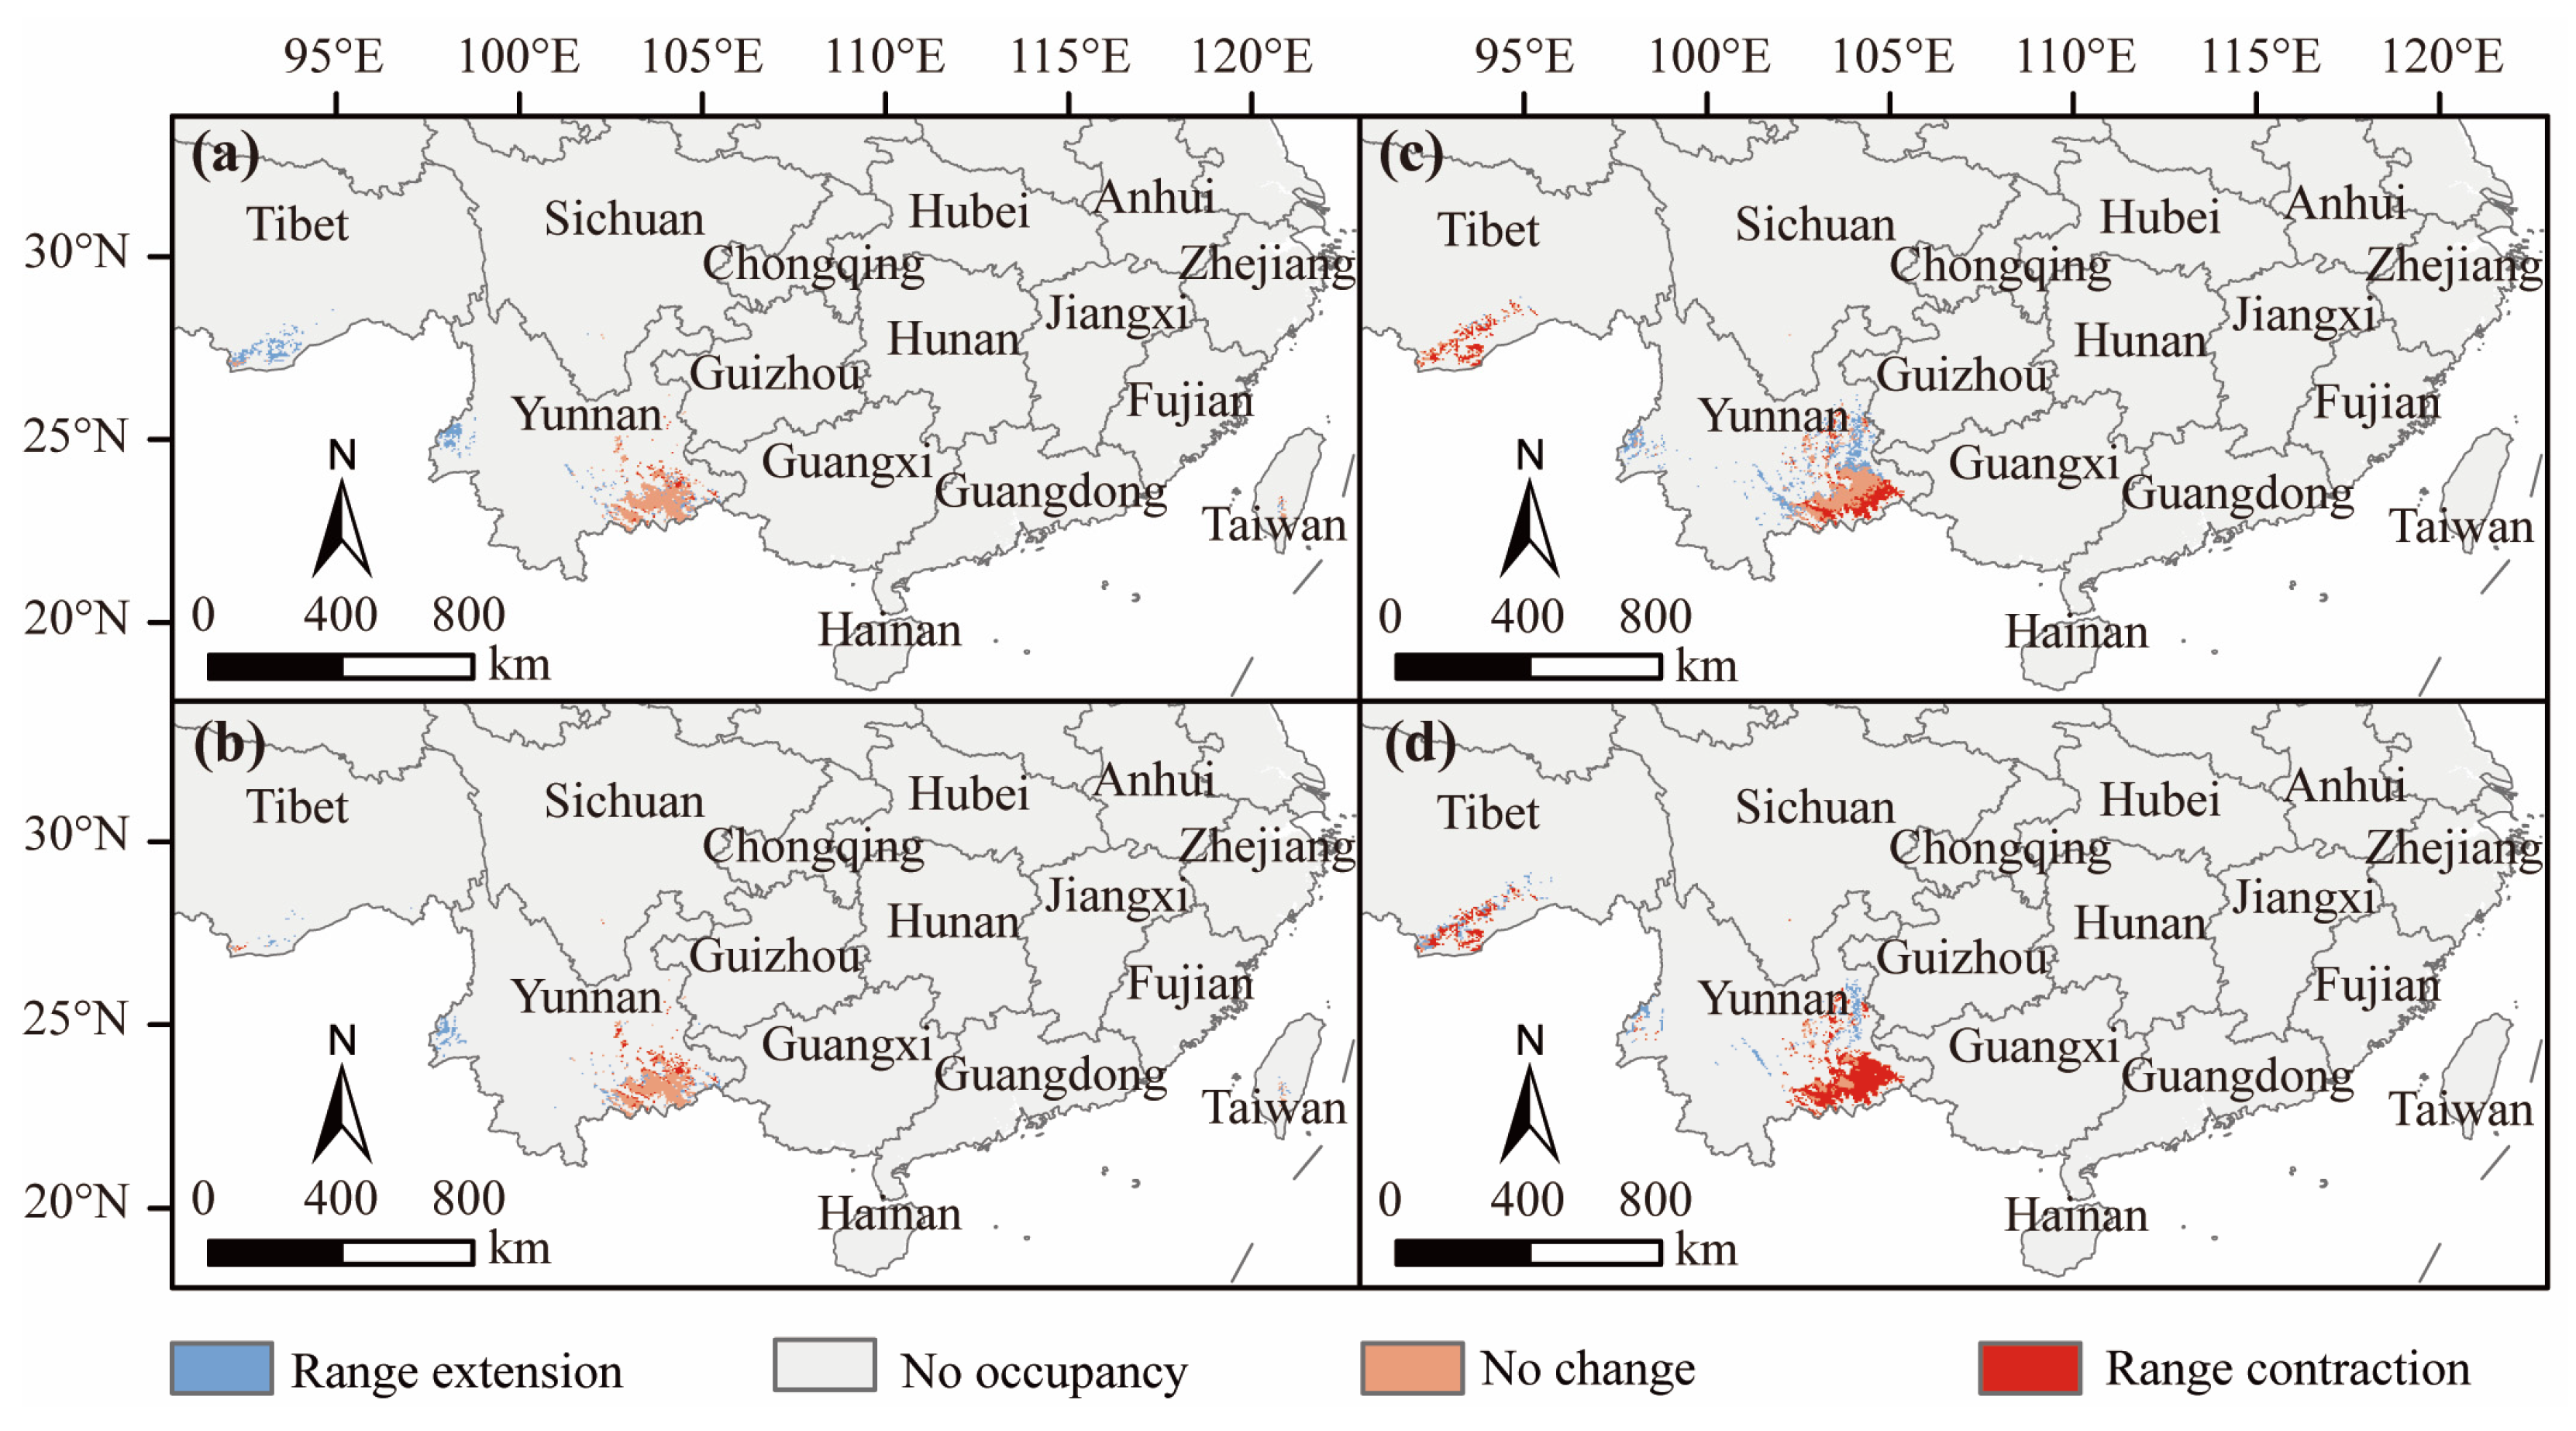
3.5. Changes in Practical Available Planting Areas under Different Climate Scenarios

The study combined land use data to extract four main vegetation types under each future scenario (Table 4). In the MaxEnt model, under the SSP3-7.0 scenario 2050, the practical available planting area for D. dyeriana is projected to reach its maximum of 16.36 × 10⁴ km2, constituting 78.34% of the predicted suitable area. In 2050 (SSP5-8.5), the proportion of the practical available planting area is predicted to reach its maximum at 81.16%. In the RF model, the practical available planting area was the smallest in 2050 (SSP1-2.6), but it represented the most significant proportion of the predicted suitable area, i.e., 79.15%. In the 2050 SSP3-7.0 scenario, the practical available planting area is projected to be the smallest proportion of the predicted suitable area, i.e., 77.53% (29.67 × 10⁴ km2). By comparing the MaxEnt model with the RF model, it could be observed that under the same scenario and period in the future, the ratio of the practical available planting area to the predicted suitable area in the MaxEnt model was consistently higher than that in the RF model.

4. Discussion

4.1. Assessment of Model Performance

SDMs are essential for determining shifts in species’ ecological niches in response to climate change. These models are widely acknowledged as an effective and versatile approach for predicting species distribution in response to global climate change [19]. The MaxEnt model exhibits promising performance when confronted with limited data points [46]. RF, a machine learning approach based on decision trees, exhibits high prediction accuracy and versatility, enabling it to enhance performance empirically and produce efficient results for large datasets in a short time [47]. In this study, both MaxEnt and RF models exhibited high accuracy in predicting the distribution of D. dyeriana. Simultaneously, the RF model demonstrated superior accuracy to that of the MaxEnt model. This was supported by the results of Zhang et al. [48] for Populus euphratica Oliv. and Zhao et al. [49] on Quasipaa boulengeri Günther. Kim et al. [50] found that RF outperformed the MaxEnt model in predicting the spatial distribution of forest fire probability expected distributions on accuracy. Similarly, Wouyou et al. [51] compared five models, RF, BRT, MaxEnt, GAM, and GLM, and found that RF had higher accuracy in predicting the distribution range of Caesalpinia bonduc (Linn.), far surpassing those of the other four models. Mtengwana et al. [52] also reported that RF model exhibited high accuracy when predicting the distribution of invasive alien plants (IAPs) in South Africa, compared to MaxEnt and BRT models.

4.2. Significant Climatic Factors Influencing the Distribution of D. dyeriana

In this study, isothermality and minimum temperature during the coldest month were the two most important environmental factors affecting the distribution of D. dyeriana, indicating that temperature plays an important role in shaping its distribution patterns. Similar findings have been reported for other plant species, such as Abies chensiensis Tiegh. by Gao et al. [53] and Primula filchnerae Knuth by Jiang et al. [54], where temperature was also identified as the primary environmental factor influencing their distributions.
The distribution pattern of D. dyeriana was deeply influenced by isothermality. Isothermality refers to the mean diurnal thermal range vs. the annual thermal range. Isothermality has significant effects on plants in low-latitude regions, especially in the tropics [55]. Both the MaxEnt and RF models concluded that isothermality was the most important environmental factor influencing the distribution of D. dyeriana, and the distribution range of D. dyeriana fell within the northern edge of the tropical region. This is consistent with previously reported results. Additionally, by correlating geographic range sizes with the importance of climatic factors, isothermality was found to have contributed an average of 33% to the distribution of all plants [56]. The contribution rate of isothermality was relatively higher for plants with a narrow geographical distribution, while it gradually decreased for plants with a wide geographical distribution. From our study on D. dyeriana, the contribution of isothermality was about 47%, which is narrowly endemic to southwestern China. Our results align with those of previous studies based on large datasets of plants [56]. Moreover, the optimal isothermality range is generally between 40 and 55, and species with a broader distribution would have a wide optimal isothermality range [55]. The optimal isothermality range of D. dyeriana was greater than 40, indicating that it could adapt to more variation in the diurnal temperature range, thus potentially allowing it to migrate north. According to future climate models, in all scenarios, isothermality is likely to show a slight decrease in the future [57]. Therefore, isothermality may have little impact on future geographical distribution changes of D. dyeriana.
In addition, the minimum temperature during the coldest month was the second most important factor affecting D. dyeriana. The decrease in the minimum temperature of the coldest month results in premature freezing injuries to plants, and long-term low temperatures can lead to the death of plants at the distribution limit [4]. However, with global warming, there will be an expected rise in temperatures in most parts of China, with surface temperatures in winter increasing by 3.1–3.2 °C [58]. This might be a potential driving factor for the expansion of the total suitable area of D. dyeriana.

4.3. Geographical Distribution and Temporal Dynamics of D. dyeriana

The increase in the total number of suitable habitats indicates that future climate change is favorable for the conservation of D. dyeriana. However, the MaxEnt model showed an initial increase followed by a decrease in highly suitable areas, while the RF model predicted a continuous decrease in high habitat suitability, especially in SSP3-7.0 2090 and SSP5-8.5 2090. The gradual growth trend under the SSP1-2.6 scenario may be related to the slow growth in temperature and precipitation [59]. Whereas, under the SSP3-7.0 and SSP5-8.5 scenarios, by 2090, the global precipitation was predicted to increase, but in Yunnan, the precipitation might decrease by about 15% [60]. Moreover, under the SSP5-8.5 scenario, anomalous temperatures, precipitation, and extreme weather events were increasing [61]. This might have been the reason for the decrease in the potentially suitable area of D. dyeriana under the SSP3-7.0 and SSP5-8.5 scenarios.
Under the SSP1-2.6 scenario, the centroid of the high suitability areas of D. dyeriana would move from Chuxiong to the national nature reserves of Wenshan and Honghe. The migration distance was relatively short. However, under the SSP3-7.0 and SSP5-8.5 scenarios, both models predicted that the centroid of D. dyeriana would move to Dali in the distant northwest region. Similarly, a study on the potential geographic distribution of 100 plant species in the Northern Hemisphere reported that the centers of distribution of these plants would generally shift northward in response to future climate change [62]. In addition, Chen et al. [63] reported that the fitness area of Saposhnikovia divaricata (Turcz.) Schischk will migrate toward higher latitudes in the future. These results aligned with the established understanding that species distributions shift toward higher latitudes or altitudes as climate warms [64].

4.4. Protection Measures for D. dyeriana

Research has indicated that the threats currently faced by most species on the brink of extinction were primarily due to human activities [65], such as deforestation and wildfires, which not only led to a reduction in species numbers but also caused changes in land vegetation cover. Under the SSP5-8.5 scenario, the practical area of D. dyeriana will peak, occupying about 78.71% of the predicted suitable area. In the SSP3-7.0 scenario 2050, the ratio of the practical available planting area to the predicted suitable area for D. dyeriana is projected to reach a minimum of 77.53%, which was higher than most other plants, like Cunninghamia lanceolata (Lamb.) Hook. (60.25%), as reported by Zhang et al. [66], the remaining predicted suitable areas were mainly agricultural land, and the area was slightly affected by climate change. This might have been associated with the Chinese government’s afforestation policy, such as the grain for green policy. Additionally, advocating for clear waters and green mountains is as good as mountains of gold and silver, making full use of traditional cultural characteristics to develop the ecotourism industry, which plays a positive role in the protection of rare and endangered plants in Yunnan.
Nature reserves serves as sanctuaries for rare and endangered plants. Yunnan has rich natural resources and has established several nature reserves, including the Wenshan and Daweishan National Nature Reserves, within the highly suitable habitats identified for D. dyeriana. The success of artificial propagation and ex situ cultivation of D. dyeriana demonstrated by Ouyang et al. [67] provides a valuable model for future conservation efforts. The Kunming Base of Yunnan Rare and Endangered Plant Introduction and Breeding Center has achieved a complete life cycle of the plant, from seed to seed, validating the effectiveness of ex situ conservation strategies. According to the results of this study, in situ conservation and population restoration of D. dyeriana could be conducted in highly suitable areas, such as Qujing and Wenshan in Yunnan. Yuxi and other places with high future suitability could be chosen as new artificial breeding and ex situ conservation destinations for D. dyeriana to enhance the genetic diversity of this species.

5. Conclusions

In this study, we used 45 present-day occurrence data combining climate, topography, and soil to predict the potential distribution of D. dyeriana in China based on MaxEnt and RF models under different climate change scenarios. The major conclusions are summarized as follows: (1) The potential distribution maps produced by the RF model were generally similar to those of the MaxEnt model. The RF model significantly outperformed the MaxEnt model in terms of AUC, TSS, and Kappa values, reflecting the higher accuracy of the RF model in predicting D. dyeriana distribution. (2) Among all 40 environmental factors, isothermality (bio_3), minimum temperature of the coldest month (bio_6), and annual precipitation (bio_12) were identified as the most important environmental factors affecting the distribution of D. dyeriana. Therefore, temperature-related climatic factors influenced D. dyeriana’s distribution. (3) According to the predicted results, Qujing and Wenshan in Yunnan were highly suitable areas under different scenarios in different future periods. Therefore, in situ conservation was possible in these areas, while places like Yuxi will likely become new, highly suitable areas under future climate conditions and could be chosen as new artificial breeding and ex situ conservation destinations.

Supplementary Materials

The following supporting information can be downloaded at: https://www.mdpi.com/article/10.3390/d16090545/s1, Table S1: Environmental variables used for modeling the habitat suitability of D. dyeriana.

Author Contributions

Conceptualization, M.-H.Y. and B.-W.L.; methodology, B.-W.L., Y.Z. and W.-Y.N.; formal analysis, N.-C.D., X.-L.L. and B.B.T.; software, M.-H.Y., B.-W.L., J.-Y.S. and N.-C.D.; writing—original draft preparation, M.-H.Y. and B.-W.L.; writing—review and editing, M.-H.Y., B.-W.L. and B.B.T.; visualization, B.-W.L.; supervision, M.-H.Y.; project administration, M.-H.Y.; funding acquisition, M.-H.Y. All authors have read and agreed to the published version of the manuscript.

Funding

This work was funded by the National Natural Science Foundation of China (31800276), the Foundation of He-Nan Province Educational Committee (19A180029), and the Nanhu Scholars Program for Young Scholars of XYNU granted to Ming-Hui Yan.

Institutional Review Board Statement

Not applicable.

Informed Consent Statement

Not applicable.

Data Availability Statement

The datasets generated and/or analyzed during the current study are available from the corresponding author upon reasonable request.

Conflicts of Interest

The authors declare no conflicts of interest.

References

  1. Mahecha, M.D.; Bastos, A.; Bohn, F.J.; Eisenhauer, N.; Feilhauer, H.; Hickler, T.; Kalesse-Los, H.; Migliavacca, M.; Otto, F.E.L.; Peng, J.; et al. Biodiversity and climate extremes: Known interactions and research gaps. Earths Future 2024, 12, e2023EF003963. [Google Scholar] [CrossRef]
  2. Pecl, G.T.; Araújo, M.B.; Bell, J.D.; Blanchard, J.; Bonebrake, T.C.; Chen, I.-C.; Clark, T.D.; Colwell, R.K.; Danielsen, F.; Evengård, B.; et al. Biodiversity redistribution under climate change: Impacts on ecosystems and human well-being. Science 2017, 355, eaai9214. [Google Scholar] [CrossRef]
  3. Pörtner, H.-O.; Scholes, R.J.; Arneth, A.; Barnes, D.K.A.; Burrows, M.T.; Diamond, S.E.; Duarte, C.M.; Kiessling, W.; Leadley, P.; Managi, S.; et al. Overcoming the coupled climate and biodiversity crises and their societal impacts. Science 2023, 380, eabl4881. [Google Scholar] [CrossRef]
  4. Bhadra, P.; Maitra, S.; Shankar, T.; Hossain, A.; Praharaj, S.; Aftab, T. Climate Change Impact on Plants: Plant Responses and Adaptations. In Plant Perspectives to Global Climate Changes; Academic Press: Cambridge, MA, USA, 2022; Volume 32, pp. 1–24. [Google Scholar] [CrossRef]
  5. APG. An ordinal classification for the families of flowering plants. Ann. Mo. Bot. Gard. 1998, 85, 531–553. [Google Scholar] [CrossRef]
  6. APGII. An update of the Angiosperm Phylogeny Group classification for the orders and families of flowering plants: APG II. Bot. J. Linn. Soc. 2003, 141, 399–436. [Google Scholar] [CrossRef]
  7. Harrington, M.G.; Edwards, K.J.; Johnson, S.A.; Chase, M.W.; Gadek, P.A. Phylogenetic inference in Sapindaceae sensu lato using plastid matK and rbcL DNA sequences. Syst. Bot. 2005, 30, 366–382. [Google Scholar] [CrossRef]
  8. Wu, Z.; Raven, P. Flora of China; Science Press: Beijing, China; Missouri Botanical Garden Press: St. Louis, MO, USA, 1996; Volume 15, pp. 1–387. [Google Scholar]
  9. Zhou, T.; Chen, C.; Wei, Y.; Chang, Y.; Bai, G.; Li, Z.; Kanwal, N.; Zhao, G. Comparative transcriptome and chloroplast genome analyses of two related Dipteronia species. Front. Plant Sci. 2016, 7, 1512. [Google Scholar] [CrossRef]
  10. Rivers, M.C.; Barstow, M.; Crowley, D. Dipteronia dyeriana. The IUCN Red List of Threatened Species 2017, 2017, e.T32340A2815531. [Google Scholar] [CrossRef]
  11. Ouyang, Z.; Cheng, Q.; Zhang, X.; Yang, X.; Wang, J. Status of Rare Dipteronia dyeriana and Countermeasure for its Protection. For. Inventory Plan. 2007, 32, 143–145. (In Chinese) [Google Scholar]
  12. Chen, C.; Lu, R.; Zhu, S.; Tamaki, I.; Qiu, Y. Population structure and historical demography of Dipteronia dyeriana (Sapindaceae), an extremely narrow palaeoendemic plant from China: Implications for conservation in a biodiversity hot spot. Heredity 2017, 119, 95–106. [Google Scholar] [CrossRef]
  13. Guo, R.; Luo, M.; Long, C.; Li, M.; Ouyang, Z.; Zhou, Y.; Wang, Y.; Li, X.; Shi, Y. Triterpenoid ester saponins from Dipteronia dyeriana. Helv. Chim. Acta. 2008, 91, 1728–1735. [Google Scholar] [CrossRef]
  14. Harris, A.J.; Frawley, E.; Wen, J. The utility of single-copy nuclear genes for phylogenetic resolution of Acer and Dipteronia (Acereae, Sapindaceae). Ann. Botan. Fenn. 2017, 54, 209–222. [Google Scholar] [CrossRef]
  15. Zhou, T.; Li, Z.; Bai, G.; Feng, L.; Chen, C.; Wei, Y.; Chang, Y.; Zhao, G. Transcriptome Sequencing and Development of Genic SSR Markers of an Endangered Chinese Endemic Genus Dipteronia Oliver (Aceraceae). Molecules 2016, 21, 166. [Google Scholar] [CrossRef]
  16. Yang, J.; Wang, X.; Li, S.; Zhao, G. What is the phylogenetic placement of Dipteronia dyeriana Henry? An example of plant species placement based on nucleotide sequences. Plant Biosyst. 2010, 144, 634–643. [Google Scholar] [CrossRef]
  17. Elith, J.; Leathwick, J.R. Species distribution models: Ecological explanation and prediction across space and time. Annu. Rev. Ecol. Evol. S. 2009, 40, 677–697. [Google Scholar] [CrossRef]
  18. Dyderski, M.K.; Paz, S.; Frelich, L.E.; Jagodzinski, A.M. How much does climate change threaten European forest tree species distributions? Glob. Change Biol. 2018, 24, 1150–1163. [Google Scholar] [CrossRef]
  19. Qazi, A.W.; Saqib, Z.; Zaman-ul-Haq, M. Trends in Species distribution modelling in context of rare and endemic plants: A systematic review. Ecol. Process. 2022, 11, 40. [Google Scholar] [CrossRef]
  20. Phillips, S.; Anderson, R.; Schapire, R. Maximum entropy modeling of species geographic distributions. Ecol. Modell. 2006, 190, 231–259. [Google Scholar] [CrossRef]
  21. Phillips, S.; Dudík, M. Modeling of species distributions with MaxEnt: New extensions and a comprehensive evaluation. Ecography 2008, 31, 161–175. [Google Scholar] [CrossRef]
  22. Bar Massada, A.; Syphard, A.; Stewart, S.; Radeloff, V. Wildfire ignition-distribution modelling: A comparative study in the Huron–Manistee National Forest, Michigan, USA. Int. J. Wildland Fire 2013, 22, 174–183. [Google Scholar] [CrossRef]
  23. Bai, G.; Yang, J.; Li, Z.; Zhao, G. Genetic Diversity and Implications for Conservation of Dipteronia Oliv. Acta Bot. Boreali-Occident. Sin. 2014, 34, 1975–1980. (In Chinese) [Google Scholar]
  24. Bai, G.; Li, S.; Li, W.; Li, Z.; Yang, J.; Zhao, G. Interspecific Differentiation of the Endemic Plant Genus Dipteronia Oliv. Acta Bot. Boreali-Occident. Sin. 2015, 35, 1123–1128. (In Chinese) [Google Scholar]
  25. Gao, J.; Du, F.; Li, J. Systematic position of Dipteronia dyeriana inferred from eight gene regions. J. Beijing For. Univ. 2017, 39, 24–29. (In Chinese) [Google Scholar]
  26. Ouyang, Z.; Wang, B.; Dang, X.; Zhang, X.; Ding, K. Allozyme-based Genetic Diversity of Dipteronia dyeriana in China. J. Wuhan Bot. Res. 2009, 27, 461–466. (In Chinese) [Google Scholar]
  27. Fick, S.E.; Hijmans, R.J. WorldClim 2: New 1-km spatial resolution climate surfaces for global land areas. Int. J. Climatol. 2017, 37, 4302–4315. [Google Scholar] [CrossRef]
  28. Siabi, E.K.; Awafo, E.A.; Kabo-bah, A.T.; Derkyi, N.S.A.; Akpoti, K.; Mortey, E.M.; Yazdanie, M. Assessment of Shared Socioeconomic Pathway (SSP) Climate Scenarios and Its Impacts on the Greater Accra Region. Urban Clim. 2023, 49, 101432. [Google Scholar] [CrossRef]
  29. Eyring, V.; Bony, S.; Meehl, G.A.; Senior, C.A.; Stevens, B.; Stouffer, R.J.; Taylor, K.E. Overview of the Coupled Model Intercomparison Project Phase 6 (CMIP6) experimental design and organization. Geosci. Model Dev. 2016, 9, 1937–1958. [Google Scholar] [CrossRef]
  30. FAO; IIASA. Harmonized World Soil Database Version 2.0; FAO: Rome, Italy; IIASA: Laxenburg, Austria, 2023. [Google Scholar] [CrossRef]
  31. Xu, X.; Liu, J.; Zhang, S.; Li, R.; Yan, C.; Wu, S. China’s Multi-Period Land Use/Cover Change Monitoring Dataset, Resource and Environment Science and Data Center [Data Set]. 2020. Available online: https://www.resdc.cn/DOI/doi.aspx?DOIid=54 (accessed on 7 January 2024).
  32. Zhang, K.; Yao, L.; Meng, J.; Tao, J. MaxEnt modeling for predicting the potential geographical distribution of two peony species under climate change. Sci. Total Environ. 2018, 634, 1326–1334. [Google Scholar] [CrossRef]
  33. Yi, Y.; Cheng, X.; Yang, Z.; Zhang, S. MaxEnt modeling for predicting the potential distribution of endangered medicinal plant (H. riparia Lour) in Yunnan. Chin. Ecol. Eng. 2016, 92, 260–269. [Google Scholar] [CrossRef]
  34. Breiman, L. Random Forests. Mach. Learn. 2001, 45, 5–32. [Google Scholar] [CrossRef]
  35. Phillips, S.J.; Anderson, R.P.; Dudik, M.; Schapire, R.E.; Blair, M.E. Opening the black box: An open-source release of MaxEnt. Ecography 2017, 40, 887–893. [Google Scholar] [CrossRef]
  36. Mahmoodi, S.; Heydari, M.; Ahmadi, K.; Khwarahm, N.R.; Karami, O.; Almasieh, K.; Naderi, B.; Bernard, P.; Mosavi, A. The current and future potential geographical distribution of Nepeta crispa Willd., an endemic, rare and threatened aromatic plant of Iran: Implications for ecological conservation and restoration. Ecol. Indic. 2022, 137, 108752. [Google Scholar] [CrossRef]
  37. Elith, J.; Graham, C.H.; Anderson, R.P.; Dudik, M.; Ferrier, S.; Guisan, A.; Hijmans, R.J.; Huettmann, F.; Leathwick, J.R.; Lehmann, A.; et al. Novel methods improve prediction of species’ distributions from occurrence data. Ecography 2006, 29, 129–151. [Google Scholar] [CrossRef]
  38. Allouche, O.; Tsoar, A.; Kadmon, R. Assessing the accuracy of species distribution models: Prevalence, kappa and the true skill statistic (TSS). J. Appl. Ecol. 2006, 43, 1223–1232. [Google Scholar] [CrossRef]
  39. Yan, H.; Feng, L.; Zhao, Y.; Feng, L.; Wu, D.; Zhu, C. Prediction of the spatial distribution of Alternanthera philoxeroides in China based on ArcGIS and MaxEnt. Glob. Ecol. Conserv. 2020, 21, e00856. [Google Scholar] [CrossRef]
  40. Di Cola, V.; Broennimann, O.; Petitpierre, B.; Breiner, F.T.; D’Amen, M.; Randin, C.; Engler, R.; Pottier, J.; Pio, D.; Dubuis, A.; et al. Ecospat: An R package to support spatial analyses and modeling of species niches and distributions. Ecography 2017, 40, 774–787. [Google Scholar] [CrossRef]
  41. Wunderlich, R.; Lin, Y.; Anthony, J.; Petway, J. Two alternative evaluation metrics to replace the true skill statistic in the assessment of species distribution models. Nat. Conserv. 2019, 35, 97–116. [Google Scholar] [CrossRef]
  42. Lesa, H.; Michael, J. Multilevel models for the experimental psychologist: Foundations and illustrative examples. Behav. Res. Methods 2007, 39, 101–117. [Google Scholar] [CrossRef]
  43. Zhang, S.; Kubota, K. Accounting for dispersal and intraspecific variation in forecasts of species distribution under climate change. Insect Conserv. Divers. 2023, 16, 902–908. [Google Scholar] [CrossRef]
  44. Feng, L.; Sun, J.; El-Kassaby, Y.A.; Yang, X.; Tian, X.; Wang, T. Predicting potential habitat of a plant species with small populations under climate change: Ostrya rehderiana. Forests 2022, 13, 129. [Google Scholar] [CrossRef]
  45. Buonincontri, M.P.; Bosso, L.; Smeraldo, S.; Chiusano, M.L.; Pasta, S.; Di Pasquale, G. Shedding light on the effects of climate and anthropogenic pressures on the disappearance of Fagus sylvatica in the Italian lowlands: Evidence from archaeo-anthracology and spatial analyses. Sci. Total Environ. 2023, 877, 162893. [Google Scholar] [CrossRef]
  46. Xiao, J.; Eziz, A.; Zhang, H.; Wang, Z.; Tang, Z.; Fang, J. Responses of four dominant dryland plant species to climate change in the Junggar Basin, northwest China. Ecol. Evol. 2019, 9, 13596–13607. [Google Scholar] [CrossRef] [PubMed]
  47. Chang, Y.; Bertola, L.; Hoskin, C. Species distribution modelling of the endangered mahogany glider (Petaurus gracilis) reveals key areas for targeted survey and conservation. Austral Ecol. 2022, 48, 289–312. [Google Scholar] [CrossRef]
  48. Zhang, Y.; Jiang, X.; Lei, Y.; Wu, Q.; Liu, Y.; Shi, X. Potentially Suitable distribution areas of Populus Euphratica and Tamarix Chinensis by MaxEnt and Random Forest Model in the lower reaches of the Heihe river, China. Environ. Monit. Assess. 2023, 195, 1519. [Google Scholar] [CrossRef] [PubMed]
  49. Zhao, Z.; Xiao, N.; Shen, M.; Li, J. Comparison between optimized maxent and random forest modeling in predicting potential distribution: A case study with Quasipaa Boulengeri in China. Sci. Total Environ. 2022, 842, 156867. [Google Scholar] [CrossRef]
  50. Kim, S.; Lim, C.; Kim, G.; Lee, J.; Geiger, T.; Rahmati, O.; Lee, W. Multi-temporal analysis of forest fire probability using socio-economic and environmental variables. Remote Sens. 2019, 11, 86. [Google Scholar] [CrossRef]
  51. Wouyou, H.; Lokonon, B.; Idohou, R.; Zossou-Akete, A.; Assogbadjo, A.; Glèlè Kakaï, R. Predicting the potential impacts of climate change on the endangered Caesalpinia bonduc (L.) Roxb in Benin (West Africa). Heliyon 2022, 8, e09022. [Google Scholar] [CrossRef]
  52. Mtengwana, B.; Dube, T.; Mudereri, B.; Shoko, C. Modeling the geographic spread and proliferation of invasive alien plants (IAPs) into new ecosystems using multi-source data and multiple predictive models in the Heuningnes catchment, South Africa. GISci. Remote Sens. 2021, 58, 483–500. [Google Scholar] [CrossRef]
  53. Gao, B.; Wei, H.; Guo, Y.; Gu, W. Using GIS and MaxEnt to analyze the potential distribution of Abies chensiensis. Chin. J. Ecol. 2015, 34, 843–852. (In Chinese) [Google Scholar]
  54. Jiang, X.; Liu, W.; Zhu, Y.; Cao, Y.; Yang, X.; Geng, Y.; Zhang, F.; Sun, R.; Jia, R.; Yan, C.; et al. Impacts of Climate Changes on Geographic Distribution of Primula filchnerae, an Endangered Herb in China. Plants 2023, 12, 3561. [Google Scholar] [CrossRef]
  55. Huang, E.; Chen, Y.; Fang, M.; Zheng, Y.; Yu, S. Environmental Drivers of Plant Distributions at Global and Regional Scales. Global Ecol. Biogeogr. 2021, 30, 697–709. [Google Scholar] [CrossRef]
  56. Yu, F.; Groen, T.A.; Wang, T.; Skidmore, A.K.; Huang, J.; Ma, K. Climatic niche breadth can explain variation in geographical range size of alpine and subalpine plants. Int. J. Geog. Inf. Sci. 2016, 31, 190–212. [Google Scholar] [CrossRef]
  57. Kamruzzaman, M.; Islam, H.M.T.; Ahmed, S.; Bhattacharjya, D.K.; Khan, M.S.K.; Mahmud, G.I.; Almazroui, M.; Shahid, S. Evaluating the Effects of Climate Change on Thermal Bioclimatic indices in a tropical region using climate projections from the bias-corrected CMIP6 model. Earth Syst. Environ. 2023, 7, 699–722. [Google Scholar] [CrossRef]
  58. Fu, Y.H.; Jiang, D.B. Climate change over China with a 2 °C global warming. Chin. J. Atmos. Sci. 2012, 36, 234–246. (In Chinese) [Google Scholar] [CrossRef]
  59. Mo, X.G.; Hu, S.; Lu, H.J.; Lin, Z.H.; Liu, S.X. Drought trends over the terrestrial China in the 21st century in climate change scenarios with ensemble GCM projections. J. Nat. Resour. 2018, 33, 1244–1256. [Google Scholar] [CrossRef]
  60. Deng, L.; Zhu, H.H.; Jiang, Z.H. Projection of climate change in China under carbon neutral scenarios. Trans. Atmos. Sci. 2022, 45, 364–375. [Google Scholar] [CrossRef]
  61. Su, Z.K.; Li, W.X.; Zhang, J.Y.; Jin, J.L.; Xue, Q.; Wang, Y.T.; Wang, G.Q. Historical changes and future trends of extreme precipitation and high temperature in China. Strateg. Study Chin. Acad. Eng. 2022, 24, 116–125. [Google Scholar] [CrossRef]
  62. Bellard, C.; Bertelsmeier, C.; Leadley, P.; Thuiller, W.; Courchamp, F. Impacts of climate change on the future of biodiversity. Ecol. Lett. 2012, 15, 365–377. [Google Scholar] [CrossRef]
  63. Chen, B.; Zou, H.; Zhang, B.; Zhang, X.; Jin, X.; Wang, C.; Zhang, X. Distribution pattern and change prediction of Saposhnikovia divaricata suitable area in China under climate change. Ecol. Indic. 2022, 143, 109311. [Google Scholar] [CrossRef]
  64. Rubenstein, M.A.; Weiskopf, S.R.; Bertrand, R.; Carter, S.L.; Comte, L.; Eaton, M.J.; Johnson, C.G.; Lenoir, J.; Lynch, A.J.; Miller, B.W.; et al. Climate Change and the Global Redistribution of Biodiversity: Substantial Variation in Empirical Support for Expected Range Shifts. Environ. Evid. 2023, 12, 7. [Google Scholar] [CrossRef]
  65. Dong, X.D.; Li, J.H.; Yang, X.X. Surver of Yunnans Trachycarpus nanu and its biological features. Dep. Biol. Chem. 2002, 21, 338–341. (In Chinese) [Google Scholar]
  66. Zhang, K.; Zhang, Y.; Jia, D.; Tao, J. Species Distribution Modeling of Sassafras Tzumu and Implications for Forest Management. Sustainability 2020, 12, 4132. [Google Scholar] [CrossRef]
  67. Ouyang, Z.; Zhou, J.; Huang, Q.; Li, D. Ex situ conservation of Dipteronia dyeriana, a rare and endangered plant. Yunnan For. Sci. Technol. 2001, 96, 24–27. (In Chinese) [Google Scholar]
Figure 1. Morphological characteristics and habitat of D. dyeriana. (a) plant; (b) mature leaves; (c) inflorescence; (d) young fruits; (e) dried fruits. All plant pictures were provided by Professor Zhu Xinxin of Xinyang Normal University.
Diversity 16 00545 g001
Figure 2. Evaluation of contribution rate for selected environment variables.
Diversity 16 00545 g002
Figure 3. Response curve of the climatic factors and probability of presence of D. dyeriana. (a) response curve of bio_3; (b) response curve of bio_6; (c) response curve of bio_12.
Diversity 16 00545 g003
Figure 4. Predicted current habitat suitability of D. dyeriana using the MaxEnt (a) and RF (b) models. The black dots in the figure indicate the occurrence records of D. dyeriana. The red frame delineates the research area.
Diversity 16 00545 g004
Figure 5. The species distribution models of D. dyeriana within China under SSP1-2.6 scenario conditions predicted by the MaxEnt (a,b) and RF (c,d) models. (a) future climate scenario SSP1-2.6 2050, (b) future climate scenario SSP1-2.6 2090, (c) future climate scenario SSP1-2.6 2050, and (d) future climate scenario SSP1-2.6 2090.
Diversity 16 00545 g005
Figure 6. The dynamic changes in the suitable distribution areas of D. dyeriana predicted by the MaxEnt and RF models under current and SSP1-2.6 scenarios. (a) current to SSP1-2.6 2050 by MaxEnt; (b) current to SSP1-2.6 2090 by MaxEnt; (c) current to SSP1-2.6 2050 by RF; (d) current to SSP1-2.6 2090 by RF.
Diversity 16 00545 g006
Figure 7. The species distribution models of D. dyeriana within China under SSP3-7.0 scenario conditions predicted by the MaxEnt (a,b) and RF (c,d) models. (a) future climate scenario SSP3-7.0 2050; (b) future climate scenario SSP3-7.0 2090; (c) future climate scenario SSP3-7.0 2050; and (d) future climate scenario SSP3-7.0 2090.
Diversity 16 00545 g007
Figure 8. The dynamic changes in the suitable distribution areas of D. dyeriana predicted by the MaxEnt and RF models under current and SSP3-7.0 scenarios. (a) current to SSP3-7.0 2050 by MaxEnt; (b) current to SSP3-7.0 2090 by MaxEnt; (c) current to SSP3-7.0 2050 by RF; (d) current to SSP3-7.0 2090 by RF.
Diversity 16 00545 g008
Figure 9. The species distribution models of D. dyeriana within China under SSP5-8.5 scenario conditions predicted by the MaxEnt (a,b) and RF (c,d) models. (a) future climate scenario SSP5-8.5 2050; (b) future climate scenario SSP5-8.5 2090; (c) future climate scenario SSP5-8.5 2050; (d) future climate scenario SSP5-8.5 2090.
Diversity 16 00545 g009
Figure 10. The dynamic changes in the suitable distribution areas of D. dyeriana predicted by the MaxEnt and RF models under current and SSP5-8.5 scenarios. (a) current to SSP5-8.5 2050 by MaxEnt; (b) current to SSP5-8.5 2090 by MaxEnt; (c) current to SSP5-8.5 2050 by RF; (d) current to SSP5-8.5 2090 by RF.
Diversity 16 00545 g010
Figure 11. The centroid migration within the suitable distribution areas predicted by the MaxEnt (a) and RF (b) models under different climate scenarios. The arrow indicates the directional movement of the centroid of a suitable distribution area. The red frame delineates the research area.
Diversity 16 00545 g011
Table 1. Tolerance and Variance Inflation Factor (VIF) of the final selected 11 environmental factors.
TypeFactorImpact FactorToleranceVIFSource
Bioclimatic factorsbio_1Annual mean temperature0.4312.320 WorldClim
bio_2Mean diurnal range (mean of monthly (max temp–min temp))0.6581.520 WorldClim
bio_3Isothermality (bio_2/bio_7) × (100)0.1267.937WorldClim
bio_6Minimum temperature of coldest month0.2314.329WorldClim
bio_12Annual precipitation0.7141.401WorldClim
bio_15Precipitation seasonality (coefficient of variation)0.4312.320 WorldClim
Topographic factorsaspectAspect0.791.265WorldClim
slopeSlope0.5921.69WorldClim
Soil factorsD2_tcarbon_eqCalcium carbonate content0.2314.333HSWD 2.0
D3_coarseCoarse fragments0.2164.619HSWD 2.0
D3_sandSand0.2084.801HSWD 2.0
Table 2. Comparison of the AUC, TSS, and Kappa values between RF and MaxEnt models.
Model TypeAUCTSSKappa
MaxEnt0.994 ± 0.0080.831 ± 0.0120.672 ± 0.029
RF0.998 ± 0.0020.990 ± 0.0230.913 ± 0.017
p0.0970.0010.001
Table 3. The suitable areas of D. dyeriana under different periods and climate scenarios (×104 km2).
ModelClimate ScenariosHigh Suitability AreaMiddle Suitability AreaLow Suitability AreaTotal Suitability Area
MaxEntcurrent1.962.7810.4615.20
SSP1-2.6 20502.283.189.8315.29
SSP1-2.6 20901.652.6310.6214.89
SSP3-7.0 20502.975.0012.9120.88
SSP3-7.0 20901.888.469.7720.11
SSP5-8.5 20502.844.0613.3620.26
SSP5-8.5 20902.073.6312.8418.54
RFcurrent3.536.5621.2731.36
SSP1-2.6 20502.707.0024.6634.37
SSP1-2.6 20903.826.1026.0635.99
SSP3-7.0 20503.848.2326.2038.27
SSP3-7.0 20901.247.0030.1038.34
SSP5-8.5 20503.347.7627.0338.13
SSP5-8.5 20901.508.1431.8041.45
Table 4. Future scenario prediction of land use types (×104 km2).
ModelClimate ScenariosFarmlandWoodlandGrasslandBare Land
MaxentSSP1-2.6 20502.459.333.060.01
SSP1-2.6 20902.608.493.290.01
SSP3-7.0 20503.7511.894.450.02
SSP3-7.0 20903.3812.024.180.01
SSP5-8.5 20503.2312.354.080.01
SSP5-8.5 20903.1511.033.840.01
RFSSP1-2.6 20506.2920.576.610.03
SSP1-2.6 20906.9221.007.010.03
SSP3-7.0 20507.5222.127.520.03
SSP3-7.0 20906.9122.497.770.03
SSP5-8.5 20507.1522.287.640.03
SSP5-8.5 20907.5424.108.470.05
Disclaimer/Publisher’s Note: The statements, opinions and data contained in all publications are solely those of the individual author(s) and contributor(s) and not of MDPI and/or the editor(s). MDPI and/or the editor(s) disclaim responsibility for any injury to people or property resulting from any ideas, methods, instructions or products referred to in the content.

