Abstract
Extreme drought events, intensified by climate change, critically threaten aquatic ecosystem stability by restructuring phytoplankton communities. However, the mechanisms underlying drought-driven community assembly remain poorly understood. This study investigated the impacts of extreme drought on phytoplankton community dynamics in the aquatic reserves of Jiujiang City, China, a critical ecotone of the Yangtze River and Poyang Lake. Through multi-temporal sampling (2022–2023) across 12 sites, we integrated taxonomic, functional group, and co-occurrence network analyses with environmental driver assessments. The results revealed that extreme drought significantly reduced phytoplankton species diversity and triggered a functional shift from disturbance-adapted (e.g., MP group) to pollution-tolerant taxa (e.g., W1 group). Deterministic processes dominated community assembly, driven by drought-induced environmental filtering through water temperature, dissolved oxygen, and nutrient fluctuations. Copper emerged as a key stressor, correlating with the abundance of Cryptophyta. Co-occurrence networks, cohesion, and robustness exhibited heightened complexity and stability under extreme drought, emphasizing stress-induced mutualistic interactions. Our findings elucidate how drought reshapes phytoplankton communities via nutrient dynamics and deterministic species interactions, offering critical insights for managing aquatic ecosystems under escalating climatic extremes.
1. Introduction
Due to the impacts of climate change, the frequency and intensity of hydrological extremes have been persistently increasing, posing escalating threats to global freshwater ecosystems [1]. Among these extremes, drought stands out as a particularly concerning climatic event that significantly alters the physical, chemical, and biological attributes of aquatic environments [2]. Drought not only reduces direct surface runoff replenishment and exacerbates sediment accumulation but also constrains species’ habitat space, significantly affecting species distribution and abundance [3,4].
Phytoplankton is an essential primary producer within these systems, the structural stability of which is important for maintaining the equilibrium of freshwater ecosystems [5,6]. Phytoplankton communities are highly sensitive to acute environmental disturbances (e.g., extreme drought), with their rapid responses to such disturbances directly impairing ecosystem functionality [7]. Therefore, understanding how extreme drought disturbances reshape phytoplankton communities and their assembly mechanisms is critical. According to community assembly theory, species coexistence is influenced by both deterministic processes (e.g., environmental filtering, niche differentiation) and stochastic processes (e.g., dispersal limitation, demographic drift) [8,9,10]. For instance, in the Tuojiang River Basin, deterministic nutrient limitations (N/P ratio > 16:1) were identified as key regulators of phytoplankton succession [11], while dispersal limitation contributed to community heterogeneity in Longhu Lake [12]. However, the relative contributions of these mechanisms during drought events, particularly in dynamic river–lake ecotones, remain poorly understood. Drought-induced habitat fragmentation and nutrient concentration may strengthen deterministic selection, yet stochastic colonization events may still occur in isolated water bodies [13,14]. Resolving this interplay is essential for predicting ecosystem responses to climatic extremes.
The confluence of the Yangtze River and Poyang Lake represents a unique ecotone characterized by fluctuating hydrological connectivity and habitat heterogeneity [15]. This region is home to several important, rare aquatic species, such as Coilia nasus and Neophocaena asiaeorientalis, making it a sentinel ecosystem for studying the impacts of extreme climate change [16]. Recent studies have systematically characterized hydrological pollution-driven fluvial-lacustrine connectivity impacts on aquatic nutrient stoichiometry [17], elucidated hydrological pulsing-mediated assembly dynamics of phytoplankton communities [18], and investigated functional group-regulated successional trajectories in phytoplankton assemblages [19]. However, the responses of plankton communities in this region to extreme hydrological changes, especially extreme drought and other climatic factors, remain poorly understood.
To address this gap, plankton surveys were conducted in the aquatic resource conservation zones from 2022 (during an extreme drought) to 2023. This study aims to 1. quantify drought-induced shifts in phytoplankton species diversity and functional traits; 2. identify the dominant environmental drivers (e.g., nutrients, trace metals) and their interactions with community assembly processes; 3. resolve the relative roles of deterministic versus stochastic mechanisms in structuring communities under extreme drought conditions. We hypothesize that extreme drought will significantly reduce phytoplankton species’ diversity, alter functional groups, and enhance the role of deterministic processes in community assembly. Our findings provide mechanistic insights into how hydrological extremes reshape aquatic ecosystems in China, offering guidance for conservation strategies aimed at protecting biodiversity hotspots under the pressures of climate change.
2. Materials and Methods
2.1. The Study Area and Investigation Period
The study area includes the Yangtze River mainstream within Jiujiang City (28°47′~30°06′ N, 115°31′~117°09′ E), the Poyang Lake main body, and its major tributaries, with a primary focus on the spatial distribution characteristics of national aquatic resource reserves. The specific sampling locations can be found in Appendix A (Table A1). Within these reserves, 12 sampling sites were established (Figure 1), specifically in the aquatic reserves of important rare and economically valuable fish species, such as: Leiocassis longirostris, Neophocaena asiaeorientalis, Culter alburnus, Pelteobagrus fulvidraco, Hyriopsis cumingii, Elopichthys bambusa, and Spinibarbus hollandi. Phytoplankton samples were collected, and aquatic environmental parameters were measured at all sites during the October 2022 extreme dry period (2022-EDP), June 2023 wet period (2023-WP), and October 2023 dry period (2023-DP), with GPS coordinates recorded for each sampling location.
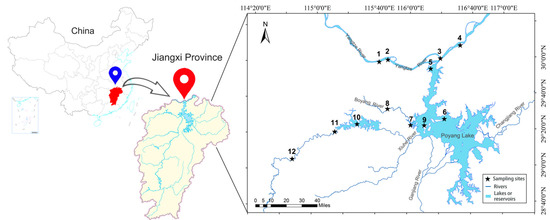
Figure 1.
Sampling sites in the aquatic reserves of the confluence of Poyang Lake and Yangtze River.
2.2. Aquatic Environmental Parameters
Water environmental factors including water temperature (WT), pH, and dissolved oxygen (DO), were measured in situ at each sampling point using a YSI Pro Plus multi-probe meter. Chemical analyses samples (1 L water) were collected from surface waters (the top 50 cm) at 12 sampling points [20], including total phosphorus (TP), total nitrogen (TN), ammonium (NH4+-N), and chemical oxygen demand (CODMn). All chemical analyses were performed according to standard methods [21]. Copper ions (Cu) were analyzed by using atomic absorption spectrophotometry [22].
2.3. Sampling and Identification of Phytoplankton
Qualitative phytoplankton samples were collected using a plankton net with a mesh size of 64 μm [10]. One liter of mixed water samples was collected at depths of 0.5 m and 1.5 m for the quantitative analysis of phytoplankton. Lugol’s iodine solution (1.5%) and formalin were added on site for fixation. After being brought back to the laboratory, the samples were allowed to settle for 48 h. The supernatant was then removed by aspiration, and the phytoplankton samples were concentrated to a volume of 30 mL. The cell abundance of phytoplankton was counted with a light microscope (Olympus BX53-DIC; Olympus DP72 digital camera). All phytoplankton were identified according to the classical taxonomy literature [23,24,25].
2.4. Phytoplankton Functional Groups
Phytoplankton functional groups (FGs) were classified based on the Reynolds–Padisák FG framework [26], as well as the latest studies by others [27,28,29,30,31].
2.5. Statistical Analysis
This study systematically investigated the spatiotemporal patterns and driving mechanisms of phytoplankton communities through an integrated analytical framework. Spatiotemporal distributions of sampling sites and phytoplankton density were visualized via ArcGIS 10.8. Dominant taxa were identified using McNaughton’s dominance index (Y ≧ 0.02) [32] in SPSS 25.0. Hellinger-transformed species composition data were subjected to Principal Component Analysis (PCA) to elucidate environmental gradients and Analysis of Similarity (ANOSIM) for temporal community heterogeneity using the vegan 2.6-4 package in R 4.4.2. A Bray–Curtis distance decay model [33] quantified the relative contributions of geographic and environmental factors to β-diversity, while the modified stochasticity ratio (MST) [34] derived from Jaccard-based null modeling (NST package) discriminated deterministic versus stochastic assembly processes. The supplementary rainfall data of drought severity (DS) are in Appendix A (Table A3). In PCA analysis, we used 1 to represent extreme drought and 0 to represent a normal hydrological period. Key drivers were screened by Mantel tests [35], with variance partitioning analysis (varpart package) delineating the explanatory rates of geographic/environmental factors. Spearman correlation analysis (|R| > 0.6, p < 0.05; psych package) identified significant associations, and network topology (Gephi 0.9.7) was evaluated for positive/negative cohesion and 50% node-removal robustness following Herren and McMahon [36,37]. All statistical analyses and visualizations were conducted in Origin 2021 and Excel 2016.
3. Results
3.1. Environmental Parameters
Aquatic reserves in different hydrological periods showed specific water quality characteristics that depended on seasonal changes. Compared with normal hydrological years, the physicochemical parameters of water bodies during the 2022 extreme drought exhibited significant alterations, demonstrating distinct hydrological characteristics in their environmental response patterns. During the 2022 extreme drought, water bodies exhibited significantly lower WT and DO levels (p < 0.01; Figure 2a,c) compared to the wet and normal seasons of 2023, accompanied by declines in CODMn, NH4+-N, and Cu concentrations (Figure 2d,h,i). During the extreme dry period in 2022, the DO was 7.38 ± 0.38 mg/L, and the average WT was 21.04 ± 0.93 °C (Table A2), both significantly lower than in other periods (p < 0.05). And the range in values for TN/TP was lower in other periods (Figure 2g). In contrast, the range in values for TN concentration and pH were relatively higher (Figure 2b,e). Mean, maximum, and minimum values of TN varied considerably during the drought period, ranging from 0.39 to 2.32 mg/L.
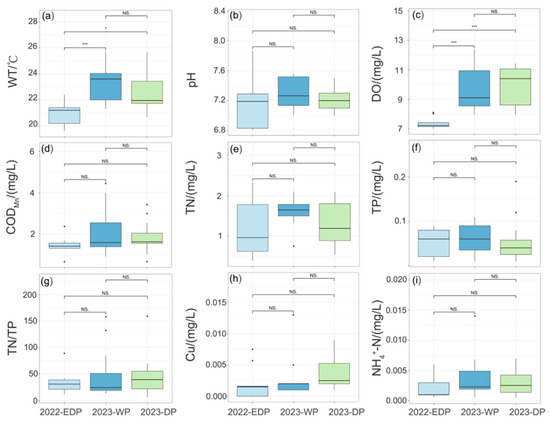
Figure 2.
Statistical comparison of water quality parameter variations across distinct hydrological periods. (a) water temperature (WT), (b) pH, (c) dissolved oxygen (DO), (d) chemical oxygen demand (CODMn), (e) total nitrogen (TN), (f) total phosphorus (TP), (g) TN/TP, (h) Cu, (i) ammonium (NH4+-N). NS stands for no significant difference, * stands for p < 0.05 and *** stands for p < 0.001.
3.2. Phytoplankton Community Assemblage Structure
A total of 179 species belonging to 89 genera and 7 phyla of phytoplankton were identified. Chlorophyta (66 species) and Bacillariophyta (51 species) were the most abundant, accounting for 36.87 and 28.49% of the total species (Figure 3). Bacillariophyta has the largest number of species and genera. The species composition varied across three hydrological periods. Species numbers were the highest in the wet season in 2023 (146 species) and the lowest in the dry season in 2022 (127 species).
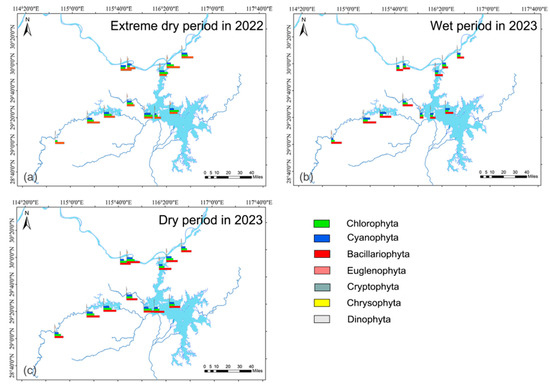
Figure 3.
Phytoplankton composition in aquatic reserves during different hydrological periods. (a) 2022 extreme dry period, (b) 2023 wet period, (c) 2023 dry period.
Phytoplankton abundance was the highest in the wet period, and the lowest in the dry period. There were spatial and temporal differences in phytoplankton cell abundance composition (Figure 3a–c). The average phytoplankton abundance ranged from 8.68 × 10⁶ to 9.27 × 10⁶ cells/L in different hydrological periods. Bacillariophyta had the highest abundance in all hydrological periods, with an average of 4.10 × 10⁶ to 4.64 × 10⁶ cells/L, accounting for 45.42–51.41% of the total cell abundance. This is followed by Chlorophyta (27.72%) and Cyanophyta (19.99%). Chlorophyta showed higher abundance in two dry periods, and Bacillariophyta, Dinophyta, and Cyanophyta in the wet period.
3.3. Dominant Phytoplankton Species
A total of 14 dominant phytoplankton species spanning three taxonomic phyla were identified across three hydrological periods: Cyanobacteria (four species), Bacillariophyta (six species), and Chlorophyta (four species) (Table 1). Marked temporal variations in dominant species composition were observed, with species’ richness peaking during the dry season (13 species) compared to the wet season (6 species). Four persistent dominants—Aulacoseira granulata, Aulacoseira granulata var. angustissima (Bacillariophyta), Ulnaria acus (Bacillariophyta), and Pediastrum simplex var. duodenarium (Chlorophyta)—maintained consistent presence across all hydrological phases. Notably, A. granulate exhibited absolute dominance, with its dominance index (Y) significantly exceeding 0.1. Species-specific responses to hydrological extremes were evident: three taxa—Microcystis aeruginosa and Planktothrix agardhii (Cyanobacteria), along with Navicula spp. (Bacillariophyta)—were notably restricted to the 2022 extreme drought period.

Table 1.
Dominant phytoplankton species in the aquatic reserves.
3.4. Phytoplankton Community Functional Groups
Phytoplankton community analysis in the fishery resource conservation zone (2022–2023) identified 179 species classified into 29 functional groups (Table 2), with dominant status assigned to groups exceeding 5% relative biomass. Groups J (27 species) and MP (23 species) exhibited the highest species richness. Eight functional groups (P, D, MP, F, J, S1, W1, W2) demonstrated hydrological-period-driven dominance shifts, following a successional trajectory: MP/P/D → W1/J/P → W1/J/MP. Group MP dominated dry-phase communities, constituting 25.28% and 14.53% of total phytoplankton biomass during the 2022 extreme drought and 2023 dry period, respectively. Distinct drought-responsive patterns emerged: Group W1 (Phacus spp. And Euglena spp.), Group J (Pediastrum spp. and Tetraedron spp.), and Group S1 (Planktothrix spp.) were exclusively enriched during the 2022 extreme drought event.
Table 2.
Composition functional groups of phytoplankton in the aquatic reserves.
3.5. Relationships Between Environmental Factors and Phytoplankton Community
Multivariate analysis of environmental drivers revealed distinct hydrological signatures (Figure 4). Principal Component Analysis (PCA) captured 50.3% of total variance through its first two axes (PC1: 29.0%, PC2: 21.3%). PC1 exhibited the strongest loadings from drought severity (DS), water temperature (WT), and dissolved oxygen (DO), while PC2 primarily reflected DO, total phosphorus (TP), copper (Cu), and total nitrogen (TN) gradients. Ordination patterns showed pronounced separation between the 2022 extreme drought and 2023 hydrological periods. Variance Partitioning Analysis (VPA) attributed 8.10% of phytoplankton communities’ variation to environmental factors versus 0.81% to spatial distance, leaving 91.09% unexplained (likely reflecting unmeasured biotic/stochastic processes). Mantel tests identified significant Cryptophyta–Cu correlations (r2 = 0.426, p < 0.01), highlighting metal-driven community responses.
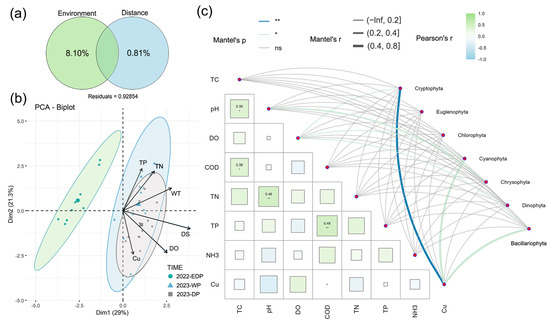
Figure 4.
Principal component analysis (PCA) (a) and variation partitioning analysis (VPA) (b) of phytoplankton communities. Correlations between phytoplankton communities and environmental factors were evaluated using Mantel tests (c). Edge width represents the R value, while edge color indicates statistical significance. The color gradient corresponds to Pearson’s r correlation coefficients for environmental indicators and phytoplankton communities.
3.6. Community Assembly Mechanisms of Phytoplankton Communities
The modified stochasticity ratio (MST) serves as a critical threshold in community ecology studies, where MST < 0.5 indicates deterministic processes dominating community assembly, while MST > 0.5 suggests stochastic processes are primary drivers of species distributions. The assembly of phytoplankton communities was stochastic during both the wet period (WP) and dry period (DP) in 2023, whereas in the extreme dry period (EDP) of 2022, both deterministic and stochastic processes played a role, with deterministic processes being predominant (Figure 5a).
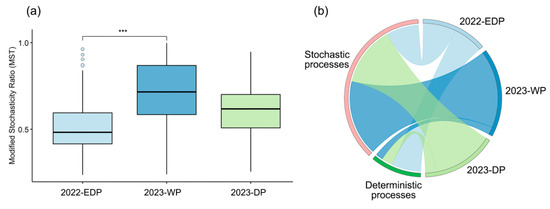
Figure 5.
Analysis of phytoplankton community assembly mechanisms across different hydrological periods. (a) Boxplot of the modified stochasticity ratio (MST) for phytoplankton communities in three hydrological periods. The MST reflects the relative contribution of stochastic processes to community assembly, with lower values indicating stronger deterministic control. Significant differences between periods are marked with *** (p < 0.001). (b) Chord diagram illustrating the proportional contributions and interactions of deterministic and stochastic processes in shaping phytoplankton community assembly across the three periods.
During the extreme dry period in 2022, deterministic processes accounted for 60.61%, exceeding stochastic processes (39.39%), indicating that environmental pressures played a stronger role in shaping phytoplankton community composition under extreme conditions. Conversely, during the wet period and dry period in 2023, stochastic processes were dominant, making up 84.85% and 75.76%, respectively (Figure 5b). This suggests that in more hydrologically stable conditions, random ecological drift and dispersal processes have a greater influence on community assembly.
Overall, these results suggest that dry extremes enhance deterministic processes in phytoplankton-community assembly, likely due to stronger environmental filtering effects, while under wetter conditions, stochasticity dominates due to weaker environmental constraints and increased dispersal.
3.7. Co-Occurrence Network Stability and Complexity of Phytoplankton Communities
Through the co-occurrence networks of the phytoplankton communities, the interaction patterns during three hydrological periods in the aquatic reserves of Jiujiang’s administrative districts were elucidated (Figure 6a–c). According to the network topological parameters summarized in Table 3, the extreme dry period in 2022 was characterized by 45 nodes and 74 edges, with a 99% positive association and only a 1% negative association. The average degree was 3.29, the network diameter 1.84, and the network density 0.07, indicating a more tightly connected and stable network. In contrast, during the 2023 wet period, the network consisted of 49 nodes and 72 edges, with 100% positive associations, yet the average degree decreased to 2.94, accompanied by a lower network diameter and density. The 2023 dry period exhibited an even sparser network, with only 26 nodes, 20 edges, and an average degree of 1.54, despite maintaining 100% positive associations.
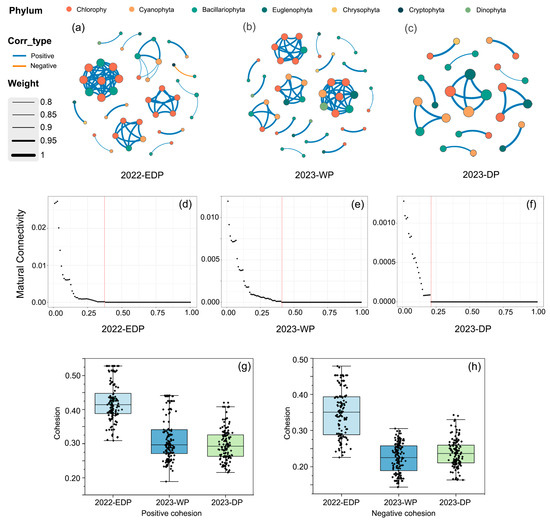
Figure 6.
Co-occurrence network analysis and related metrics of phytoplankton communities across different hydrological periods. (a–c) Co-occurrence networks of phytoplankton communities in three hydrological periods. Nodes represent different phyla. Edge thickness reflects the correlation weight, with blue and orange lines representing positive and negative correlations, respectively. (d–f) Network robustness analysis, showing the relationship between the proportion of removed 50% nodes and mutual connectivity. (g,h) Positive and negative cohesion across the three periods.
Table 3.
Network topological parameters of phytoplankton co-occurrence networks.
Moreover, the high modularity values (0.72, 0.78, and 0.85 for the three periods, respectively) suggest a pronounced modular structure, which may confer enhanced resilience to external disturbances. Analyses of positive and negative cohesion follow 2022 extreme dry period > 2023 wet period > 2023 dry period (Figure 6g,h). Robustness analyses follow 2023 wet period > 2022 extreme dry period > 2023 dry period (Figure 6d–f). Collectively, these results indicate that, under extreme dry conditions, the phytoplankton communities may reinforce their internal connectivity and interaction dynamics to maintain ecosystem stability and function.
4. Discussion
4.1. Patterns of Phytoplankton Community Diversity Caused by Drought
Our results demonstrate that dry extremes enhance deterministic processes in phytoplankton community assembly within the aquatic reserves of Jiujiang’s administrative districts, driven by synergistic shifts in environmental conditions and species interactions. During drought, Bacillariophyta exhibited persistent dominance, highlighting their resilience to hydrological fluctuations. Taxa such as A. granulata leveraged strong turbulence for buoyancy and nutrient uptake, enabling their competitive advantage under low-flow conditions [38,39]. Drought stress induces the upregulation of enzymatic (e.g., superoxide dismutase, catalase) and non-enzymatic (e.g., glutathione, carotenoids) antioxidant systems in diatoms, effectively mitigating oxidative damage through coordinated redox homeostasis maintenance [40]. In contrast, Ulnaria acus demonstrates ecological specialization through proliferative dominance in turbulent hydrodynamic regimes characterized by elevated nutrient fluxes [14]. While cyanobacterial taxa (e.g., Dolichospermum spp.) exploit drought-enhanced nutrient bioavailability and thermal stratification gradients [41], prolonged aridity concurrently suppresses photosynthetic pigment biosynthesis (particularly phycocyanin) and depresses cellular metabolism rates. To circumvent these physiological constraints, cyanobacteria may deploy adaptive morphogenetic strategies including (1) enhanced mucilage production facilitating colonial aggregation and (2) differentiation of stress-resistant akinete structures, thereby achieving ecological persistence under hydrological stress [42]. These dynamics mirror findings from shallow lakes, where sediment resuspension and nutrient pulses amplify deterministic selection during low-water periods [43,44]. Similar responses were observed in Dongting Lake during the 2022 summer–autumn drought, where declining water levels exacerbated eutrophication and shifted the phytoplankton community from Bacillariophyta to Cyanophyta and Chlorophyta [45]. This underscores the broader applicability of our findings across connected lake systems. Additionally, studies in reservoirs of the southeastern United States revealed that drought and stormflow events significantly influenced phytoplankton biomass and community structure by altering water retention times and nutrient inputs [46]. These comparisons highlight the role of hydrological dynamics in shaping phytoplankton communities, particularly in systems influenced by anthropogenic activities. Consequently, phytoplankton species’ richness declined during drought (127 species in the 2022 extreme dry period vs. 146 in the 2023 wet period), consistent with global patterns where hydrological stress reduces niche availability, favoring pollution-tolerant taxa over disturbance-adapted groups [13,47]. Similar phenomena also existed in the transformation of functional groups, from MP as the main functional group in the extreme drought period to the W1 functional group dominated by Euglenophyta in 2023, likely driven by nutrient concentration and organic pollution intensification [44,48]. Ummenhofer et al. found that the W1 functional group is suitable for survival in eutrophic water bodies, and is positively correlated with environmental factors such as CODMn, water transparency, and DO, which is consistent with our results. These findings underscore hydrological shifts as a key driver of phytoplankton community structure, with post-drought succession reflecting a transition from disturbance-adapted to pollution-tolerant strategies in the dynamic ecosystem of Poyang Lake [49,50].
4.2. Analysis of the Construction Mechanism and Driving Mechanism of Arid Phytoplankton Community
Beyond community composition shifts, our study reveals that deterministic processes (60.61%) overwhelmingly governed phytoplankton assembly during extreme drought, in contrast to riverine systems where hydrological connectivity fostered dispersal-driven stochasticity [36]. Drought intensified environmental gradients, with water temperature, dissolved oxygen, and copper emerging as critical drivers. Principal Component Analysis (PCA) identified drought intensity (DS), water temperature (WT), dissolved oxygen (DO), total phosphorus (TP), copper (Cu), and total nitrogen (TN) as primary factors shaping phytoplankton distribution. Mantel tests confirmed a significant correlation between Cu and Cryptophyta (p < 0.01), corroborating previous evidence that Cu serves dual functional roles as both a critical micronutrient and potential toxin in aquatic environments [51]. This observation implies that sublethal Cu concentrations may suppress photosynthetic activity in sensitive taxa, while simultaneously enhancing the competitive advantage of metal-tolerant species [52]. Empirical investigations conducted in the fluvial systems of Tongling City demonstrated a marked negative correlation between Cu levels and phytoplankton diversity metrics (richness and abundance), thereby influencing community structure and ecological stability [53]. Similarly, in the Yanghe Reservoir, Cu shows a significant negative correlation with chlorophyll a concentration, indicating Cu-mediated constraints on phytoplankton proliferation and structural reorganization during bloom events [54]. Moreover, diatoms (e.g., Dolichospermum spp.) exhibit pronounced sensitivity to Cu ions among phytoplankton groups, with Cu exposure influencing species-specific toxicity thresholds [51,55]. Thus, Cu-driven niche partitioning highlights the underexplored role of trace metals in mediating the impacts of drought, particularly within anthropogenically impacted ecosystems.
Our results indicate that, beyond environmental filtering, species interactions played a crucial role in stabilizing phytoplankton communities under extreme drought (Figure 6). Co-occurrence network analysis revealed that drought strengthened community stability through intensified mutualism and modularity (modularity index = 0.72–0.85), indicating that cooperative strategies mitigated environmental stress [56,57]. Variance partitioning analysis (VPA) further demonstrated that environmental and geographic factors jointly explained less than 10% of community variation, suggesting that deterministic processes, particularly species interactions, dominated phytoplankton assembly during drought [36]. The 2022 extreme drought period exhibited the highest network complexity, with positive associations increasing by 1% (compared to the 2023 wet season) and 73% (compared to the 2023 dry season), reflecting a shift toward synergistic adaptation over competition. Cohesion analysis reinforced this trend, showing significantly elevated positive cohesion (facilitative interactions) and negative cohesion (competition/niche partitioning) during the 2022 drought [56], suggesting intensified interspecific linkages in response to hydrological stress. Additionally, species extinction simulations demonstrated that network robustness peaked during the 2023 wet period, followed by the 2022 extreme dry period, implying that strengthened species interdependencies enhanced resistance to biodiversity loss [37,58]. For instance, Euglena-dominated W1 groups (26.42% dominance in the 2023 dry season) exhibited strong associations with heterotrophic bacteria, potentially facilitating organic matter degradation [59]. Meanwhile, the minimal proportion of negative interactions (1% in 2022) suggests reduced competition, favoring functional redundancy. These findings highlight how drought restructures species interdependencies to optimize phytoplankton community architecture and reinforce ecosystem resilience. However, the high proportion of unexplained variance in VPA (93%) suggests that additional factors—such as predation pressure, dispersal processes, or human impacts—may further shape drought-induced community assembly. Extreme drought may potentially influence the composition of zooplankton communities and the abundance and spatial distribution of filter-feeding fish [60]. Changes in filter-feeding fish and zooplankton may, in turn, alter the assembly mechanisms of phytoplankton communities by modifying grazing pressure [61]. Furthermore, dispersal limitation may constrain effective niche partitioning along climatic gradients [62], indicating that spatial connectivity exerts stronger regulatory control on phytoplankton assemblage organization than regional climate variables. Moreover, the annual pollutant discharge, long-term sand mining, and upstream reservoir operations in Poyang Lake [10], as key anthropogenic activities, may also influence the phytoplankton community structure. These cumulative anthropogenic drivers collectively amplify nutrient enrichment (particularly nitrogen and phosphorus loading), depress hydrological baseline levels, and perturb suspended sediment budgets. Such multi-stressor interactions fundamentally reconfigure the limnological template through alterations in turbidity regimes, photic zone depth, and biogeochemical cycling rates [63]. Consequently, these cascading physicochemical modifications propagate through ecological networks, restructuring phytoplankton community architecture (e.g., shifting dominance from diatoms to cyanobacteria) and modifying bloom phenology patterns [10].
5. Conclusions
Our findings reveal that extreme drought fundamentally restructures phytoplankton community assembly in the aquatic reserves at the confluence of Poyang Lake and the Yangtze River, primarily through enhancing deterministic environmental filtering and altering species interactions that shift the community from disturbance-adapted to pollution-tolerant taxa. However, the relatively low explanatory power of the variance partitioning analysis (VPA) models indicates that unmeasured biotic interactions and stochastic processes are also likely to contribute to community dynamics, underscoring the need for further long-term and mechanistic studies. These insights are significant for aquatic ecosystem management under climate extremes, as they highlight the importance of targeted nutrient and trace element regulation to enhance ecosystem resilience. From the lake conservation and management perspective, this study provides critical insights into how extreme drought impacts phytoplankton community assembly and drivers in connected lakes. Subsequent high-frequency monitoring and experiments will quantify long-term ecological impacts, enhance predictive capabilities, and guide adaptive management strategies.
Author Contributions
Conceptualization, Y.J. and W.S.; methodology, W.Z.; software, Y.J.; validation, L.F., B.Z. and C.K.; formal analysis, Y.J.; investigation, Q.X.; resources, Q.X.; data curation, W.S.; writing—original draft preparation, Y.J.; writing—review and editing, W.S.; visualization, L.F.; supervision, L.F.; project administration, W.Z.; funding acquisition, B.Z. and C.K. All authors have read and agreed to the published version of the manuscript.
Funding
The study was supported by the National Key Research and Development Program of China (2022YFC2601305).
Data Availability Statement
Data are unavailable due to privacy or ethical restrictions.
Acknowledgments
We thank our advisor, Wei Zhang and Qun Xu, for their guidance and valuable suggestions throughout the research. We are grateful to Yufei Jiang and Wenting Shen for their help in writing and translating the manuscript. We also acknowledge the assistance of Lei Fang, Bao Zhang, Chiping Kong and Yeling Qu in field data collection.
Conflicts of Interest
The authors declare no conflicts of interest.
Appendix A
Table A1.
Aquatic reserves corresponding to the sampling sites.
Table A1.
Aquatic reserves corresponding to the sampling sites.
| Site | Water Body | Aquatic Reserves |
|---|---|---|
| 1 | Yangtze River Mainstem | Yangtze River Jiangxi Section Four Major Chinese Carps National Aquatic Germplasm Resources Conservation Zone Core Area |
| 2 | Yangtze River Mainstem | Yangtze River Jiangxi Section Four Major Chinese Carps National Aquatic Germplasm Resources Conservation Zone Experimental Area |
| 3 | Yangtze River Mainstem | Yangtze River Bajiang Section Leiocassis longirostris National Aquatic Germplasm Resources Conservation Zone Core Area |
| 4 | Yangtze River Mainstem | Yangtze River Bajiang Section Leiocassis longirostris National Aquatic Germplasm Resources Conservation Zone Experimental Area |
| 5 | Poyang Lake | Yangtze River Bajiang Section Leiocassis longirostris National Aquatic Germplasm Resources Conservation Zone |
| 6 | Poyang Lake | Poyang Lake Yangtze Neophocaena asiaeorientalis Provincial Nature Reserve |
| 7 | Boyang River | De’an County Boyang River Culter alburnus and Pelteobagrus fulvidraco National Aquatic Germplasm Resources Conservation Zone |
| 8 | Boyang River | De’an County Boyang River Culter alburnus and Pelteobagrus fulvidraco National Aquatic Germplasm Resources Conservation Zone |
| 9 | Xiu River Mainstem | Lower Xiuhe River Hyriopsis cumingii National Aquatic Germplasm Resources Conservation Zone |
| 10 | Xiu River Mainstem | Lushanxihi Lake Elopichthvs bambusa National Aquatic Germplasm Resources Conservation Zone |
| 11 | Xiu River Mainstem | Lushanxihi Lake Elopichthvs bambusa National Aquatic Germplasm Resources Conservation Zone |
| 12 | Xiu River Mainstem | Liuxi River Spinibarbus hollandi of Aquatic Germplasm Resources National Conservation Zone |
Table A2.
Mean values and standard deviations of physicochemical factors in the confluence of Poyang Lake and Yangtze River.
Table A2.
Mean values and standard deviations of physicochemical factors in the confluence of Poyang Lake and Yangtze River.
| Index | 22-EDP | 23-WP | 23-DP |
|---|---|---|---|
| WT/°C | 21.04 ± 0.93 | 23.26 ± 1.28 | 22.58 ± 1.5 |
| pH | 7.2 ± 0.37 | 7.29 ± 0.2 | 7.19 ± 0.14 |
| DO/(mg/L) | 7.38 ± 0.38 | 9.76 ± 1.57 | 9.93 ± 1.28 |
| CODMn/(mg/L) | 1.45 ± 0.42 | 2.06 ± 1.09 | 1.83 ± 0.75 |
| TN/(mg/L) | 1.2 ± 0.68 | 1.61 ± 0.33 | 1.31 ± 0.54 |
| TP/(mg/L) | 0.05 ± 0.03 | 0.06 ± 0.03 | 0.06 ± 0.05 |
| TN/TP | 33.65 ± 22.02 | 48.608 ± 47.008 | 45.994 ± 39.47 |
| NH3-N/(mg/L) | 0.002 ± 0.002 | 0.004 ± 0.004 | 0.003 ± 0.002 |
| Cu/(mg/L) | 0.002 ± 0.003 | 0.003 ± 0.003 | 0.004 ± 0.002 |
Table A3.
Precipitation in Jiujiang City from September 2022 to December 2023.
Table A3.
Precipitation in Jiujiang City from September 2022 to December 2023.
| Time Period | Sep 2022 | Oct 2022 | Nov 2022 | Dec 2022 | Jan 2023 | Feb 2023 | Mar 2023 | Apr 2023 | May 2023 | Jun 2023 | Jul 2023 | Aug 2023 | Sep 2023 | Oct 2023 | Nov 2023 | Dec 2023 |
|---|---|---|---|---|---|---|---|---|---|---|---|---|---|---|---|---|
| Precipitation (mm) | 85 | 60 | 45 | 30 | 50 | 75 | 120 | 150 | 200 | 280 | 250 | 180 | 90 | 70 | 40 | 35 |
References
- Ummenhofer, C.C.; Meehl, G.A. Extreme weather and climate events with ecological relevance: A review. Philos. Trans. R. Soc. B Biol. Sci. 2017, 372, 20160135. [Google Scholar] [CrossRef] [PubMed]
- Graham, D.J.; Bierkens, M.F.P.; Van Vliet, M.T.H. Impacts of droughts and heatwaves on river water quality worldwide. J. Hydrol. 2024, 629, 130590. [Google Scholar] [CrossRef]
- Zhang, P.; Zou, Y.; Tao, K.; Zhang, S.; Li, F.; Deng, Z.; Zeng, J.; Xie, Y.; Liu, X.; Li, F. Extreme drought alters waterfowl distribution patterns and spatial niches in floodplain wetlands. Glob. Ecol. Conserv. 2024, 51, e02901. [Google Scholar] [CrossRef]
- Qiu, J.; Shen, Z.; Xie, H. Drought impacts on hydrology and water quality under climate change. Sci. Total Environ. 2023, 858, 159854. [Google Scholar] [CrossRef]
- Xu, H.; Paerl, H.W.; Qin, B.; Zhu, G.; Gaoa, G. Nitrogen and phosphorus inputs control phytoplankton growth in eutrophic Lake Taihu, China. Limnol. Oceanogr. 2010, 55, 420–432. [Google Scholar] [CrossRef]
- Bao, Q.; He, H.; Tang, H.; Tang, X.; Li, X.; Ding, Y.; Zhao, M. Spatial and temporal characteristics of phytoplankton community structure and their environmental driving factors in Lake Lugu. J. Lakes Sci. 2025, 1–18. [Google Scholar]
- Yang, J.R.; Lv, H.; Isabwe, A.; Liu, L.; Yu, X.; Chen, H.; Yang, J. Disturbance-induced phytoplankton regime shifts and recovery of cyanobacteria dominance in two subtropical reservoirs. Water Res. 2017, 120, 52–63. [Google Scholar] [CrossRef]
- Xu, Z.; Cheung, S.; Endo, H.; Xia, X.; Wu, W.; Chen, B.; Ho, N.H.E.; Suzuki, K.; Li, M.; Liu, H. Disentangling the Ecological Processes Shaping the Latitudinal Pattern of Phytoplankton Communities in the Pacific Ocean. mSystems 2022, 7, e0120321. [Google Scholar] [CrossRef] [PubMed]
- Liu, H.; Cheng, W.; Xiong, P.; Li, H.; Liu, Z.; Ai, J.; Yuan, D.; Wan, F.; Wan, Y.; Zou, H.; et al. Temporal variation of plankton and zoobenthos communities in a freshwater reservoir: Structure feature, construction mechanism, associated symbiosis and environmental response. Ecol. Indic. 2023, 154, 110774. [Google Scholar] [CrossRef]
- Chao, X.; Yang, S.X.; Liu, H.Q.; Yan, B.J.; Wei, P.P.; Wu, X.J.; Ba, S. Mechanism and driving factors of phytoplankton community construction in the lower reaches of Yarlung Zangbo River. J. Lakes Sci. 2025, 37, 215–229. [Google Scholar]
- Li, X.; Chen, K.; Wang, C.; Zhuo, T.; Li, H.; Wu, Y.; Lei, X.; Li, M.; Chen, B.; Chai, B. Deciphering environmental factors influencing phytoplankton community structure in a polluted urban river. J. Environ. Sci. 2025, 148, 375–386. [Google Scholar] [CrossRef] [PubMed]
- Jiang, Y.; Wang, Y.; Huang, Z.; Zheng, B.; Wen, Y.; Liu, G. Investigation of phytoplankton community structure and formation mechanism: A case study of Lake Longhu in Jinjiang. Front. Microbiol. 2023, 14, 1267299. [Google Scholar] [CrossRef] [PubMed]
- Xiao, W.; Laws, E.A.; Xie, Y.; Wang, L.; Liu, X.; Chen, J.; Chen, B.; Huang, B. Responses of marine phytoplankton communities to environmental changes: New insights from a niche classification scheme. Water Res. 2019, 166, 115070. [Google Scholar] [CrossRef] [PubMed]
- Wu, T.; Gao, R.; Tang, X.; Chu, Z.; Ye, B.; Yuan, Z. Light limitation during a compound drought and heat event inhibited algal blooms in a nutrient-rich shallow lake. Harmful Algae 2025, 142, 102796. [Google Scholar] [CrossRef]
- Yu, Q.; Xu, C.; Wu, H.; Ke, Y.; Zuo, X.; Luo, W.; Ren, H.; Gu, Q.; Wang, H.; Ma, W.; et al. Contrasting drought sensitivity of Eurasian and North American grasslands. Nature 2025, 639, 114–118. [Google Scholar] [CrossRef]
- Yang, H.L.; Shen, L.; He, Y.F.; Tian, H.W.; Gao, L.; Wu, J.M.; Mei, Z.G.; Wei, N.; Wang, L.; Zhu, T.B.; et al. Survey of Yangtze River Aquatic Resources and Environmental Background (2017–2021). Acta Hydrobiol. Sin. 2023, 47, 3–30. [Google Scholar]
- Wang, C.; Wang, X.; Xu, Y.J.; Lv, Q.; Ji, X.; Jia, S.; Liu, Z.; Mao, B. Nitrogen and phosphorus evolution process and driving mechanisms of three major freshwater lakes with different river-lake connectivity (DRLC) in the lower reaches of the Yangtze river, the largest river in Asia. J. Clean. Prod. 2025, 486, 144471. [Google Scholar] [CrossRef]
- Qian, K.; Liu, X.; Chen, Y. Effects of water level fluctuation on phytoplankton succession in Poyang Lake, China—A five year study. Ecohydrol. Hydrobiol. 2016, 16, 175–184. [Google Scholar] [CrossRef]
- Liu, J.; Zou, H.; Deng, F.; Liu, Y.; Li, W.; Xu, J.; Liu, S.; Wu, Q.; Zhang, X.; Weng, F.; et al. Phytoplankton functional groups in Poyang Lake: Succession and driving factors. J. Oceanol. Limnol. 2024, 42, 1764–1776. [Google Scholar] [CrossRef]
- Zhang, Z.S.; Huang, X.F. Research Methods of Freshwater Plankton; Science Press: Beijing, China, 1991. [Google Scholar]
- Editorial Board of “Monitoring and Analysis Methods of Water and Wastewater”; Ministry of Environmental Protection of the People’s Republic of China (Eds.) Monitoring and Analysis Methods of Water and Wastewater, 4th ed.; China Environmental Science Press: Beijing, China, 2002. [Google Scholar]
- Li, G.J.; Feng, J.P.; Ye, J.S. Alteration of water quality and succession characteristic of phytoplankton community in Nansha harbor area. Ecol. Sci. 2021, 40, 164–171. [Google Scholar]
- Zhao, W. Aquatic Biology; China Agriculture Press: Beijing, China, 2005. [Google Scholar]
- Wang, Q.X. Atlas of Algae in Shanghai Jiuduansha Wetland Nature Reserve and Its Adjacent Waters; Science Press: Beijing, China, 2008. [Google Scholar]
- Hu, H.J.; Wei, Y.X. The Freshwater Algae of China Systematics, Taxonomy and Ecology; Sciences Press: Beijing, China, 2006. [Google Scholar]
- Reynolds, C.S.; Huszar, V.; Kruk, C.; Naselli-Flores, L.; Melo, S. Towards a functional classification of the freshwater phytoplankton. J. Plankton Res. 2002, 24, 417–428. [Google Scholar] [CrossRef]
- Sun, X.; Wang, W. The impact of environmental parameters on phytoplankton functional groups in northeastern China. Ecol. Eng. 2021, 164, 106209. [Google Scholar] [CrossRef]
- Kozak, A.; Budzyńska, A.; Dondajewska-Pielka, R. Functional Groups of Phytoplankton and Their Relationship with Environmental Factors in the Restored Uzarzewskie Lake. Water 2020, 12, 313. [Google Scholar] [CrossRef]
- Padisak, J.; Crossetti, L.O.; Naselli-Flores, L. Use and misuse in the application of the phytoplankton functional classification: A critical review with updates. Hydrobiologia 2009, 621, 1–19. [Google Scholar] [CrossRef]
- Qian, Q.; Liu, B.; Chen, Y. Long term dynamics of phytoplankton functional groups in Lake Poyang during 2009-2016. J. Lakes Sci. 2019, 31, 1035–1044. [Google Scholar]
- Yang, L.; Zhang, W.; Shang, G.-X.; Zhang, J.-Y.; Wang, L.-Q.; Wei, H. Succession Characteristics of Phytoplankton Functional Groups and Their Relationships with Environmental Factors in Dianshan Lake, Shanghai. Environ. Sci. 2018, 39, 3158–3167. [Google Scholar]
- Mcnaughton, S.J. Relationships among Functional Properties of Californian Grassland. Nature 1967, 216, 168–169. [Google Scholar] [CrossRef]
- Dixon, P. VEGAN, A Package of R Functions for Community Ecology. J. Veg. Sci. 2003, 14, 927–930. [Google Scholar] [CrossRef]
- Ning, D.; Deng, Y.; Tiedje, J.M.; Zhou, J. A general framework for quantitatively assessing ecological stochasticity. Proc. Natl. Acad. Sci. USA 2019, 116, 16892–16898. [Google Scholar] [CrossRef]
- Li, P.; Li, W.; Dumbrell, A.J.; Liu, M.; Li, G.; Wu, M.; Jiang, C.; Li, Z. Spatial Variation in Soil Fungal Communities across Paddy Fields in Subtropical China. mSystems 2020, 5, e00704-19. [Google Scholar] [CrossRef]
- Herren, C.M.; McMahon, K.D. Cohesion: A method for quantifying the connectivity of microbial communities. ISME J. 2017, 11, 2426–2438. [Google Scholar] [CrossRef] [PubMed]
- Yuan, M.M.; Guo, X.; Wu, L.; Zhang, Y.A.; Xiao, N.; Ning, D.; Shi, Z.; Zhou, X.; Wu, L.; Yang, Y.; et al. Climate warming enhances microbial network complexity and stability. Nat. Clim. Change 2021, 11, 343–348. [Google Scholar] [CrossRef]
- Wang, J.; Liu, Q.; Zhao, X.; Borthwick, A.G.L.; Liu, Y.; Chen, Q.; Ni, J. Molecular biogeography of planktonic and benthic diatoms in the Yangtze River. Microbiome 2019, 7, 153. [Google Scholar] [CrossRef] [PubMed]
- Liu, Q.; Wang, T.; Xu, X.; Ni, J. Spatiotemporal Distribution and Its Influence Factors of Diatoms in the Middle and Lower Reaches of Hanjiang River. Acta Sci. Nat. Univ. Pekin. 2018, 54, 848–856. [Google Scholar]
- Gelis, M.N.; Sathicq, M.B.; del Puerto, J.P.; Pazos, R.S.; Tarda, A.S.; Gómez, N. Impact of extreme drought on diatom traits and species composition in temperate lowland streams. Hydrobiologia 2025, 852, 629–644. [Google Scholar] [CrossRef]
- Padisák, J.; Naselli-Flores, L. Phytoplankton in extreme environments: Importance and consequences of habitat permanency. Hydrobiologia 2021, 848, 157–176. [Google Scholar] [CrossRef]
- Simeunović, J.; Bešlin, K.; Svirčev, Z.; Kovač, D.; Babić, O. Impact of nitrogen and drought on phycobiliprotein content in terrestrial cyanobacterial strains. J. Appl. Phycol. 2013, 25, 597–607. [Google Scholar] [CrossRef]
- Rühland, K.M.; Paterson, A.M.; Smol, J.P. Lake diatom responses to warming: Reviewing the evidence. J. Paleolimnol. 2015, 54, 1–35. [Google Scholar] [CrossRef]
- Jing, D.Q.; Chai, Y.H.; Ju, Y.F.; Chai, Q.Y.; Yu, H.X.; Chai, F.Y.; Sun, X. Study on Phytoplankton Functional Groups and Nutrient Levels in Tuanjie Reservoir. Open J. Nat. Sci. 2021, 9, 672. [Google Scholar] [CrossRef]
- Yan, G.; Yin, X.; Wang, X.; Zhang, Y.; Wang, E.; Yu, Z.; Ma, X.; Huang, M. Effects of Summer and Autumn Drought on Eutrophication and the Phytoplankton Community in Dongting Lake in 2022. Toxics 2023, 11, 822. [Google Scholar] [CrossRef]
- Knapp, A.S.; Milewski, A.M. Spatiotemporal Relationships of Phytoplankton Blooms, Drought, and Rainstorms in Freshwater Reservoirs. Water 2020, 12, 404. [Google Scholar] [CrossRef]
- Liu, Y.J.; Liu, X.; Mu, X.Z.; Wu, L. Research status of microorganisms in a large, shallow lake Poyang Lake wetland. Microbiol. China 2019, 46, 3453–3460. [Google Scholar]
- Luo, J.H.; Yan, Y.; Xiao, F.; Cao, S.H.; Chen, M.M.; Du, Y. Monitoring and analysis of the Lake Poyang wetland drought process in 2022 based on spatiotemporal information fusion model. J. Lakes Sci. 2024, 36, 1525–1536. [Google Scholar]
- Li, W.X.; Jiang, M.L.; Xu, L.G.; Hu, S.P.; You, H.L.; Zhou, Q.P.; Chen, Z.; Zhang, L. Spatial and temporal characteristics of phytoplankton in Lake Poyang and its response to extreme flood and drying events. J. Lakes Sci. 2024, 36, 1001–1013. [Google Scholar]
- Deng, W.W.; Wang, R.; Liu, Z.W.; Zhen, W.X.; Zhang, C.X. The influencing factors of critical transition in shallow lakes revealed by model. Adv. Earth Sci. 2021, 36, 83–94. [Google Scholar]
- Lopez, J.S.; Lee, L.; Mackey, K.R.M. The Toxicity of Copper to Crocosphaera watsonii and Other Marine Phytoplankton: A Systematic Review. Front. Mar. Sci. 2019, 5, 511. [Google Scholar] [CrossRef]
- Li, J.H.; Zeng, Z.Q. Effects of Co, Ni, Cu, Zn ions on spectra of phycobiliprotein vesicle. J. Nanjing Univ. 1997, 33, 639–643. [Google Scholar]
- Wang, L.; Wei, W.; Zhou, P.; Li, Y.; Sun, Q.-Y. Phytoplankton’s community structure and its relationships with environmental factors in the rivers of Tongling City, Anhui Province of East China in winter. Chin. J. Appl. Ecol. 2013, 24, 243–250. [Google Scholar]
- Wang, L.P.; Zheng, B.H. Eutrophication development and its key affected factors in the Yanghe Reservoir. Acta Ecol. Sin. 2013, 33, 1011–1017. [Google Scholar] [CrossRef][Green Version]
- Vignardi, C.P.; Adeleye, A.S.; Kayal, M.; Oranu, E.; Miller, R.J.; Keller, A.A.; Holden, P.A.; Lenihan, H.S. Aging of Copper Nanoparticles in the Marine Environment Regulates Toxicity for a Coastal Phytoplankton Species. Environ. Sci. Technol. 2023, 57, 6989–6998. [Google Scholar] [CrossRef]
- Berry, D.; Widder, S. Deciphering microbial interactions and detecting keystone species with co-occurrence networks. Front. Microbiol. 2014, 5, 219. [Google Scholar] [CrossRef] [PubMed]
- Fu, H.; Cai, G.; Özkan, K.; Johansson, L.S.; Søndergaard, M.; Lauridsen, T.L.; Yuan, G.; Jeppesen, E. Re-oligotrophication and warming stabilize phytoplankton networks. Water Res. 2024, 253, 121325. [Google Scholar] [CrossRef] [PubMed]
- Fuhrman, J.A. Microbial community structure and its functional implications. Nature 2009, 459, 193–199. [Google Scholar] [CrossRef] [PubMed]
- Gomez-Casati, D.F.; Pernice, M.; Tonon, T. Algae. Sci. Rep. 2025, 15, 2034. [Google Scholar] [CrossRef]
- Toruan, R.L.; Dina, R.; Coggins, L.X.; Ghadouani, A. Hydrological Regime and Fish Predation Regulate the Zooplankton Community Size Structure in a Tropical Floodplain Lake. Water 2022, 14, 2518. [Google Scholar] [CrossRef]
- Jeppesen, E.; Meerhoff, M.; Davidson, T.A.; Trolle, D.; Søndergaard, M.; Lauridsen, T.L.; Beklioglu, M.; Brucet, S.; Volta, P.; González-Bergonzoni, I.; et al. Climate change impacts on lakes: An integrated ecological perspective based on a multi-faceted approach, with special focus on shallow lakes. J. Limnol. 2014, 73, 88–111. [Google Scholar] [CrossRef]
- Rusanov, A.G.; Bíró, T.; Kiss, K.T.; Buczkó, K.; Grigorszky, I.; Hidas, A.; Duleba, M.; Trábert, Z.; Földi, A.; Ács, É. Relative importance of climate and spatial processes in shaping species composition, functional structure and beta diversity of phytoplankton in a large river. Sci. Total Environ. 2022, 807, 150891. [Google Scholar] [CrossRef]
- Nõges, P.; Argillier, C.; Borja, Á.; Garmendia, J.M.; Hanganu, J.; Kodeš, V.; Pletterbauer, F.; Sagouis, A.; Birk, S. Quantified biotic and abiotic responses to multiple stress in freshwater, marine and ground waters. Sci. Total Environ. 2016, 540, 43–52. [Google Scholar] [CrossRef]


Disclaimer/Publisher’s Note: The statements, opinions and data contained in all publications are solely those of the individual author(s) and contributor(s) and not of MDPI and/or the editor(s). MDPI and/or the editor(s) disclaim responsibility for any injury to people or property resulting from any ideas, methods, instructions or products referred to in the content. |
© 2025 by the authors. Licensee MDPI, Basel, Switzerland. This article is an open access article distributed under the terms and conditions of the Creative Commons Attribution (CC BY) license (https://creativecommons.org/licenses/by/4.0/).