
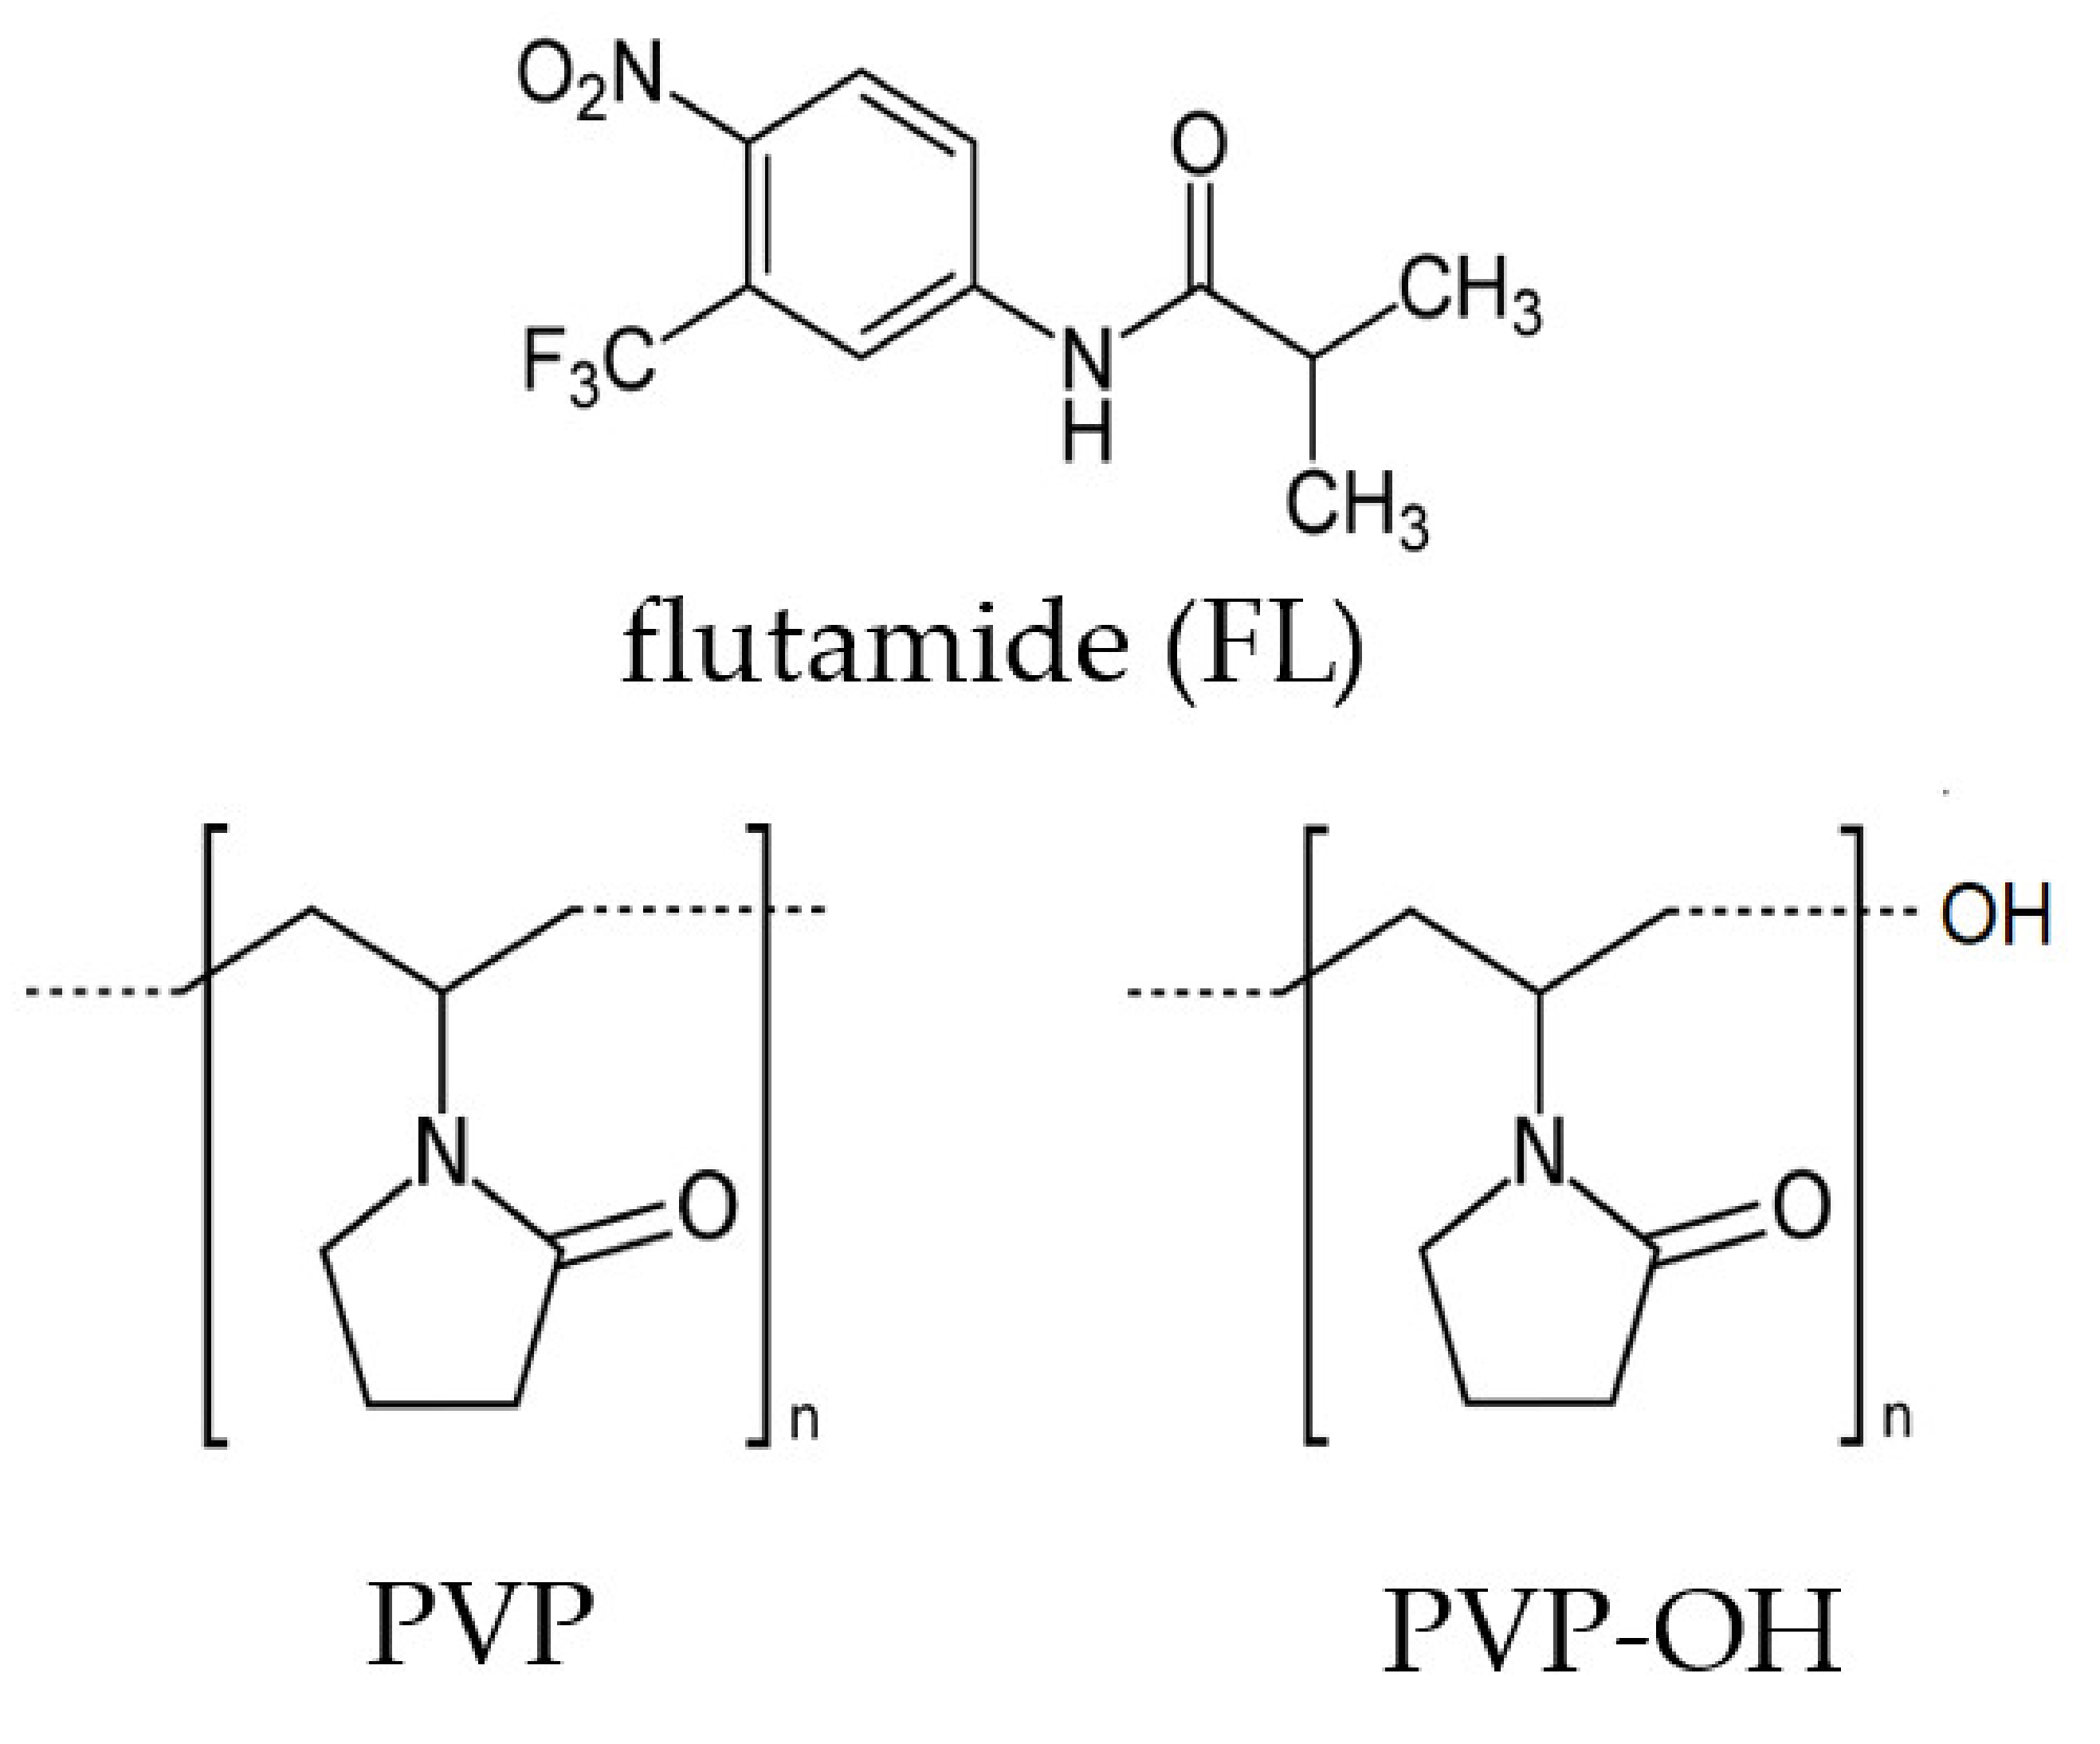
The Effect of Various Poly (N-vinylpyrrolidone) (PVP) Polymers on the Crystallization of Flutamide


Abstract
:
1. Introduction
2. Results and Discussion
3. Materials and Methods
3.1. Materials
3.2. Preparation of Binary Mixtures
3.3. Differential Scanning Calorimetry (DSC)
3.4. Broadband Dielectric Spectroscopy (BDS)
3.5. Fourier Transform Infrared (FTIR) Spectroscopy
3.6. Nuclear Magnetic Resonance (NMR) Spectroscopy
3.7. Size Exclusion Chromatography (SEC)
4. Conclusions
Supplementary Materials
Author Contributions
Funding
Institutional Review Board Statement
Informed Consent Statement
Data Availability Statement
Acknowledgments
Conflicts of Interest
References
- Chauhan, N.P.S.; Pathak, A.K.; Bhanat, K.; Ameta, R.; Rawal, M.K.; Punjabi, P.B. Pharmaceutical polymers. In Encyclopedia of Biomedical Polymers and Polymeric Biomaterials; Taylor and Francis: New York, NY, USA, 2016; pp. 5929–5942. [Google Scholar]
- Sanjay, P.D.; Vasantrao, P.P.; Pandit, D.P.; Dattaprasad, D.S.; Shivaji, M.S. Polymers used in pharmaceuticals: A brief review. Int. J. Pharm. Chem. Res. 2016, 2, 233–238. [Google Scholar]
- Jones, D. Pharmaceutical Applications of Polymers for Drug Delivery; iSmithers Rapra Publishing: Belfast, United Kingdom, 2004; ISBN 978-1-85957-479-9. [Google Scholar]
- McCrum, N.G.; Buckley, C.P.; Bucknall, C.B. Principles of Polymer Engineering; Oxford University Press: New York, NY, USA, 1997; ISBN 978-0-19-856526-0. [Google Scholar]
- Wegiel, L.A.; Mauer, L.I.; Edgar, K.J.; Taylor, L.S. Crystallization of amorphous solid dispersions of resveratrol during preparation and storage—Impact of different polymers. J. Pharm. Sci. 2013, 102, 171–184. [Google Scholar] [CrossRef] [PubMed]
- Safna Hussan, K.P.; Shahin Thayyil, M.; Deshpande, S.K.; Jinitha, T.V.; Manoj, K.; Ngai, K.L. Molecular dynamics, physical and thermal stability of neat amorphous amlodipine besylate and in binary mixture. Eur. J. Pharm. Sci. 2018, 119, 268–278. [Google Scholar] [CrossRef] [PubMed]
- Caron, V.; Hu, Y.; Tajber, L.; Erxleben, A.; Corrigan, O.I.; McArdle, P.; Healy, A.M. Amorphous solid dispersions of sulfonamide/Soluplus® and sulfonamide/PVP prepared by ball milling. AAPS Pharm. Sci. Tech. 2013, 14, 464–474. [Google Scholar] [CrossRef] [PubMed]
- Chen, Y.; Liu, C.; Chen, Z.; Su, C.; Hageman, M.; Hussain, M.; Haskell, R.; Stefanski, K.; Qian, F. Drug-polymer-water interaction and its implication for the dissolution performance of amorphous solid dispersions. Mol. Pharm. 2015, 12, 576–589. [Google Scholar] [CrossRef] [PubMed]
- Szafraniec-Szczęsny, J.; Antosik-Rogóż, A.; Kurek, M.; Gawlak, K.; Górska, A.; Peralta, S.; Knapik-Kowalczuk, J.; Kramarczyk, D.; Paluch, M.; Jachowicz, R. How does the addition of Kollidon®VA64 inhibit the recrystallization and improve ezetimibe dissolution from amorphous solid dispersions? Pharmaceutics 2021, 13, 147. [Google Scholar] [CrossRef] [PubMed]
- Song, Y.; Wang, L.; Yang, P.; Wenslow, R.M., Jr.; Tan, B.; Zhang, H.; Deng, Z. Physicochemical characterization of felodipine-kollidon VA64 amorphous solid dispersions prepared by hot-melt extrusion. J. Pharm. Sci. 2013, 102, 1915–1923. [Google Scholar] [CrossRef] [PubMed]
- Homayouni, A.; Sadeghi, F.; Nokhodchi, A.; Varshosaz, J.; Garekani, H.A. Preparation and characterization of celecoxib dispersions in Soluplus: Comparison of spray drying and conventional methods. Iran. J. Pharm. Res. 2015, 14, 35–50. [Google Scholar] [PubMed]
- Gangurde, A.B.; Kundaikar, H.S.; Javeer, S.D.; Jaiswar, D.R.; Degani, M.S.; Amin, P.D. Enhanced solubility and dissolution of curcumin by a hydrophilic polymer solid dispersion and its insilico molecular modeling studies. J. Drug Deliv. Sci. Technol. 2015, 29, 226–237. [Google Scholar] [CrossRef]
- Sandhu, H.; Shah, N.; Chokshi, H.; Malick, A.W. Overview of amorphous solid dispersion technologies. In Amorphous Solid Dispersions; Springer: New York, NY, USA, 2014; pp. 91–122. [Google Scholar]
- Chavan, R.B.; Rathi, S.; Jyothi, V.G.S.S.; Shastri, N.R. Cellulose based polymers in development of amorphous solid dispersions. Asian J. Pharm. Sci. 2019, 14, 248–264. [Google Scholar] [CrossRef] [PubMed]
- Liu, J.; Grohganz, H.; Rades, T. Influence of polymer addition on the amorphization, dissolution and physical stability of co-amorphous systems. Int. J. Pharm. 2020, 588, 119768. [Google Scholar] [CrossRef] [PubMed]
- Shi, Q.; Cheng, J.; Li, F.; Xu, J.; Zhang, C. Molecular mobility and crystal growth in amorphous binary drug delivery systems: Effects of low-concentration Poly(Ethylene Oxide). AAPS Pharm. Sci. Tech. 2020, 21, 317. [Google Scholar] [CrossRef] [PubMed]
- Shi, Q.; Zhang, C.; Su, Y.; Zhang, J.; Zhou, D.; Cai, T. Acceleration of crystal growth of amorphous griseofulvin by low-concentration poly(ethylene oxide): Aspects of crystallization kinetics and molecular mobility. Mol. Pharm. 2017, 14, 2262–2272. [Google Scholar] [CrossRef] [PubMed]
- Daravath, B.; Naveen, C.; Vemula, S.K.; Tadikonda, R.R. Solubility and dissolution enhancement of flurbiprofen by solid dispersion using hydrophilic carriers. Braz. J. Pharm. Sci. 2018, 53, e00010.B. [Google Scholar] [CrossRef]
- Kumar, K. Solid dispersion: Solubility enhancement technique of poorly water soluble drug. J. Drug Deliv. Ther. 2020, 10, 173–177. [Google Scholar]
- Pandi, P.; Bulusu, R.; Kommineni, N.; Khan, W.; Singh, M. Amorphous solid dispersions: An update for preparation, characterization, mechanism on bioavailability, stability, regulatory considerations and marketed products. Int. J. Pharm. 2020, 586, 119560. [Google Scholar] [CrossRef] [PubMed]
- Bhujbal, S.V.; Mitra, B.; Jain, U.; Gong, Y.; Agrawal, A.; Karki, S.; Taylor, L.S.; Kumar, S.; Zhou, Q.T. Pharmaceutical amorphous solid dispersion: A review of manufacturing strategies. Acta Pharm. Sin. B 2021, 11, 2505–2536. [Google Scholar] [CrossRef]
- Khodadadi, S.; Meesters, G.M.H. Amorphous APIs: Improved release, preparation, characterization. In Particles and Nanoparticles in Pharmaceutical Products: Design, Manufacturing, Behavior and Performance; Merkus, H.G., Meesters, G.M.H., Oostra, W., Eds.; Springer International Publishing: Cham, Switzerland, 2018; pp. 329–346. [Google Scholar]
- Vasconcelos, T.; Marques, S.; das Neves, J.; Sarmento, B. Amorphous solid dispersions: Rational selection of a manufacturing process. Adv. Drug Deliv. Rev. 2016, 100, 85–101. [Google Scholar] [CrossRef] [PubMed]
- Frank, D.S.; Matzger, A.J. Probing the interplay between amorphous solid dispersion stability and polymer functionality. Mol. Pharm. 2018, 15, 2714–2720. [Google Scholar] [CrossRef]
- Mistry, P.; Suryanarayanan, R. Strength of drug−polymer interactions: Implications for crystallization in dispersions. Cryst. Growth Des. 2016, 16, 5141–5149. [Google Scholar] [CrossRef]
- Baghel, S.; Cathcart, H.; O’Reilly, N.J. Polymeric Amorphous Solid Dispersions: A review of amorphization, crystallization, stabilization, solid-state characterization, and aqueous solubilization of biopharmaceutical classification system Class II drugs. J. Pharm. Sci. 2016, 105, 2527–2544. [Google Scholar] [CrossRef]
- Kumar, S.K.; Ganesan, V.; Riggleman, R.A. Perspective: Outstanding theoretical questions in polymer-nanoparticle hybrids. J. Chem. Phys. 2017, 147, 020901. [Google Scholar] [CrossRef] [PubMed]
- Jabbarzadeh, A. The origins of enhanced and retarded crystallization in nanocomposite polymers. Nanomaterials 2019, 9, 1472. [Google Scholar] [CrossRef] [PubMed]
- Jabbarzadeh, A.; Halfina, B. Unravelling the effects of size, volume fraction and shape of nanoparticle additives on crystallization of nanocomposite polymers. Nanoscale Adv. 2019, 1, 4704–4721. [Google Scholar] [CrossRef]
- Genix, A.-C.; Oberdisse, J. Nanoparticle self-assembly: From interactions in suspension to polymer nanocomposites. Soft Matt. 2018, 14, 5161–55179. [Google Scholar] [CrossRef] [PubMed]
- Kaushal, A.M.; Gupta, P.; Bansal, A.K. Amorphous drug delivery systems: Molecular aspects, design, and performance. Crit. Rev. Ther. Drug Carr. Syst. 2004, 21, 1–62. [Google Scholar] [CrossRef]
- Tian, Y.; Jones, D.S.; Andrews, G.P. An investigation into the role of polymeric carriers on crystal growth within amorphous solid dispersion systems. Mol. Pharm. 2015, 12, 1180–1192. [Google Scholar] [CrossRef] [PubMed]
- Maksym, P.; Tarnacka, M.; Heczko, D.; Knapik-Kowalczuk, J.; Mielanczyk, A.; Bernat, R.; Garbacz, G.; Kaminski, K.; Paluch, M. Pressure-assisted solvent- and catalyst-free production of well-defined poly(1-vinyl-2-pyrrolidone) for biomedical applications. RSC Adv. 2020, 10, 21593–21601. [Google Scholar] [CrossRef] [PubMed]
- Maksym, P.; Tarnacka, M.; Bernat, R.; Bielas, R.; Mielańczyk, A.; Hachuła, B.; Kaminski, K.; Paluch, M. Pressure-assisted strategy for the synthesis of vinyl pyrrolidone-based macro-star photoiniferters. A route to star block copolymers. J. Pol. Sci. 2020, 58, 1393–1399. [Google Scholar] [CrossRef]
- Chmiel, K.; Knapik-Kowalczuk, J.; Jurkiewicz, K.; Sawicki, W.; Jachowicz, R.; Paluch, M. A new method to identify physically stable concentration of amorphous solid dispersions (I): Case of flutamide + Kollidon VA64. Mol. Pharm. 2017, 14, 3370–3380. [Google Scholar] [CrossRef] [PubMed]
- Chmiel, K.; Knapik-Kowalczuk, J.; Paluch, M. How does the high pressure affects the solubility of the drug within the polymer matrix in solid dispersion systems. Eur. J. Pharm. Biopharm. 2019, 143, 8–17. [Google Scholar] [CrossRef]
- Chmiel, K.; Knapik-Kowalczuk, J.; Jachowicz, R.; Paluch, M. Broadband dielectric spectroscopy as an experimental alternative to calorimetric determination of the solubility of drugs into polymer matrix: Case of flutamide and various polymeric matrixes. Eur. J. Pharm. Biopharm. 2019, 136, 231–239. [Google Scholar] [CrossRef] [PubMed]
- Trivino, A.; Gumireddy, A.; Meng, F.; Prasad, D.; Chauhan, H. Drug–polymer miscibility, interactions, and precipitation inhibition studies for the development of amorphous solid dispersions for the poorly soluble anticancer drug flutamide. Drug Dev. Ind. Pharm. 2019, 45, 1277–1291. [Google Scholar] [CrossRef] [PubMed]
- Pacułt, J.; Rams-Baron, M.; Chmiel, K.; Jurkiewicz, K.; Antosik, A.; Szafraniec, J.; Kurek, M.; Jachowicz, R.; Paluch, M. How can we improve the physical stability of co-amorphous system containing flutamide and bicalutamide? The case of ternary amorphous solid dispersions. Eur. J. Pharm. Sci. 2021, 159, 105697. [Google Scholar] [CrossRef] [PubMed]
- Bielas, R.; Maksym, P.; Tarnacka, M.; Minecka, A.; Jurkiewicz, K.; Talik, A.; Geppert-Rybczyńska, M.; Grelska, J.; Mielańczyk, Ł.; Bernat, R.; et al. Synthetic strategy matters: The study of a different kind of PVP as micellar vehicles of metronidazole. J. Mol. Liq. 2021, 332, 115789. [Google Scholar] [CrossRef]
- Login, R.B. N-vinylamide polymers. In Encyclopedia of Chemical Technology; John Wiley & Sons: New York, NY, USA, 2001; p. 11. ISBN 978-0-47-148494-3. [Google Scholar]
- Cheng, H.N.; Smith, T.E.; Vitus, D.M. Tacticity of poly(N-vinyl pyrrolidone). J. Polym. Sci. Part C Polym. Lett. 1981, 19, 29–31. [Google Scholar] [CrossRef]
- Wan, D.; Satoh, K.; Kamigaito, M.; Okamoto, Y. Xanthate-mediated radical polymerization of N-vinylpyrrolidone in fluoroalcohols for simultaneous control of molecular weight and tacticity. Macromolecules 2005, 38, 10397–10405. [Google Scholar] [CrossRef]
- Satoh, K.; Kamigaito, M. Stereospecific living radical polymerization: Dual control of chain length and tacticity for precision polymer synthesis. Chem. Rev. 2009, 109, 5120–5156. [Google Scholar] [CrossRef] [PubMed]
- Dutta, K.; Brar, A.S. Poly(vinylpyrrolidone): Configurational assignments by one- and two-dimensional NMR spectroscopy. J. Polym. Sci. A Polym. Chem. 1999, 37, 3922–3928. [Google Scholar] [CrossRef]
- Hirano, T.; Miyamoto, Y.; Amano, S.; Tatsumi, K.; Anmoto, T.; Kimura, H.; Yoshida, M.; Oshimura, K.; Ute, K. Hydrogen-bond-assisted isotactic-specific radical polymerization of N-vinyl-2-pyrrolidone with tartrate additives in toluene at low temperatures: High-resolution 1H NMR analysis. RSC Adv. 2014, 4, 53079–53089. [Google Scholar] [CrossRef]
- Ebdon, J.R.; Huckerby, T.N.; Senogles, E. The influence of polymerization conditions on the tacticity of poly(N-vinyl-2-pyrrolidone). Polymer 1983, 24, 339–343. [Google Scholar] [CrossRef]
- Walling, C.; Tanner, D.D. Organic reactions under high pressure. IX. The effect of pressure on the stereochemistry of methyl methacrylate polymerization. J. Polym. Sci. 1963, 1, 2271–2277. [Google Scholar] [CrossRef]
- Rzayev, J.; Penelle, J. Polymerization of sterically congested α-alkylacrylates under high pressure. J. Polym. Sci. A Polym. Chem. 2002, 40, 836–843. [Google Scholar] [CrossRef]
- Biros, J.; Larina, T.; Trekoval, J.; Pouchly, J. Dependence of the glass transition temperature of poly(methyl methacrylates) on their tacticity. Colloid Polym. Sci. 1982, 260, 27–30. [Google Scholar] [CrossRef]
- Thompson, E.V. Dependence of the glass transition temperature of poly(methyl methacrylate) on tacticity and molecular weight. J. Polym. Sci. Part A Polym. Phys. 1966, 4, 199–208. [Google Scholar] [CrossRef]
- Chat, K.; Tu, W.; Beena Unni, A.; Adrjanowicz, K. Influence of tacticity on the glass transition dynamics of poly(methyl methacrylate) (PMMA) under elevated pressure and geometrical nanoconfinement. Macromolecules 2021, 54, 8526–8537. [Google Scholar] [CrossRef]
- Beiner, M. Relaxation in poly(alkyl methacrylate)s: Crossover region and nanophase separation. Macromol. Rapid Commun. 2001, 22, 869–895. [Google Scholar] [CrossRef]
- Negash, S.; Tatek, Y.B.; Tsige, M. Effect of tacticity on the structure and glass transition temperature of polystyrene adsorbed onto solid surfaces. J. Chem. Phys. 2018, 148, 134705. [Google Scholar] [CrossRef]
- Woo, E.M.; Chang, L. Tacticity in vinyl polymers. In Encyclopedia of Polymer Science and Technology; John Wiley & Sons: New York, NY, USA, 2002; Chapter 2; ISBN 978-1-11-863389-2. [Google Scholar]
- White, A.J.; Filisko, F.E. Isothermal enthalpy studies of poly(methyl methacrylate) stereoisomers and their blends. J. Appl. Phys. 1982, 53, 6563. [Google Scholar] [CrossRef]
- Chang, L.; Woo, E.M. Tacticity effects on glass transition and phase behavior in binary blends of poly(methyl methacrylate)s of three different configurations. Polym. Chem. 2010, 1, 198–202. [Google Scholar] [CrossRef]
- Kohlrausch, R. Ueber das dellmann’sche elektrometer. Ann. Phys. 1847, 72, 353–405. [Google Scholar] [CrossRef]
- Williams, G.; Watts, D.C. Non-symmetrical dielectric relaxation behaviour arising from a simple empirical decay function. Trans. Faraday Soc. 1970, 66, 80–85. [Google Scholar] [CrossRef]
- Kremer, F.; Schönhals, A. Broadband Dielectric Spectroscopy; Springer: Berlin, Germany, 2003. [Google Scholar]
- Chan, T.W.; Shyu, G.D.; Isayev, A.I. Master curve approach to polymer crystallization kinetics. Polym. Eng. Sci. 1995, 35, 733–740. [Google Scholar] [CrossRef]
- Avrami, M. Kinetics of phase change. I General theory. J. Chem. Phys. 1939, 7, 1103–1112. [Google Scholar] [CrossRef]
- Avrami, M. Kinetics of Phase Change. II Transformation-time relations for random distribution of nuclei. J. Chem. Phys. 1940, 8, 212–224. [Google Scholar] [CrossRef]
- Wunderlich, B. Macromolecular Physics, Vol 2. In Crystal Nucleation, Growth, Annealing; Academic Press: London, UK, 1976. [Google Scholar]
- Bahri, K.; Eslami, H.; Müller-Plathe, F. Self-assembly of model triblock Janus colloidal particles in two dimensions. J. Chem. Theory Comput. 2022, 18, 1870–1882. [Google Scholar] [CrossRef]
- Eslami, H.; Gharibi, A.; Müller-Plathe, F. Mechanisms of nucleation and solid–solid-phase transitions in triblock Janus assemblies. J. Chem. Theory Comput. 2021, 17, 1742–1754. [Google Scholar] [CrossRef]
- Romano, F.; Sciortino, F. Crystal phases of two dimensional assembly of triblock Janus particles. Soft Matter 2011, 7, 5799–5804. [Google Scholar] [CrossRef]
- Ten Wolde, P.R.; Frenkel, D. Enhancement of protein crystal nucleation by critical density fluctuations. Science 1997, 277, 1975–1978. [Google Scholar] [CrossRef]
- Lee, S.; Teich, E.G.; Engel, M.; Glotzer, S.C. Entropic colloidal crystallization pathways via fluid-fluid transitions and multidimensional prenucleation motifs. Proc. Natl. Acad. Sci. USA 2019, 116, 14843–14851. [Google Scholar] [CrossRef]
- Pouget, E.M.; Bomans, P.H.H.; Goos, J.A.C.M.; Frederik, P.M.; de With, G.; Sommerdijk, N.A.J.M. The initial stages of template-controlled CaCO3 formation revealed by cryo-TEM. Science 2009, 323, 1455–1458. [Google Scholar] [CrossRef] [PubMed]
- Augis, J.A.; Bennett, J.E. Calculation of the Avrami parameters for heterogeneous solid state reactions using a modified the Kissinger method. J. Therm. Anal. 1978, 13, 283–292. [Google Scholar] [CrossRef]
- Kissinger, H.E. Variation of peak temperature with heating rate in differential thermal analysis. J. Res. Natl. Bur. Stand. 1956, 57, 217–221. [Google Scholar] [CrossRef]
- Kołodziejczyk, K.; Tarnacka, M.; Kaminska, E.; Kaminski, K.; Paluch, M. Crystallization kinetics under confinement. Manipulation of the crystalline form of salol by varying pore diameter. Cryst. Growth Des. 2016, 16, 1218–1227. [Google Scholar] [CrossRef]
- Minecka, A.; Tarnacka, M.; Jurkiewicz, K.; Hachuła, B.; Wrzalik, R.; Kaminski, K.; Paluch, M.; Kaminska, E. The impact of the chain length and topology of the acetylated oligosaccharide on the crystallization tendency of naproxen from amorphous binary mixtures. Mol. Pharm. 2021, 18, 347–358. [Google Scholar] [CrossRef]
- Kolodziejczyk, K.; Paluch, M.; Grzybowska, K.; Grzybowski, A.; Wojnarowska, Z.; Hawelek, L. Relaxation dynamics and crystallization study of sildenafil in the liquid and glassy states. Mol. Pharm. 2013, 10, 2270–2282. [Google Scholar] [CrossRef]
- Dołęga, A.; Zieliński, P.M. Kinetics of non-isothermal cold-crystallization of carbamazepine in the glassy state studied by DSC. J. Non-Cryst. Solids 2022, 575, 121198. [Google Scholar] [CrossRef]
- Schammé, B.; Couvrat, N.; Malpeli, P.; Delbreilh, L.; Dupray, V.; Dargent, É.; Coquerel, G. Crystallization kinetics and molecular mobility of an amorphous active pharmaceutical ingredient: A case study with Biclotymol. Int. J. Pharm. 2015, 490, 248–257. [Google Scholar] [CrossRef]
- Wicaksono, Y.; Setyawan, D.; Nugraha, A.S.; Siswandono, S. Thermal behavior of cocrystal: A case study of ketoprofen-malonic acid and ketoprofen-nicotinamide cocrystals. Sains Malays. 2020, 49, 2679–2687. [Google Scholar] [CrossRef]
- Cense, J.M.; Agafonov, V.; Ceolin, R.; Ladure, P.; Rodier, N. Crystal and molecular structure analysis of flutamide. Bifurcated helicoidal C-H O hydrogen bonds. Struct. Chem. 1994, 5, 79–84. [Google Scholar] [CrossRef]
- Mariappan, G.; Sundaraganesan, N. Spectral and structural studies of the anti-cancer drug Flutamide by density functional theoretical method. Spectrochim. Acta Part A Mol. Biomol. Spectrosc. 2014, 117, 604–613. [Google Scholar] [CrossRef] [PubMed]
- Washio, I.; Xiong, Y.; Yin, Y.; Xia, Y. Reduction by the end groups of poly(vinyl pyrrolidone): A new and versatile route to the kinetically controlled synthesis of Ag triangular nanoplates. Adv. Mater. 2006, 18, 1745–1749. [Google Scholar] [CrossRef]


| System | (K/min) | Tg BDS (K) | Tg DSC (K) | k1 (s−1) | k2 (s−1) | n | ||
|---|---|---|---|---|---|---|---|---|
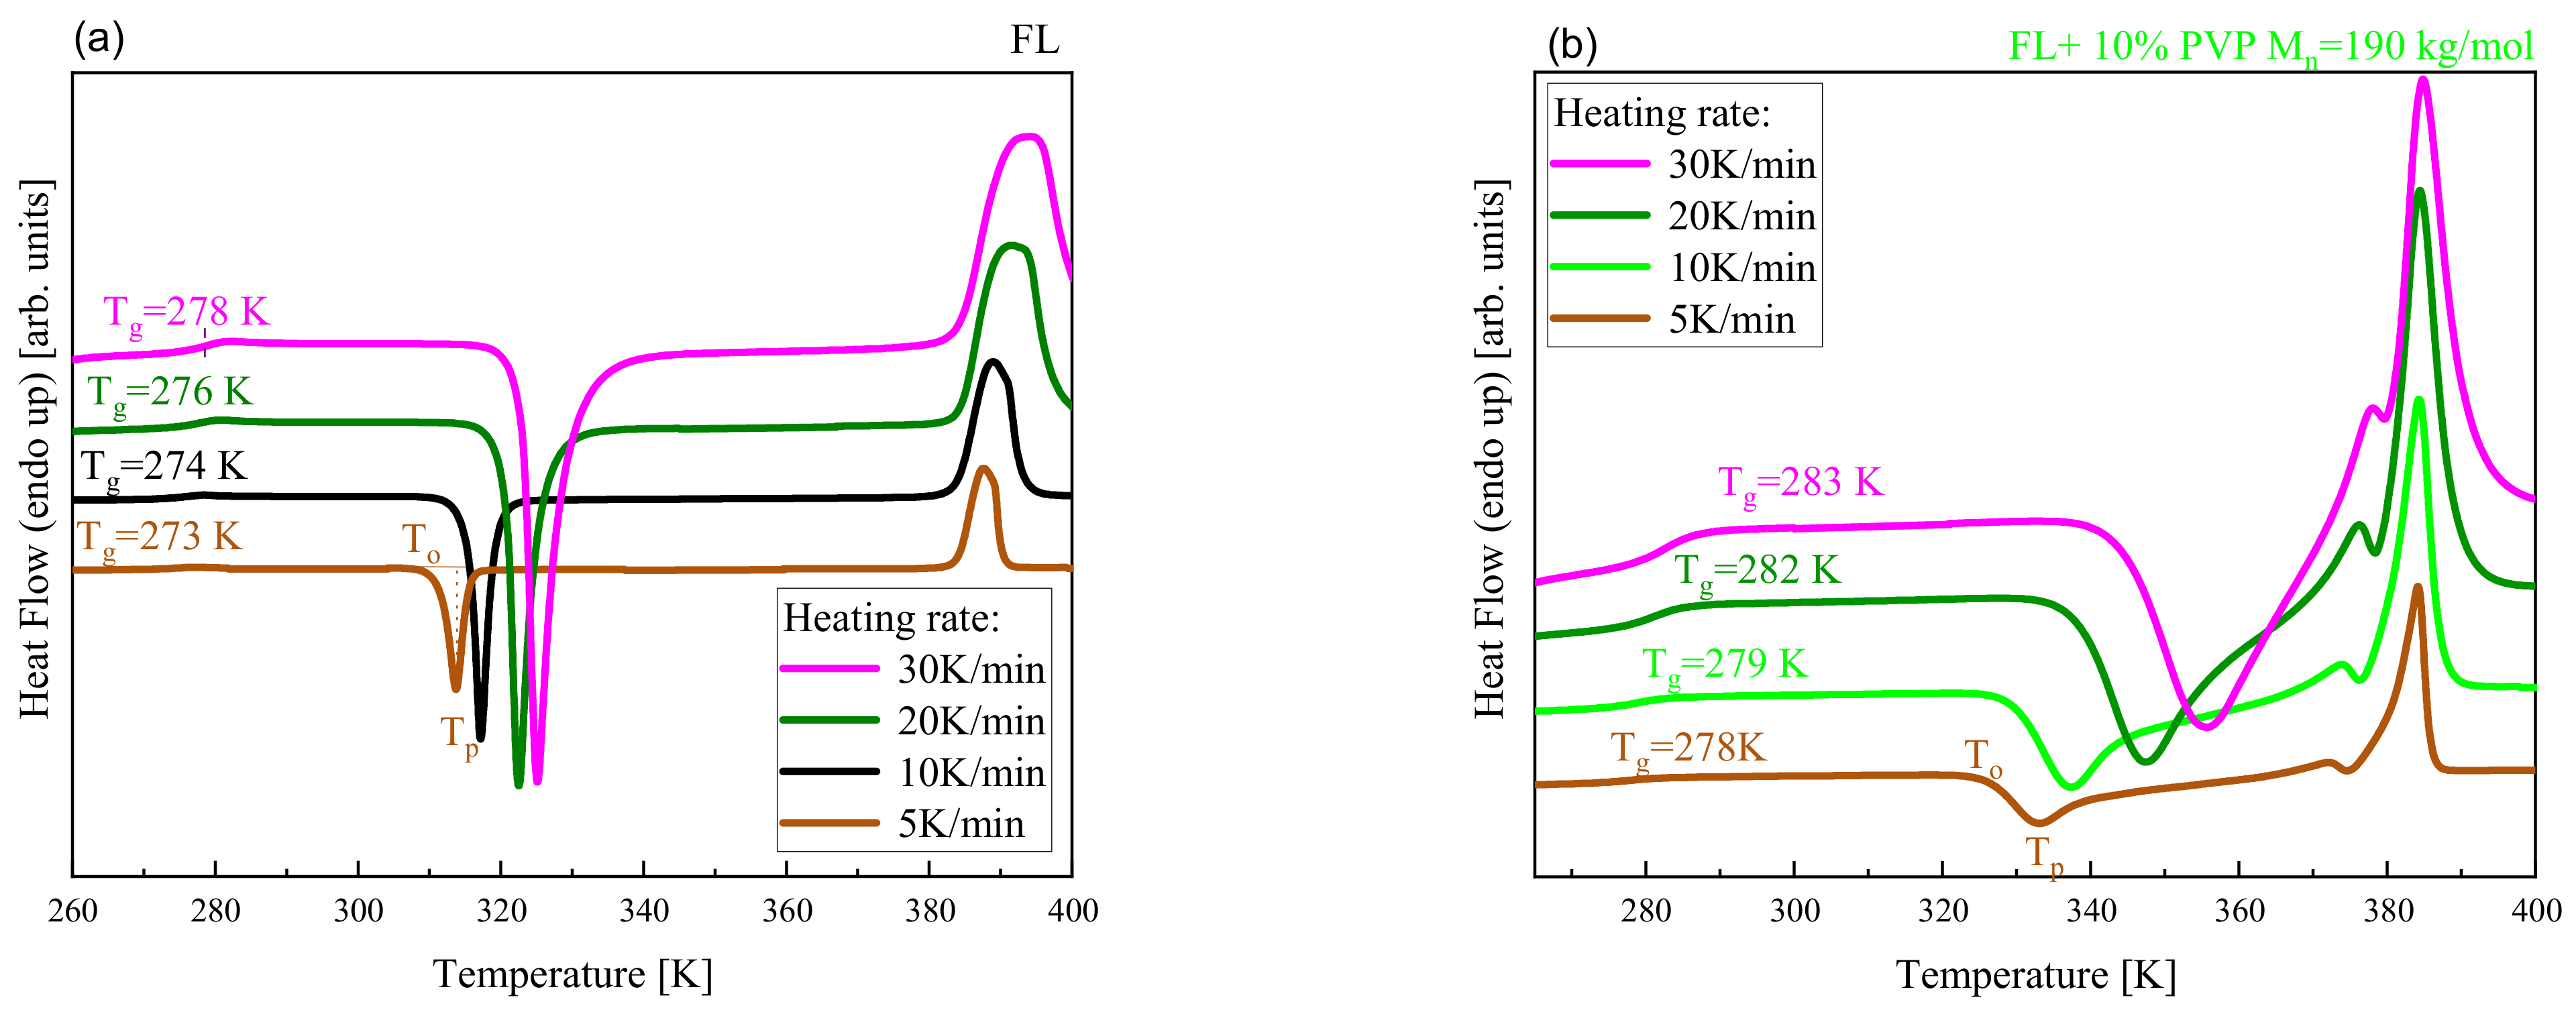
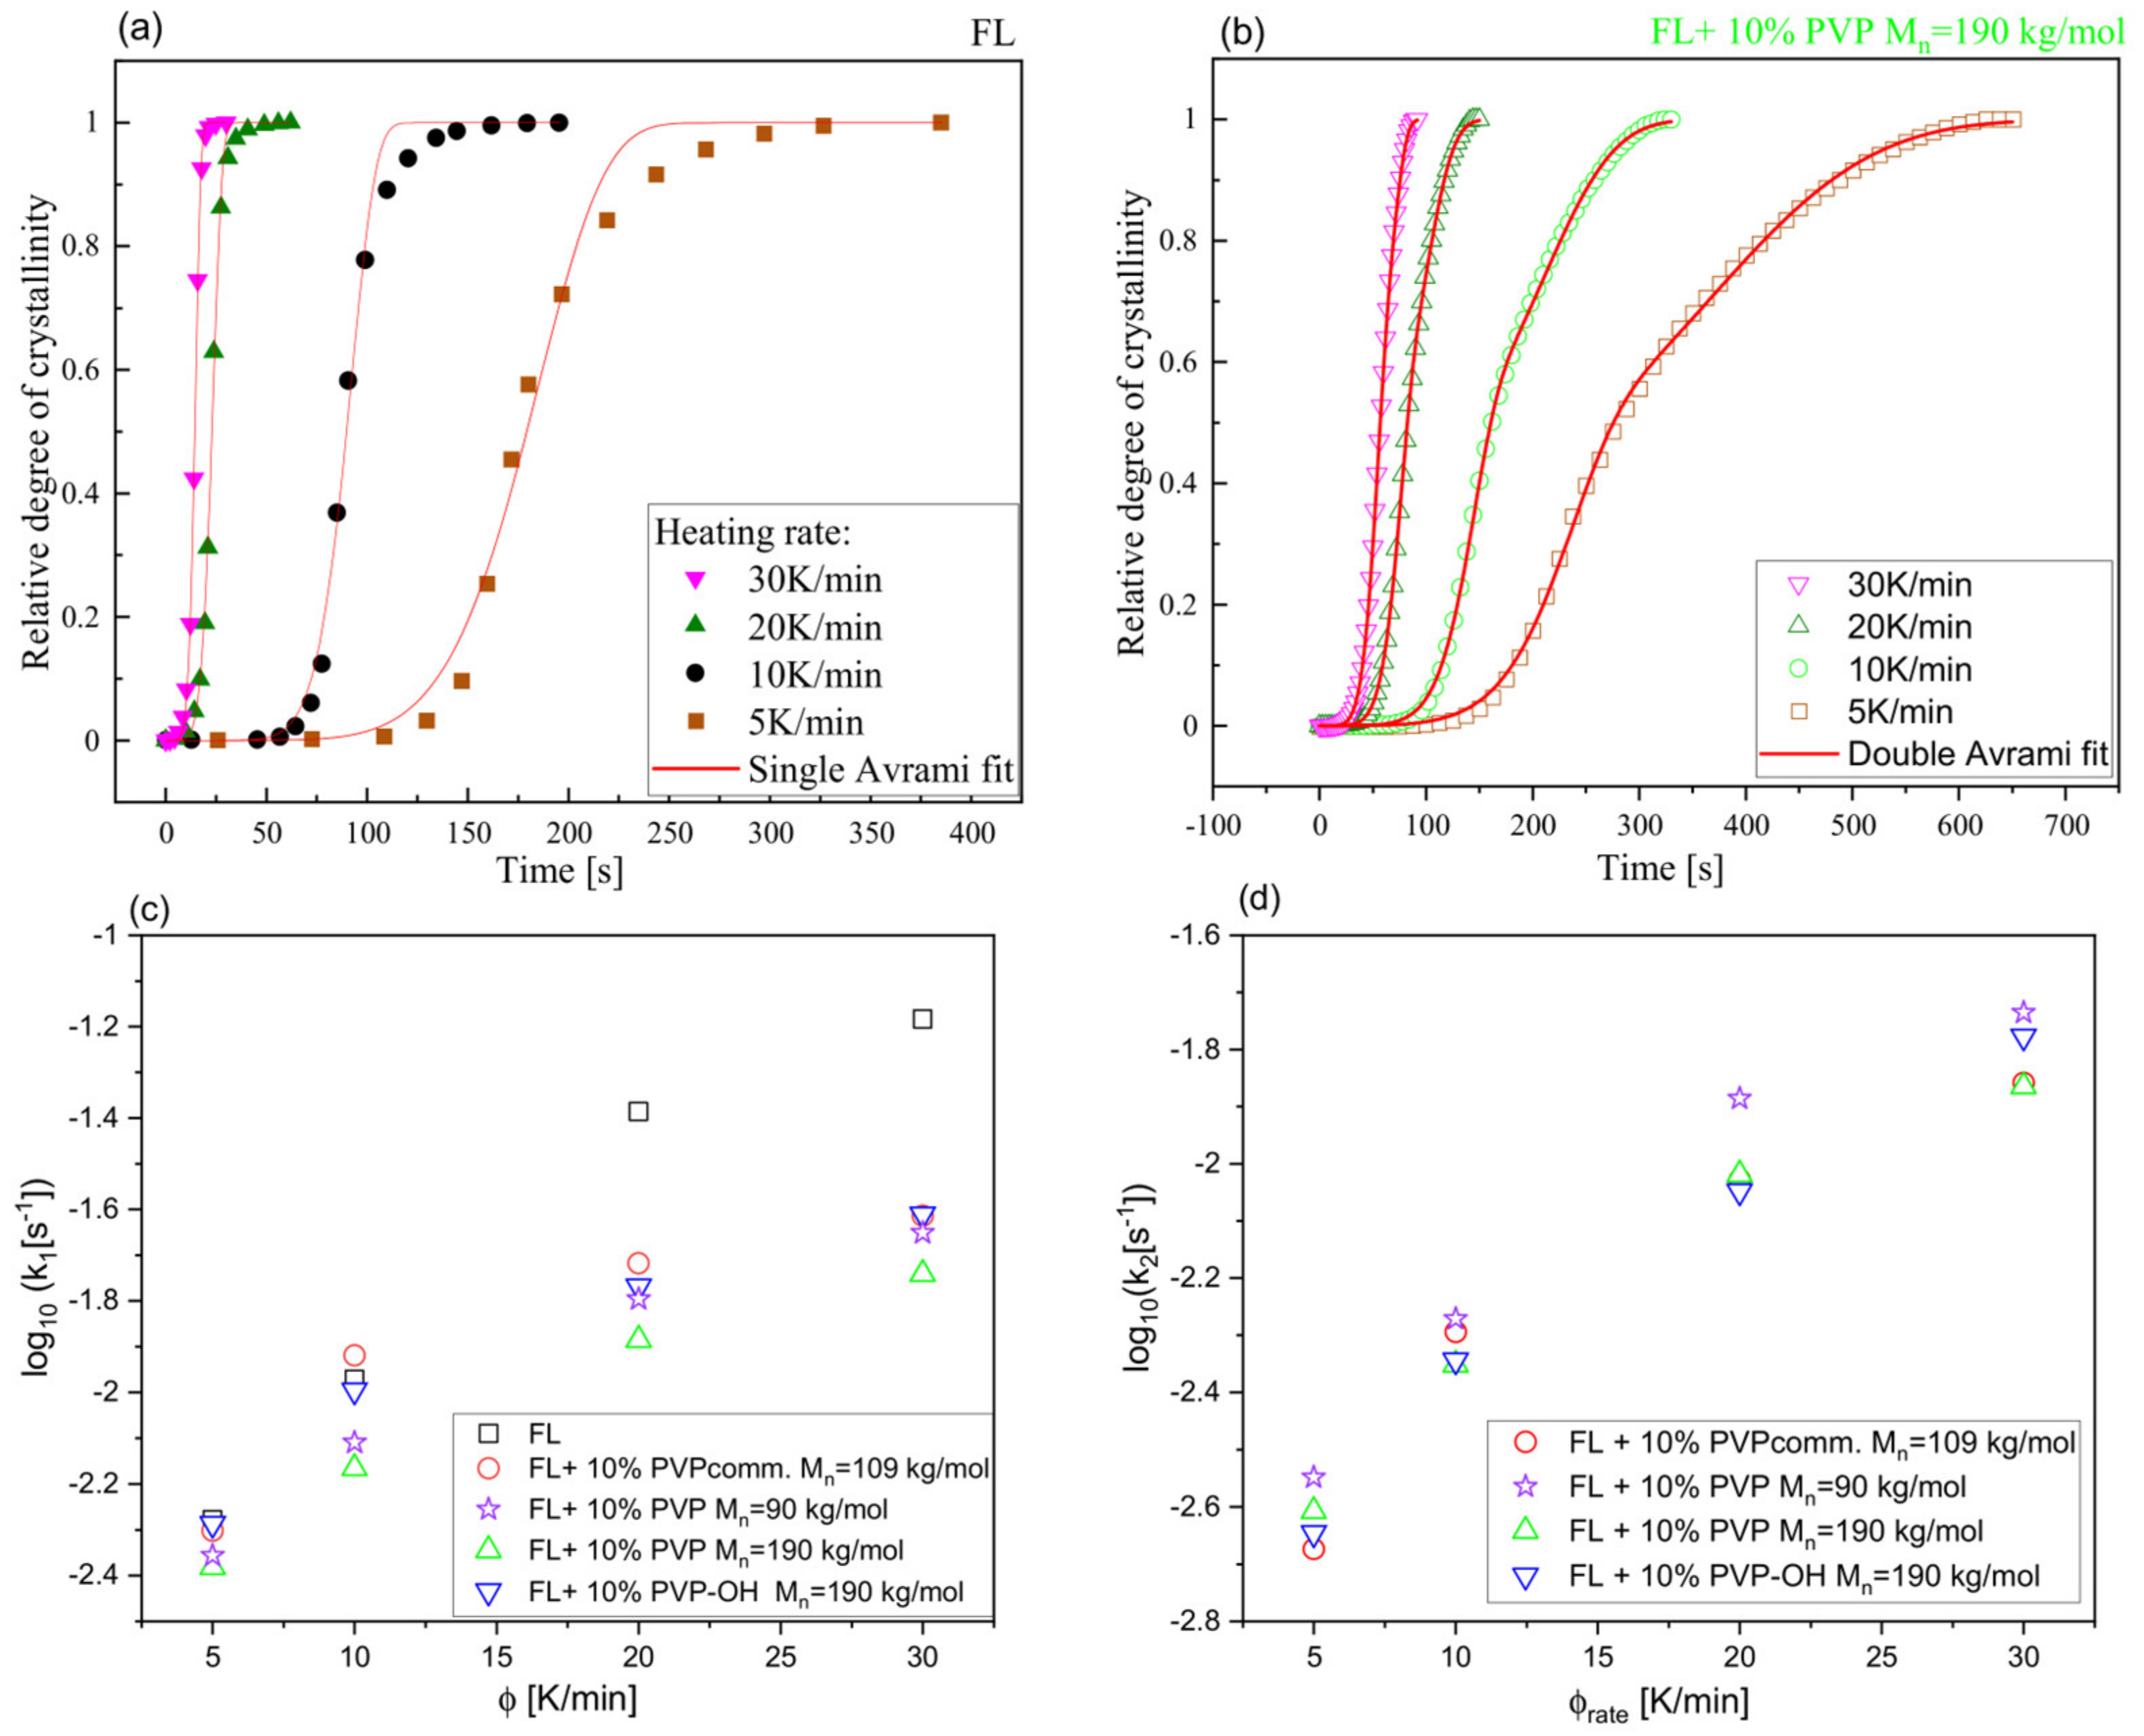
| FL | 5 | --- | 273 | 313.7 | 312.1 | 0.00527 | --- | 1.3 |
| 10 | 271 | 274 | 317.3 | 316.2 | 0.01068 | --- | 1.7 | |
| 20 | --- | 276 | 322.8 | 321.1 | 0.04113 | --- | 2.2 | |
| 30 | --- | 278 | 325.2 | 322.9 | 0.06558 | --- | 2.6 | |
| FL+10 wt% PVPcomm Mn = 109 kg/mol | 5 | --- | 274 | 318.9 | 313.9 | 0.00499 | 0.00212 | 2.3 |
| 10 | 272 | 275 | 322.6 | 318.1 | 0.01206 | 0.00508 | 2.4 | |
| 20 | --- | 277 | 330.1 | 324.1 | 0.01916 | 0.00937 | 2.6 | |
| 30 | --- | 279 | 336.2 | 327.9 | 0.02433 | 0.01385 | 2.9 | |
| FL+10 wt% PVP Mn = 90 kg/mol | 5 | --- | 277 | 337.2 | 330.2 | 0.00440 | 0.00283 | 2.8 |
| 10 | 277 | 279 | 341.9 | 334.1 | 0.00777 | 0.00535 | 2.9 | |
| 20 | --- | 281 | 351.7 | 341.9 | 0.01601 | 0.01301 | 3.0 | |
| 30 | --- | 283 | 359.4 | 348.1 | 0.02232 | 0.01841 | 2.9 | |
| FL+10 wt% PVP Mn = 190 kg/mol | 5 | --- | 278 | 333.1 | 326.2 | 0.00415 | 0.00247 | 3.0 |
| 10 | 276 | 279 | 337.1 | 330.3 | 0.00683 | 0.00445 | 2.9 | |
| 20 | --- | 282 | 347.3 | 338.1 | 0.01302 | 0.00957 | 2.6 | |
| 30 | --- | 283 | 355.8 | 342.9 | 0.01814 | 0.01365 | 2.9 | |
| FL+10 wt% PVP-OH Mn = 190 kg/mol | 5 | --- | 273 | 317.5 | 313.1 | 0.00517 | 0.00226 | 2.2 |
| 10 | 274 | 275 | 321.7 | 317.2 | 0.01010 | 0.00453 | 2.4 | |
| 20 | --- | 277 | 329.3 | 323.1 | 0.01705 | 0.00895 | 2.8 | |
| 30 | --- | 279 | 336.2 | 327.2 | 0.02449 | 0.01671 | 2.7 |
Publisher’s Note: MDPI stays neutral with regard to jurisdictional claims in published maps and institutional affiliations. |
© 2022 by the authors. Licensee MDPI, Basel, Switzerland. This article is an open access article distributed under the terms and conditions of the Creative Commons Attribution (CC BY) license (https://creativecommons.org/licenses/by/4.0/).
Share and Cite
Heczko, D.; Hachuła, B.; Maksym, P.; Kamiński, K.; Zięba, A.; Orszulak, L.; Paluch, M.; Kamińska, E. The Effect of Various Poly (N-vinylpyrrolidone) (PVP) Polymers on the Crystallization of Flutamide. Pharmaceuticals 2022, 15, 971. https://doi.org/10.3390/ph15080971
Heczko D, Hachuła B, Maksym P, Kamiński K, Zięba A, Orszulak L, Paluch M, Kamińska E. The Effect of Various Poly (N-vinylpyrrolidone) (PVP) Polymers on the Crystallization of Flutamide. Pharmaceuticals. 2022; 15(8):971. https://doi.org/10.3390/ph15080971
Chicago/Turabian StyleHeczko, Dawid, Barbara Hachuła, Paulina Maksym, Kamil Kamiński, Andrzej Zięba, Luiza Orszulak, Marian Paluch, and Ewa Kamińska. 2022. "The Effect of Various Poly (N-vinylpyrrolidone) (PVP) Polymers on the Crystallization of Flutamide" Pharmaceuticals 15, no. 8: 971. https://doi.org/10.3390/ph15080971