
MicroRNAs in the Pathogenesis of Preeclampsia—A Case-Control In Silico Analysis


Abstract
1. Introduction
2. Materials and Methods
2.1. Patients and Tissue Collection
2.2. RNA Extraction and Microarray Analysis
2.3. Data Processing
2.4. In Silico Analysis
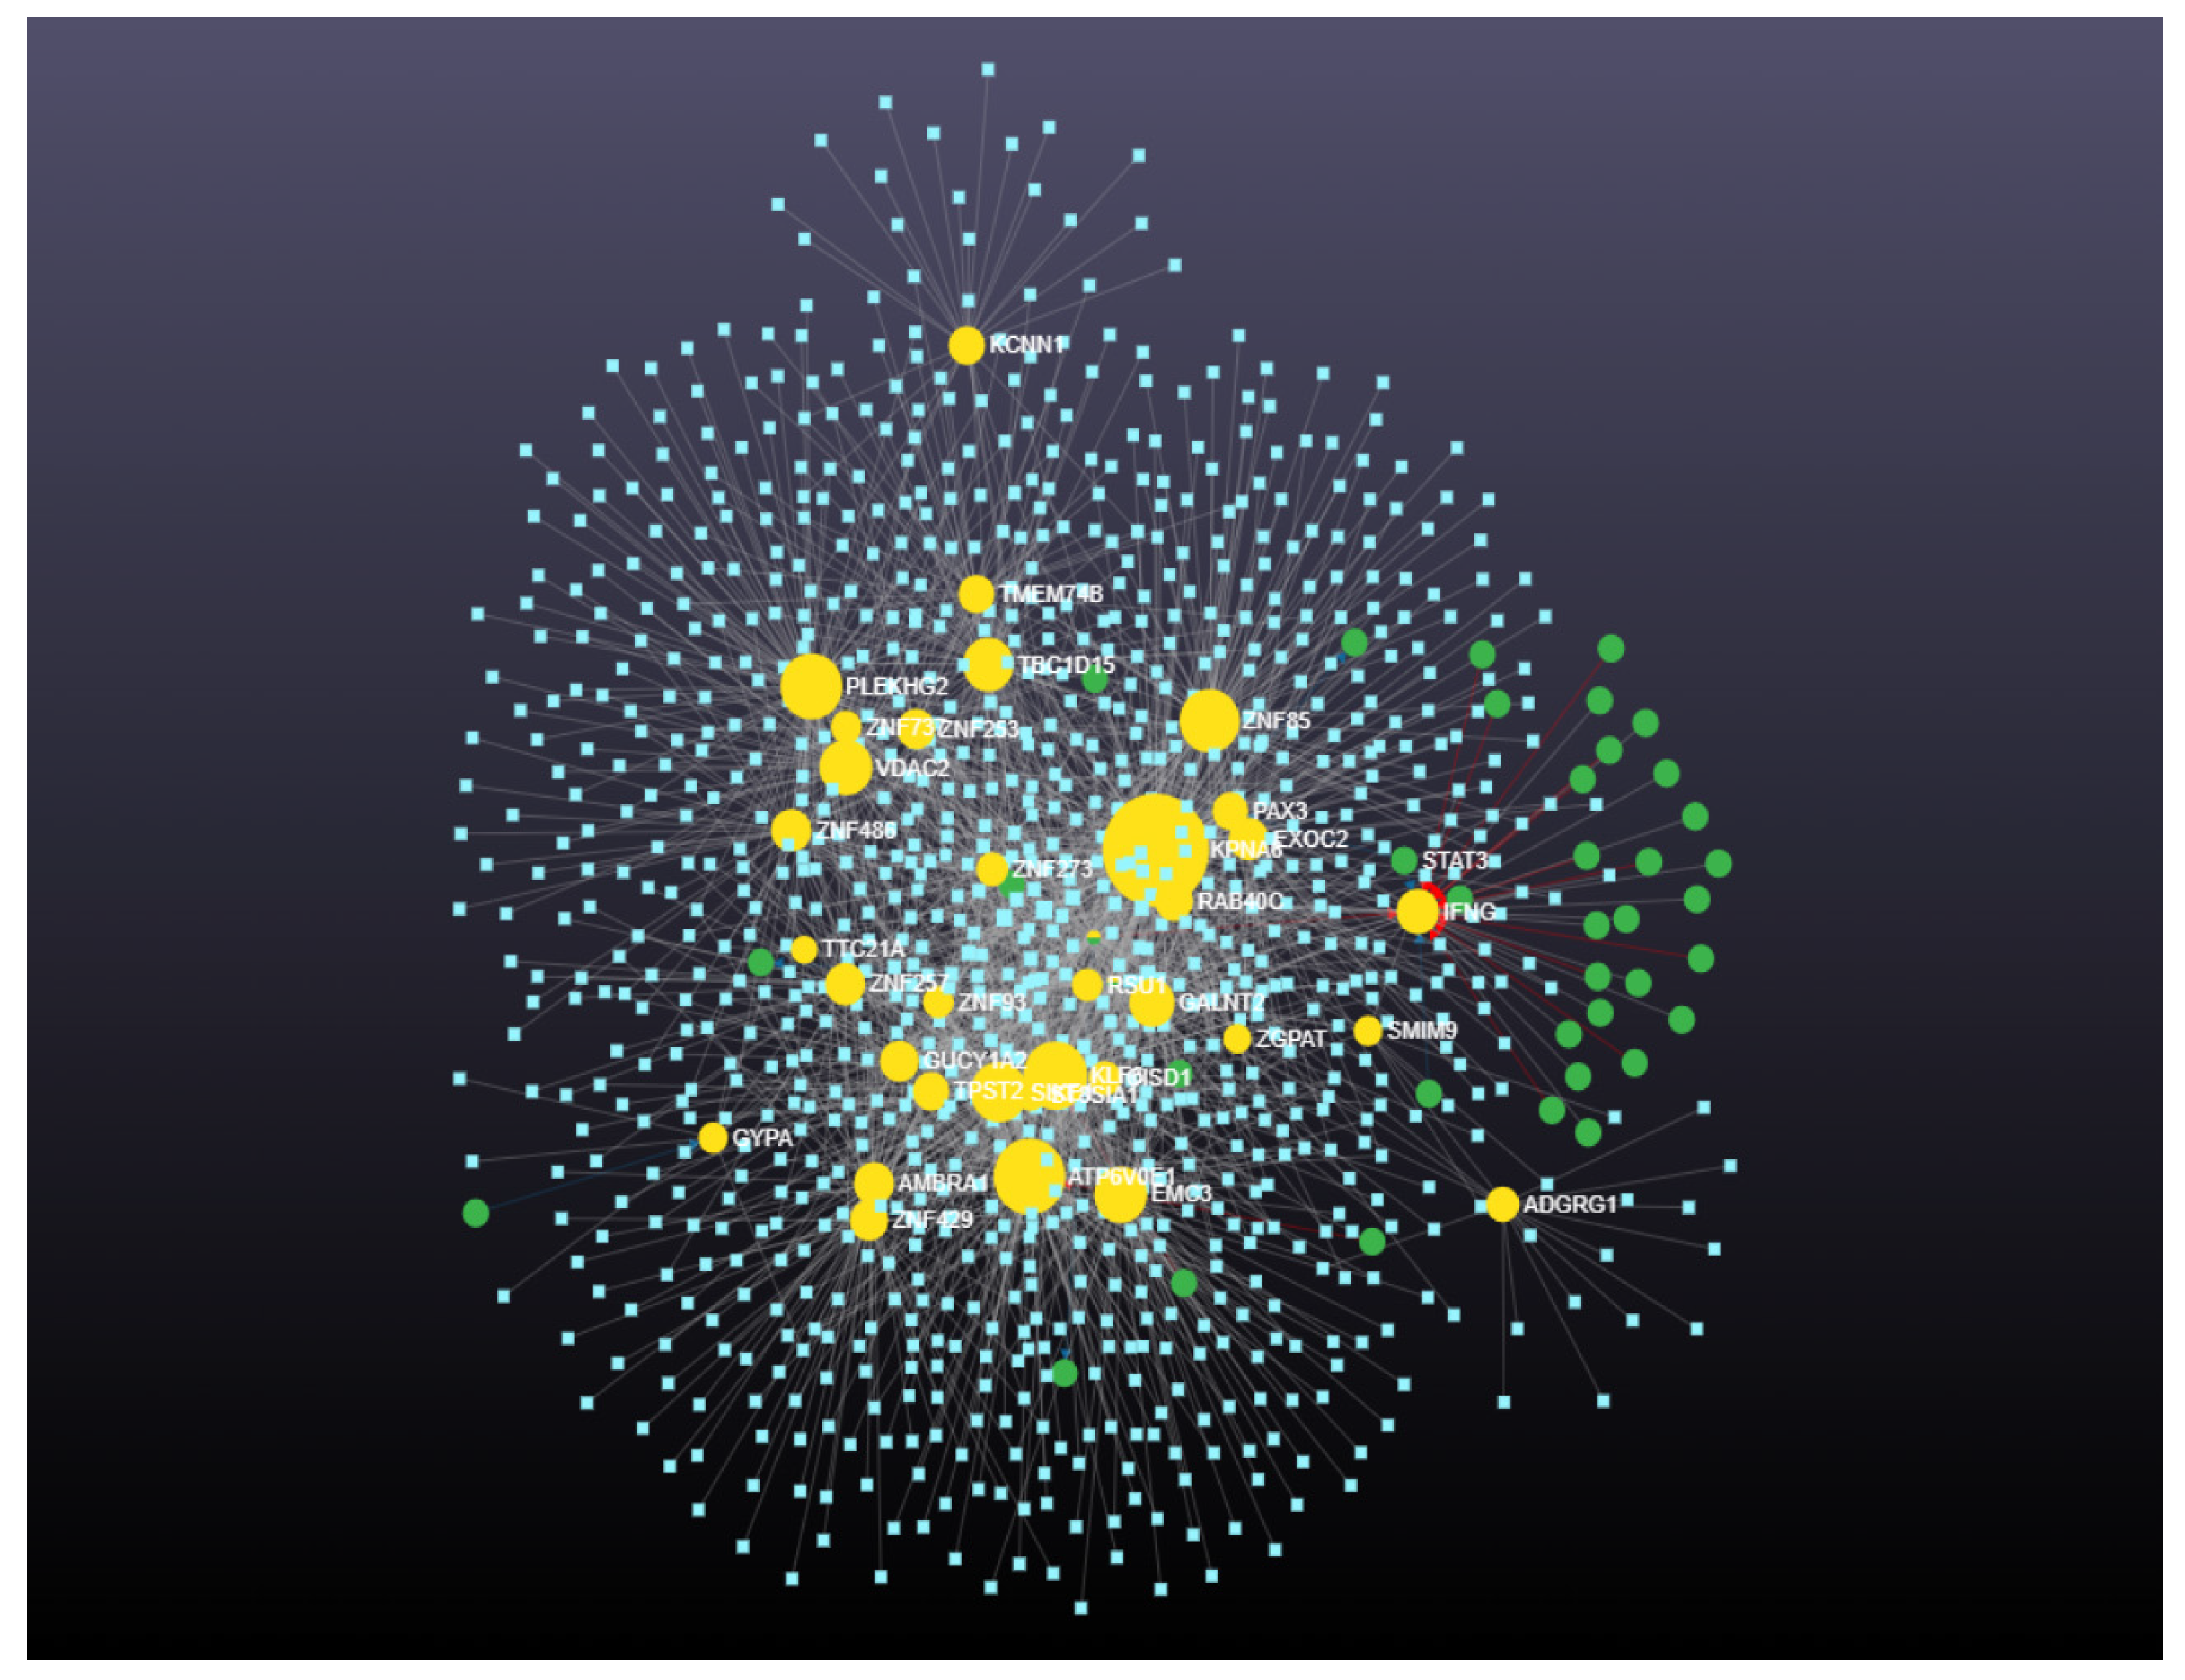
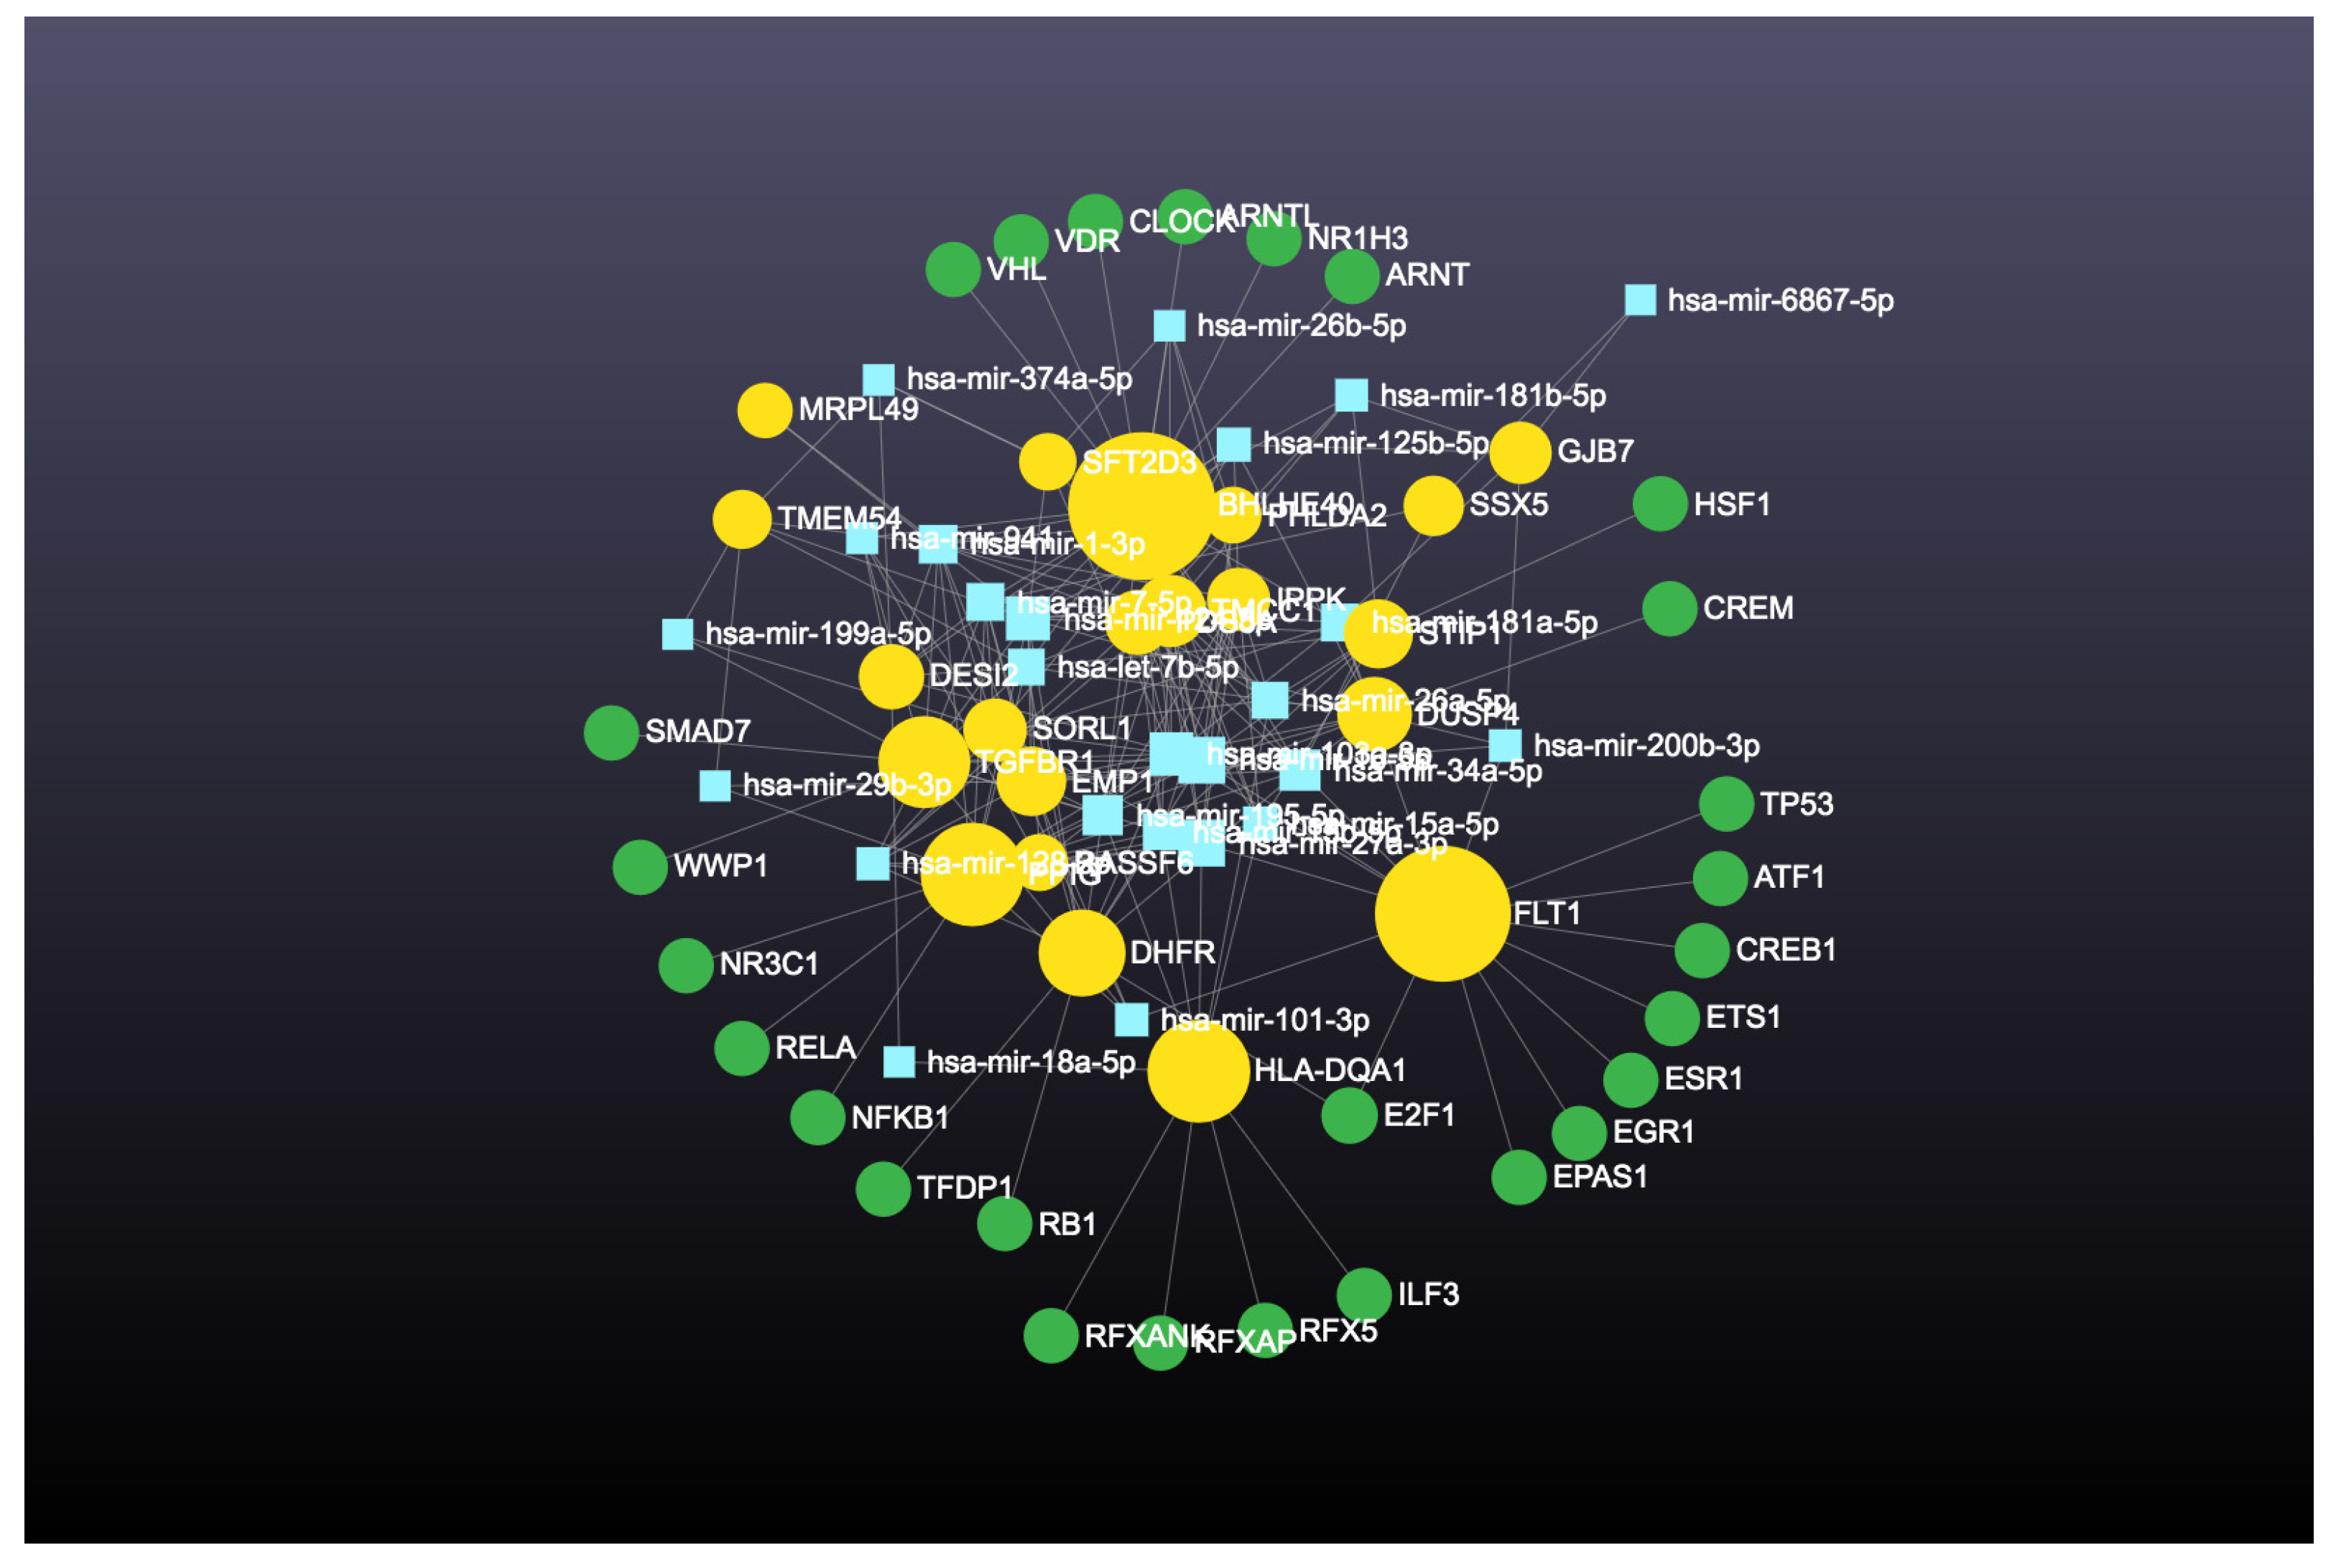
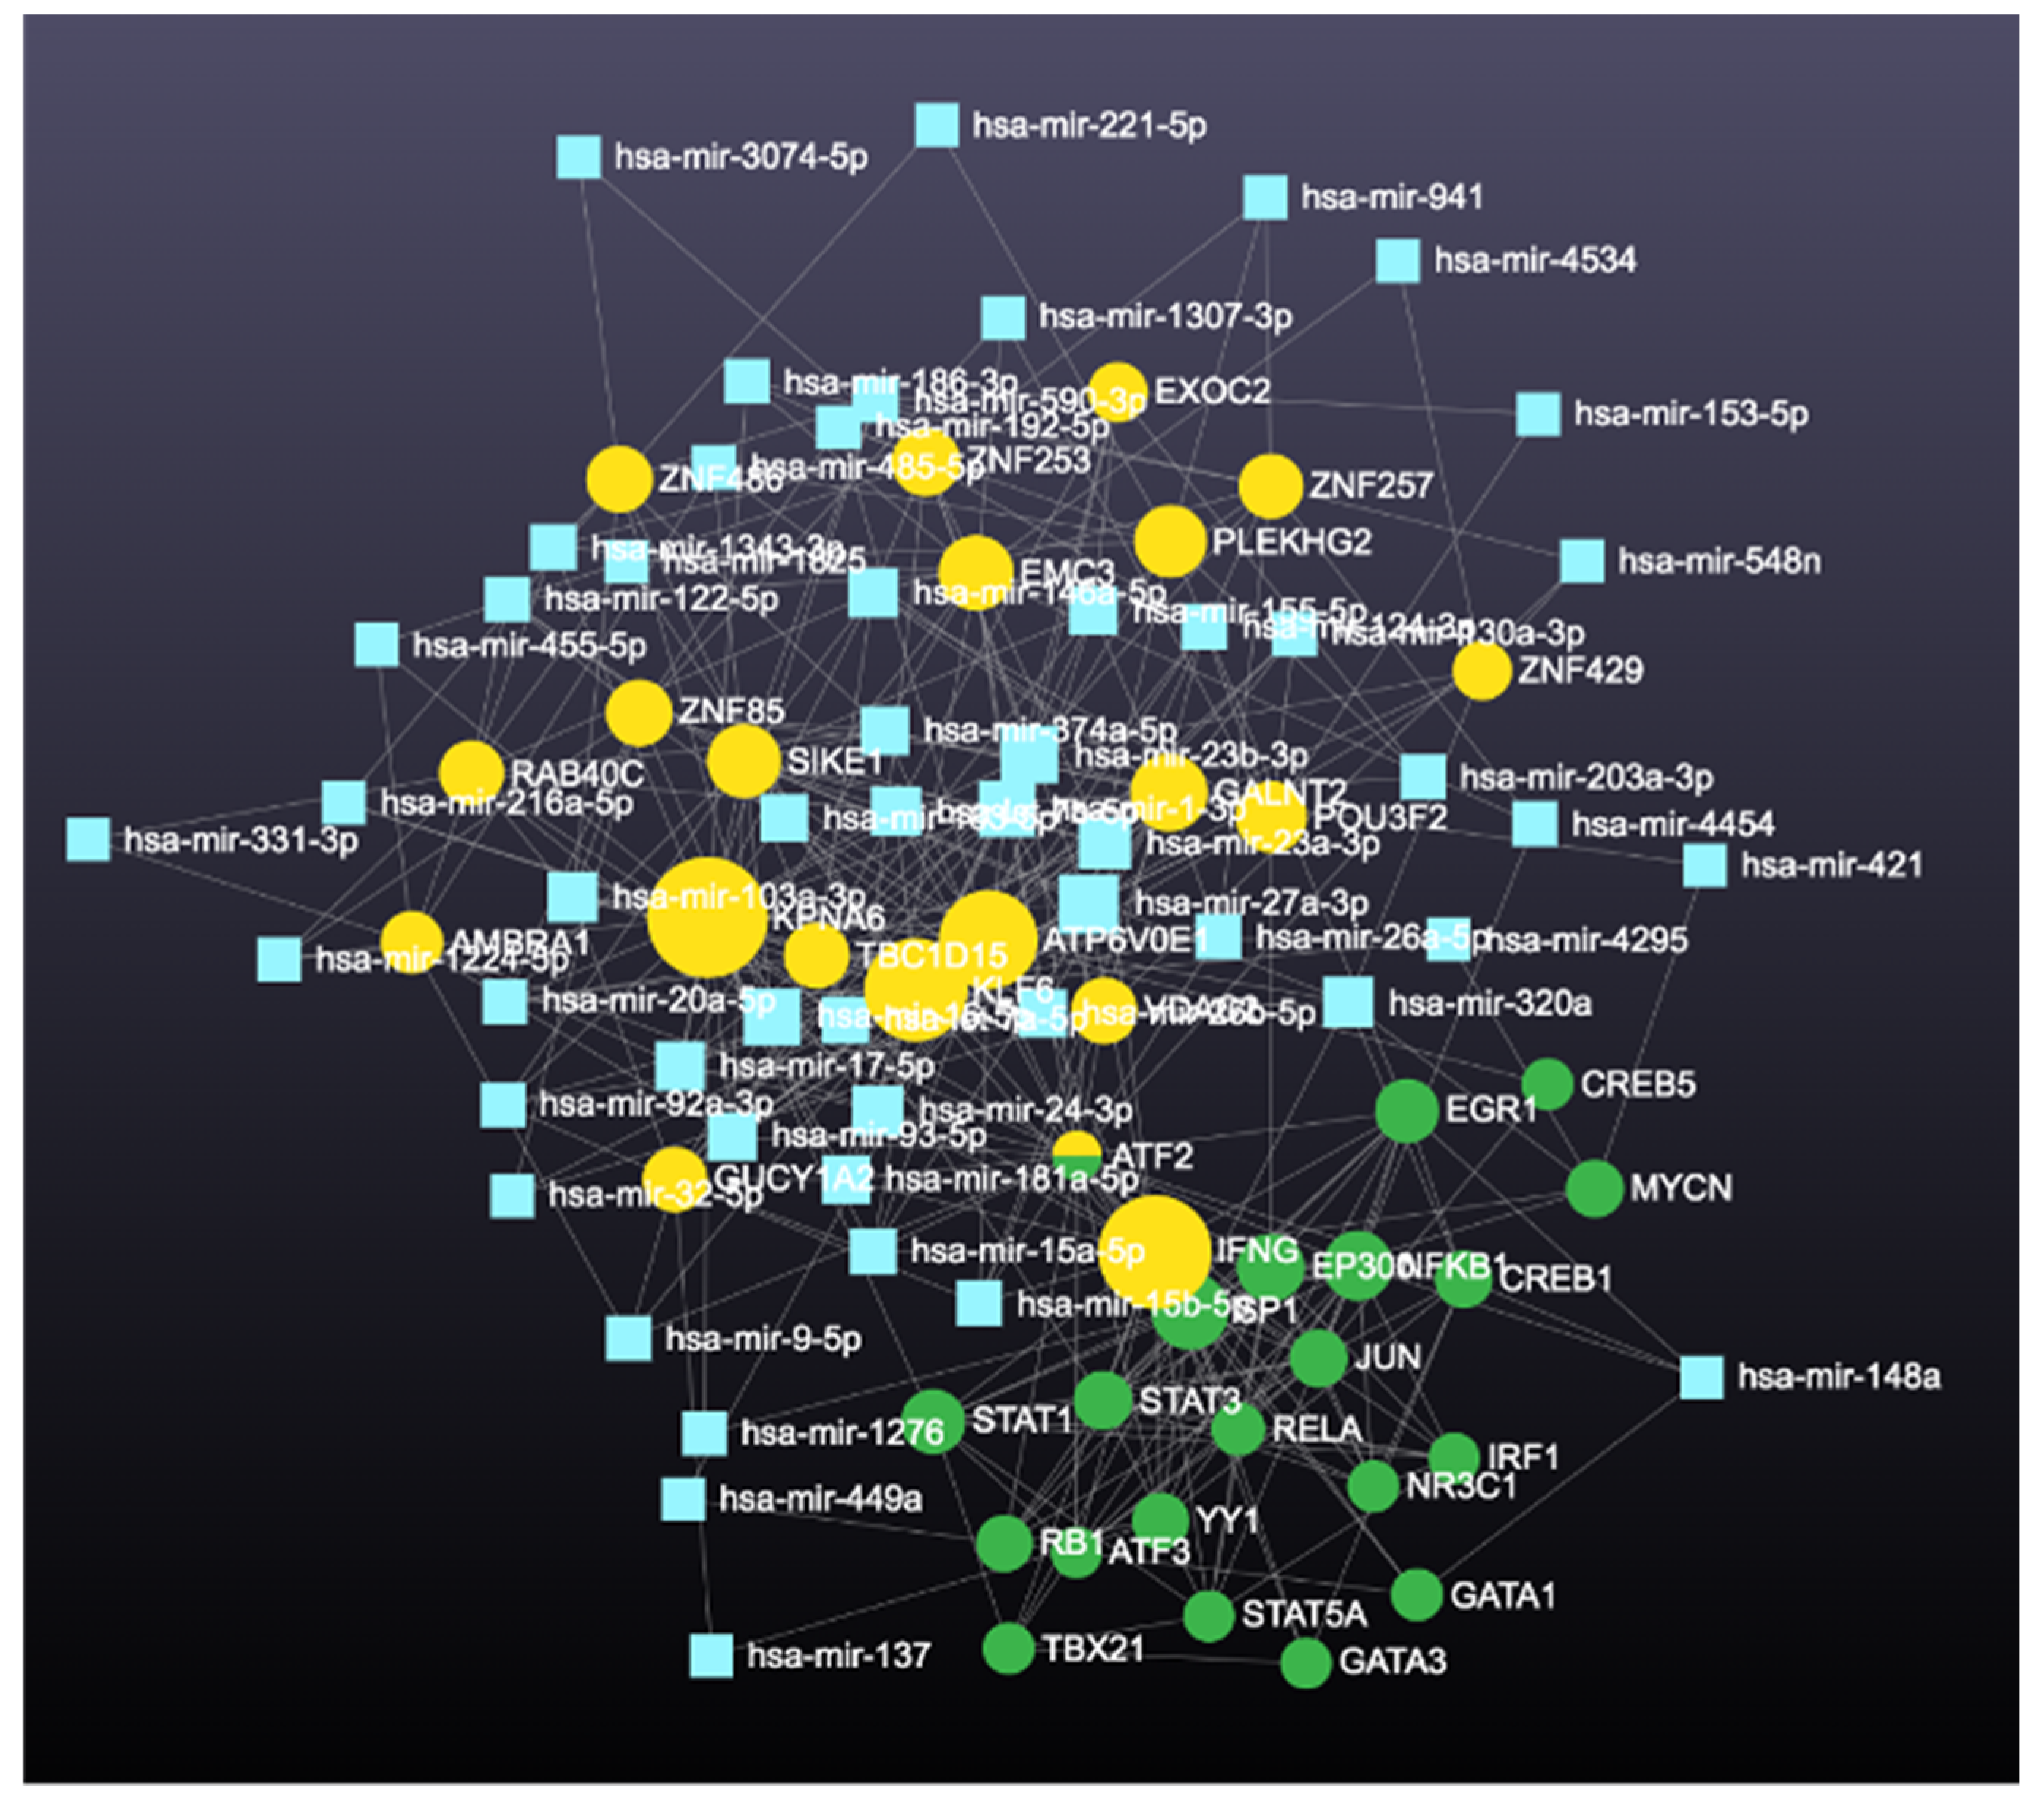
2.4.1. Prediction and Analysis of Differentially Expressed Genes
2.4.2. Gene Ontology and Functional Annotation Analysis of Genes with the Highest Degree and Betweenness Centrality
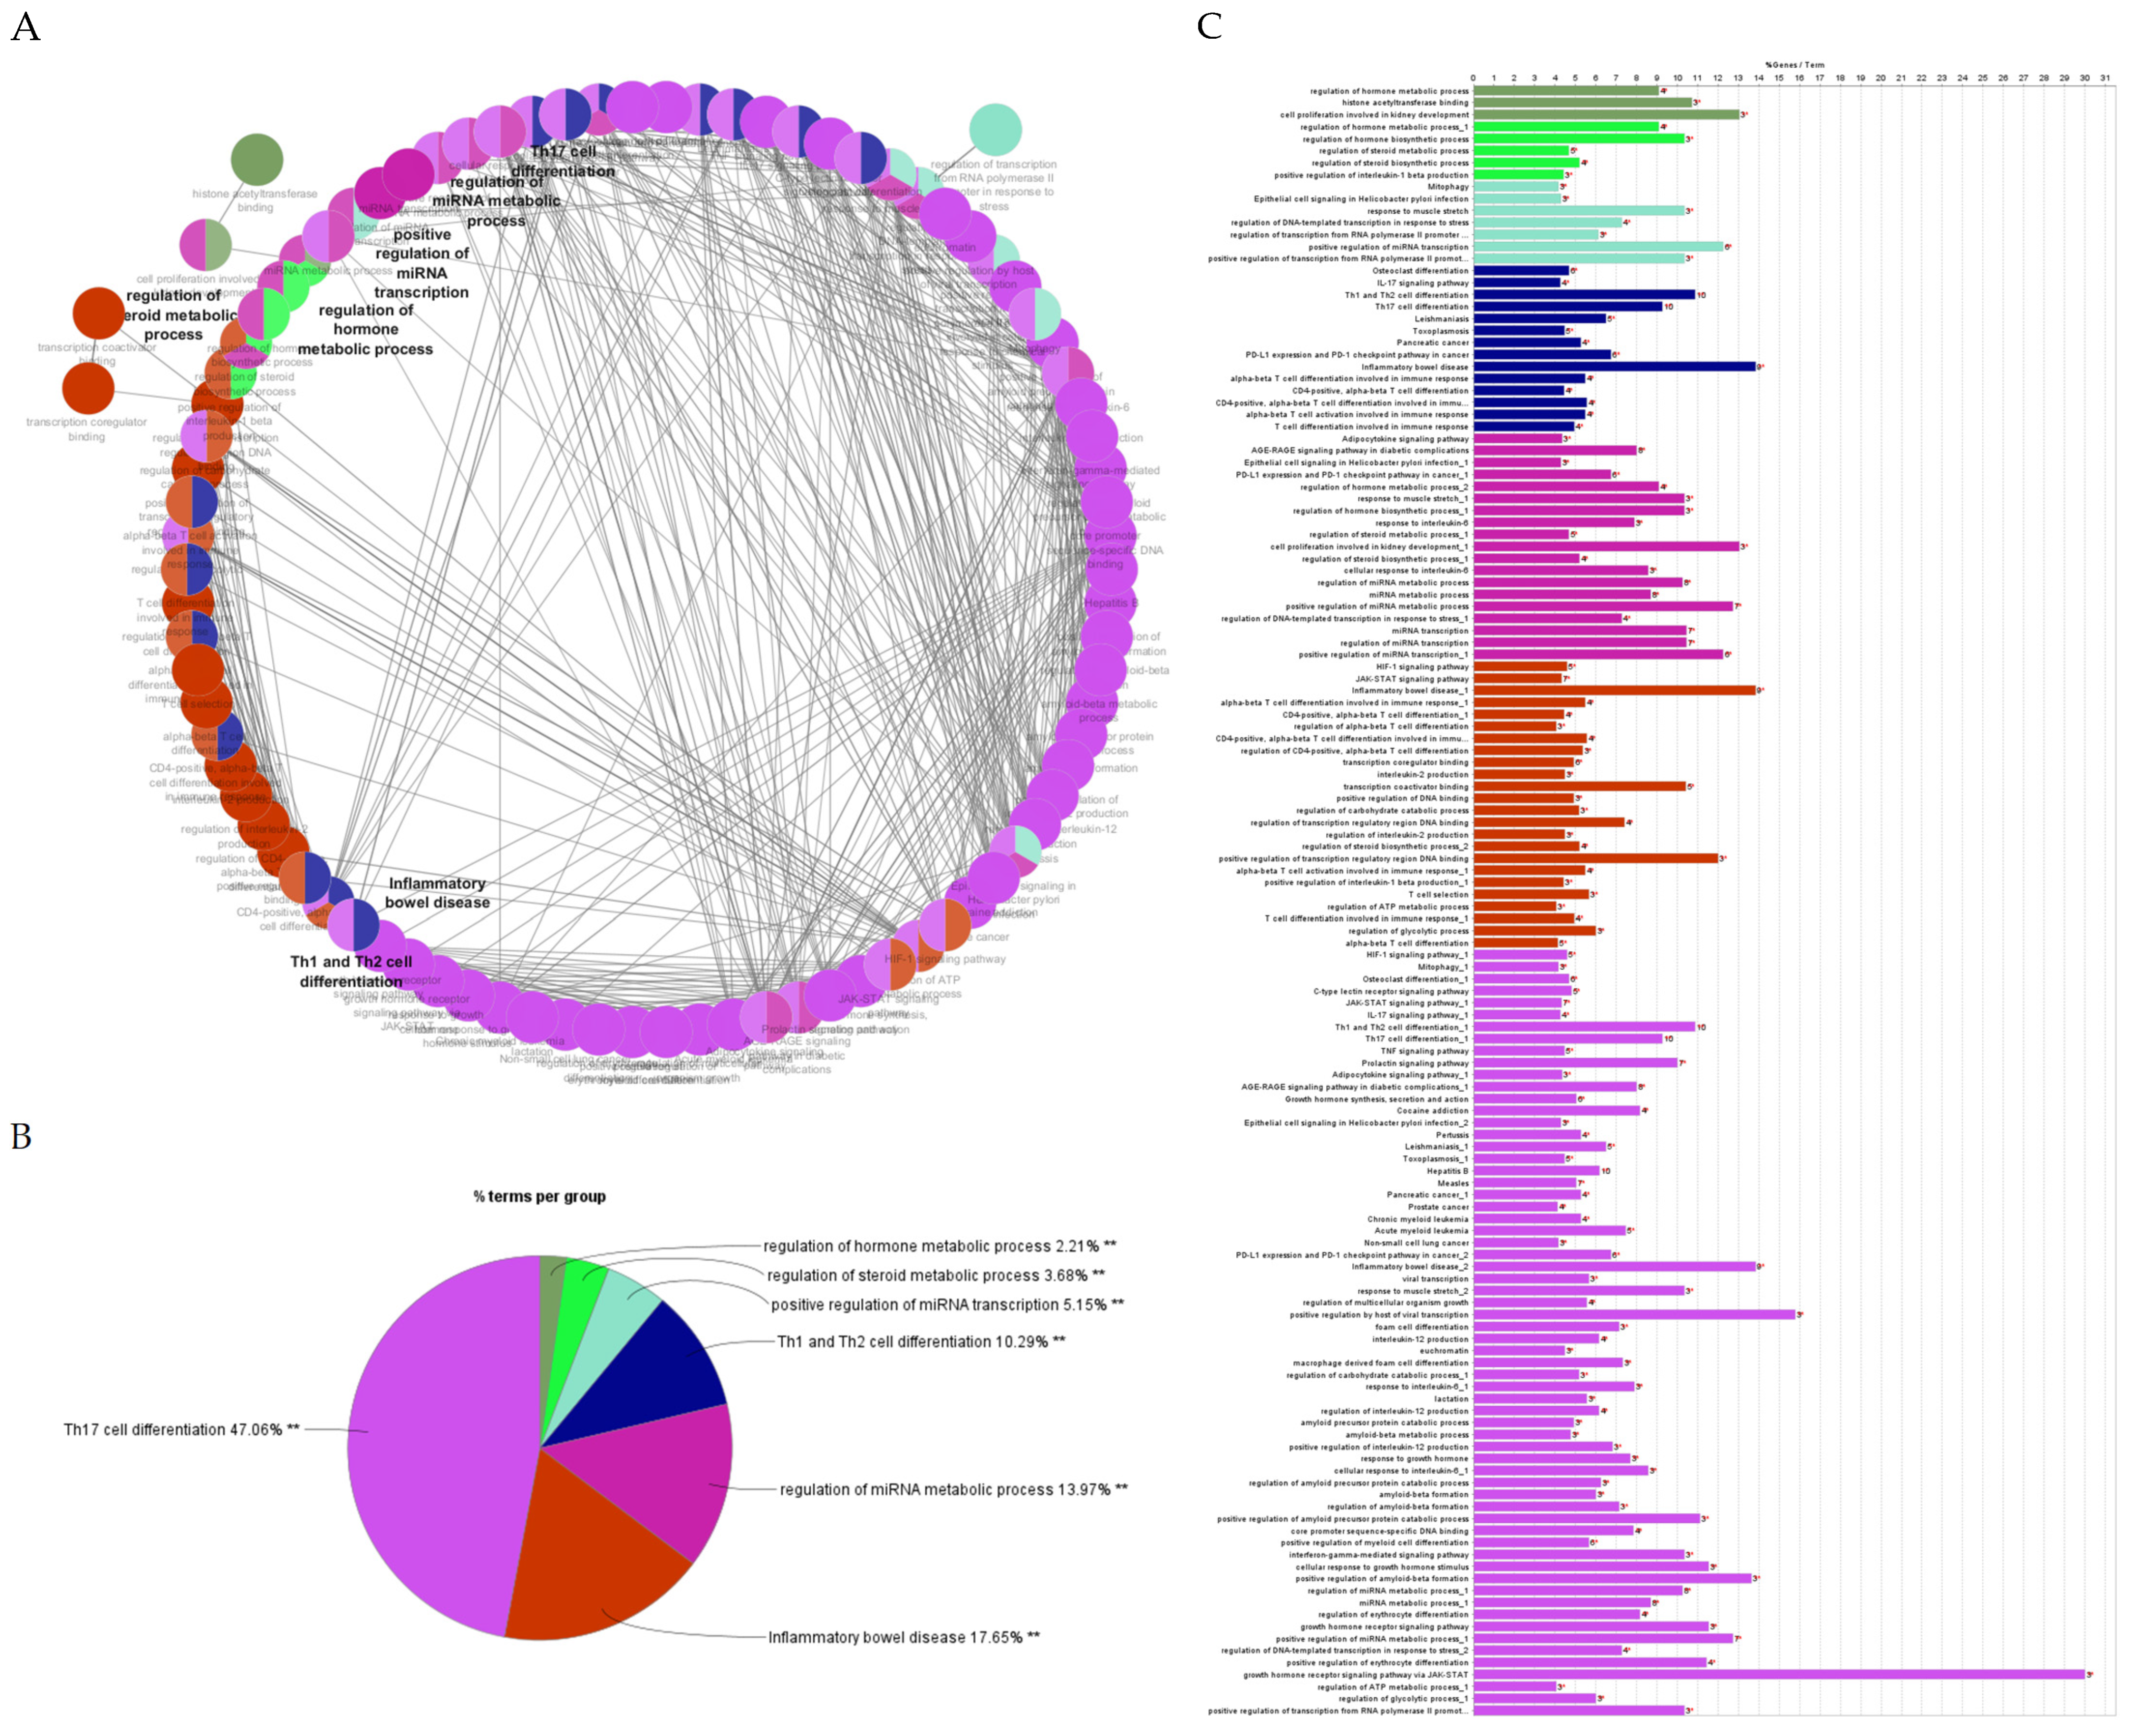
2.4.3. Gene Ontology Enrichment and KEGG Pathway Analysis
2.4.4. Identification and Analysis of Hub Gene
2.4.5. Gene Ontology and Functional Annotation Analysis of Hub Genes
2.4.6. Comparison of miRNAs of Different Types of Preeclampsia
3. Results
4. Discussion
4.1. Upregulated Genes with High Betweenness
4.2. Downregulated Genes with High Betweenness Centrality
4.3. Comparison of miRNAs of Different Types of Preeclampsia
4.4. Involvement of Hub Genes in Preeclampsia Development
4.5. Hub Genes with Diagnostic and Therapeutic Perspectives
5. Conclusions
Supplementary Materials
Author Contributions
Funding
Institutional Review Board Statement
Informed Consent Statement
Data Availability Statement
Acknowledgments
Conflicts of Interest
References
- Say, L.; Chou, D.; Gemmill, A.; Tunçalp, Ö.; Moller, A.B.; Daniels, J.; Gülmezoglu, A.M.; Temmerman, M.; Alkema, L. Global causes of maternal death: A WHO systematic analysis. Lancet Glob. Health 2014, 2, e323–e333. [Google Scholar] [CrossRef]
- Dawson, E.L. Preeclampsia, Genomics and Public Health. 2022. Available online: https://blogs.cdc.gov/genomics/2022/10/25/preeclampsia/ (accessed on 7 January 2023).
- Wright, D.; Syngelaki, A.; Akolekar, R.; Poon, L.C.; Nicolaides, K.H. Competing risks model in screening for preeclampsia by maternal characteristics and medical history. Am. J. Obstet. Gynecol. 2015, 213, 62.e1–62.e10. [Google Scholar] [CrossRef] [PubMed]
- Moufarrej, M.N.; Vorperian, S.K.; Wong, R.J.; Campos, A.A.; Quaintance, C.C.; Sit, R.V.; Tan, M.; Detweiler, A.M.; Mekonen, H.; Neff, N.F.; et al. Early prediction of preeclampsia in pregnancy with cell-free RNA. Nature 2022, 602, 689–694. [Google Scholar] [CrossRef] [PubMed]
- Poon, L.C.; Shennan, A.; Hyett, J.A.; Kapur, A.; Hadar, E.; Divakar, H.; McAuliffe, F.; da Silva Costa, F.; von Dadelszen, P.; McIntyre, H.D.; et al. The International Federation of Gynecology and Obstetrics (FIGO) initiative on pre-eclampsia: A pragmatic guide for first-trimester screening and prevention. Int. J. Gynaecol. Obstet. 2019, 145 (Suppl. 1), 1–33. [Google Scholar] [CrossRef]
- Uzan, J.; Carbonnel, M.; Piconne, O.; Asmar, R.; Ayoubi, J.M. Pre-eclampsia: Pathophysiology, diagnosis, and management. Vasc. Health Risk Manag. 2011, 7, 467–474. [Google Scholar] [CrossRef]
- Nakashima, A.; Tsuda, S.; Kusabiraki, T.; Aoki, A.; Ushijima, A.; Shima, T.; Cheng, S.B.; Sharma, S.; Saito, S. Current Understanding of Autophagy in Pregnancy. Int. J. Mol. Sci. 2019, 20, 2342. [Google Scholar] [CrossRef] [PubMed]
- Gong, S.; Gaccioli, F.; Dopierala, J.; Sovio, U.; Cook, E.; Volders, P.J.; Martens, L.; Kirk, P.D.W.; Richardson, S.; Smith, G.C.S.; et al. The RNA landscape of the human placenta in health and disease. Nat. Commun. 2021, 12, 2639. [Google Scholar] [CrossRef] [PubMed]
- Love, M.I.; Huber, W.; Anders, S. Moderated estimation of fold change and dispersion for RNA-seq data with DESeq2. Genome Biol. 2014, 15, 550. [Google Scholar] [CrossRef] [PubMed]
- Davis, S.; Meltzer, P.S. GEOquery: A bridge between the Gene Expression Omnibus (GEO) and BioConductor. Bioinformatics 2007, 23, 1846–1847. [Google Scholar] [CrossRef]
- Chang, L.; Zhou, G.; Soufan, O.; Xia, J. miRNet 2.0: Network-based visual analytics for miRNA functional analysis and systems biology. Nucleic Acids Res. 2020, 48, W244–W251. [Google Scholar] [CrossRef]
- Szklarczyk, D.; Gable, A.L.; Nastou, K.C.; Lyon, D.; Kirsch, R.; Pyysalo, S.; Doncheva, N.T.; Legeay, M.; Fang, T.; Bork, P.; et al. The STRING database in 2021: Customizable protein-protein networks, and functional characterization of user-uploaded gene/measurement sets. Nucleic Acids Res. 2021, 49, D605–D612. [Google Scholar] [CrossRef]
- Gustavsen, J.A.; Pai, S.; Isserlin, R.; Demchak, B.; Pico, A.R. RCy3: Network biology using Cytoscape from within R. F1000Research 2019, 8, 1774. [Google Scholar] [CrossRef]
- Chin, C.H.; Chen, S.H.; Wu, H.H.; Ho, C.W.; Ko, M.T.; Lin, C.Y. cytoHubba: Identifying hub objects and sub-networks from complex interactome. BMC Syst. Biol. 2014, 8 (Suppl. S4), S11. [Google Scholar] [CrossRef]
- Bindea, G.; Mlecnik, B.; Hackl, H.; Charoentong, P.; Tosolini, M.; Kirilovsky, A.; Fridman, W.H.; Pagès, F.; Trajanoski, Z.; Galon, J. ClueGO: A Cytoscape plug-in to decipher functionally grouped gene ontology and pathway annotation networks. Bioinformatics 2009, 25, 1091–1093. [Google Scholar] [CrossRef]
- Ren, Z.; Gao, Y.; Gao, Y.; Liang, G.; Chen, Q.; Jiang, S.; Yang, X.; Fan, C.; Wang, H.; Wang, J.; et al. Distinct placental molecular processes associated with early-onset and late-onset preeclampsia. Theranostics 2021, 11, 5028–5044. [Google Scholar] [CrossRef]
- Ashtiani, M.; Salehzadeh-Yazdi, A.; Razaghi-Moghadam, Z.; Hennig, H.; Wolkenhauer, O.; Mirzaie, M.; Jafari, M. A systematic survey of centrality measures for protein-protein interaction networks. BMC Syst. Biol. 2018, 12, 80. [Google Scholar] [CrossRef]
- Tang, Y.; Li, M.; Wang, J.; Pan, Y.; Wu, F.X. CytoNCA: A cytoscape plugin for centrality analysis and evaluation of protein interaction networks. Biosystems 2015, 127, 67–72. [Google Scholar] [CrossRef]
- Peláez, N.; Carthew, R.W. Biological robustness and the role of microRNAs: A network perspective. Curr. Top. Dev. Biol. 2012, 99, 237–255. [Google Scholar] [CrossRef]
- Viacava Follis, A. Centrality of drug targets in protein networks. BMC Bioinform. 2021, 22, 527. [Google Scholar] [CrossRef]
- Li, M.O.; Wan, Y.Y.; Panjabi, S.; Robertson, A.K.; Flavell, R.A. Transforming growth factor-beta regulation of immune responses. Ann. Rev. Immunol. 2006, 24, 99–146. [Google Scholar] [CrossRef]
- Hedin, C.H.; Moustakas, A. Signaling Receptors for TGF-β Family Members. Cold Spring Herb. Perspect. Biol. 2016, 8, a022053. [Google Scholar] [CrossRef]
- Feng, X.H.; Derynck, R. Specificity and versatility in tgf-beta signaling through Smads. Annu. Rev. Cell Dev. Biol. 2005, 21, 659–693. [Google Scholar] [CrossRef]
- Derynck, R.; Zhang, Y.E. Smad-dependent and Smad-independent pathways in TGF-beta family signalling. Nature 2003, 425, 577–584. [Google Scholar] [CrossRef]
- Djurovic, S.; Schjetlein, R.; Wisløff, F.; Haugen, G.; Husby, H.; Berg, K. Plasma concentrations of Lp(a) lipoprotein and TGF-beta1 are altered in preeclampsia. Clin. Genet. 1997, 52, 371–376. [Google Scholar] [CrossRef]
- Benian, A.; Madazli, R.; Aksu, F.; Uzun, H.; Aydin, S. Plasma and placental levels of interleukin-10, transforming growth factor-beta1, and epithelial-cadherin in preeclampsia. Obstet. Gynecol. 2002, 100, 327–331. [Google Scholar] [CrossRef]
- Naicker, T.; Khedun, S.M.; Moodley, J. Transforming growth factor beta(1) levels in platelet depleted plasma in African women with pre-eclampsia. J. Obstet. Gynaecol. 2002, 22, 279–282. [Google Scholar] [CrossRef]
- Zhang, J.; Dunk, C.E.; Shynlova, O.; Caniggia, I.; Lye, S.J. TGFb1 suppresses the activation of distinct dNK subpopulations in preeclampsia. EBioMedicine 2019, 39, 531–539. [Google Scholar] [CrossRef]
- Ramkissoon, A.; Chaney, K.E.; Milewski, D.; Williams, K.B.; Williams, R.L.; Choi, K.; Miller, A.; Kalin, T.V.; Pressey, J.G.; Szabo, S.; et al. Targeted inhibition of the dual specificity phosphatases DUSP1 and DUSP6 suppress MPNST growth via JNK. Clin. Cancer Res. 2019, 25, 4117–4127. [Google Scholar] [CrossRef]
- Xu, Y.; Wu, D.; Hui, B.; Shu, L.; Tang, X.; Wang, C.; Xie, J.; Yin, Y.; Sagnelli, M.; Yang, N.; et al. A novel regulatory mechanism network mediated by lncRNA TUG1 that induces the impairment of spiral artery remodeling in preeclampsia. Mol. Ther. 2022, 30, 1692–1705. [Google Scholar] [CrossRef]
- Christie, G.R.; Williams, D.J.; Macisaac, F.; Dickinson, R.J.; Rosewell, I.; Keyse, S.M. The dual-specificity protein phosphatase DUSP9/MKP-4 is essential for placental function but is not required for normal embryonic development. Mol. Cell. Biol. 2005, 25, 8323–8333. [Google Scholar] [CrossRef]
- Meng, T.; Chen, H.; Sun, M.; Wang, H.; Zhao, G.; Wang, X. Identification of differential gene expression profiles in placentas from preeclamptic pregnancies versus normal pregnancies by DNA microarrays. OMICS 2012, 16, 301–311. [Google Scholar] [CrossRef]
- Zhang, N.; Zhu, H.P.; Huang, W.; Wen, X.; Xie, X.; Jiang, X.; Peng, C.; Han, B.; He, G. Unraveling the structures, functions and mechanisms of epithelial membrane protein family in human cancers. Exp. Hematol. Oncol. 2022, 11, 69. [Google Scholar] [CrossRef]
- Hannan, N.J.; Stock, O.; Spencer, R.; Whitehead, C.; David, A.L.; Groom, K.; Petersen, S.; Henry, A.; Said, J.M.; Seeho, S.; et al. Circulating mRNAs are differentially expressed in pregnancies with severe placental insufficiency and at high risk of stillbirth. BMC Med. 2020, 18, 145. [Google Scholar] [CrossRef]
- Mi, C.; Ye, B.; Gao, Z.; Du, J.; Li, R.; Huang, D. BHLHE40 plays a pathological role in pre-eclampsia through upregulating SNX16 by transcriptional inhibition of miR-196a-5p. Mol. Hum. Reprod. 2020, 26, 532–548. [Google Scholar] [CrossRef]
- Rasmussen, K.D.; Helin, K. Role of TET enzymes in DNA methylation, development, and cancer. Genes. Dev. 2016, 30, 733–750. [Google Scholar] [CrossRef]
- Sun, Z.; Wu, T.; Zhao, F.; Lau, A.; Birch, C.M.; Zhang, D.D. KPNA6 (Importin {alpha}7)-mediated nuclear import of Keap1 represses the Nrf2-dependent antioxidant response. Mol. Cell. Biol. 2011, 31, 1800–1811. [Google Scholar] [CrossRef]
- Kopacz, A.; Kloska, D.; Forman, H.J.; Jozkowicz, A.; Grochot-Przeczek, A. Beyond repression of Nrf2: An update on Keap1. Free Radic. Biol. Med. 2020, 157, 63–74. [Google Scholar] [CrossRef]
- Mundal, S.B.; Rakner, J.J.; Silva, G.B.; Gierman, L.M.; Austdal, M.; Basnet, P.; Elschot, M.; Bakke, S.S.; Ostrop, J.; Thomsen, L.C.V.; et al. Divergent Regulation of Decidual Oxidative-Stress Response by NRF2 and KEAP1 in Preeclampsia with and without Fetal Growth Restriction. Int. J. Mol. Sci. 2022, 23, 1966. [Google Scholar] [CrossRef]
- Gong, J.S.; Kim, G.J. The role of autophagy in the placenta as a regulator of cell death. Clin. Exp. Reprod. Med. 2014, 41, 97–107. [Google Scholar] [CrossRef]
- Saha, S.; Panigrahi, D.P.; Patil, S.; Bhutia, S.K. Autophagy in health and disease: A comprehensive review. Biomed. Pharmacother. 2018, 104, 485–495. [Google Scholar] [CrossRef]
- Dewi, N.M.; Triana, R.; Chouw, A.; Darmayanti, S. Role of Autophagy in Preeclampsia. Indones. J. Clin. Pharm. 2020, 9, 50–55. [Google Scholar] [CrossRef]
- Spinazzola, A.; Zeviani, M. Mitochondrial diseases: A cross-talk between mitochondrial and nuclear genomes. Adv. Exp. Med. Biol. 2009, 652, 69–84. [Google Scholar] [CrossRef]
- Youle, R.J.; Van Der Bliek, A.M. Mitochondrial fission, fusion, and stress. Science 2012, 337, 1062–1065. [Google Scholar] [CrossRef] [PubMed]
- Pacheco, F.J.; Almaguel, F.G.; Evans, W.; Rios-Colon, L.; Filippov, V.; Leoh, L.S.; Rook-Arena, E.; Mediavilla-Varela, M.; De Leon, M.; Casiano, C.A. Docosahexanoic acid antagonizes TNF-a-induced necroptosis by attenuating oxidative stress, ceramide production, lysosomal dysfunction, and autophagic features. Inflamm. Res. 2014, 63, 859–871. [Google Scholar] [CrossRef]
- Marín, R.; Chiarello, D.I.; Abad, C.; Rojas, D.; Toledo, F.; Sobrevia, L. Oxidative stress and mitochondrial dysfunction in early onset and late-onset preeclampsia. Biochim. Biophys. Acta Mol. Basis Dis. 2020, 1866, 165961. [Google Scholar] [CrossRef]
- Holland, O.; Dekker Nitert, M.; Gallo, L.A.; Vejzovic, M.; Fisher, J.J.; Perkins, A.V. Placental mitochondrial function and structure in gestational disorders. Placenta 2017, 54, 2–9. [Google Scholar] [CrossRef] [PubMed]
- Burton, G.J.; Yung, H.W.; Murray, A.J. Mitochondrial—Endoplasmic reticulum interactions in the trophoblast: Stress and senescence. Placenta 2017, 52, 146–155. [Google Scholar] [CrossRef]
- McElwain, C.J.; Tuboly, E.; McCarthy, F.P.; McCarthy, C.M. Mechanisms of endothelial dysfunction in pre-eclampsia and gestational diabetes mellitus: Windows into future cardiometabolic health? Front. Endocrinol. 2020, 11, 655. [Google Scholar] [CrossRef]
- Bustamante, J.; Ramírez-Vélez, R.; Czerniczyniec, A.; Cicerchia, D.; Aguilar de Plata, A.C.; Lores-Arnaiz, S. Oxygen metabolism in human placenta mitochondria. J. Bioenerg. Biomembr. 2014, 46, 459–469. [Google Scholar] [CrossRef]
- Shi, Z.; Long, W.; Zhao, C.; Guo, X.; Shen, R.; Ding, H. Comparative proteomics analysis suggests that placental mitochondria are involved in the development of pre-eclampsia. PLoS ONE 2013, 8, e64351. [Google Scholar] [CrossRef]
- Jiang, Z.; Zou, Y.; Ge, Z.; Zuo, Q.; Huang, S.Y.; Sun, L. A role of sFlt-1 in oxidative stress and apoptosis in human and mouse pre-eclamptic trophoblasts. Biol. Reprod. 2015, 93, 73. [Google Scholar] [CrossRef] [PubMed]
- Zsengellér, Z.K.; Rajakumar, A.; Hunter, J.T.; Salahuddin, S.; Rana, S.; Stillman, I.E.; Ananth Karumanchi, S. Trophoblast mitochondrial function is impaired in preeclampsia and correlates negatively with the expression of soluble fms-like tyrosine kinase 1. Pregnancy Hypertens. 2016, 6, 313–319. [Google Scholar] [CrossRef] [PubMed]
- Holland, O.J.; Cuffe, J.S.M.; Dekker Nitert, M.; Callaway, L.; Kwan Cheung, K.A.; Radenkovic, F.; Perkins, A.V. Placental mitochondrial adaptations in preeclampsia associated with progression to term delivery. Cell Death Dis. 2018, 9, 1150. [Google Scholar] [CrossRef] [PubMed]
- Miranda, A.L.; Racca, A.C.; Kourdova, L.T.; Rojas, M.L.; Cruz Del Puerto, M.; Rodriguez-Lombardi, G.; Salas, A.V.; Travella, C.; da Silva, E.C.O.; de Souza, S.T.; et al. Krüppel-like factor 6 (KLF6) requires its amino terminal domain to promote villous trophoblast cell fusion. Placenta 2022, 117, 139–149. [Google Scholar] [CrossRef] [PubMed]
- Li, X.; Liu, L.; Whitehead, C.; Li, J.; Thierry, B.; Le, T.D.; Winter, M. Identifying preeclampsia-associated genes using a control theory method. Brief. Funct. Genom. 2022, 21, 296–309. [Google Scholar] [CrossRef] [PubMed]
- Enquobahrie, D.; Qiu, C.; Muhie, S.Y.; Williams, M.A. Maternal peripheral blood gene expression in early pregnancy and preeclampsia. Int. J. Mol. Epidemiol. Genet. 2011, 2, 78–94. [Google Scholar]
- Ashley, B.; Simner, C.; Manousopoulou, A.; Jenkinson, C.; Hey, F.; Frost, J.M.; Rezwan, F.I.; White, C.H.; Lofthouse, E.M.; Hyde, E.; et al. Placental uptake and metabolism of 25(OH)vitamin D determine its activity within the fetoplacental unit. Elife 2022, 11, e71094. [Google Scholar] [CrossRef]
- Yeung, K.R.; Chiu, C.L.; Pidsley, R.; Makris, A.; Hennessy, A.; Lind, J.M. DNA methylation profiles in preeclampsia and healthy control placentas. Am. J. Physiol. Heart Circ. Physiol. 2016, 310, H1295–H1303. [Google Scholar] [CrossRef]
- Chhabra, D.; Sharma, S.; Kho, A.T.; Gaedigk, R.; Vyhlidal, C.A.; Leeder, J.S.; Morrow, J.; Carey, V.J.; Weiss, S.T.; Tantisira, K.G.; et al. Fetal lung and placental methylation is associated with in utero nicotine exposure. Epigenetics 2014, 9, 1473–1484. [Google Scholar] [CrossRef]
- Timofeeva, A.V.; Fedorov, I.S.; Brzhozovskiy, A.G.; Bugrova, A.E.; Chagovets, V.V.; Volochaeva, M.V.; Starodubtseva, N.L.; Frankevich, V.E.; Nikolaev, E.N.; Shmakov, R.G.; et al. miRNAs and Their Gene Targets-A Clue to Differentiate Pregnancies with Small for Gestational Age Newborns, Intrauterine Growth Restriction, and Preeclampsia. Diagnostics 2021, 11, 729. [Google Scholar] [CrossRef]
- Peng, P.; Song, H.; Xie, C.; Zheng, W.; Ma, H.; Xin, D.; Zhan, J.; Yuan, X.; Chen, A.; Tao, J.; et al. miR-146a-5p-mediated suppression on trophoblast cell progression and epithelial-mesenchymal transition in preeclampsia. Biol. Res. 2021, 54, 30. [Google Scholar] [CrossRef]
- Yuan, Y.; Zhao, L.; Wang, X.; Lian, F.; Cai, Y. Ligustrazine-induced microRNA-16-5p inhibition alleviates preeclampsia through IGF-2. Reproduction 2020, 160, 905–917. [Google Scholar] [CrossRef]
- Akkoc, Y.; Gozuacik, D. MicroRNAs as major regulators of the autophagy pathway. Biochim. Biophys. Acta Mol. Cell Res. 2020, 1867, 118662. [Google Scholar] [CrossRef]
- Ding, J.; Cheng, Y.; Zhang, Y.; Liao, S.; Yin, T.; Yang, J. The miR-27a-3p/USP25 axis participates in the pathogenesis of recurrent miscarriage by inhibiting trophoblast migration and invasion. J. Cell. Physiol. 2019, 234, 19951–19963. [Google Scholar] [CrossRef]
- Wang, M.; Zhang, L.; Huang, X.; Sun, Q. Ligustrazine promotes hypoxia/reoxygenation-treated trophoblast cell proliferation and migration by regulating the microRNA-27a-3p/ATF3 axis. Arch. Biochem. Biophys. 2023, 737, 109522. [Google Scholar] [CrossRef]
- Chen, F.; Hu, S.J. Effect of microRNA-34a in cell cycle, differentiation, and apoptosis: A review. J. Biochem. Mol. Toxicol. 2012, 26, 79–86. [Google Scholar] [CrossRef]
- Kofman, A.V.; Kim, J.; Park, S.Y.; Dupart, E.; Letson, C.; Bao, Y.; Ding, K.; Chen, Q.; Schiff, D.; Larner, J.; et al. microRNA-34a promotes DNA damage and mitotic catastrophe. Cell Cycle 2013, 12, 3500–3511. [Google Scholar] [CrossRef]
- Liu, C.; Zhao, Y.; Xu, X.; Zhang, L.; Cui, F.; Chen, Q.; Li, H.; Sang, R.; Li, G.; He, Y. Puerarin Reduces Radiation-Induced Vascular Endothelial Cell Damage Via miR-34a/Placental Growth Factor. Dose Response 2022, 20, 15593258211068649. [Google Scholar] [CrossRef]
- Doridot, L.; Houry, D.; Gaillard, H.; Chelbi, S.T.; Barbaux, S.; Vaiman, D. miR-34a expression, epigenetic regulation, and function in human placental diseases. Epigenetics 2014, 9, 142–151. [Google Scholar] [CrossRef]
- Sun, M.; Chen, H.; Liu, J.; Tong, C.; Meng, T. MicroRNA-34a inhibits human trophoblast cell invasion by targeting MYC. BMC Cell Biol. 2015, 16, 21. [Google Scholar] [CrossRef]
- Zhou, G.; Winn, E.; Nguyen, D.; Kasten, E.P.; Petroff, M.G.; Hoffmann, H.M. Co-alterations of circadian clock gene transcripts in human placenta in preeclampsia. Sci. Rep. 2022, 12, 17856. [Google Scholar] [CrossRef]
- Gu, Z.; Liu, J.; Cao, K.; Zhang, J.; Wang, J. Centrality-based pathway enrichment: A systematic approach for finding significant pathways dominated by key genes. BMC Syst. Biol. 2012, 6, 56. [Google Scholar] [CrossRef]
- Wang, X.; Thijssen, B.; Yu, H. Target essentiality and centrality characterize drug side effects. PLoS Comput. Biol. 2013, 9, e1003119. [Google Scholar] [CrossRef]
- Van den Berg, C.B.; Chaves, I.; Herzog, E.M.; Willemsen, S.P.; van der Horst, G.T.J.; Steegers-Theunissen, R.P.M. Early and late-onset preeclampsia and the DNA methylation of circadian clock and clock-controlled genes in placental and newborn tissues. Chronobiol. Int. 2017, 34, 921–932. [Google Scholar] [CrossRef]
- Li, Y.; Li, J.; Hou, Y.; Huang, L.; Bian, Y.; Song, G.; Qiao, C. Circadian clock gene Clock is involved in the pathogenesis of preeclampsia through hypoxia. Life Sci. 2020, 247, 117441. [Google Scholar] [CrossRef]
- Redman, C.W. Early and late onset preeclampsia: Two sides of the same coin. Pregnancy Hypertens. 2017, 7, 58. [Google Scholar] [CrossRef]
- Aksornphusitaphong, A.; Phupong, V. Risk factors of early and late onset pre-eclampsia. J. Obstet. Gynaecol. Res. 2013, 39, 627–631. [Google Scholar] [CrossRef]
- Lisonkova, S.; Joseph, K.S. Incidence of preeclampsia: Risk factors and outcomes associated with early- versus late-onset disease. Am. J. Obstet. Gynecol. 2013, 209, 544.e1–544.e12. [Google Scholar] [CrossRef]
- Wójtowicz, A.; Zembala-Szczerba, M.; Babczyk, D.; Kołodziejczyk-Pietruszka, M.; Lewaczyńska, O.; Huras, H. Early- and Late-Onset Preeclampsia: A Comprehensive Cohort Study of Laboratory and Clinical Findings according to the New ISHHP Criteria. Int. J. Hypertens. 2019, 2019, 4108271. [Google Scholar] [CrossRef]
- Sheen, J.J.; Huang, Y.; Andrikopoulou, M.; Wright, J.D.; Goffman, D.; D’Alton, M.E.; Friedman, A.M. Maternal Age and Preeclampsia Outcomes during Delivery Hospitalizations. Am. J. Perinatol. 2020, 37, 44–52. [Google Scholar] [CrossRef]
- Cirkovic, A.; Stanisavljevic, D.; Milin-Lazovic, J.; Rajovic, N.; Pavlovic, V.; Milicevic, O.; Savic, M.; Kostic Peric, J.; Aleksic, N.; Milic, N.; et al. Preeclamptic Women Have Disrupted Placental microRNA Expression at the Time of Preeclampsia Diagnosis: Meta-Analysis. Front. Bioeng. Biotechnol. 2021, 9, 782845. [Google Scholar] [CrossRef] [PubMed]
- Yoffe, L.; Gilam, A.; Yaron, O.; Polsky, A.; Farberov, L.; Syngelaki, A.; Nicolaides, K.; Hod, M.; Shomron, N. Early Detection of Preeclampsia Using Circulating Small Non-Coding RNA. Sci. Rep. 2018, 8, 3401. [Google Scholar] [CrossRef] [PubMed]
- Zhou, S.; Li, J.; Yang, W.; Xue, P.; Yin, Y.; Wang, Y.; Tian, P.; Peng, H.; Jiang, H.; Xu, W.; et al. Noninvasive preeclampsia prediction using plasma cell-free RNA signatures. Am. J. Obstet. Gynecol. 2023, 229, 553.e1–553.e16. [Google Scholar] [CrossRef] [PubMed]
- Ogoyama, M.; Takahashi, H.; Suzuki, H.; Ohkuchi, A.; Fujiwara, H.; Takizawa, T. Non-Coding RNAs and Prediction of Preeclampsia in the First Trimester of Pregnancy. Cells 2022, 11, 2428. [Google Scholar] [CrossRef] [PubMed]
- Morey, R.; Poling, L.; Srinivasan, S.; Martinez-King, C.; Anyikam, A.; Zhang-Rutledge, K.; To, C.; Hakim, A.; Mochizuki, M.; Verma, K.; et al. Discovery and verification of extracellular microRNA biomarkers for diagnostic and prognostic assessment of preeclampsia at triage. Sci. Adv. 2023, 9, eadg7545. [Google Scholar] [CrossRef] [PubMed]
- MacDonald, T.M.; Walker, S.P.; Hannan, N.J.; Tong, S.; Kaitu’u-Lino, T.J. Clinical tools and biomarkers to predict preeclampsia. EBioMedicine 2022, 75, 103780. [Google Scholar] [CrossRef]
- Jairajpuri, D.S.; Malalla, Z.H.; Mahmood, N.; Almawi, W.Y. Circulating microRNA expression as predictor of preeclampsia and its severity. Gene 2017, 627, 543–548. [Google Scholar] [CrossRef]
- Cai, M.; Kolluru, G.K.; Ahmed, A. Small Molecule, Big Prospects: MicroRNA in Pregnancy and Its Complications. J. Pregnancy 2017, 2017, 6972732. [Google Scholar] [CrossRef]


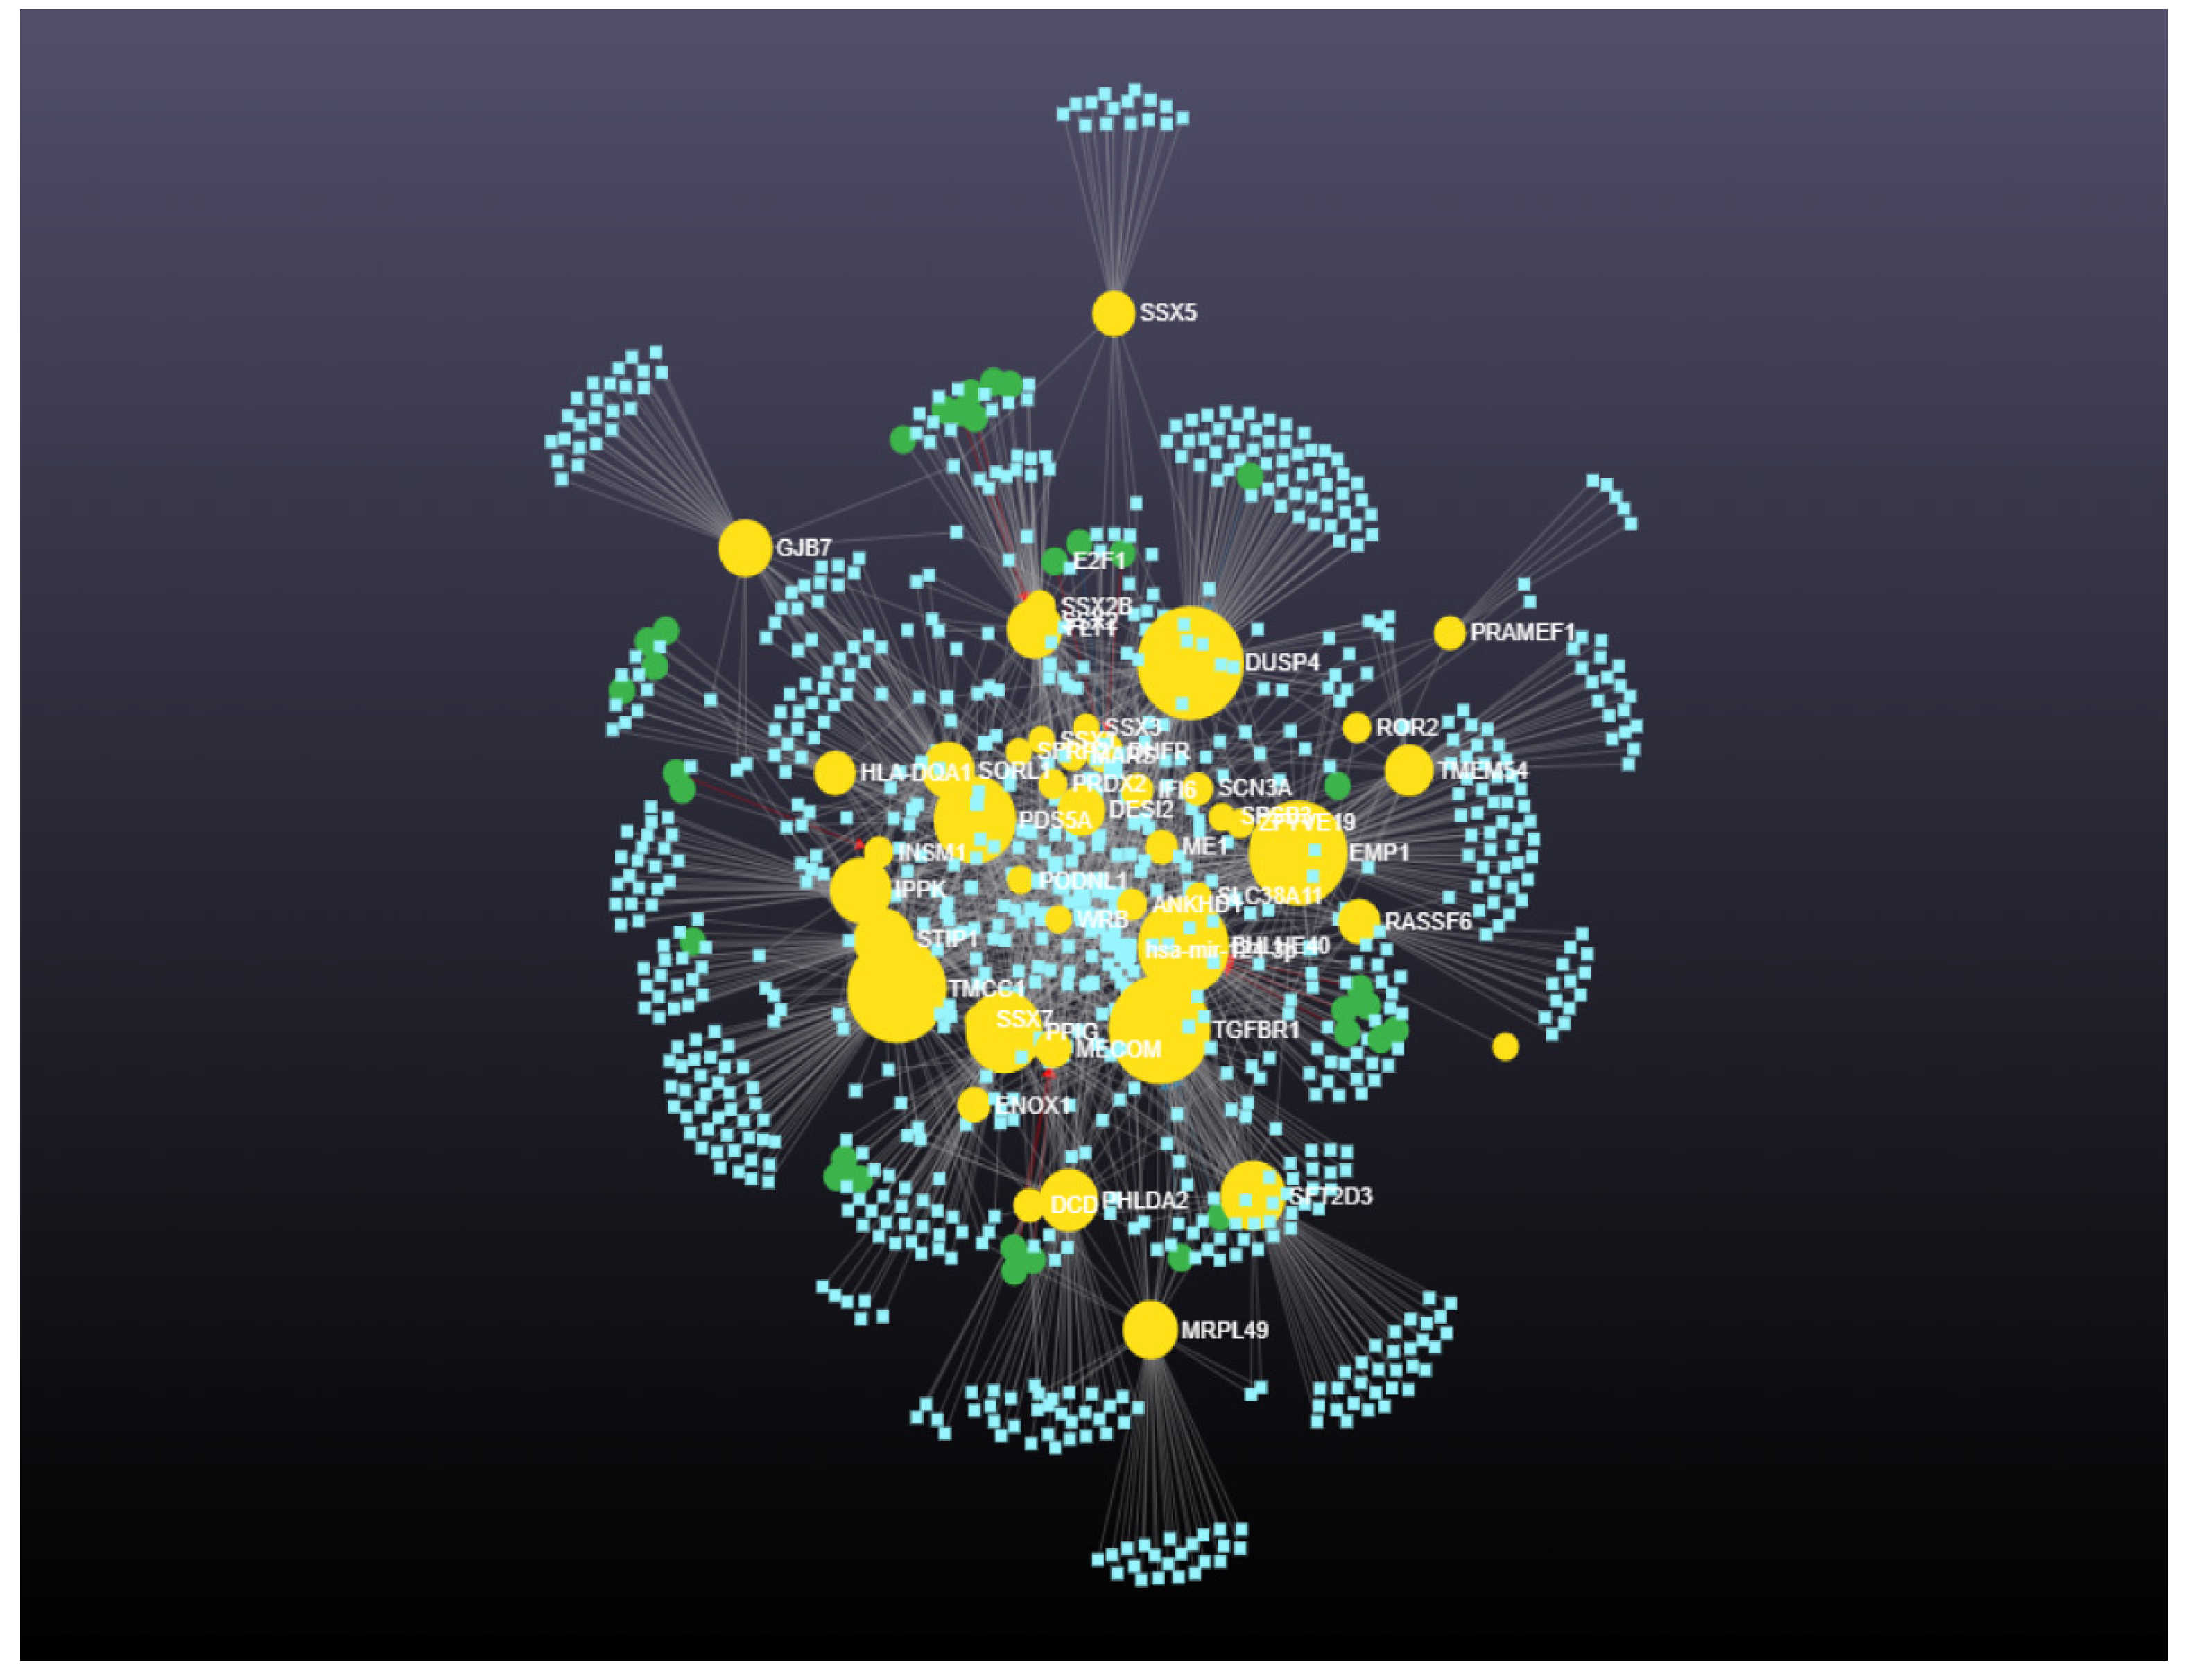
| High Degree Centrality | High Betweenness Centrality | ||||||
|---|---|---|---|---|---|---|---|
| # | ID | Degree | Betweenness | # | ID | Degree | Betweenness |
| 1 | TGFBR1 | 129 | 62,386.63603 | 1 | DUSP4 | 124 | 66,214.0901 |
| 2 | DUSP4 | 124 | 66,214.0901 | 2 | TGFBR1 | 129 | 62,386.63603 |
| 3 | TMCC1 | 122 | 60,207.54204 | 3 | TMCC1 | 122 | 60,207.54204 |
| 4 | EMP1 | 113 | 59,488.02209 | 4 | EMP1 | 113 | 59,488.02209 |
| 5 | BHLHE40 | 111 | 53,832.72771 | 5 | BHLHE40 | 111 | 53,832.72771 |
| 6 | PDS5A | 105 | 46,221.20935 | 6 | PDS5A | 105 | 46,221.20935 |
| 7 | PPIG | 96 | 41,670.73543 | 7 | PPIG | 96 | 41,670.73543 |
| 8 | IPPK | 70 | 28,805.24642 | 8 | SFT2D3 | 61 | 32,179.26096 |
| 9 | STIP1 | 65 | 27,238.03764 | 9 | IPPK | 70 | 28,805.24642 |
| 10 | DESI2 | 62 | 17,175.83835 | 10 | STIP1 | 65 | 27,238.03764 |
| 11 | SFT2D3 | 61 | 32,179.26096 | 11 | PHLDA2 | 52 | 26,712.22297 |
| 12 | SORL1 | 59 | 21,899.50057 | 12 | FLT1 | 57 | 23,913.42422 |
| 13 | FLT1 | 57 | 23,913.42422 | 13 | MRPL49 | 44 | 23,540.21993 |
| 14 | PHLDA2 | 52 | 26,712.22297 | 14 | GJB7 | 40 | 22,523.85633 |
| 15 | MRPL49 | 44 | 23,540.21993 | 15 | SORL1 | 59 | 21,899.50057 |
| 16 | GJB7 | 40 | 22,523.85633 | 16 | TMEM54 | 36 | 18,180.58635 |
| 17 | TMEM54 | 36 | 18,180.58635 | 17 | DESI2 | 62 | 17,175.83835 |
| 18 | DHFR | 34 | 10,104.03447 | 18 | SSX5 | 22 | 13,882.13629 |
| 19 | RASSF6 | 32 | 13,330.8966 | 19 | RASSF6 | 32 | 13,330.8966 |
| 20 | HLA-DQA1 | 28 | 12,741.03278 | 20 | HLA-DQA1 | 28 | 12,741.03278 |
| High Degree Centrality | High Betweenness Centrality | ||||||
|---|---|---|---|---|---|---|---|
| # | ID | Degree | Betweenness | # | ID | Degree | Betweenness |
| 1 | KPNA6 | 223 | 161,133.371 | 1 | KPNA6 | 223 | 161,133.371 |
| 2 | ATP6V0E1 | 152 | 90,977.3419 | 2 | ATP6V0E1 | 152 | 90,977.34186 |
| 3 | KLF6 | 129 | 75,754.0689 | 3 | KLF6 | 129 | 75,754.06887 |
| 4 | SIKE1 | 118 | 60,992.2768 | 4 | PLEKHG2 | 112 | 71,728.72334 |
| 5 | PLEKHG2 | 112 | 71,728.7233 | 5 | ZNF85 | 98 | 67,140.10746 |
| 6 | ZNF85 | 98 | 67,140.1075 | 6 | SIKE1 | 118 | 60,992.27675 |
| 7 | EMC3 | 92 | 53,114.7673 | 7 | EMC3 | 92 | 53,114.76726 |
| 8 | GALNT2 | 83 | 38,016.4527 | 8 | VDAC2 | 69 | 52,426.38509 |
| 9 | TBC1D15 | 83 | 48,514.111 | 9 | TBC1D15 | 83 | 48,514.11101 |
| 10 | ATF2 | 81 | 35,905.8297 | 10 | GALNT2 | 83 | 38,016.45269 |
| 11 | VDAC2 | 69 | 52,426.3851 | 11 | ATF2 | 81 | 35,905.8297 |
| 12 | AMBRA1 | 55 | 27,918.5407 | 12 | IFNG | 41 | 32,732.16167 |
| 13 | RAB40C | 51 | 23,353.295 | 13 | AMBRA1 | 55 | 27,918.54066 |
| 14 | ZNF257 | 51 | 27,233.8438 | 14 | ZNF486 | 49 | 27,772.96946 |
| 15 | ZNF429 | 51 | 24,069.767 | 15 | EXOC2 | 49 | 27,644.24328 |
| 16 | EXOC2 | 49 | 27,644.2433 | 16 | ZNF257 | 51 | 27,233.84385 |
| 17 | ZNF486 | 49 | 27,772.9695 | 17 | GUCY1A2 | 47 | 25,416.96916 |
| 18 | ZNF253 | 47 | 23,149.4803 | 18 | ZNF429 | 51 | 24,069.76705 |
| 19 | GUCY1A2 | 47 | 25,416.9692 | 19 | RAB40C | 51 | 23,353.29504 |
| 20 | POU3F2 | 44 | 22,680.8773 | 20 | ZNF253 | 47 | 23,149.48028 |
| Gene | Tissue Expression | Single-Cell Normalized Expression (nTPM) | Associated Genes | Functions |
|---|---|---|---|---|
| TGFBR1 | Ovary, uterus placenta | Cyto 22.1; Syncytio: 18.4; extravillous: 7.3; Endometrium 21.2 | FKBP1A, TGFB1, TGFB3, TGFBR2, SMAD7 | Regulates cellular process: proliferation, maturation, differentiation, motility, and apoptosis |
| DUSP4 | Ovary, uterus placenta | Cyto 3.0; Syncytio: 24.9; extravillous: 48.8; Endometrium 13.7 | MAPK1, MAPK3, MAPK7, MAPK8, MAPK9 | Regulates cell proliferation and differentiation |
| TMCC1 | Ovary, uterus placenta | Cyto: 10.4; Syncytio: 27.3; extravillous: 0.6; Endometrium 14.2 | PLEC, RSP10, RSP10-NUDT3, RSP12, RSP18A, RSP19 | Regulates endosome fission; endosome membrane tubulation; and membrane fission |
| EMP1 | Ovary, uterus placenta | Cyto: 0.7; Syncytio: 0.7; extravillous: 0.6; Endometrium 161.6 | CCL4, LPAR6, LAPTM4B, PMP22, SMIM3 | Regulates cell proliferation and migration |
| BHLHE40 | Ovary, uterus placenta | Cyto: 31,8; Syncytio: 165.5; extravillous: 94.7; Endometrium 68.0 | BTRC, HDAC1, RXRA, TP53, SMAP2 | Regulates circadian rhythm and cell differentiation |
| PDS5A | Ovary, uterus placenta | Cyto: 32.6; Syncytio: 37.7; extravillous: 39.0; Endometrium 47.3 | RAD21, SMC1A, SMC3, STAG2, WAPAL | Regulates chromatid cohesion during mitosis |
| PPIG | Ovary, uterus placenta | Cyto: 186.3; Syncytio: 241.4; extravillous: 200.9; Endometrium 146.2 | BUD31, PCBP1, PRPF8, PRPF19, SNW1 | Regulates folding, transport, and assembly of proteins, and pre-mRNA splicing |
| IPPK | Ovary, uterus placenta | Cyto: 10.9; Syncytio: 23.7; extravillous: 14.8; Endometrium 4.6 | EPB41L4A, FRMD5, LPAR1, MPKAPK5, VRK1 | Regulates DNA repair, endocytosis, and mRNA export |
| STIP1 | Ovary, uterus placenta | Cyto: 127.7; Syncytio: 210.3; extravillous: 143.4; Endometrium 48.8 | HSP8, HSPA1A, HSP90AA1, HSP90AB1, PTGES3 | Regulates heat shock proteins |
| DESI2 | Ovary, uterus placenta | Cyto: 30.7; Syncytio: 43.8; extravillous: 42.9; Endometrium 39.9 | DDX5, E2F8, NPM1, NUP107, RPA1, UBE21 | Regulates protein deubiquitination |
| SFT2D3 | Ovary, uterus placenta | Cyto: 4.3; Syncytio: 3.0; extravillous: 4.2; Endometrium 8.9 | ADHFE1, ADACC, COG1, PSAT1, TMEM24, TSGA13 | Regulates protein transport and vesicle-mediated transport |
| SORL1 | Ovary, uterus placenta | Cyto: 0.2; Syncytio: 0.4; extravillous: 2444.5; Endometrium 2.9 | APP, APOE, CGA1, LRPAP1, VPS35 | Regulates protein transport |
| FLT1 | Ovary, uterus placenta | Cyto: 182.7; Syncytio: 10,058.3; extravillous: 980.8; Endometrium 1.4 | KDR, PGF, PTPN11, VEGFA, VEGFB | Regulates angiogenesis and vasculogenesis |
| PHLDA2 | Ovary, uterus placenta | Cyto: 4565.5; Syncytio: 365.0; extravillous: 336.1; Endometrium 27.9 | RANBP9, SUCO, SRC | Regulates fetal and placental growth |
| MRPL49 | Ovary, uterus placenta | Cyto: 63.8; Syncytio: 119.5; extravillous: 49.1; Endometrium 11.3 | COX15, TIMM10, METTL18, NXF1, FBXW11 | Regulates protein metabolism and mitochondrial translation |
| GJB7 | Ovary, uterus placenta | Cyto: 10.7; Syncytio: 8.9; extravillous: 4.7; Endometrium 0.7 | ARVCF, FYN, PAG1, PPP2R5E, ULBP2 | Regulates gap junction trafficking and vesicle-mediated transport |
| TMEM54 | Ovary, uterus placenta | Cyto: 48.2; Syncytio: 64.7; extravillous: 169.6; Endometrium 16.9 | CREB3, CDK2, HDAC1, LMNA, PEX19, RARA | Regulates membrane function |
| DHFR | Ovary, uterus placenta | Cyto: 34.5; Syncytio: 12.1; extravillous: 40.1; Endometrium 6.9 | FOX1, HSPD1, MDM2, FKBP1A, TP53, | Regulates folate metabolism and glycine and purine synthesis |
| RASSF6 | Ovary, uterus placenta | Cyto: 54.5; Syncytio: 48.9; extravillous: 24.8; Endometrium 2.0 | AMY1A, DLG1, KDM3A, HECTD1, SAV1, STK4 | Regulates cell cycle arrest and apoptosis |
| HLA-DQA1 | Ovary, uterus placenta | Cyto: 6.9; Syncytio: 4.8; extravillous: 10.7; Endometrium 33.4 | CD74, HLA-DQB1, KCNJ8, ST7, SLC38A9, TMEM214 | Regulates immune function |
| SSX5 | Ovary, uterus placenta | Cyto: 0; Syncytio: 0; extravillous: 0; Endometrium 0 | AGTRAP, PCBD2, NFE2, SSX2, ZSCAN1 | Regulates immune function |
| Gene | Tissue Expression | Single-Cell Normalized Expression (nTPM) | Associated Genes | Functions |
|---|---|---|---|---|
| KPNA6 | Ovary, uterus placenta | Cyto 41.2; Syncytio: 138.3; extravillous: 37.6; Endometrium 39.7 | HDAC1, KPNB1, LMNA, NUP50, RELB | Regulates protein transport |
| ATP6V0E1 | Ovary, uterus placenta | Cyto 511.0; Syncytio: 985.2; extravillous: 643.8; Endometrium 199.9 | ACP2, SLC7A2, CCDC115, PTPRF, TMEM199 | Regulates protein transport and pH of intercellular compartments |
| KLF6 | Ovary, uterus placenta | Cyto: 176.5; Syncytio: 217.0; extravillous: 539.4; Endometrium 616.8 | HDAC3, KLF4, LCOR, RELA, SP1 | Regulates cell growth |
| SIKE1 | Ovary, uterus placenta | Cyto: 30.8; Syncytio: 38.0; extravillous: 36.2; Endometrium 34.4 | PPP2R1A, PPP2CA, STRN4, STK24, STK25, TRAF3IP3 | Plays inhibitory role in virus- and TLR3-triggered IRF3 |
| PLEKHG2 | Ovary, uterus placenta | Cyto: 0.7; Syncytio: 0.6; extravillous: 2.9; Endometrium 18.6 | CDC42, GNB1, GNG2, RAC1, RHOA | Regulates lymphocyte chemotaxis via Rac and Cdc42 activation and actin polymerization |
| ZNF85 | Ovary, uterus placenta | Cyto: 10.5; Syncytio: 6.1; extravillous: 15.4; Endometrium 4.0 | CEP76, TRIM28 | Regulates DNA templated transcription |
| EMC3 | Ovary, uterus placenta | Cyto: 50.9; Syncytio: 91.6; extravillous: 57.7; Endometrium 50.2 | EMC1, EMC2, EMC4, EMC6, MMGT1 | Regulates membrane insertase activity |
| GALNT2 | Ovary, uterus placenta | Cyto: 6.9; Syncytio: 14.1; extravillous: 141.2; Endometrium 13.3 | AP4M1, AP4S1, MMGT1, MRPS5, ZMPSTE24 | Regulates glycosylation of protein |
| TBC1D15 | Ovary, uterus placenta | Cyto: 20.5; Syncytio: 48.2; extravillous: 16.3; Endometrium 39.6 | CCDC121, CEP23, OPTN, TBC1D17, UBXN8 | Regulates GTPase activator activity and mitochondrial morphology |
| ATF2 | Ovary, uterus placenta | Cyto: 13.9; Syncytio: 6.0; extravillous: 13.5; Endometrium 28.1 | FOS, JUN, MAPK8, MAPK9, MAPK14 | Regulates transcription of various genes involved in apoptosis, cell growth, proliferation, inflammation, and DNA damage response |
| VDAC2 | Ovary, uterus placenta | Cyto: 334.2; Syncytio: 399.4; extravillous: 470.9; Endometrium 107.0 | COX4I1, NDUFS4, PHB, PHB2, VDAC2 | Regulates oxidative metabolism, ion transport, cell apoptosis |
| AMBRA1 | Ovary, uterus placenta | Cyto: 3.9; Syncytio: 7.3; extravillous: 2.0; Endometrium 4.8 | BECN1, CUL4A, DDA1, DDB1, TCEB2 | Regulates mitophagy, cell proliferation, cell cycle progression |
| RAB40C | Ovary, uterus placenta | Cyto: 26.0; Syncytio: 51.3; extravillous: 15.8; Endometrium 6.7 | CUX2, CUX2, ENSP00000447000, RAB40B, SARNP | Regulates protein metabolism and autophagy |
| ZNF257 | Ovary, uterus placenta | Cyto: 4.2; Syncytio: 3.0; extravillous: 5.5; Endometrium 1.4 | HIST1H3A, SSRP1, CTCF, GL13, ZNF 513, ZNF710, ZNF768 | Regulates DNA templated transcription, apoptosis, protein folding and assembly, and lipid binding |
| ZNF429 | Ovary, uterus placenta | Cyto: 14.7; Syncytio: 12.7; extravillous: 11.7; Endometrium 10.3 | CTCF, GL13, ZNF 513, ZNF710, ZNF768 | Regulates transcription by RNA polymerase II, apoptosis, protein folding and assembly, and lipid binding |
| EXOC2 | Ovary, uterus placenta | Cyto: 15.3.; Syncytio: 13.9; extravillous: 6.6; Endometrium 6.2 | EXOC3, EXOC4, EXOC5, EXOC6, EXOC7 | Regulates polarized targeting of exocytic vesicles to specific docking sites on the plasma membrane |
| ZNF486 | Ovary, uterus placenta | Cyto: 4.6; Syncytio: 1.8; extravillous: 15.7; Endometrium 6.5 | CTCF, GL13, ZNF 513, ZNF710, ZNF768 | Regulates DNA templated transcription, apoptosis, protein folding and assembly, and lipid binding |
| ZNF253 | Ovary, uterus placenta | Cyto: 5.5; Syncytio: 4.5; extravillous: 3.4; Endometrium 5.2 | AKR1B1, LDOC1, CTCF, ZNF 513, ZNF710 | Regulates DNA templated transcription, apoptosis, protein folding and assembly, and lipid binding |
| GUCY1A2 | Ovary, uterus placenta | Cyto: 0.1; Syncytio: 0.2; extravillous: 0.0; Endometrium 2.0 | GUCY1B3, DLG1, DLG2, DLG3, DLG4 | Regulates conversion of GTP to 3’,5’-cyclic GMP and pyrophosphate |
| POU3F2 | Ovary, uterus placenta | Cyto: 0.0; Syncytio: 0.0; extravillous: 0.1; Endometrium 0.1 | POU4F1, POU4F2, POU4F3, SOX10, TFCP2 | Regulates neuronal differentiation and activation of CRH regulated genes |
| IFNG | Ovary, uterus placenta | Cyto: 0.1; Syncytio: 0.1; extravillous: 0.1; Endometrium 0.9 | FOXP3, IFNGR1, IFNGR2, RUNX1, TRIM2 | Regulates cellular response to viral and microbial infections |
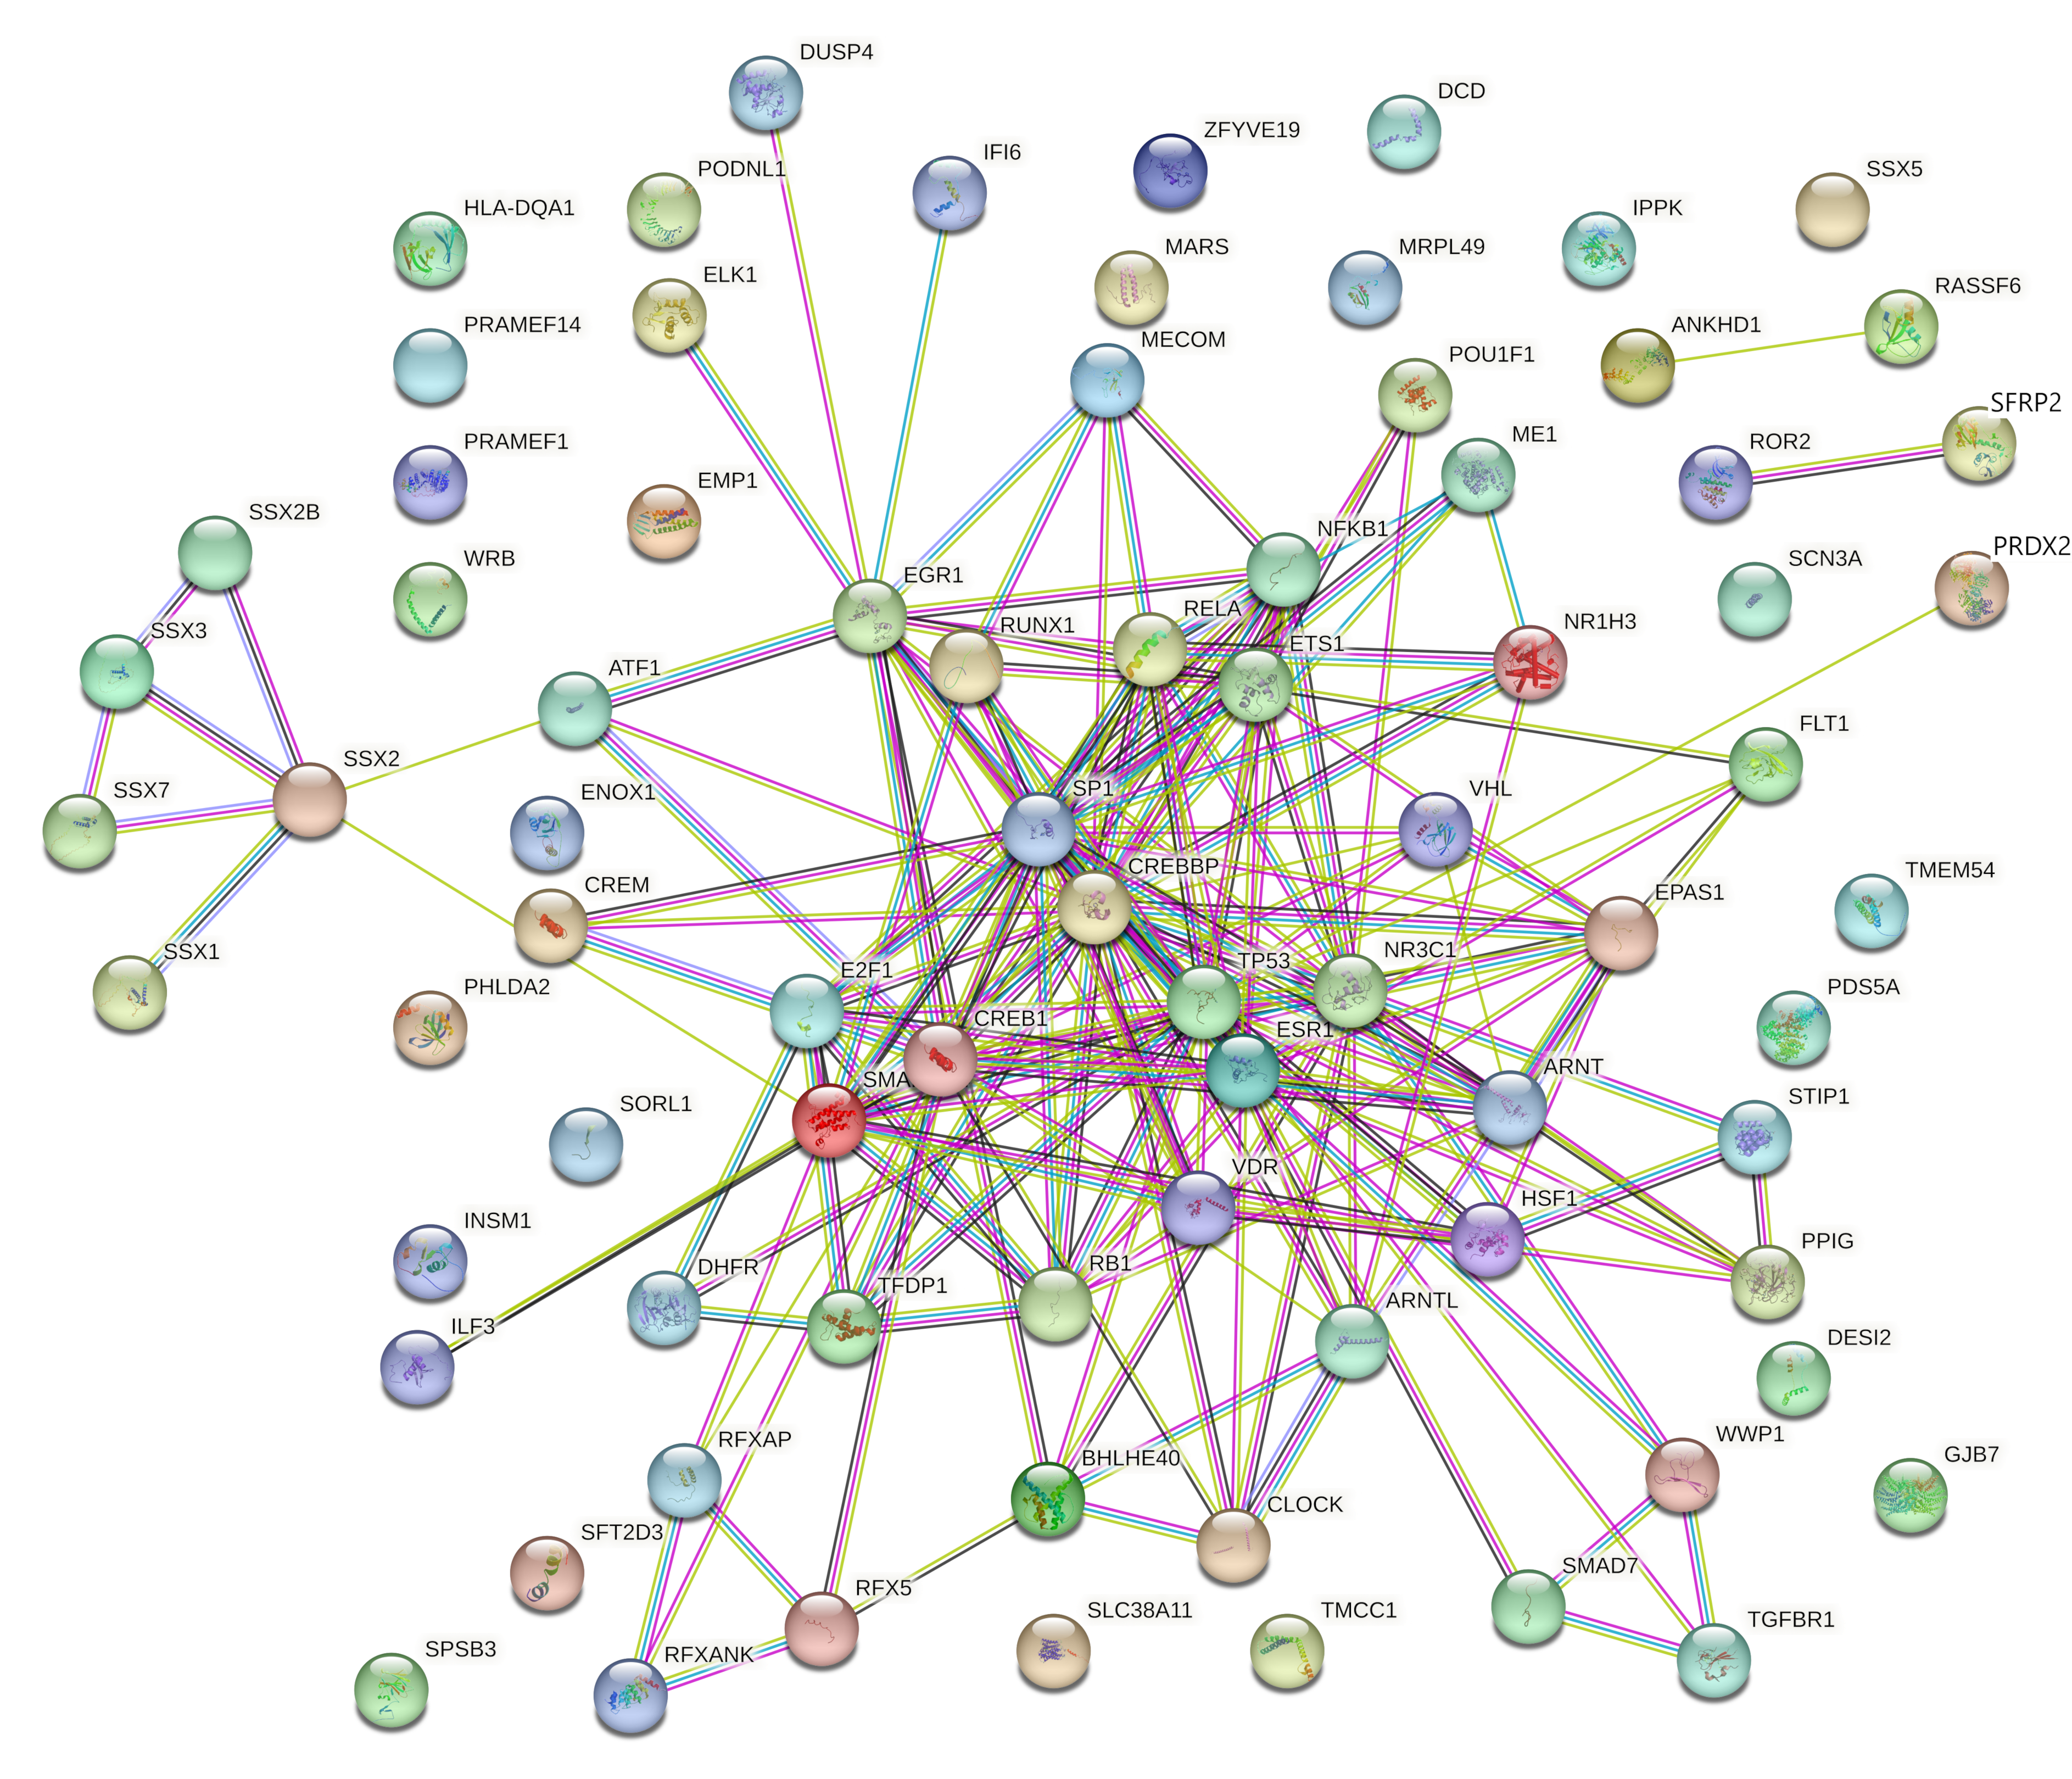
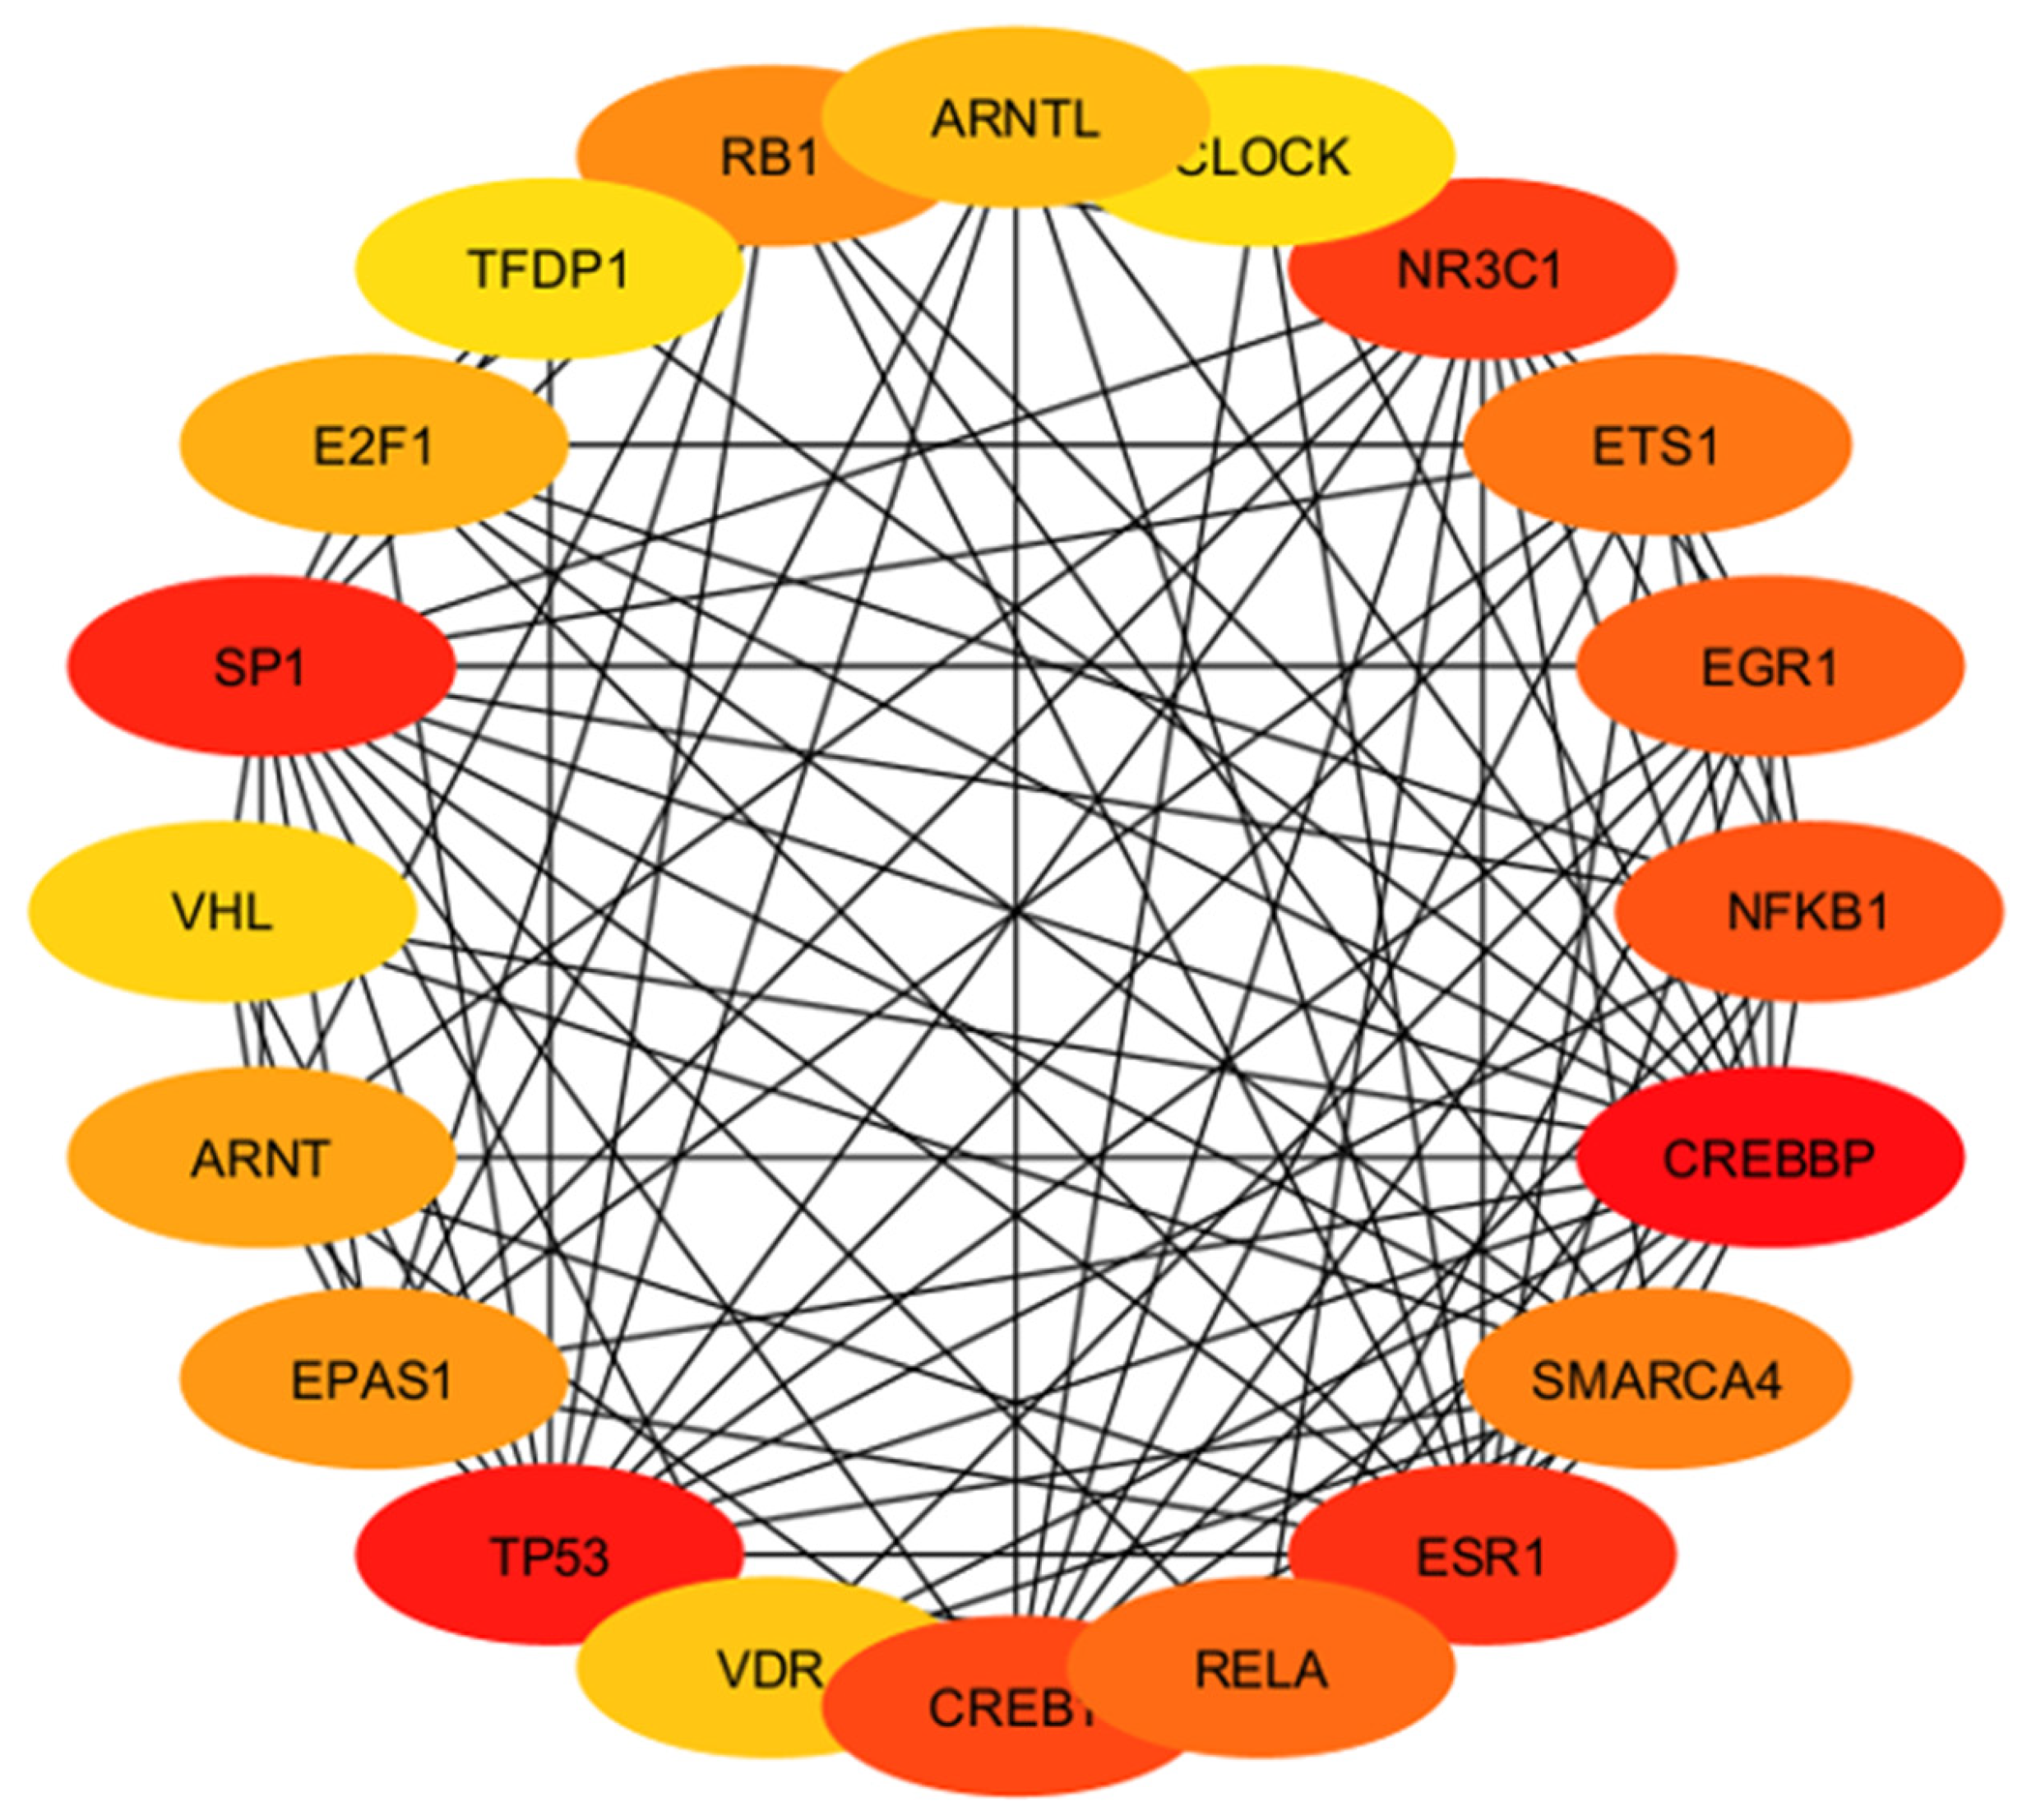
| Hub Gene | Tissue Expression | Single-Cell Normalized Expression (nTPM) | Associated Genes | Functions |
|---|---|---|---|---|
| ARNTL | Ovary, uterus placenta | Cyto 17.0; Syncytio: 6.1; extravillous: 1.3; Endometrium 13.9 | CLOCK, CRY1 CRY2, NPAS2, PER2 | Regulates molecular circadian rhythm, myogenesis, adipogenesis, hormone production, cell proliferation |
| CLOCK | Ovary, uterus placenta | Cyto 11.3; Syncytio: 6.3; extravillous: 7.0; Endometrium 35.2 | ARNTL, CIPC, CRY1 CRY2, PER2 | Regulates molecular circadian rhythm |
| NR3C1 | Ovary, uterus placenta | Cyto: 48.6; Syncytio: 36.6; extravillous: 44.2; Endometrium 28.5 | HSP90AA1, NCOA1, NCOa2, NCOR, SMARCA4 | Regulates hypothalamic–pituitary–adrenal (HPA) axis by modulating availability of the cortisol |
| ETS1 | Ovary, uterus placenta | Cyto: 0.1; Syncytio: 0.3; extravillous: 0.4; Endometrium 49.7 | CREBBP, FOXO1, NFKB2, PAX5, RUNX1 | Regulates immune cell function |
| EGR1 | Ovary, uterus placenta | Cyto: 154.9; Syncytio: 165.7; extravillous: 106.1; Endometrium 783.3 | EP300, JUNDB, JUNDD, NAB1, TP53 | Regulates attachment and survival of normal cells and induces apoptosis in abnormal cells |
| NFKB1 | Ovary, uterus placenta | Cyto: 15.2; Syncytio:13.5; extravillous: 17.3; Endometrium 60.4 | NFKB1A, RELA, CHUK, IFBKB, RELB | Regulate genes |
| CREBBP | Ovary, uterus placenta | Cyto: 17.2; Syncytio: 32.2; extravillous: 11.1; Endometrium 52.1 | CREB1, HIF1A, KMT2A, MYB, TP53 | Regulates cell growth and division and prompting cells to mature and differentiate |
| SMARCA4 | Ovary, uterus placenta | Cyto: 72.5; Syncytio: 70.3; extravillous: 62.4; Endometrium 46.0 | SMARCB1, SMARCC1, SMARCC2, SMARCD1, SMARCE1 | Regulates chromatin remodeling |
| ESR1 | Ovary, uterus placenta | Cyto: 0.1; Syncytio: -; extravillous: -; Endometrium 72.4 | EP300, NCOA1, NCOA2, NR2F1, NR2F2 | Regulates many biological functions including growth, differentiation and function of female reproductive system, hormone binding, immune function |
| RELA | Ovary, uterus placenta | Cyto: 23.0; Syncytio: 47.7; extravillous: 27.7; Endometrium 24.8 | BRD4, CREBBPEP300, NFKB1, NFKB1A | Regulate genes involved in apoptosis, inflammation, the immune response, and proliferation |
| CREB1 | Ovary, uterus placenta | Cyto: 30.1; Syncytio: 18.7; extravillous: 25.9; Endometrium 37.8 | CREBBP, CRTC2, EP300, RPS6KA5, TP53 | Regulates proliferation, migration, and invasion of cells |
| VDR | Ovary, uterus placenta | Cyto: 0.1; Syncytio: 0.2; extravillous: 0.1; Endometrium 0.5 | NCOA1, NCOA2, NCOA3, MED1, RXRA | Induces a surge of cell signaling to maintain healthy Ca2+ levels that serve to regulate several biological functions |
| TP53 | Ovary, uterus placenta | Cyto: 39.7; Syncytio: 20.4; extravillous: 40.6; Endometrium 28.3 | CREBBP, EP300, MDM2, MDM4, RPZ27A | Regulates cell division and apoptosis |
| EPAS1 | Ovary, uterus placenta | Cyto: 118.5; Syncytio: 365.0; extravillous: 336.1; Endometrium 31.3 | ARNT, EGLN1, VHL, TCEB1, TCEB2 | Regulates cell division, angiogenesis, adaptation to changing oxygen level |
| ARNT | Ovary, uterus placenta | Cyto: 24.1; Syncytio: 32.4; extravillous: 40.3; Endometrium 21.8 | AHR, EPAS1, HIF1A, NPAS3, SIM2 | Regulates placentation |
| VHL | Ovary, uterus placenta | Cyto: 35.3; Syncytio: 34.0; extravillous: 35.0; Endometrium 37.8 | EPAS1, CUL2, HIF1A, TCEB1, TCEB2 | Regulates cell growth and division |
| SP1 | Ovary, uterus placenta | Cyto: 16.3; Syncytio: 22.4; extravillous: 17.0; Endometrium 22.3 | EP300, ESR1, HDAC1, HDAC2, TP53 | Regulates cell cycle, hormonal activation, apoptosis, and angiogenesis |
| E2F1 | Ovary, uterus placenta | Cyto: 5.3; Syncytio: 2.1; extravillous: 8.8; Endometrium 1.0 | CCNA2, DP2, RB1, RBL1, TFDP1 | Regulates cell cycle progression, DNA repair, apoptosis |
| TFDP1 | Ovary, uterus placenta | Cyto: 85.2; Syncytio: 60.0; extravillous: 123.9; Endometrium 27.1 | E2F1, E2F4, E2F5, E2F6, RB1 | Regulates cell cycle progression |
| RB1 | Ovary, uterus placenta | Cyto: 6.9; Syncytio: 4.8; extravillous: 10.7; Endometrium 33.4 | CCND1, CDK4, DNMT1, E2F1, TFDP1 | Regulates cell growth and division |
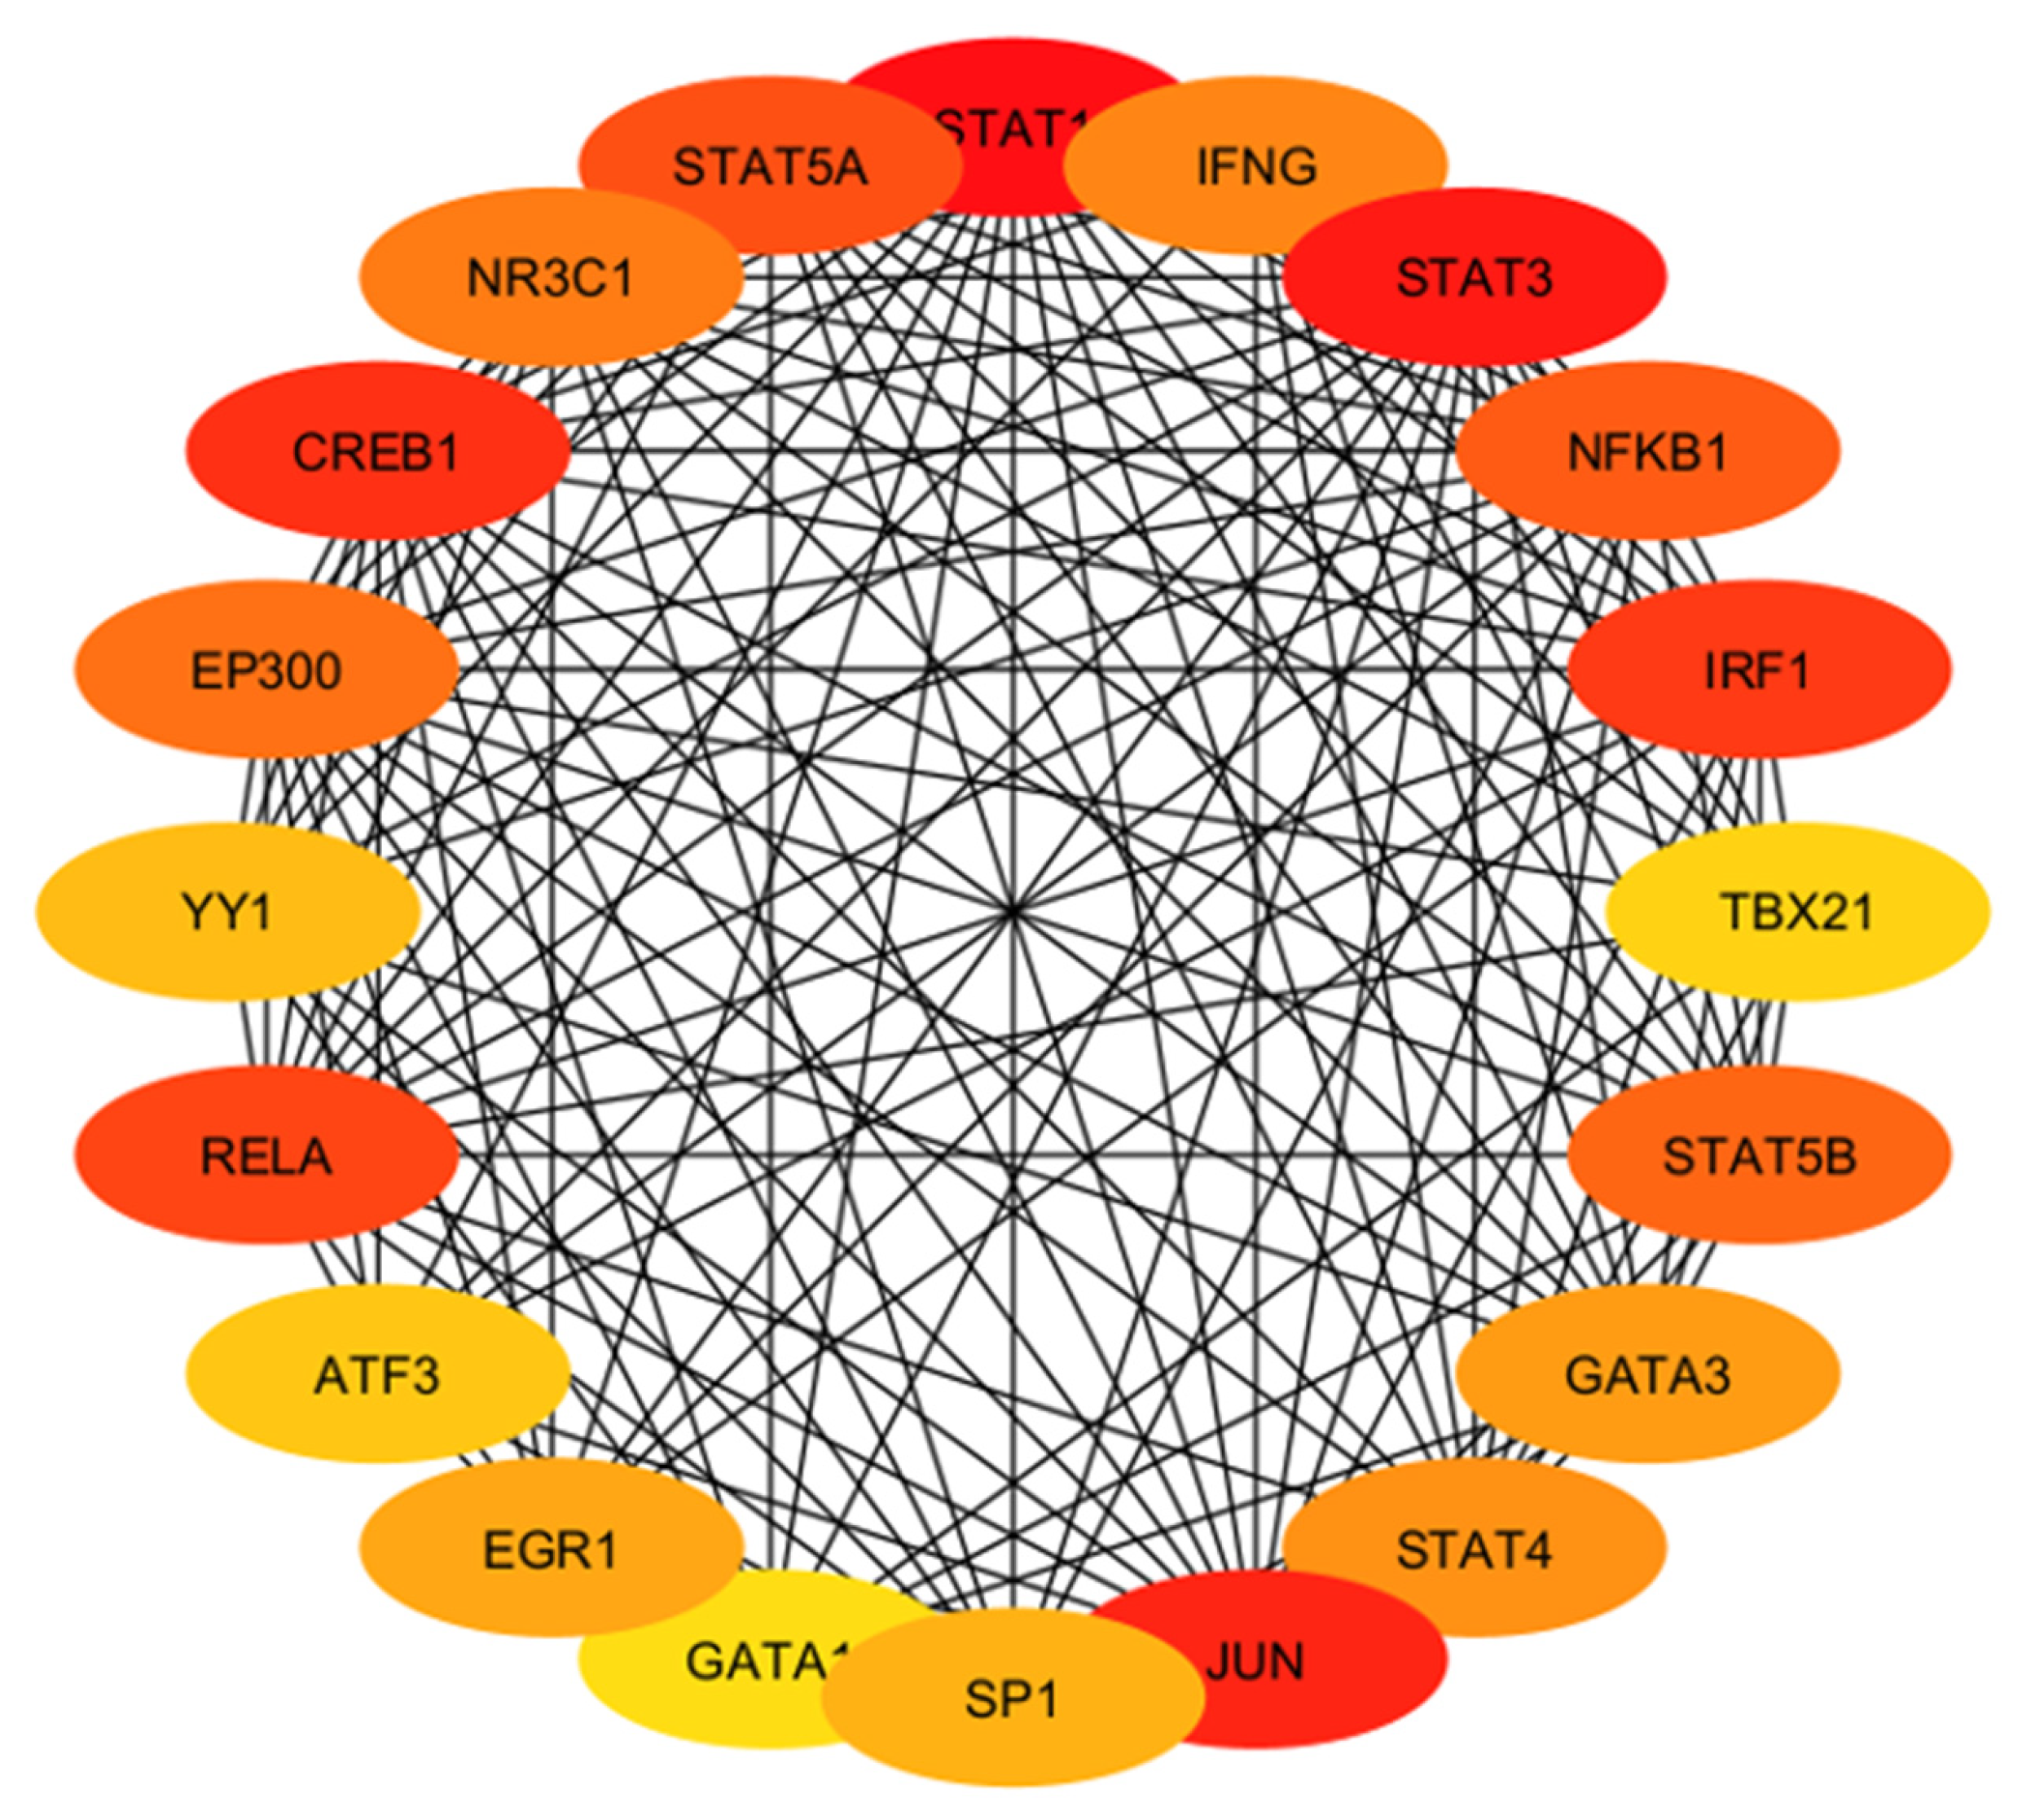
| Hub Gene | Tissue Expression | Single-Cell Normalized Expression (nTPM) | Associated Genes | Functions |
|---|---|---|---|---|
| IFNG | Ovary, uterus placenta | Endometrium 0.9 | IFNGR1, IFNGR2, FOXP3, RUNX1, TRIM28 | Regulates cell differentiation, activation, expansion, homeostasis, and survival |
| STAT3 | Ovary, uterus placenta | Cyto 27.3; Syncytio: 35.9; extravillous: 49.3; Endometrium 194.6 | BMX, EGFR, JK1, MAPK1, PIAS3 | Controls cell proliferation, migration, apoptosis |
| NFKB1 | Ovary, uterus placenta | Cyto: 15.2; Syncytio:13.5; extravillous: 17.3; Endometrium 60.4 | NFKB1A, RELA, CHUK, IFBKB, RELB | Regulate genes |
| IRF1 | Ovary, uterus placenta | Cyto: 25.0; Syncytio: 9.4; extravillous: 46.9; Endometrium 179.7 | IRF8, STUB1, STAT1, EP300, KAT2B | Regulate innate and adaptive immune responses |
| TBX21 | Ovary, uterus placenta | - | CREBBP, EP300, GATA3, SP1, UBC, TBX21 | Regulates development of naive T lymphocytes |
| STAT5B | Ovary, uterus placenta | Cyto: 8.0; Syncytio: 13.8; extravillous: 5.9; Endometrium 20.5 | EGFR, INSR, JAK1, JAK2, JAK3 | Regulates formation of tissues and organs; maintains immune homeostasis |
| GATA3 | Ovary, uterus placenta | Cyto: 329.4; Syncytio: 1237.7; extravillous: 843.6; Endometrium 0.4 | HDAC1, HDAC2, HDAC3, LMO1, TAL1 | Regulates cell maturation with proliferation arrest and cell survival |
| STAT4 | Ovary, uterus placenta | Cyto: 0.4; Syncytio: 0.4; extravillous: 3.4; Endometrium 0.4 | JUN, IL12RB2, PIAS2, STAT1, ZNF467 | Regulates innate and adaptive immune responses |
| JUN | Ovary, uterus placenta | Cyto: 666.6; Syncytio: 405.9; extravillous: 61.9; Endometrium 2873.0 | ATF2, FOS, MAPK8, MAPK9, MAPK10 | Cell proliferation, apoptosis and survival, and tissue morphogenesis |
| SP1 | Ovary, uterus placenta | Cyto: 16.3; Syncytio: 22.4; extravillous: 17.0; Endometrium 22.3 | EP300, ESR1, HDAC1, HDAC2, TP53 | Regulates cell cycle, hormonal activation, apoptosis, and angiogenesis |
| GATA1 | Ovary, uterus placenta | - | BRD3, FLJI1, LMO2, TAL1, ZFPM1 | Regulates development of multipotential progenitors and hematopoietic stem cells |
| EGR1 | Ovary, uterus placenta | Cyto: 154.9; Syncytio: 165.7; extravillous: 106.1; Endometrium 783.3 | EP300, JUNDB, JUNDD, NAB1, TP53 | Regulates attachment and survival of normal cells and induces apoptosis in abnormal cells |
| ATF3 | Ovary, uterus placenta | Cyto: 179.2; Syncytio: 507.9; extravillous: 365.5; Endometrium 321.4 | DDIT3, JUN, JUNB, MDM2, TP53 | Regulates metabolism, immunity, inflammation, cell proliferation, and apoptosis |
| RELA | Ovary, uterus placenta | Cyto: 23.0; Syncytio: 47.7; extravillous: 27.7; Endometrium 24.8 | BRD4, CREBBPEP300, NFKB1, NFKB1A | Regulate genes involved in apoptosis, inflammation, the immune response, and proliferation |
| YY1 | Ovary, uterus placenta | Cyto: 121.3; Syncytio: 177.1; extravillous: 126.4; Endometrium 129.9 | EP300, HDAC2, HDAC3, MBTD1, RUVBL2, | Regulates several biological functions—embryogenesis, differentiation, replication, and cellular proliferation |
| EP300 | Ovary, uterus placenta | Cyto: 17.7; Syncytio: 34.4; extravillous: 19.0; Endometrium 49.1 | CITED2, HIF1A, SMAD3, TCF3, TP53 | Regulates cell growth and division and prompts cell maturation and cells to take specialized functions |
| CREB1 | Ovary, uterus placenta | Cyto: 30.1; Syncytio: 18.7; extravillous: 25.9; Endometrium 37.8 | CREBBP, CRTC2, EP300, RPS6KA5, TP53 | Regulates proliferation, migration, and invasion of cells |
| NR3C1 | Ovary, uterus placenta | Cyto: 48.6; Syncytio: 36.6; extravillous: 44.2; Endometrium 28.5 | HSP90AA1, NCOA1, NCOa2, NCOR, SMARCA4 | Regulates hypothalamic–pituitary–adrenal (HPA) axis by modulating availability of cortisol |
| STAT5A | Ovary, uterus placenta | Cyto: 1.2; Syncytio: 1.3; extravillous: 2.9; Endometrium 5.0 | EGFR, ERBB4, JAK1, JAK2, JAK3 | Relates IL2 signaling, modulates cytokine and growth factor action, modifies chromatin organization |
| STAT1 | Ovary, uterus placenta | Cyto: 13.7; Syncytio: 7.9; extravillous: 60.8; Endometrium 45.2 | CREBBP, JAK2, PIAS1, STAT2, STAT3 | Regulates proinflammation and immune function |
Disclaimer/Publisher’s Note: The statements, opinions and data contained in all publications are solely those of the individual author(s) and contributor(s) and not of MDPI and/or the editor(s). MDPI and/or the editor(s) disclaim responsibility for any injury to people or property resulting from any ideas, methods, instructions or products referred to in the content. |
© 2024 by the authors. Licensee MDPI, Basel, Switzerland. This article is an open access article distributed under the terms and conditions of the Creative Commons Attribution (CC BY) license (https://creativecommons.org/licenses/by/4.0/).
Share and Cite
Kasimanickam, R.; Kasimanickam, V. MicroRNAs in the Pathogenesis of Preeclampsia—A Case-Control In Silico Analysis. Curr. Issues Mol. Biol. 2024, 46, 3438-3459. https://doi.org/10.3390/cimb46040216
Kasimanickam R, Kasimanickam V. MicroRNAs in the Pathogenesis of Preeclampsia—A Case-Control In Silico Analysis. Current Issues in Molecular Biology. 2024; 46(4):3438-3459. https://doi.org/10.3390/cimb46040216
Chicago/Turabian StyleKasimanickam, Ramanathan, and Vanmathy Kasimanickam. 2024. "MicroRNAs in the Pathogenesis of Preeclampsia—A Case-Control In Silico Analysis" Current Issues in Molecular Biology 46, no. 4: 3438-3459. https://doi.org/10.3390/cimb46040216
APA StyleKasimanickam, R., & Kasimanickam, V. (2024). MicroRNAs in the Pathogenesis of Preeclampsia—A Case-Control In Silico Analysis. Current Issues in Molecular Biology, 46(4), 3438-3459. https://doi.org/10.3390/cimb46040216