Article

Generation of Conventional 18F-FDG PET Images from 18F-Florbetaben PET Images Using Generative Adversarial Network: A Preliminary Study Using ADNI Dataset

1
Department of Nuclear Medicine, Ulsan University Hospital, Ulsan 44033, Republic of Korea
2
Department of Nuclear Medicine, Ulsan University Hospital, University of Ulsan College of Medicine, Ulsan 44033, Republic of Korea
3
Department of Neurology, Ulsan University Hospital, University of Ulsan College of Medicine, Ulsan 44033, Republic of Korea
*
Author to whom correspondence should be addressed.
Medicina 2023, 59(7), 1281; https://doi.org/10.3390/medicina59071281
Submission received: 24 May 2023 / Revised: 7 July 2023 / Accepted: 7 July 2023 / Published: 10 July 2023
(This article belongs to the Section Neurology)

Abstract

:
Background and Objectives: 18F-fluorodeoxyglucose (FDG) positron emission tomography (PET) (PETFDG) image can visualize neuronal injury of the brain in Alzheimer’s disease. Early-phase amyloid PET image is reported to be similar to PETFDG image. This study aimed to generate PETFDG images from 18F-florbetaben PET (PETFBB) images using a generative adversarial network (GAN) and compare the generated PETFDG (PETGE-FDG) with real PETFDG (PETRE-FDG) images using the structural similarity index measure (SSIM) and the peak signal-to-noise ratio (PSNR). Materials and Methods: Using the Alzheimer’s Disease Neuroimaging Initiative (ADNI) database, 110 participants with both PETFDG and PETFBB images at baseline were included. The paired PETFDG and PETFBB images included six and four subset images, respectively. Each subset image had a 5 min acquisition time. These subsets were randomly sampled and divided into 249 paired PETFDG and PETFBB subset images for the training datasets and 95 paired subset images for the validation datasets during the deep-learning process. The deep learning model used in this study is composed of a GAN with a U-Net. The differences in the SSIM and PSNR values between the PETGE-FDG and PETRE-FDG images in the cycleGAN and pix2pix models were evaluated using the independent Student’s t-test. Statistical significance was set at p ≤ 0.05. Results: The participant demographics (age, sex, or diagnosis) showed no statistically significant differences between the training (82 participants) and validation (28 participants) groups. The mean SSIM between the PETGE-FDG and PETRE-FDG images was 0.768 ± 0.135 for the cycleGAN model and 0.745 ± 0.143 for the pix2pix model. The mean PSNR was 32.4 ± 9.5 and 30.7 ± 8.0. The PETGE-FDG images of the cycleGAN model showed statistically higher mean SSIM than those of the pix2pix model (p < 0.001). The mean PSNR was also higher in the PETGE-FDG images of the cycleGAN model than those of pix2pix model (p < 0.001). Conclusions: We generated PETFDG images from PETFBB images using deep learning. The cycleGAN model generated PETGE-FDG images with a higher SSIM and PSNR values than the pix2pix model. Image-to-image translation using deep learning may be useful for generating PETFDG images. These may provide additional information for the management of Alzheimer’s disease without extra image acquisition and the consequent increase in radiation exposure, inconvenience, or expenses.

1. Background

Alzheimer’s disease (AD) is the most common form of dementia and is characterized by progressive deterioration of memory and cognitive function. The characteristic neuropathological findings of AD consist of the accumulation of amyloid-β (Aβ) plaques in the extracellular space and the formation of neurofibrillary tangles in the intracellular space [1,2]. Early detection and assessment of abnormal Aβ deposition in the brain are important for proper management and treatment, as abnormal deposition of Aβ begins decades prior to the onset of cognitive decline [3].
Positron emission tomography (PET) imaging using 18F-florbetaben (FBB) (PETFBB) is a valuable tool for detecting Aβ in the brain and plays a vital role in the diagnosis and assessment of treatment response in AD. However, the use of PETFBB alone is inadequate for differentiating AD from other forms of dementia, including Lewy body dementia [4]. Additionally, PETFBB imaging may play a limited role in monitoring disease progression in AD cases with saturated Aβ deposition [5]. On the other hand, 18F-fluorodeoxyglucose (FDG) PET (PETFDG) imaging, which evaluates glucose metabolism, is useful for monitoring disease progression in AD [6] and differentiating AD from other types of dementia owing to the different patterns of glucose metabolism in the brain [7]. Therefore, the simultaneous use of PETFDG and PETFBB images may be synergistic and enhance the accuracy of AD diagnosis and enable a better assessment of disease progression. However, obtaining both PETFBB and PETFDG images in a patient poses significant challenges for practical reasons such as radiation exposure, inconvenience, and higher costs. Early-phase amyloid PET imaging reflects regional blood flow in the brain, and several studies have found that regional blood flow and glucose metabolism in the brain are coupled. Many studies have found similarities in tracer distribution between early-phase amyloid PET images and PETFDG images, suggesting its value as an alternative imaging modality [8,9,10]. However, there are drawbacks, such as patient inconvenience, additional scan time, and limited availability of PET scanners, when compared to conventional amyloid PET imaging.
With the implementation of deep learning in medical imaging, image translation from one modality to another, such as PETFBB images to magnetic resonance imaging (MRI) [11], early-phase 2β-carbomethoxy-3β-(4-iodophenyl)-N-(3-fluoropropyl) nortropane PET (18F-FP-CIT PET) images to PETFDG images [12], has been widely conducted and evaluated in previous studies. Although a recent study reported on image-to-image translation using deep learning between amyloid tracers [13], there are limited studies focusing on generating PETFDG images from PETFBB images. The application of deep learning for generating PETFDG images from PETFBB images may be advantageous because it overcomes the challenges mentioned earlier.
Therefore, the objective of this study was to generate 18F-FDG PET (PETGE-FDG) images from 18F-florbetaben PET (PETFBB) images using a generative adversarial network (GAN) and compare PETGE-FDG with real PETFDG (PETRE-FDG) images using the structural similarity index measure (SSIM) and peak signal-to-noise ratio (PSNR).

2. Materials and Methods

2.1. Datasets

This study used the baseline PETFBB image and PETFDG image datasets downloaded from the Alzheimer’s Disease Neuroimaging Initiative (ADNI) database (adni.loni.usc.edu, accessed on 3 June 2022) [14]. The inclusion criterion for this study was the availability of both PETFBB and PETFDG images at baseline. Consequently, a total of 110 participants were included from the ADNI database (adni.loni.usc.edu, accessed 3 June 2022). The ADNI was launched in 2003 as a public–private partnership led by the principal investigator, Michael W. Weiner, MD, VA Medical Center and University of California, San Francisco. The primary objective of the ADNI was to test whether serial MRI, PET, and other biological markers can be combined with clinical and neuropsychological assessments to measure the progression of mild cognitive impairment and early AD. For the most up-to-date information, visit http://www.adni-info.org (accessed on 3 June 2022).
The baseline PETFDG image acquisition was performed 30–60 min after injection of approximately 185 MBq of FDG, and image acquisition time was 30 min. On the other hand, the baseline PETFBB image acquisition was performed 90–110 min after injection of approximately 300 MBq of FBB and image acquisition time was 20 min. The PETFBB and PETFDG images consisted of four and six subsets, respectively. Each subset was acquired every 5 min during the image acquisition process. All subsets of paired PETFBB and PETFDG images were randomly sampled and divided into 249 and 95 subsets for training and validation, respectively. The Institutional Ethics Committee of the Ulsan University Hospital reviewed this observational study and waived the requirement for informed consent (IRB file number: UUH2022-05-028).

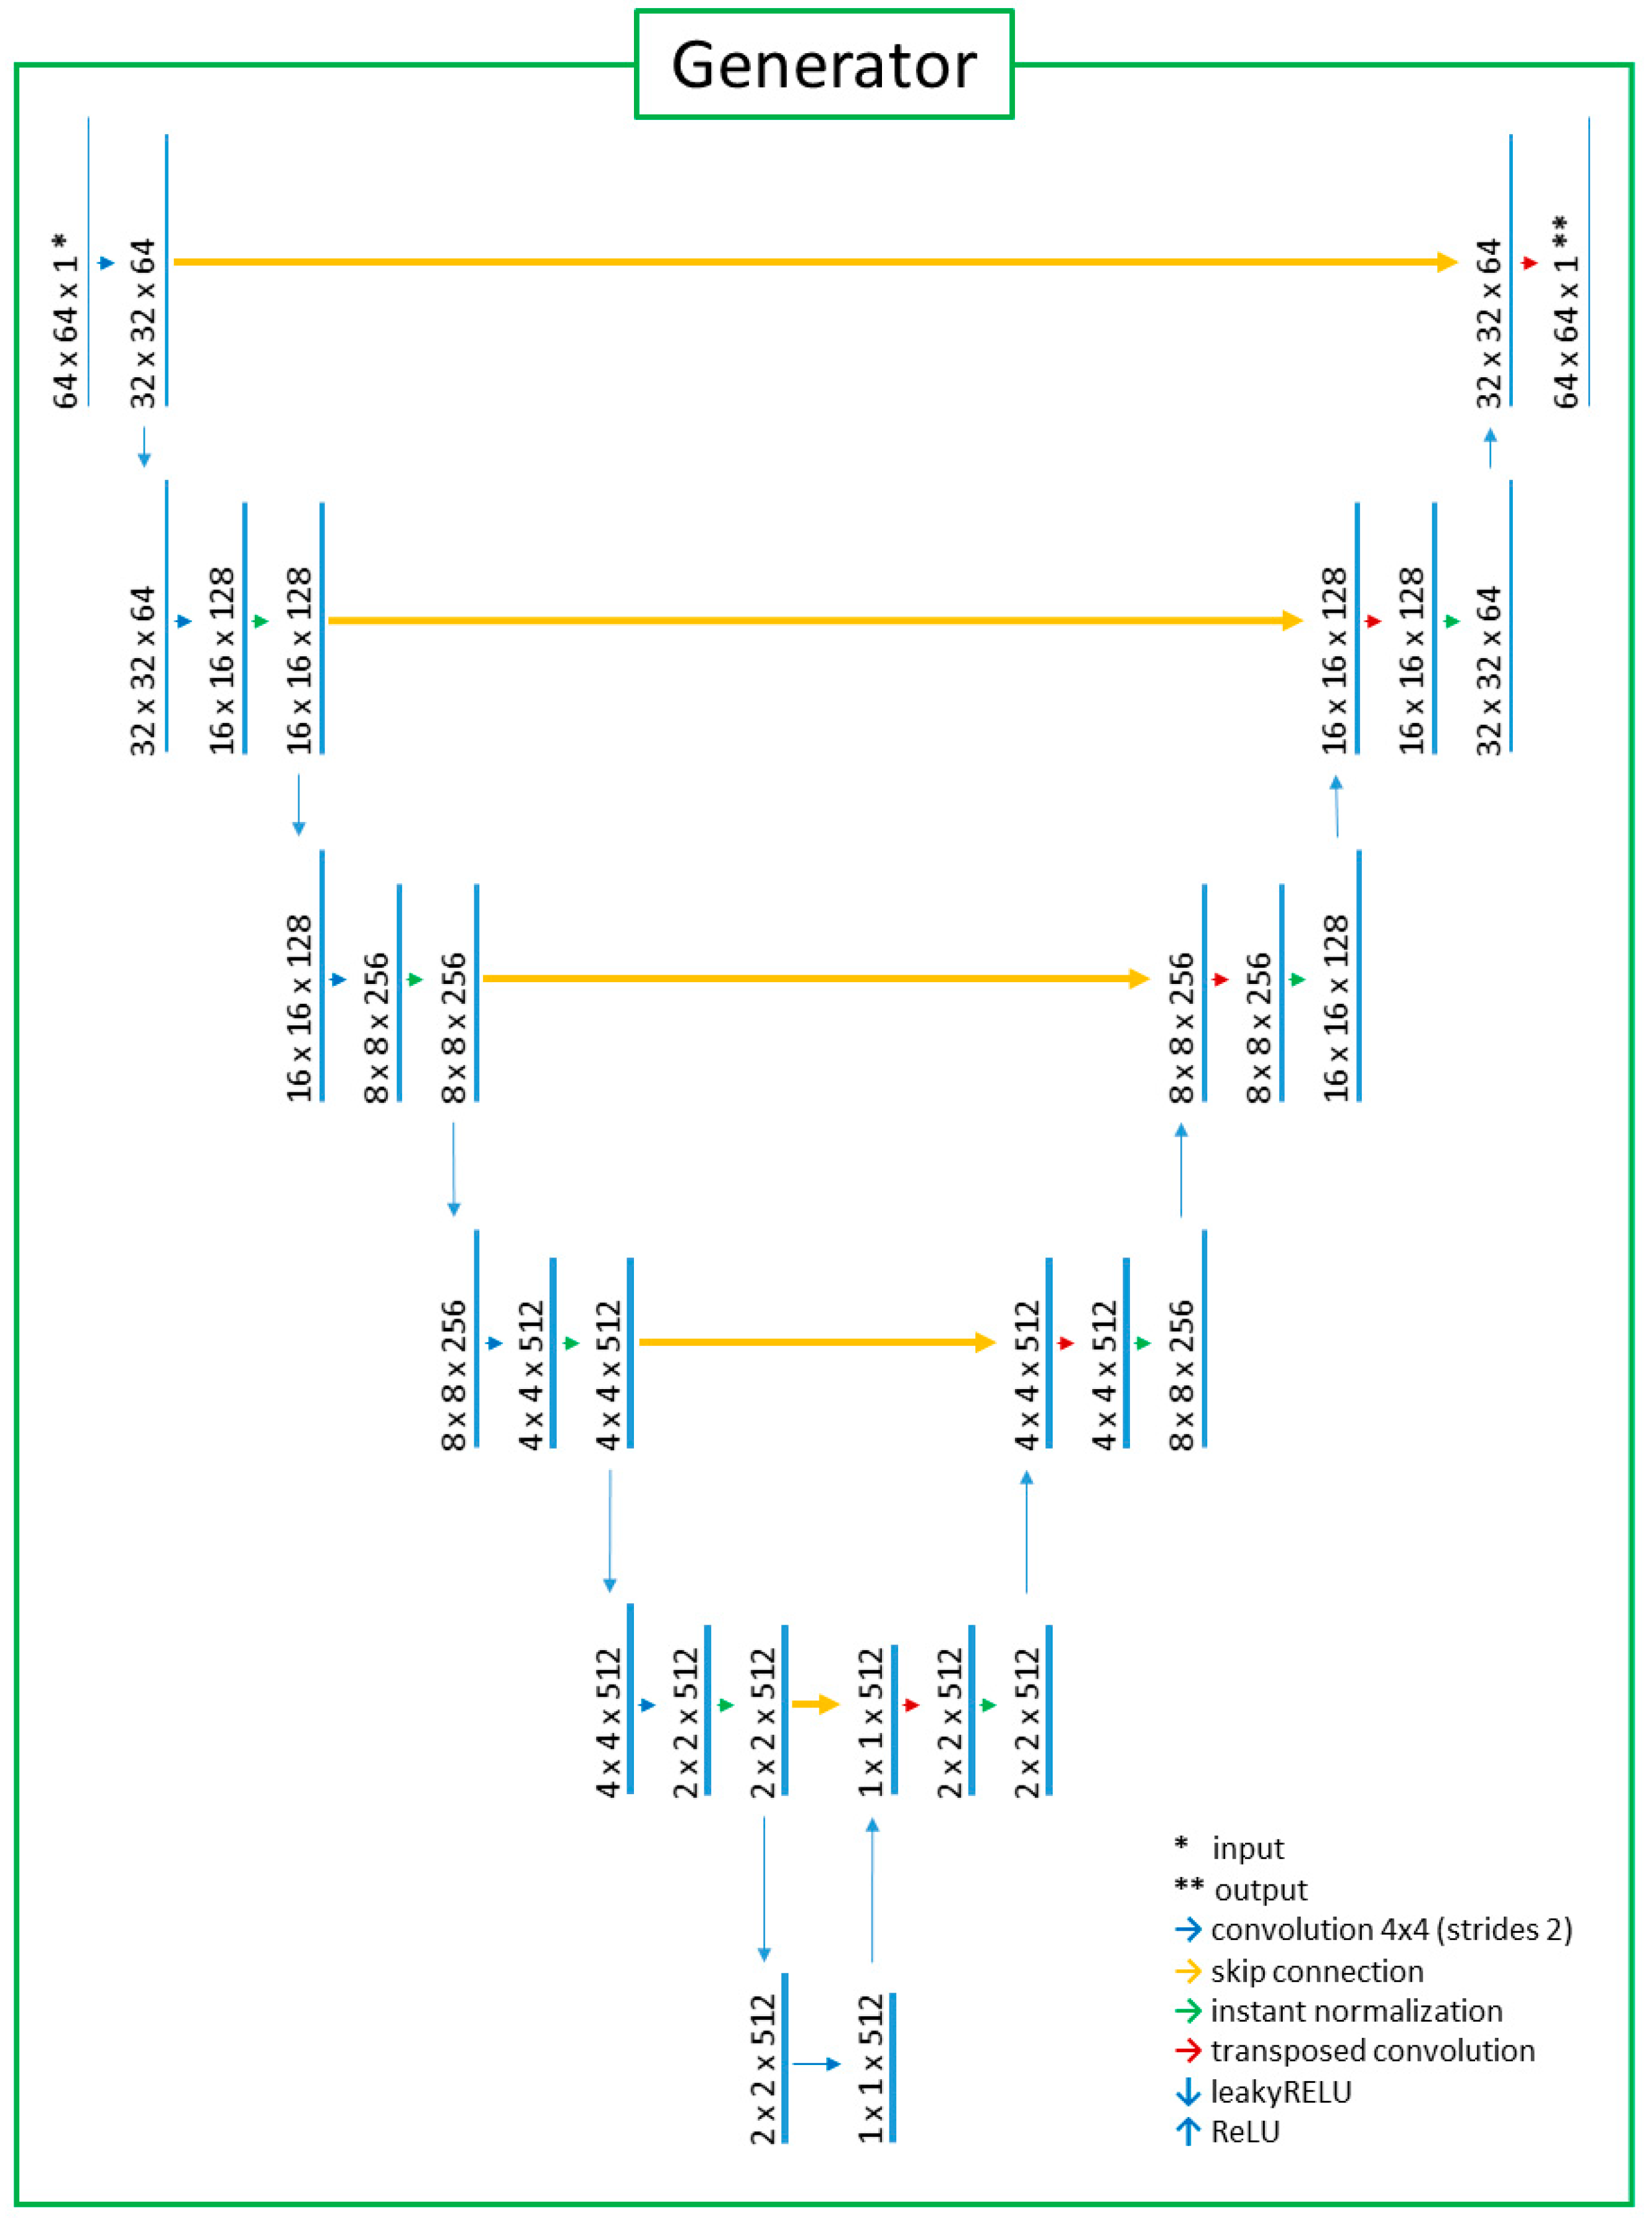
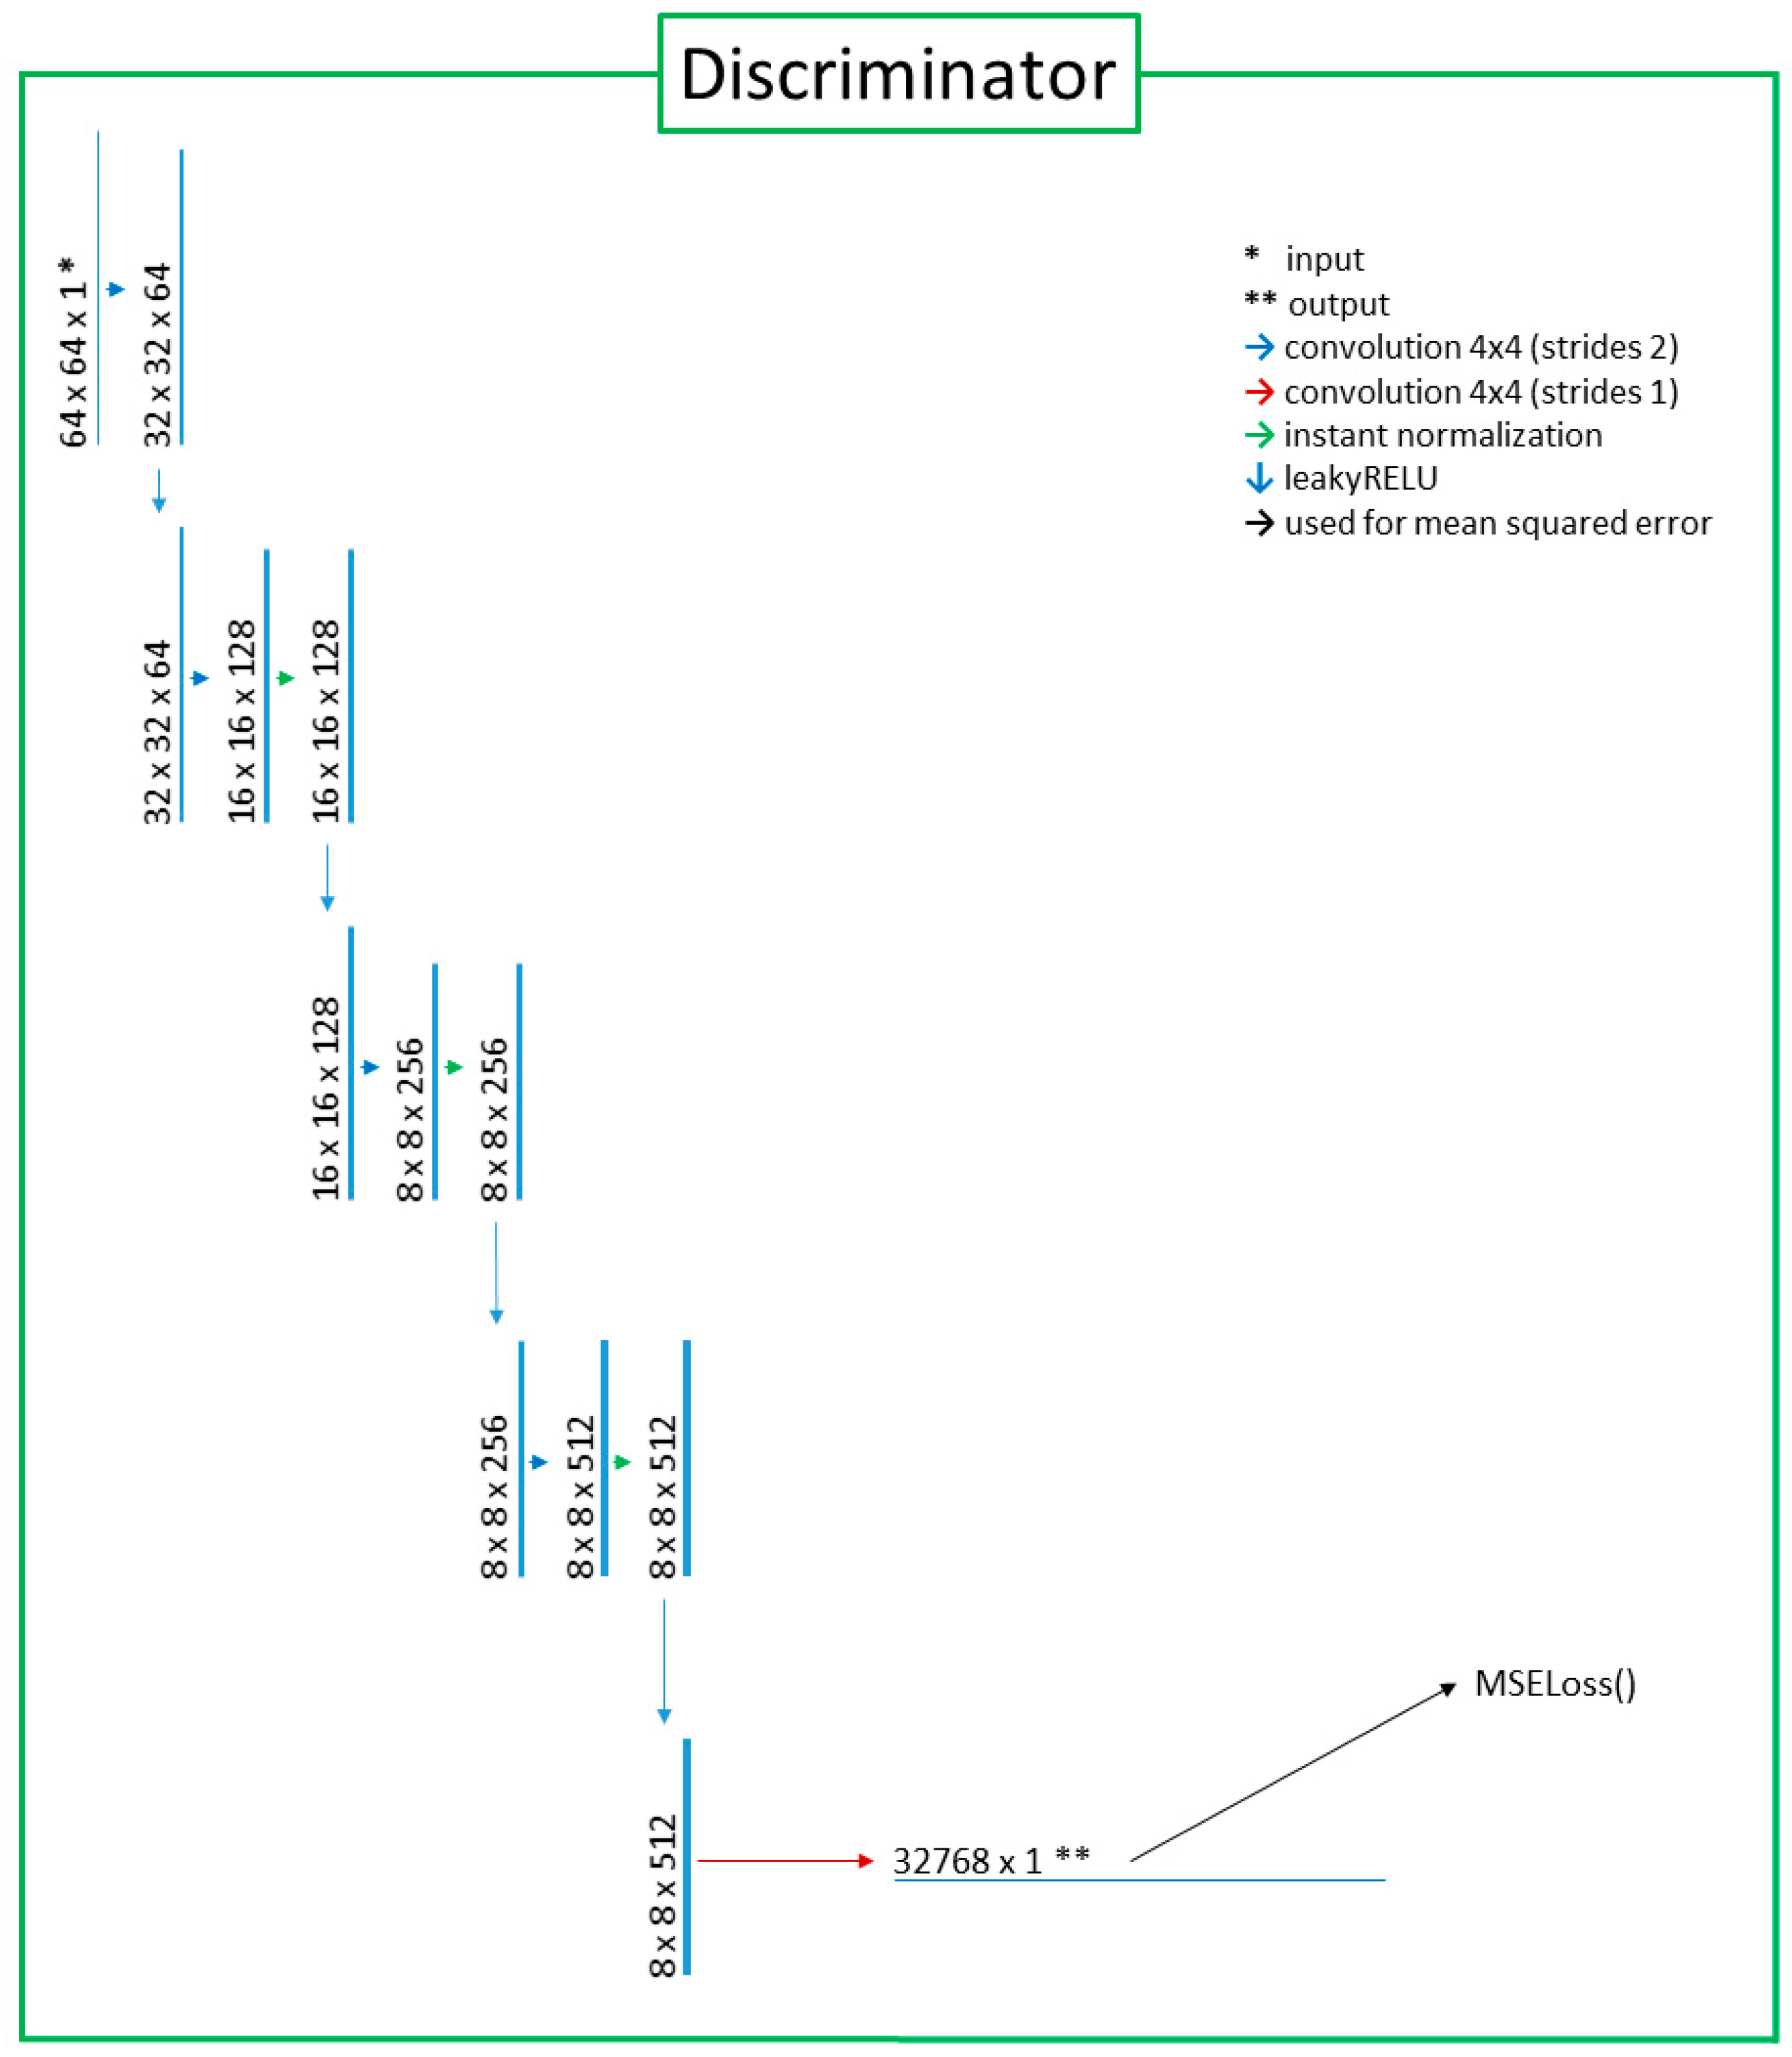
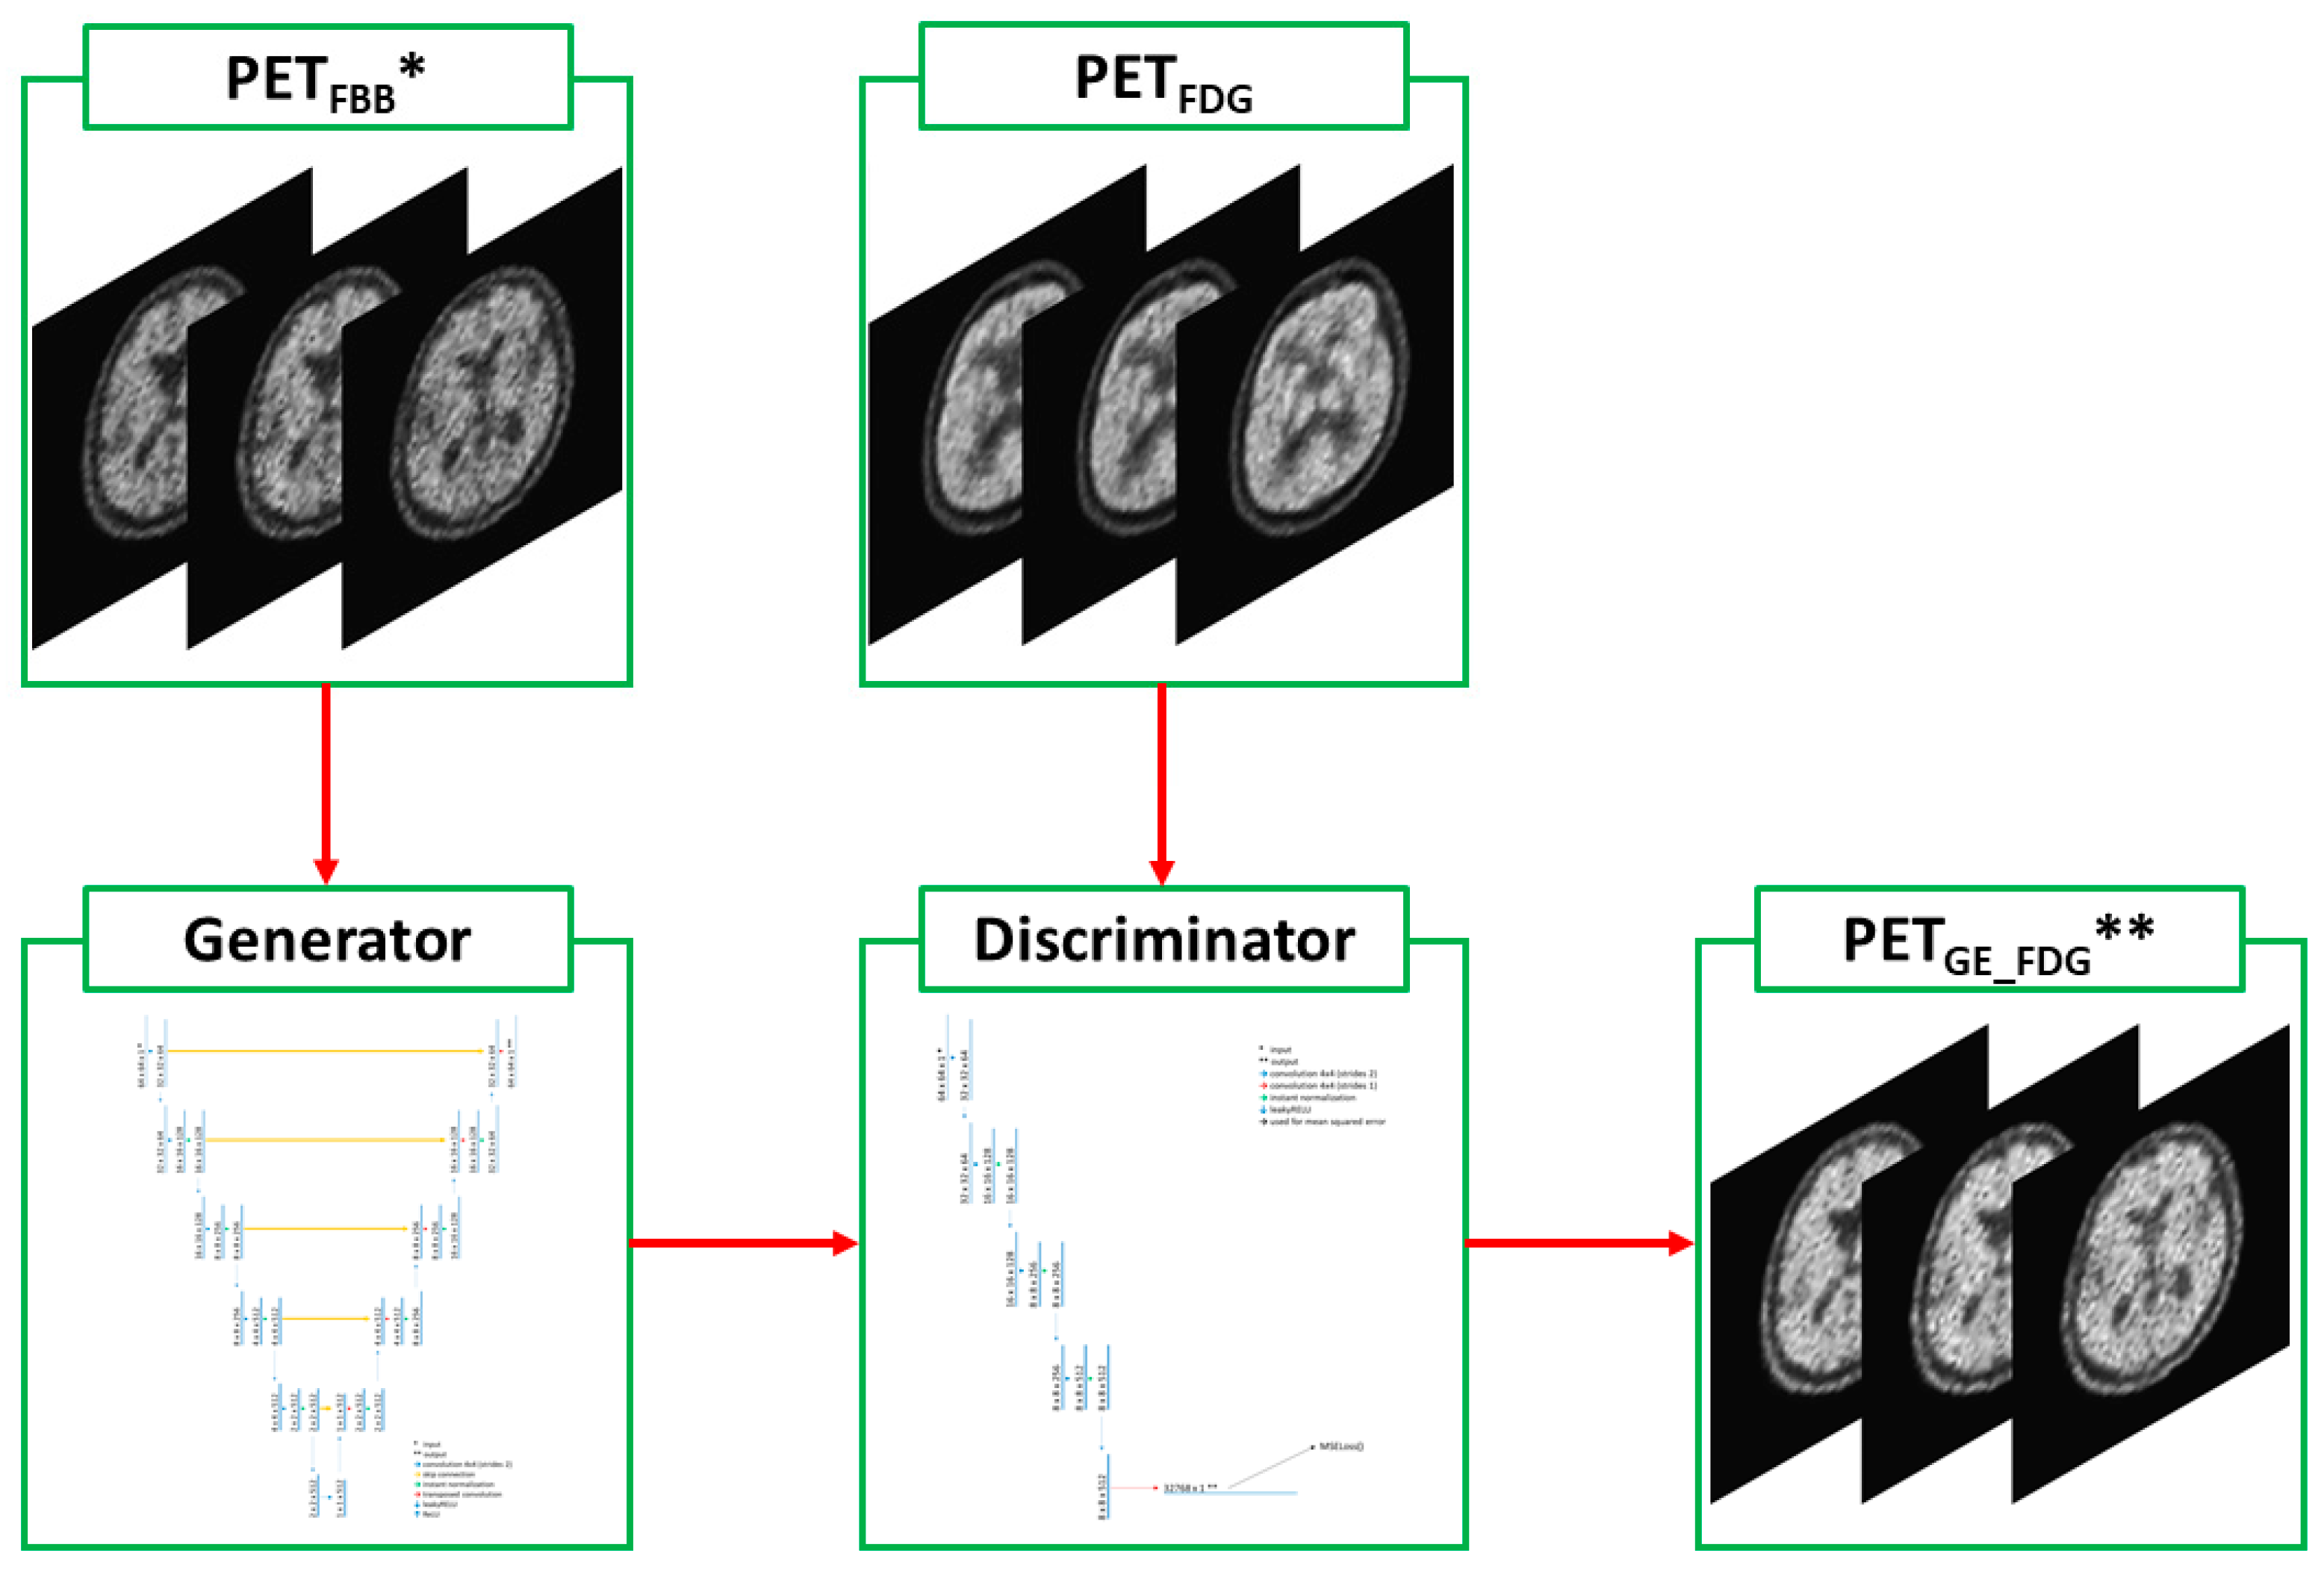
2.2. Deep-Learning Model with Image Preprocessing

Because all the PET images had different matrix sizes and our computer resources were limited, all images were resampled with a matrix size of 64 (height) × 64 (width) × 1 (color channel). A total of 15,936 two-dimensional (2D) images were prepared for training, and 6080 were used for validation. A “Bit Stored” attribute in the Digital Imaging and Communications in Medicine (DICOM) header of each PET image was used to determine the divisor for data rescaling, which converted unsigned integer pixel values to floating point values (range: 0.0–1.0).
This study adopted unsupervised image-to-image translation models using GAN and U-Net architecture that were based on “CycleGAN and pix2pix in PyTorch” (https://github.com/junyanz/pytorch-CycleGAN-and-pix2pix, accessed on 10 March 2023) [15,16,17]. The GAN developed for the purpose of translating unpaired images consisted of a generator and a discriminator. The generator was responsible for generating output images based on input images. In the generator, the key network used for extracting features from the input images and delineating the output images was U-Net. The max-pooling process used in the original U-Net was omitted to improve training efficiency. Additionally, leaky RELU was used for a downward activation function instead of RELU, which was the activation function in the original U-NET. As for the discriminator, only the left half of the U-NET architecture was used because the right half was the part of the image generation that was not necessary for discrimination. In other words, the discriminator was operated by using the extracted features of the images and the mean squared error for a loss function that calculated differences between the generated and ground truth target images. The architectural designs of the generator and the discriminator are illustrated in Figure 1 and Figure 2. The architecture of the cycleGAN model is shown in Figure 3. The model architecture is expressed as follows.
G_A(A) → B
G_B(B) → A
D_A(G_A(A)) → B
D_B(G_B(B)) → A
Loss(A, B) = D_A(G_A(A)) + D_B(G_B(B)) + |G_B(G_A(A)) − A| + |G_A(G_B(B)) − B| + |G_A(B) − B| + |G_B(A) − A|
A and B represent PETFBB and PETFDG images, respectively. The right-hand variables of the arrows indicate the ground-truth target images. G_A (1) and G_B (2) are the same generators; however, G_A (1) is a forward generator that creates B from A, and G_B (2) is a backward generator that creates A from B. D_A (3) and D_B (4) are the same discriminators that determine the differences between the real and forward-/backward-generated images. Loss (A, B) (5) represents a loss function that addresses the differences between the generated and ground-truth target images. The cycleGAN and pix2pix models were then trained to minimize loss (A, B). The cycleGAN model uses all paired generators (1,2) and discriminators (3,4) mentioned above (Figure 3). In contrast, the pix2pix model consists of only a forward generator (1) and a discriminator (3) that was drawn in Figure 4. Minor modifications were made to the original Python code to allow it to run on Python 3.10, PyTorch 2.0.0, CUDA 11.7, and Windows 10.

2.3. Statistical Analysis

Participant demographics between the training and validation datasets were compared using the independent Student’s t-test and Mann–Whitney U test for continuous and categorical variables, respectively. The similarity between the PETGE-FDG and PETRE-FDG images was determined using SSIM [18]. The formula for the SSIM is as follows:
SSIM ( x ,   y ) = ( 2 μ x μ y + C 1 ) ( 2 σ x y + C 2 ) ( μ x 2 + μ y 2 + C 1 ) ( σ x 2 + σ y 2 + C 2 )
where x and y are PETRE-FDG and PETGE-FDG images, respectively, to be compared, and μ and σ are the mean and standard deviation of these images. The pixel value ranges of these images were used to calculate constant variables C1 and C2, which were used to stabilize the division with a weak denominator. When a greater similarity exists between the x and y images, the SSIM value approaches 1. A greater anticorrelation between these images resulted in an SSIM value closer to −1. The SSIM value was close to zero when no similarity was observed between the images. The PSNR between the images was also measured. The PSNR is computed using the following formula:
Mean   squared   error   ( MSE ) = 1 m n i = 0 m 1 j = 0 n 1 I i , j K i , j 2
PSNR (dB) = 20log10(MAXI) − 10log10 (MSE)
where ‘m’ and ‘n’ represent the width and height of an image, respectively, and ‘K’ represents the noisy approximation of the image. The term ‘MAXI’ refers to the maximum possible pixel value of the image. A higher PSNR value indicated that the images were more similar.
An independent Student’s t-test was performed to compare the SSIM values of the image datasets using the cycleGAN and pix2pix models. Statistical significance was set as p ≤ 0.05.

3. Results

3.1. Baseline Demographics

Of the 110 participants, 82 (75%) were in the training group and 28 (25%) were in the validation group. There were no significant differences in age, sex, or diagnosis between the training and validation groups (p-values for age, sex, and diagnosis were 0.68, 0.72, and 0.55, respectively). Table 1 presents the detailed demographics of the participants.

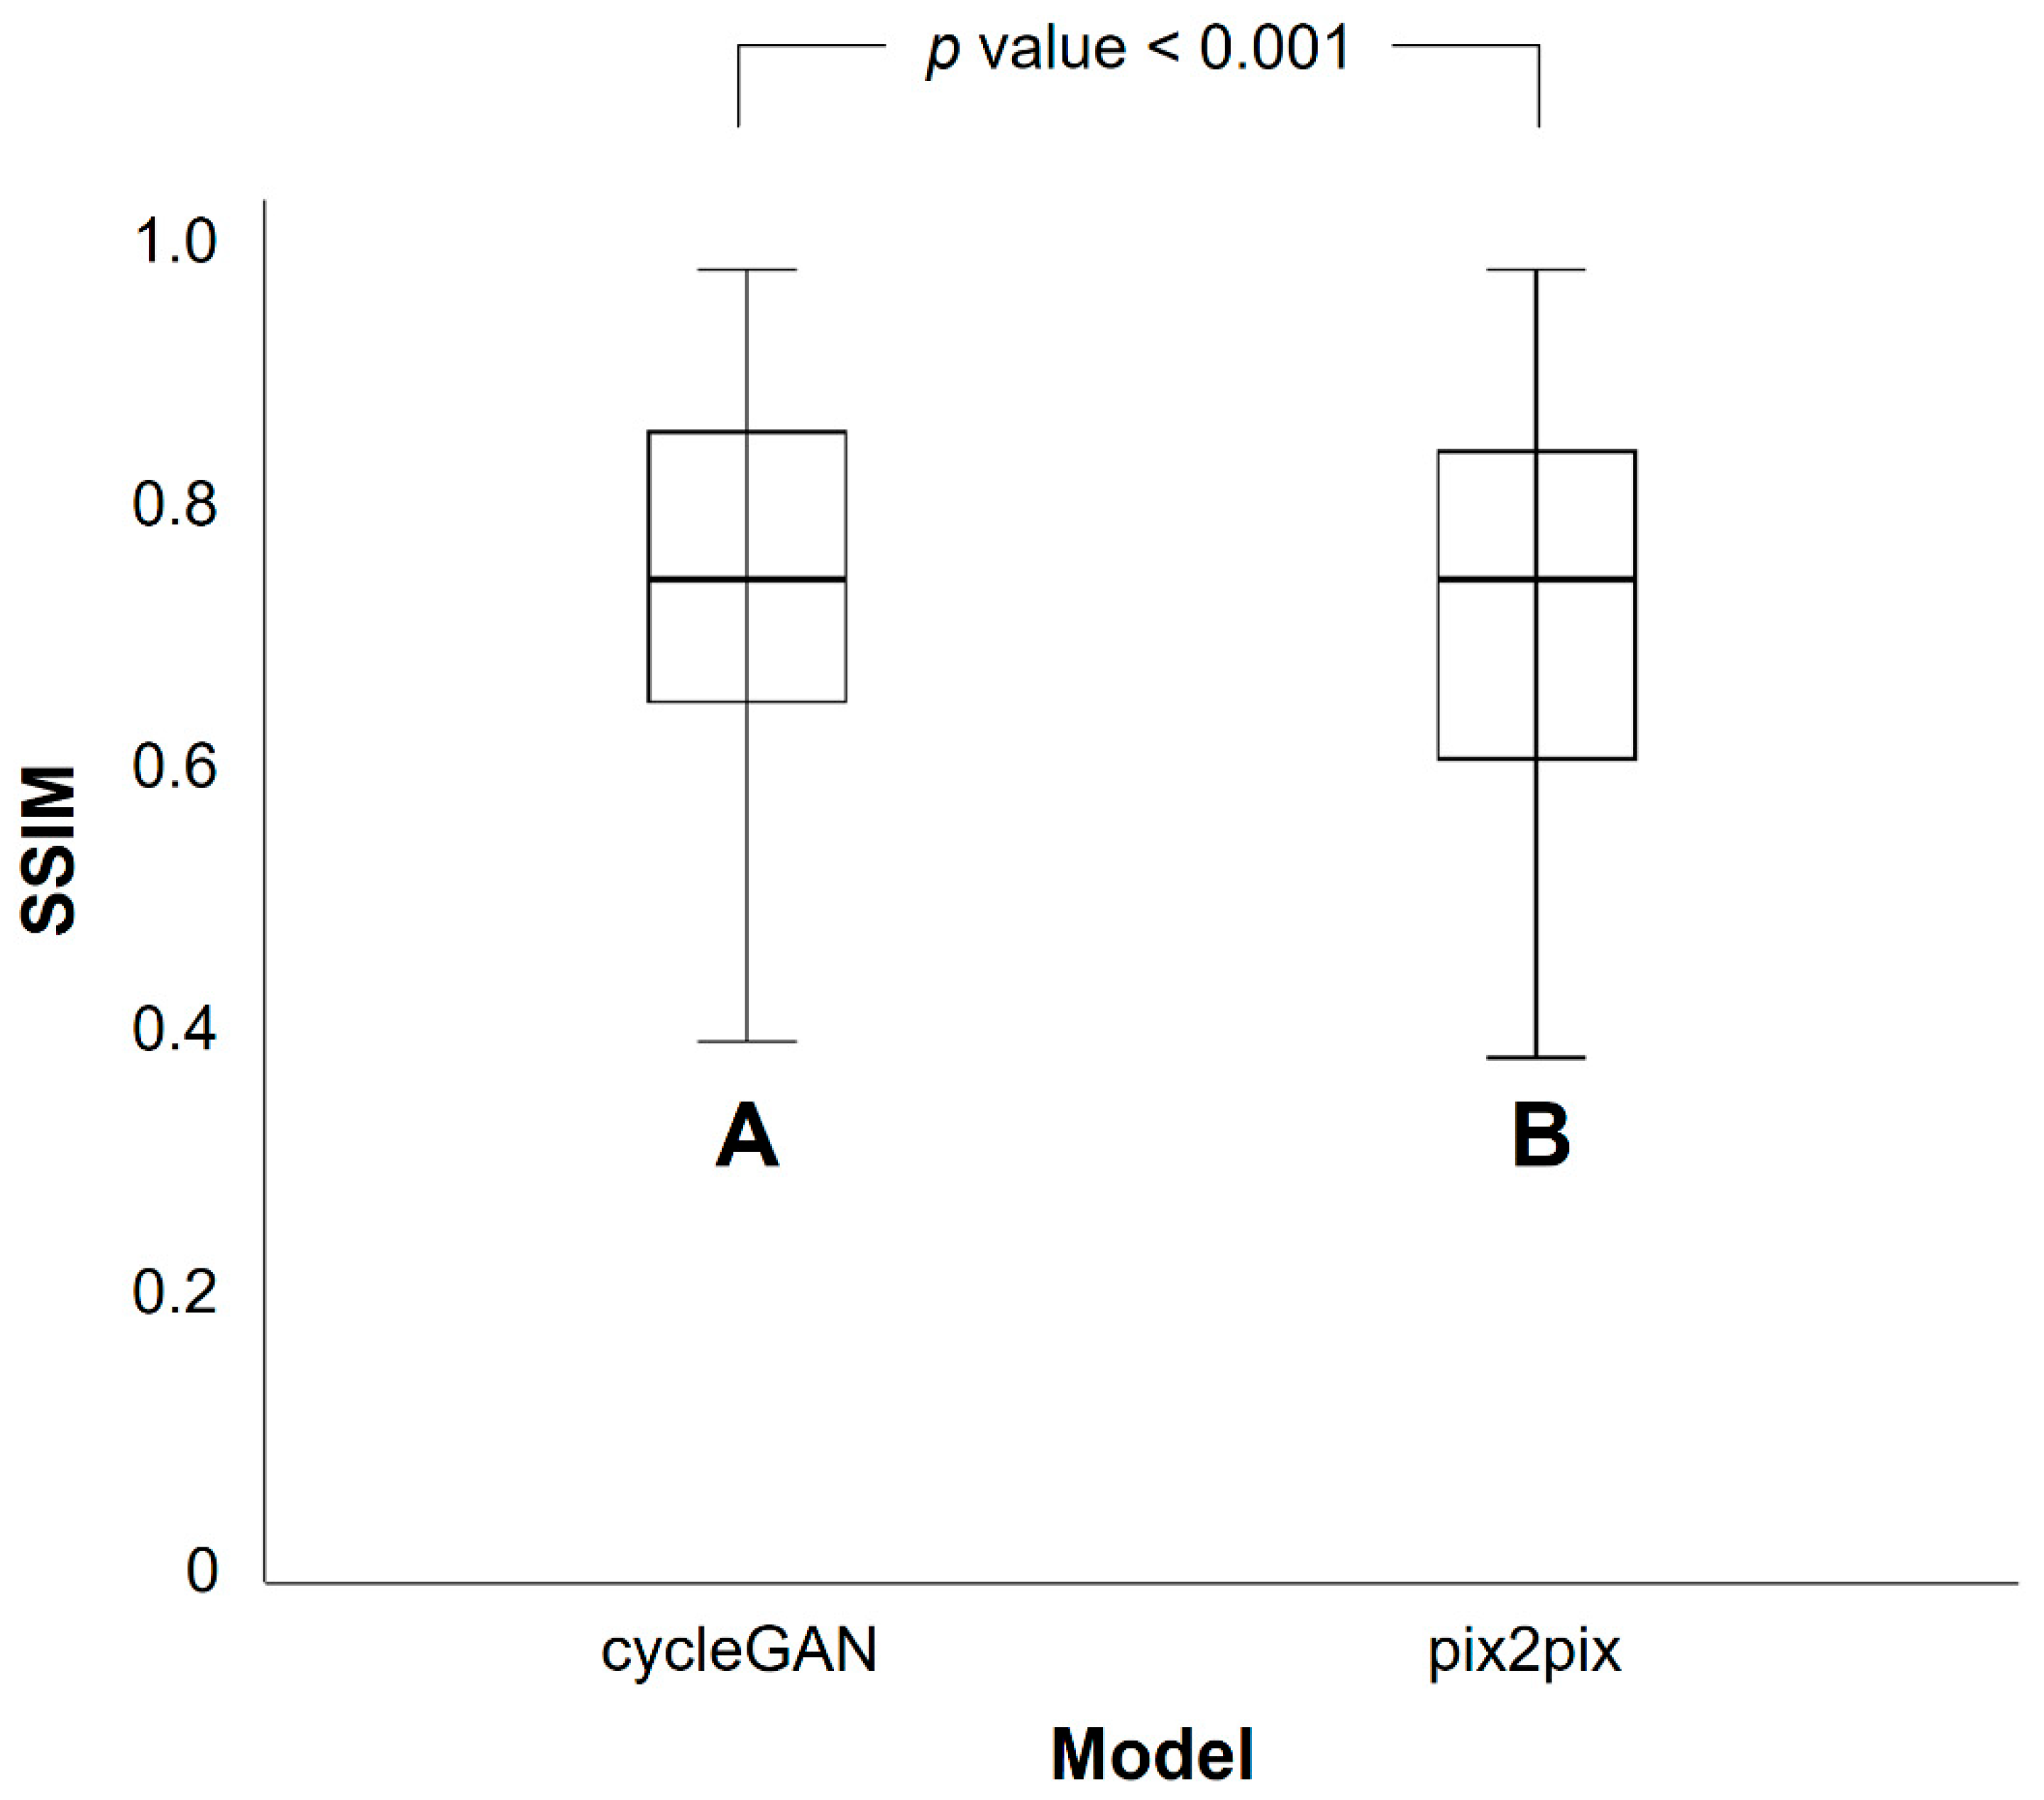
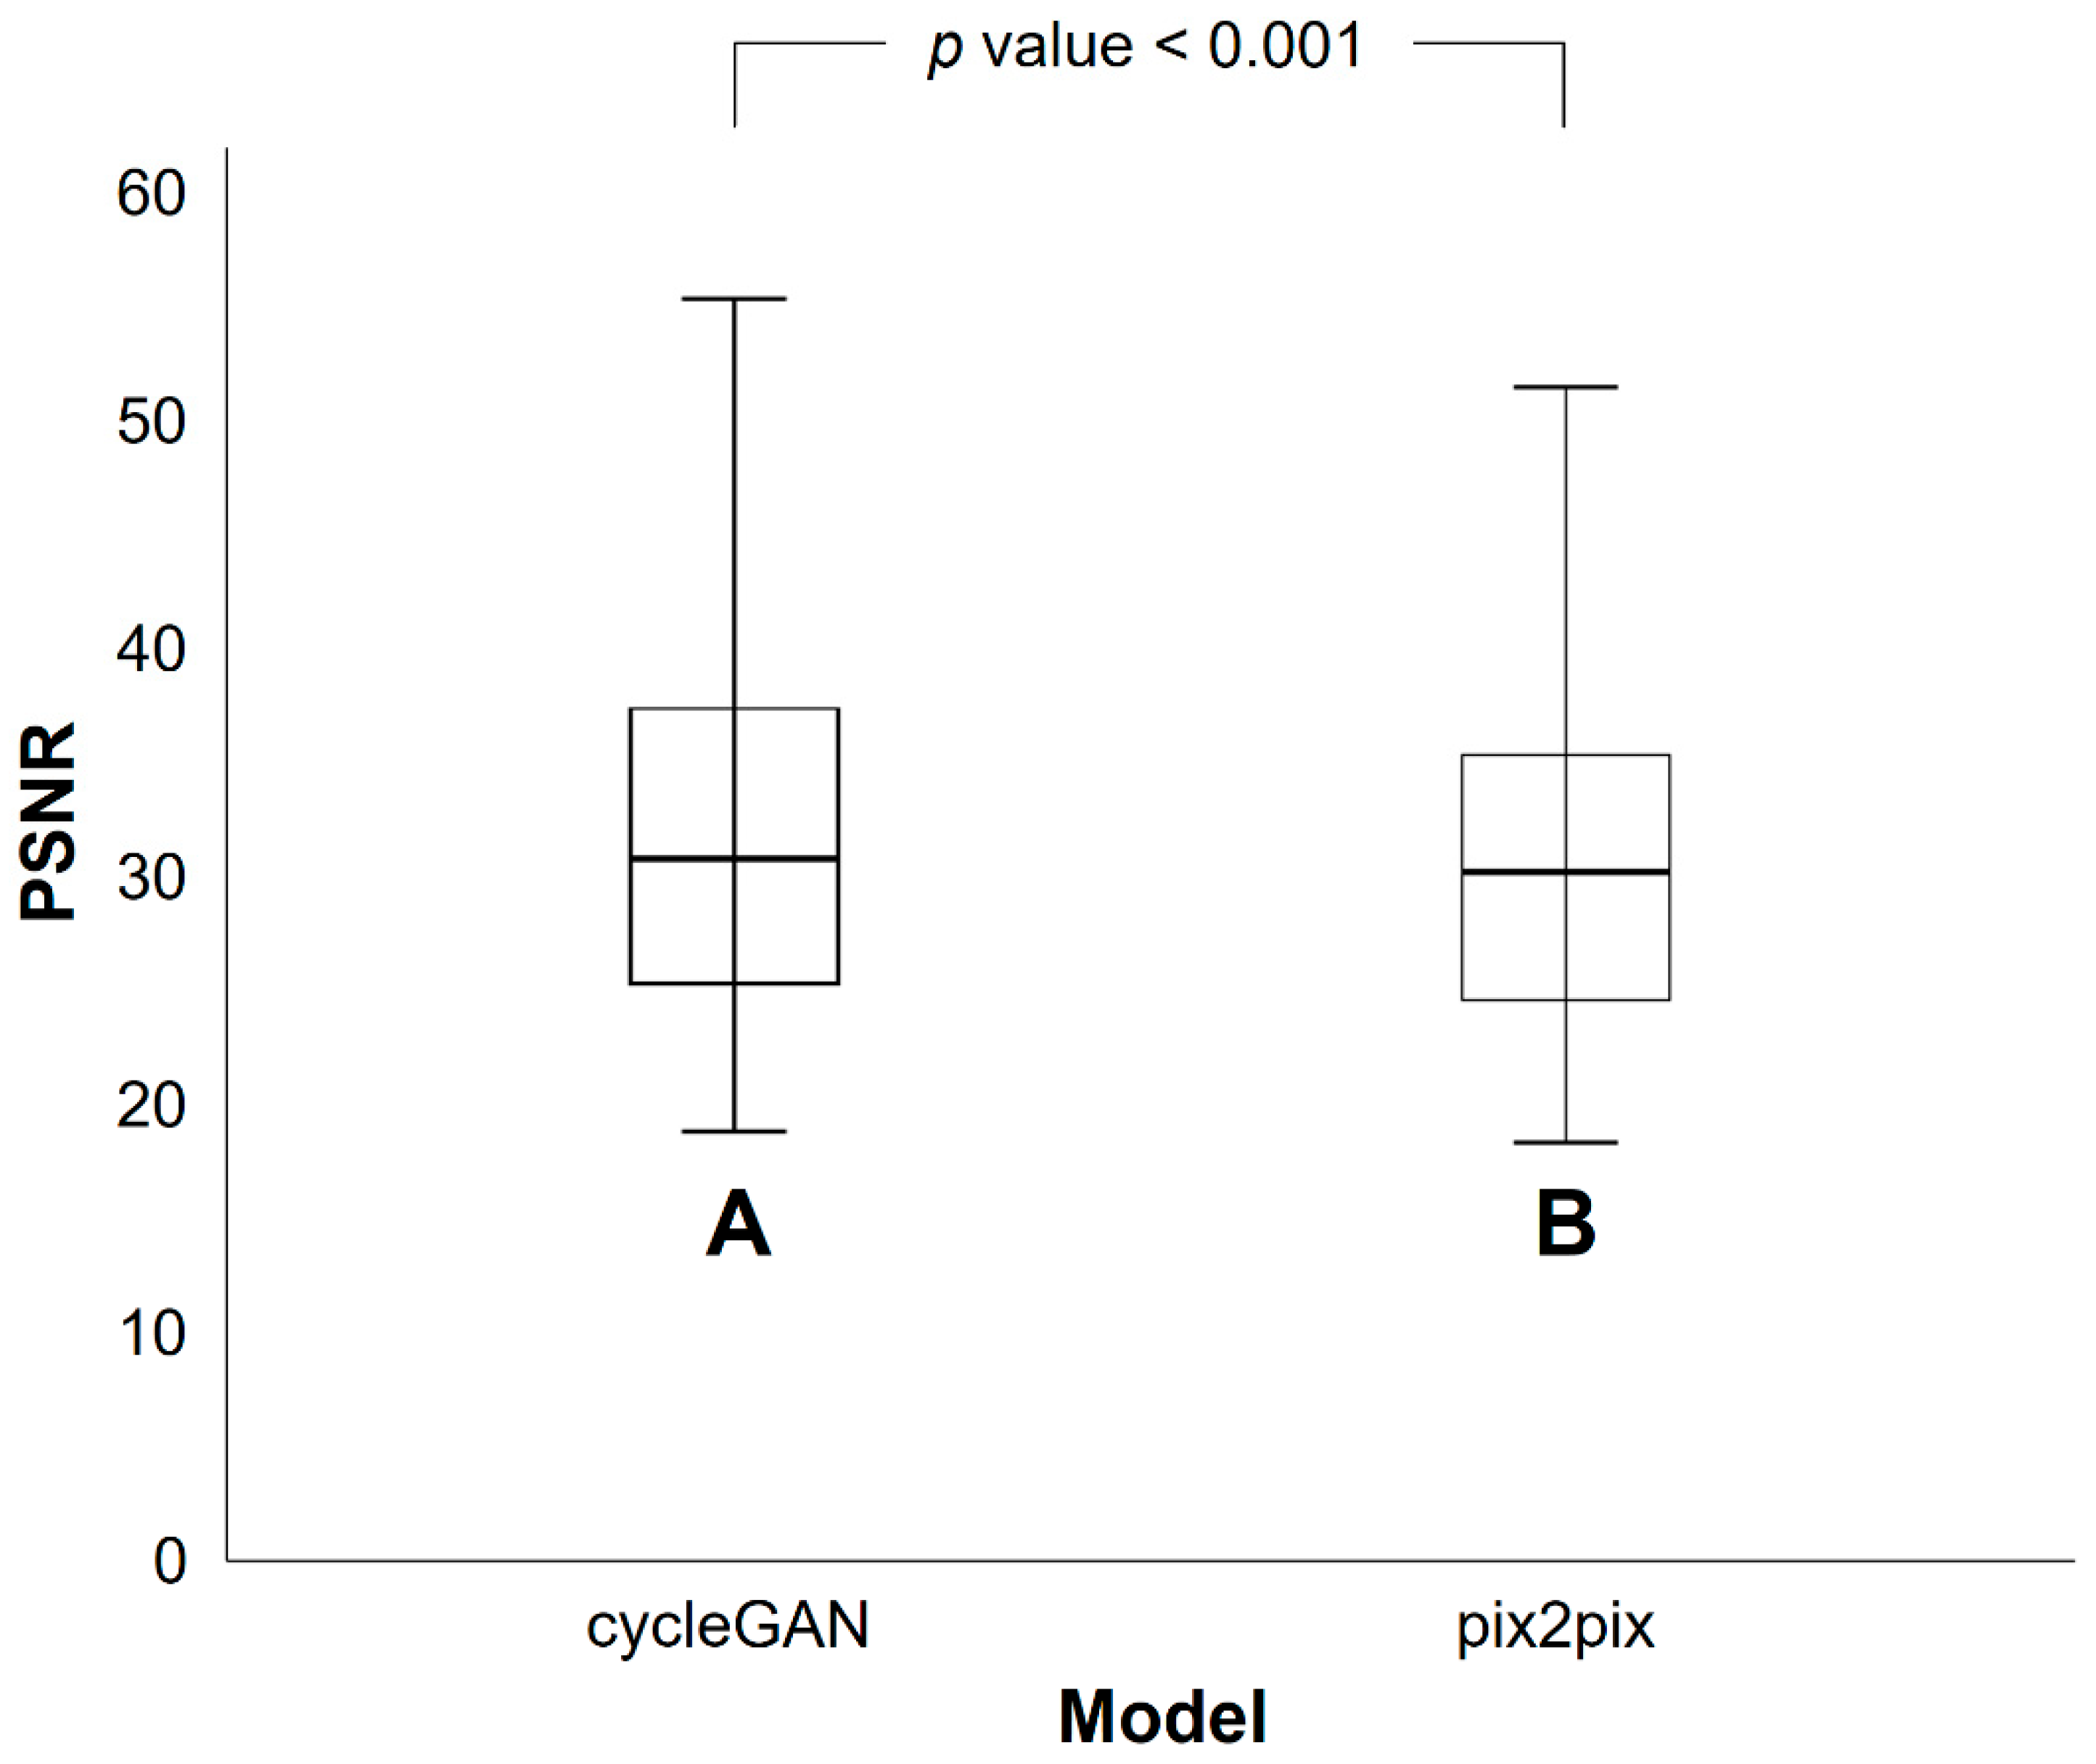
3.2. Differences in SSIM and PSNR Values between PETRE-FDG and PETGE-FDG Images

PETGE-FDG images were created using the cycleGAN and pix2pix models with training times of 62 h 36 min and 21 h 22 min, respectively. The mean SSIM (SSIMmean) between the PETRE-FDG and PETGE-FDG images was 0.768 for the cycleGAN model and 0.745 for the pix2pix model (Table 2). The cycleGAN model showed significantly higher SSIM values than the pix2pix model (p < 0.001). The SSIM values in the cycleGAN and pix2pix models are represented by the box plots in Figure 5. The mean PSNR (PSNRmean) between the PETRE-FDG and PETGE-FDG images was 32.4 for the cycleGAN and 30.7 for the pix2pix models (Table 3). The PSNR values of the cycleGAN model were significantly higher than those of the pix2pix model (p < 0.001). The PSNR values for the cycleGAN and pix2pix models are shown in the box plots provided in Figure 6. Representative PETGE-FDG and PETRE-FDG images from one participant are shown in Figure 7 (A, PETFBB; B, PETGE-FDG using the pix2pix model; C, PETGE-FDG using the cycleGAN model; and D, PETRE-FDG, from left to right).

4. Discussion

With an increasingly aging society, the incidence of neurodegenerative disorders may also increase, particularly AD, which is the most common form of dementia [19]. The early and accurate diagnosis of AD is important for the medical and socioeconomic care of patients [20]. It allows for the early and appropriate management of AD patients, with the medical faculty focusing on preserving cognitive function and preventing irreversible damage [21]. For this reason, there has been a considerable number of studies dedicated to utilizing non-invasive imaging modalities, such as amyloid PET and PETFDG, in recent years. There has been increasing interest in the potential of early amyloid PET image as an alternative to PETFDG. As in our study, generating PETGE-FDG images from PETFBB images using deep learning has clinical implications in terms of reducing the cost and radiation exposure of the patient and eliminating the inconvenience of repeat examinations.
The neuropathological hallmarks of AD are the presence of intracellular neurofibrillary tangles and extracellular amyloid plaques [22]. Increased amyloid deposition in the brain is known to be associated with cognitive decline, and these deposits have been detected in AD patients approximately 10–15 years prior to symptom onset. Since PiB was first used in research, the only FDA-approved clinical amyloid PET tracers to date are FBB, 18F-Florbetapir, and 18F-Flutemetamol, an imaging test that allows for the visual assessment of abnormal amyloid deposition in the brain [23]. Although amyloid PET imaging is highly specific for assessing the amyloid burden in the brain, there are difficulties in assessing the progression of AD in patients who exhibit high levels of amyloid deposition at the time of diagnosis [24]. In addition, positive findings of amyloid deposition can be seen not only in AD but also in other types of dementia, such as Lewy body dementia [25].
The brain utilizes approximately a quarter of the body’s glucose on a daily basis. Glucose is transported from the blood to the brain cells via glucose transporters. FDG, which is a glucose analog, is transported to brain cells via the same pathway but undergoes phosphorylation within the cell, which prevents it from being released from the cell. FDG accumulates without further glycolysis and is a good reflection of glucose uptake in brain cells [7]. The stimulation of neurons has been reported to coincide with FDG uptake at neuronal terminals, indicating that FDG uptake in the brain reflects neuronal activity [7]. Thus, PETFDG imaging serves as a functional imaging biomarker for assessing regional brain dysfunction caused by neuronal injury in AD. AD is characterized by decreased glucose metabolism in the posterior cingulate cortex, precuneus, and parieto–temporal cortex on the PETFDG image, and in advanced cases, the decreased FDG uptake may extend to the frontal cortex. It is a non-invasive imaging test that is useful for the evaluation of disease extent in AD as well as for the differential diagnosis of other types of dementia, in which cases amyloid PET imaging may have a limited role [5,26,27,28,29]. It can also be used to predict the progression from mild cognitive impairment to AD [30] and to classify subtypes of AD [31]. However, decreased FDG uptake in the brain on PETFDG imaging is indicative of neurodegeneration. Thus, PETFDG imaging is not an appropriate imaging test for the early diagnosis of AD [32].
Early-phase 11C-Pittsburgh compound B (PiB) PET (PETPiB) imaging, which is obtained within the first few minutes after PiB injection, reflects the cerebral blood pool due to the lipophilic nature and high extraction fraction of PiB [33]. The close relationship between blood supply and glucose consumption in the brain has been well-documented in several studies. In regions of the brain with neuronal injury, glucose hypometabolism and hypoperfusion are often concurrent [34,35]. Decreased tracer uptake on early-phase PETPiB images is reported to closely correlate with hypometabolism in PETFDG images and low mini-mental state examination scores in patients with early-stage AD. Thus, both abnormal amyloid deposition and neurodegeneration extent in the brain may be assessed with a conventional PETPiB image [8,9]. Another amyloid tracer, 18F-florbetapir, has also been reported to have a strong correlation with PETFDG in early-phase 18F-florbetapir PET imaging [36]. In recent studies regarding the early-phase PETFBB image, the early-phase PETFBB image showed a close correlation with the PETFDG image [25,37,38]. In one study, early-phase PETFBB images showed a slightly stronger correlation than PETPiB images, suggesting that obtaining PETFBB images at dual time points with a single radioisotope injection has the advantages of allowing for both accurate diagnosis and assessment of progression in patients with AD [10]. This suggests that early-phase amyloid PET image could serve as a clinically viable alternative to the PETFDG image for assessing neuronal injury in patients with dementia.
There has been increasing interest in using artificial intelligence (AI) to accurately assess cognitive function in patients with AD. This is because AI has the potential to overcome the diagnostic limitations of existing molecular biomarkers (such as amyloid plaque and tau in cerebrospinal fluid) and imaging methods (such as computed tomography (CT), MRI, amyloid PET imaging, and PETFDG imaging). AI can also help analyze and interpret complex and large amounts of information from the brain. Most AI-based research in AD focuses on developing AI algorithms for the classification or diagnosis of AD and for developing biomarkers for the early detection of AD [39]. The current study focused on image-to-image translation using deep learning to decrease the clinical burden associated with obtaining multimodality imaging. We aimed to investigate whether AI can generate PETGE-FDG image from conventional amyloid PET image. Image transformation using deep learning in medical imaging has been widely studied [40,41]. Most of the studies have focused on image translation between MRI and CT images, while some have studied image translation between conventional radiologic imaging (CT or MRI) and PET images [41]. A recent study reported on image-to-image translation using deep learning between amyloid tracers [13]. In one of our previous studies, we reported on image-to-image translation between the 18F-FP-CIT PET image and the PETFDG image using deep learning. The study results revealed that the early-phase 18F-FP-CIT PET image that was generated was significantly similar to the PETFDG image [12]. The generation of PETFBB from PETFDG using deep learning has also been reported [42]. To the best of our knowledge, no study has attempted to generate PETFDG images from PETFBB images. This is a preliminary study that shows the potential of using two deep-learning models (cycleGAN and pix2pix) for generating PETFDG images from conventional PETFBB images. PETGE-FDG images may benefit patients by further reducing examination time (by acquiring only a single time point conventional PETFBB image instead of dual-time point PETFBB image). The generation of PETFDG images from PETFBB images might be challenging because of the negative correlation between the regional uptakes in PETFDG and PETFBB images [43]. Additionally, PETFBB images generally have a lower image quality than PETFDG images, especially when there is a negative amyloid burden.
SSIM and PSNR were used to compare PETGE-FDG and PETRE-FDG. SSIM was developed to predict the perceived quality of digital images and measure the similarity between two images [18]. Since then, SSIM has been widely used for image comparison by detecting perceived structural changes during image processing. PSNR is a quantitative measure of image denoising quality. SSIM aligns more closely with the human visual perception of image quality when compared with PSNR [44]. SSIM and PSNR values of the cycleGAN model was higher than those of the pix2pix model in this study. Although higher SSIM and PSNR were not always equal to higher visual quality, PETGE-FDG using the cycleGAN model was statistically closer to the PETRE-FDG image than the PETGE-FDG image using the pix2pix model.
Two different GAN models, cycleGAN and pix2pix, were used to generate PETFDG images from PETFBB in this study. Compared with the SSIM values of the PETGE-FDG images using the cycleGAN model, the lower SSIM values of the PETGE-FDG images using the pix2pix model may be related to the misalignment between the PETGE-FDG and PETRE-FDG images. The pix2pix model is specialized for paired image-to-image translation. Therefore, the contours of the PETFBB and PETFDG images must be aligned to correct the misalignment before training the pix2pix model [11]. The correction process for the misalignment is time-consuming and labor-intensive. In contrast, the cycleGAN model represents unpaired image-to-image translation, and no preprocessing is required for image alignment. In this respect, the cycleGAN model for the generation of PETFDG from PETFBB may be considered more appropriate than the pix2pix model.
This study had some limitations. First, the numbers of training and validation datasets were small. However, this limited dataset size is reflective of the reality of medical practice, where it is difficult to perform both tests (PETFBB and PETFDG images). In other words, medical imaging data are often unpaired. In this regard, the application of deep learning with cycleGAN model can have a significant clinical impact on the accurate assessment of AD. Second, the size of each image was small. These limitations might affect the image quality, although image size reduction is inevitable because of lower computational resources [45]. Therefore, the image quality of PETGE-FDG is insufficient for visual assessments in daily practice. Nevertheless, data augmentation techniques, including patching, flipping, and resizing, have been used to overcome these limitations. Subsequently, PETGE-FDG images with tolerable SSIM were generated. A larger number of datasets with relevant image sizes should be made available to improve the visual quality of PETGE-FDG images in further studies.
To the best of our knowledge, this study represents the first attempt to evaluate whether images close to PETFDG images may be generated from conventional PETFBB images using deep learning. Despite the aforementioned drawbacks and limitations, our study results suggest that deep learning may reduce the time, cost, and patient inconvenience of additional early-phase scanning in PETFBB images and provide information on the regional glucose metabolism of the brain at the same time. Future studies with larger sample sizes are warranted to evaluate the correlation of PETGE-FDG and PETRE-FDG images, which might provide valuable clinical evidence in this field.

5. Conclusions

We generated PETFDG from PETFBB images using the cycleGAN and pix2pix models. The cycleGAN model generated PETFDG images with significantly higher SSIM and PSNR than the pix2pix model. We demonstrated that PETGE-FDG image using cycleGAN may have an image quality and similarity closer to PETRE-FDG image and help provide proper management of AD by minimizing additional radiation risk and inconvenience caused to the patient by extra image acquisition such as early-phase amyloid PET image.

Author Contributions

Conceptualization, H.J.C., M.S., A.K. and S.H.P.; methodology, H.J.C.; software, H.J.C.; validation, H.J.C., A.K. and S.H.P.; formal analysis, H.J.C.; investigation, S.H.P.; resources, H.J.C.; data curation, H.J.C.; writing—original draft preparation, H.J.C.; writing—review and editing, M.S.; visualization, H.J.C.; supervision, A.K. and S.H.P.; project administration, H.J.C. and S.H.P. All authors have read and agreed to the published version of the manuscript.

Funding

This study received no external funding.

Institutional Review Board Statement

The institutional ethics committee of Ulsan University Hospital reviewed this observational study and confirmed that no ethical approval was required, and the informed consent was waived (IRB file number UUH2022-05-028).

Informed Consent Statement

The need for informed consent was waived because all data used in this study were public data retrieved from the ADNI.

Data Availability Statement

Not applicable.

Acknowledgments

Data used in the preparation of this article were obtained from the Alzheimer’s Disease Neuroimaging Initiative (ADNI) database (adni.loni.usc.edu, accessed on 3 June 2022). Therefore, the investigators within the ADNI contributed to the design and implementation of ADNI and/or provided data but did not participate in the analysis of the data or compilation of this report. A complete listing of ADNI investigators can be found at http://adni.loni.usc.edu/wp-content/uploads/how_to_apply/ADNI_Acknowledgement_List.pdf, (accessed on 3 June 2022). Data used in the preparation of this article were generated by the Alzheimer’s Disease Metabolomics Consortium (ADMC). Therefore, the investigators within the ADMC provided data but did not participate in the analysis of the data or compilation of this report. A complete list of ADMC investigators can be found at https://sites.duke.edu/adnimetab/team/ (accessed on 3 June 2022). Data collection and sharing for this project were funded by the ADNI (National Institutes of Health Grant U01 AG024904), DOD ADNI (Department of Defense award number W81XWH-12-2-0012) and the Alzheimer’s Disease Metabolomics Consortium (National Institute on Aging R01AG046171, RF1AG051550 and 3U01AG024904-09S4). ADNI is funded by the National Institute on Aging, the National Institute of Biomedical Imaging and Bioengineering, and through generous contributions from the following: AbbVie, Alzheimer’s Association; Alzheimer’s Drug Discovery Foundation; Araclon Biotech; BioClinica, Inc.; Biogen; Bristol-Myers Squibb Company; CereSpir, Inc.; Cogstate; Eisai Inc.; Elan Pharmaceuticals, Inc.; Eli Lilly and Company; EuroImmun; F. Hoffmann-La Roche Ltd. and its affiliated company Genentech, Inc.; Fujirebio; GE Healthcare; IXICO Ltd.; Janssen Alzheimer Immunotherapy Research & Development, LLC.; Johnson & Johnson Pharmaceutical Research & Development LLC.; Lumosity; Lundbeck; Merck & Co., Inc.; Meso Scale Diagnostics, LLC.; NeuroRx Research; Neurotrack Technologies; Novartis Pharmaceuticals Corporation; Pfizer Inc.; Piramal Imaging; Servier; Takeda Pharmaceutical Company; and Transition Therapeutics. The Canadian Institutes of Health Research provides funds to support ADNI clinical sites in Canada. Private sector contributions are facilitated by the Foundation for the National Institutes of Health (www.fnih.org, accessed on 3 June 2022). The grantee organization is the Northern California Institute for Research and Education, and the study is coordinated by the Alzheimer’s Therapeutic Research Institute at the University of Southern California. ADNI data are disseminated by the Laboratory for Neuro Imaging at the University of Southern California.

Conflicts of Interest

The authors declare no conflict of interest.

References

  1. Reitz, C.; Mayeux, R. Alzheimer disease: Epidemiology, diagnostic criteria, risk factors and biomarkers. Biochem. Pharmacol. 2014, 88, 640–651. [Google Scholar] [CrossRef] [Green Version]
  2. Chung, S.E.; Kim, H.J.; Jo, S.; Lee, S.; Lee, Y.; Roh, J.H.; Lee, J.H. Patterns of focal amyloid deposition using (18)F-Florbetaben PET in patients with cognitive impairment. Diagnostics 2022, 12, 1357. [Google Scholar] [CrossRef]
  3. Kadir, A.; Almkvist, O.; Forsberg, A.; Wall, A.; Engler, H.; Långström, B.; Nordberg, A. Dynamic changes in PET amyloid and FDG imaging at different stages of Alzheimer’s disease. Neurobiol. Aging 2012, 33, 198.e1–198.e14. [Google Scholar] [CrossRef] [PubMed]
  4. Donaghy, P.; Thomas, A.J.; O’Brien, J.T. Amyloid PET Imaging in Lewy body disorders. Am. J. Geriatr. Psychiatry 2015, 23, 23–37. [Google Scholar] [CrossRef] [Green Version]
  5. Vandenberghe, R.; Adamczuk, K.; Dupont, P.; Laere, K.V.; Chetelat, G. Amyloid PET in clinical practice: Its place in the multidimensional space of Alzheimer’s disease. Neuroimage Clin. 2013, 2, 497–511. [Google Scholar] [CrossRef] [PubMed] [Green Version]
  6. Shokouhi, S.; Claassen, D.; Kang, H.; Ding, Z.; Rogers, B.; Mishra, A.; Riddle, W.R. Longitudinal progression of cognitive decline correlates with changes in the spatial pattern of brain 18F-FDG PET. J. Nucl. Med. 2013, 54, 1564–1569. [Google Scholar] [CrossRef] [Green Version]
  7. Minoshima, S.; Cross, D.; Thientunyakit, T.; Foster, N.L.; Drzezga, A. (18)F-FDG PET Imaging in Neurodegenerative Dementing Disorders: Insights into Subtype Classification, Emerging Disease Categories, and Mixed Dementia with Copathologies. J. Nucl. Med. 2022, 63, 2S–12S. [Google Scholar] [CrossRef]
  8. Rostomian, A.H.; Madison, C.; Rabinovici, G.D.; Jagust, W.J. Early 11C-PIB frames and 18F-FDG PET measures are comparable: A study validated in a cohort of AD and FTLD patients. J. Nucl. Med. 2011, 52, 173–179. [Google Scholar] [CrossRef] [PubMed] [Green Version]
  9. Meyer, P.T.; Hellwig, S.; Amtage, F.; Rottenburger, C.; Sahm, U.; Reuland, P.; Weber, W.A.; Hull, M. Dual-biomarker imaging of regional cerebral amyloid load and neuronal activity in dementia with PET and 11C-labeled Pittsburgh compound B. J. Nucl. Med. 2011, 52, 393–400. [Google Scholar] [CrossRef] [Green Version]
  10. Tiepolt, S.; Hesse, S.; Patt, M.; Luthardt, J.; Schroeter, M.L.; Hoffmann, K.T.; Weise, D.; Gertz, H.J.; Sabri, O.; Barthel, H. Early [(18)F]florbetaben and [(11)C]PiB PET images are a surrogate biomarker of neuronal injury in Alzheimer’s disease. Eur. J. Nucl. Med. Mol. Imaging 2016, 43, 1700–1709. [Google Scholar] [CrossRef]
  11. Choi, H.; Lee, D.S. Generation of Structural MR Images from Amyloid PET: Application to MR-Less Quantification. J. Nucl. Med. 2018, 59, 1111–1117. [Google Scholar] [CrossRef] [PubMed] [Green Version]
  12. Choi, H.J. Virtual 18F-FDG Positron Emission Tomography Images Generated From Early Phase Images of 18F-FP-CIT Positron Emission Tomography Computed Tomography Using A Generative Adversarial Network in Patients with Suspected Parkinsonism. Doctorial Dissertation, Hanyang University, Seoul, Republic of Korea, 2021. [Google Scholar]
  13. Kang, S.K.; Choi, H.; Lee, J.S.; Alzheimer’s Disease Neuroimaging Initiative. Translating amyloid PET of different radiotracers by a deep generative model for interchangeability. Neuroimage 2021, 232, 117890. [Google Scholar] [CrossRef] [PubMed]
  14. Weiner, M.W.; Veitch, D.P.; Aisen, P.S.; Beckett, L.A.; Cairns, N.J.; Green, R.C.; Harvey, D.; Jack, C.R., Jr.; Jagust, W.; Morris, J.C.; et al. The Alzheimer’s Disease Neuroimaging Initiative 3: Continued innovation for clinical trial improvement. Alzheimers Dement. 2017, 13, 561–571. [Google Scholar] [CrossRef] [Green Version]
  15. Zhu, J.-Y.; Park, T.; Isola, P.; Efros, A.A. Unpaired Image-to-Image Translation using Cycle-Consistent Adversarial Networks. arXiv 2017, arXiv:1703.10593. [Google Scholar]
  16. Isola, P.; Zhu, J.-Y.; Zhou, T.; Efros, A.A. Image-to-Image Translation with Conditional Adversarial Networks. arXiv 2016, arXiv:1611.07004. [Google Scholar]
  17. Ronneberger, O.; Fischer, P.; Brox, T. U-Net: Convolutional Networks for Biomedical Image Segmentation. arXiv 2015, arXiv:1505.04597. [Google Scholar]
  18. Wang, Z.; Bovik, A.C.; Sheikh, H.R.; Simoncelli, E.P. Image quality assessment: From error visibility to structural similarity. IEEE Trans. Image Process. 2004, 13, 600–612. [Google Scholar] [CrossRef] [Green Version]
  19. Scheltens, P.; De Strooper, B.; Kivipelto, M.; Holstege, H.; Chételat, G.; Teunissen, C.E.; Cummings, J.; van der Flier, W.M. Alzheimer’s disease. Lancet 2021, 397, 1577–1590. [Google Scholar] [CrossRef]
  20. Lane, C.A.; Hardy, J.; Schott, J.M. Alzheimer’s disease. Eur. J. Neurol. 2018, 25, 59–70. [Google Scholar] [CrossRef]
  21. Crous-Bou, M.; Minguillon, C.; Gramunt, N.; Molinuevo, J.L. Alzheimer’s disease prevention: From risk factors to early intervention. Alzheimers Res. Ther. 2017, 9, 71. [Google Scholar] [CrossRef] [Green Version]
  22. Braak, H.; Braak, E. Neuropathological stageing of Alzheimer-related changes. Acta Neuropathol. 1991, 82, 239–259. [Google Scholar] [CrossRef] [PubMed]
  23. Perani, D.; Schillaci, O.; Padovani, A.; Nobili, F.M.; Iaccarino, L.; Della Rosa, P.A.; Frisoni, G.; Caltagirone, C. A survey of FDG- and amyloid-PET imaging in dementia and GRADE analysis. Biomed. Res. Int. 2014, 2014, 785039. [Google Scholar] [CrossRef] [PubMed]
  24. Tanner, J.A.; Iaccarino, L.; Edwards, L.; Asken, B.M.; Gorno-Tempini, M.L.; Kramer, J.H.; Pham, J.; Perry, D.C.; Possin, K.; Malpetti, M.; et al. Amyloid, tau and metabolic PET correlates of cognition in early and late-onset Alzheimer’s disease. Brain 2022, 145, 4489–4505. [Google Scholar] [CrossRef] [PubMed]
  25. Daerr, S.; Brendel, M.; Zach, C.; Mille, E.; Schilling, D.; Zacherl, M.J.; Burger, K.; Danek, A.; Pogarell, O.; Schildan, A.; et al. Evaluation of early-phase [(18)F]-florbetaben PET acquisition in clinical routine cases. Neuroimage Clin. 2017, 14, 77–86. [Google Scholar] [CrossRef] [PubMed]
  26. McKhann, G.M.; Knopman, D.S.; Chertkow, H.; Hyman, B.T.; Jack, C.R., Jr.; Kawas, C.H.; Klunk, W.E.; Koroshetz, W.J.; Manly, J.J.; Mayeux, R.; et al. The diagnosis of dementia due to Alzheimer’s disease: Recommendations from the National Institute on Aging-Alzheimer’s Association workgroups on diagnostic guidelines for Alzheimer’s disease. Alzheimers Dement. 2011, 7, 263–269. [Google Scholar] [CrossRef] [Green Version]
  27. Dubois, B.; Feldman, H.H.; Jacova, C.; Hampel, H.; Molinuevo, J.L.; Blennow, K.; DeKosky, S.T.; Gauthier, S.; Selkoe, D.; Bateman, R.; et al. Advancing research diagnostic criteria for Alzheimer’s disease: The IWG-2 criteria. Lancet Neurol. 2014, 13, 614–629. [Google Scholar] [CrossRef]
  28. Khosravi, M.; Peter, J.; Wintering, N.A.; Serruya, M.; Shamchi, S.P.; Werner, T.J.; Alavi, A.; Newberg, A.B. 18F-FDG Is a Superior Indicator of Cognitive Performance Compared to 18F-Florbetapir in Alzheimer’s Disease and Mild Cognitive Impairment Evaluation: A Global Quantitative Analysis. J. Alzheimers Dis. 2019, 70, 1197–1207. [Google Scholar] [CrossRef]
  29. Landau, S.M.; Harvey, D.; Madison, C.M.; Koeppe, R.A.; Reiman, E.M.; Foster, N.L.; Weiner, M.W.; Jagust, W.J.; Alzheimer’s Disease Neuroimaging Initiative. Associations between cognitive, functional, and FDG-PET measures of decline in AD and MCI. Neurobiol. Aging 2011, 32, 1207–1218. [Google Scholar] [CrossRef] [Green Version]
  30. Smailagic, N.; Lafortune, L.; Kelly, S.; Hyde, C.; Brayne, C. 18F-FDG PET for Prediction of Conversion to Alzheimer’s Disease Dementia in People with Mild Cognitive Impairment: An Updated Systematic Review of Test Accuracy. J. Alzheimers Dis. 2018, 64, 1175–1194. [Google Scholar] [CrossRef]
  31. Levin, F.; Ferreira, D.; Lange, C.; Dyrba, M.; Westman, E.; Buchert, R.; Teipel, S.J.; Grothe, M.J.; Alzheimer’s Disease Neuroimaging Initiative. Data-driven FDG-PET subtypes of Alzheimer’s disease-related neurodegeneration. Alzheimers Res. Ther. 2021, 13, 49. [Google Scholar] [CrossRef]
  32. Drzezga, A.; Altomare, D.; Festari, C.; Arbizu, J.; Orini, S.; Herholz, K.; Nestor, P.; Agosta, F.; Bouwman, F.; Nobili, F.; et al. Diagnostic utility of 18F-Fluorodeoxyglucose positron emission tomography (FDG-PET) in asymptomatic subjects at increased risk for Alzheimer’s disease. Eur. J. Nucl. Med. Mol. Imaging 2018, 45, 1487–1496. [Google Scholar] [CrossRef] [PubMed] [Green Version]
  33. Blomquist, G.; Engler, H.; Nordberg, A.; Ringheim, A.; Wall, A.; Forsberg, A.; Estrada, S.; Frandberg, P.; Antoni, G.; Langstrom, B. Unidirectional Influx and Net Accumulation of PIB. Open Neuroimag. J. 2008, 2, 114–125. [Google Scholar] [CrossRef] [PubMed]
  34. Schroeter, M.L.; Neumann, J. Combined Imaging Markers Dissociate Alzheimer’s Disease and Frontotemporal Lobar Degeneration—An ALE Meta-Analysis. Front. Aging Neurosci. 2011, 3, 10. [Google Scholar] [CrossRef] [PubMed] [Green Version]
  35. Schroeter, M.L.; Stein, T.; Maslowski, N.; Neumann, J. Neural correlates of Alzheimer’s disease and mild cognitive impairment: A systematic and quantitative meta-analysis involving 1351 patients. Neuroimage 2009, 47, 1196–1206. [Google Scholar] [CrossRef] [PubMed] [Green Version]
  36. Hsiao, I.T.; Huang, C.C.; Hsieh, C.J.; Hsu, W.C.; Wey, S.P.; Yen, T.C.; Kung, M.P.; Lin, K.J. Correlation of early-phase 18F-florbetapir (AV-45/Amyvid) PET images to FDG images: Preliminary studies. Eur. J. Nucl. Med. Mol. Imaging 2012, 39, 613–620. [Google Scholar] [CrossRef] [PubMed]
  37. Son, S.H.; Kang, K.; Ko, P.W.; Lee, H.W.; Lee, S.W.; Ahn, B.C.; Lee, J.; Yoon, U.; Jeong, S.Y. Early-Phase 18F-Florbetaben PET as an Alternative Modality for 18F-FDG PET. Clin. Nucl. Med. 2020, 45, e8–e14. [Google Scholar] [CrossRef]
  38. Segovia, F.; Gomez-Rio, M.; Sanchez-Vano, R.; Gorriz, J.M.; Ramirez, J.; Trivino-Ibanez, E.; Carnero-Pardo, C.; Martinez-Lozano, M.D.; Sopena-Novales, P. Usefulness of Dual-Point Amyloid PET Scans in Appropriate Use Criteria: A Multicenter Study. J. Alzheimers Dis. 2018, 65, 765–779. [Google Scholar] [CrossRef]
  39. Mirkin, S.; Albensi, B.C. Should artificial intelligence be used in conjunction with Neuroimaging in the diagnosis of Alzheimer’s disease? Front. Aging Neurosci. 2023, 15, 1094233. [Google Scholar] [CrossRef]
  40. Nie, D.; Cao, X.; Gao, Y.; Wang, L.; Shen, D. Estimating CT Image from MRI Data Using 3D Fully Convolutional Networks. Deep Learn. Data Label. Med. Appl. 2016, 2016, 170–178. [Google Scholar]
  41. Yi, X.; Walia, E.; Babyn, P. Generative adversarial network in medical imaging: A review. Med. Image Anal. 2019, 58, 101552. [Google Scholar] [CrossRef] [Green Version]
  42. Kim, S.; Lee, P.; Oh, K.T.; Byun, M.S.; Yi, D.; Lee, J.H.; Kim, Y.K.; Ye, B.S.; Yun, M.J.; Lee, D.Y.; et al. Deep learning-based amyloid PET positivity classification model in the Alzheimer’s disease continuum by using 2-[(18)F]FDG PET. EJNMMI Res. 2021, 11, 56. [Google Scholar] [CrossRef] [PubMed]
  43. Ben Bouallègue, F.; Mariano-Goulart, D.; Payoux, P. Joint Assessment of Quantitative 18F-Florbetapir and 18F-FDG Regional Uptake Using Baseline Data from the ADNI. J. Alzheimers Dis. 2018, 62, 399–408. [Google Scholar] [CrossRef] [PubMed]
  44. Hore, A.; Ziou, D. Image quality metrics: PSNR vs. SSIM. In Proceedings of the 2010 20th International Conference on Pattern Recognition, Istanbul, Turkey, 23–26 August 2010; pp. 2366–2369. [Google Scholar]
  45. Rukundo, O. Effects of Image Size on Deep Learning. Electronics 2023, 12, 985. [Google Scholar] [CrossRef]
Figure 1. The generator with the modified U-Net architecture. The input/output image format was 64 (width) × 64 (height) × 1 (channel). After the vertical median line was virtually drawn on the U-Net diagram, the left half-side of the U-Net was used for feature extraction from input images. The other right half-side was used for image generation.
Medicina 59 01281 g001
Figure 2. The discriminator with the left half-side of the U-Net architecture. Features extracted from images were fed to the mean squared error (MSE) loss function for comparison.
Medicina 59 01281 g002
Figure 3. Diagram of the cycleGAN model. In forward generation, * PETFBB images were put into the generator and ** PETGE-FDG images were generated. The discriminator compared these PETGE-FDG images with ground-truth PETFDG images. In backward generation, the PETFBB images were generated from PETGE-FDG images using the same generator and discriminator.
Medicina 59 01281 g003
Figure 4. Diagram of the pix2pix model. ** PETGE-FDG images were generated from * PETFBB images using the one-way process, the same forward generation of the cycleGAN model.
Medicina 59 01281 g004
Figure 5. Difference in mean structural similarity index measure (SSIM) values between the cycleGAN (A) and pix2pix (B) models. The cycleGAN model shows a significantly higher SSIM than the pix2pix model.
Medicina 59 01281 g005
Figure 6. Difference in mean peak signal-to-noise ratio (PSNR) values between the cycleGAN (A) and pix2pix (B) models. The cycleGAN model shows a significantly higher PSNR than the pix2pix model.
Medicina 59 01281 g006
Figure 7. A representative case of PETGE-FDG and PETRE-FDG images. PETFBB (A), PETGE-FDG using the pix2pix model (B), PETGE-FDG using the cycleGAN model (C), and PETRE-FDG (D) are arranged from left to right.
Medicina 59 01281 g007
Table 1. Baseline participant demographics.
Training GroupValidation GroupTotal
Number82 (75%)28 (25%)110
Age *, years72.8 ± 7.872.0 ± 9.1
Sex *, n (%)
Male50 (61%)16 (57%)66 (60%)
Female32 (39%)12 (43%)44 (40%)
Diagnosis , n (%)
Normal1 (1%)1 (4%)2 (2%)
MCI60 (73%)21 (75%)81 (74%)
AD21 (26%)6 (21%)27 (24%)
Abbreviations: MCI, mild cognitive impairment; AD, Alzheimer’s disease. The p values for age, sex, and diagnosis were 0.68, 0.72, and 0.55, respectively, * Independent Student’s t-test (p > 0.05) indicates no statistical significance. Mann–Whitney U test (p > 0.05) indicates no statistical significance.
Table 2. Mean SSIM values between cycleGAN and pix2pix models.
CycleGAN ModelPix2pix Modelp Value *
Mean0.7680.745<0.001
Standard deviation0.1350.143
Abbreviations: SSIM, structural similarity index measure; GAN, generative adversarial network. * Independent t-test (p < 0.05) indicates statistical significance.
Table 3. Mean PSNR values between cycleGAN and pix2pix models.
CycleGAN ModelPix2pix Modelp Value *
Mean32.430.7<0.001
Standard deviation9.58.0
Abbreviations: PSNR, peak signal-to-noise ratio; GAN, generative adversarial network. * Independent t-test (p < 0.05) indicates statistical significance.
Disclaimer/Publisher’s Note: The statements, opinions and data contained in all publications are solely those of the individual author(s) and contributor(s) and not of MDPI and/or the editor(s). MDPI and/or the editor(s) disclaim responsibility for any injury to people or property resulting from any ideas, methods, instructions or products referred to in the content.

