

Pituitary Adenoma: SSTR2 rs2236750, SSTR5 rs34037914, and AIP rs267606574 Genetic Variants, Serum Levels, and Ki-67 Labeling Index Associations

 , , ,
, , ,
Abstract
:1. Introduction
2. Materials and Methods
2.1. DNA Extraction and Genotyping
- SSTR2 rs2236750: TaqMan® Genotyping Assay (Assay ID: C__15954985_10; Catalog # 4351379), with specific primers and fluorescently labeled probes designed for this SNP.
- SSTR5 rs34037914: TaqMan® Genotyping Assay (Assay ID: C__26059313_10; Catalog # 4351379), with specific primers and fluorescently labeled probes designed for this SNP.
- AIP rs267606574: TaqMan® Genotyping Assay (Assay ID: C_189786883_20; Catalog # 4351379), with specific primers and fluorescently labeled probes designed for this SNP.
2.2. Serum Levels’ Measurement
- Sample incubation. Test samples, along with standards of known concentrations and biotin-conjugated reagents, were added to the wells and allowed to incubate. This step facilitated the binding of the target proteins to the immobilized capture antibodies.
- Enzymatic reaction initiation. Subsequent addition of horseradish peroxidase (HRP)-conjugated reagents initiated an enzymatic reaction. This reaction generated a measurable signal directly proportional to the concentration of the target protein bound to the antibodies.
- Colorimetric detection. The enzymatic reaction catalyzed by HRP resulted in the conversion of a colorless substrate, tetramethylbenzidine (TMB), to a blue-colored product. Upon addition of an acidic stop solution, the reaction was terminated, causing the color to change to yellow. The intensity of this yellow color was directly correlated with the concentration of the target protein in the sample.
- Optical density measurement. The absorbance of the resulting yellow color was measured at 450 nm using a microplate reader. This optical density (OD) value served as the basis for precise concentration calculations, particularly within blood serum samples.
2.3. Ki-67
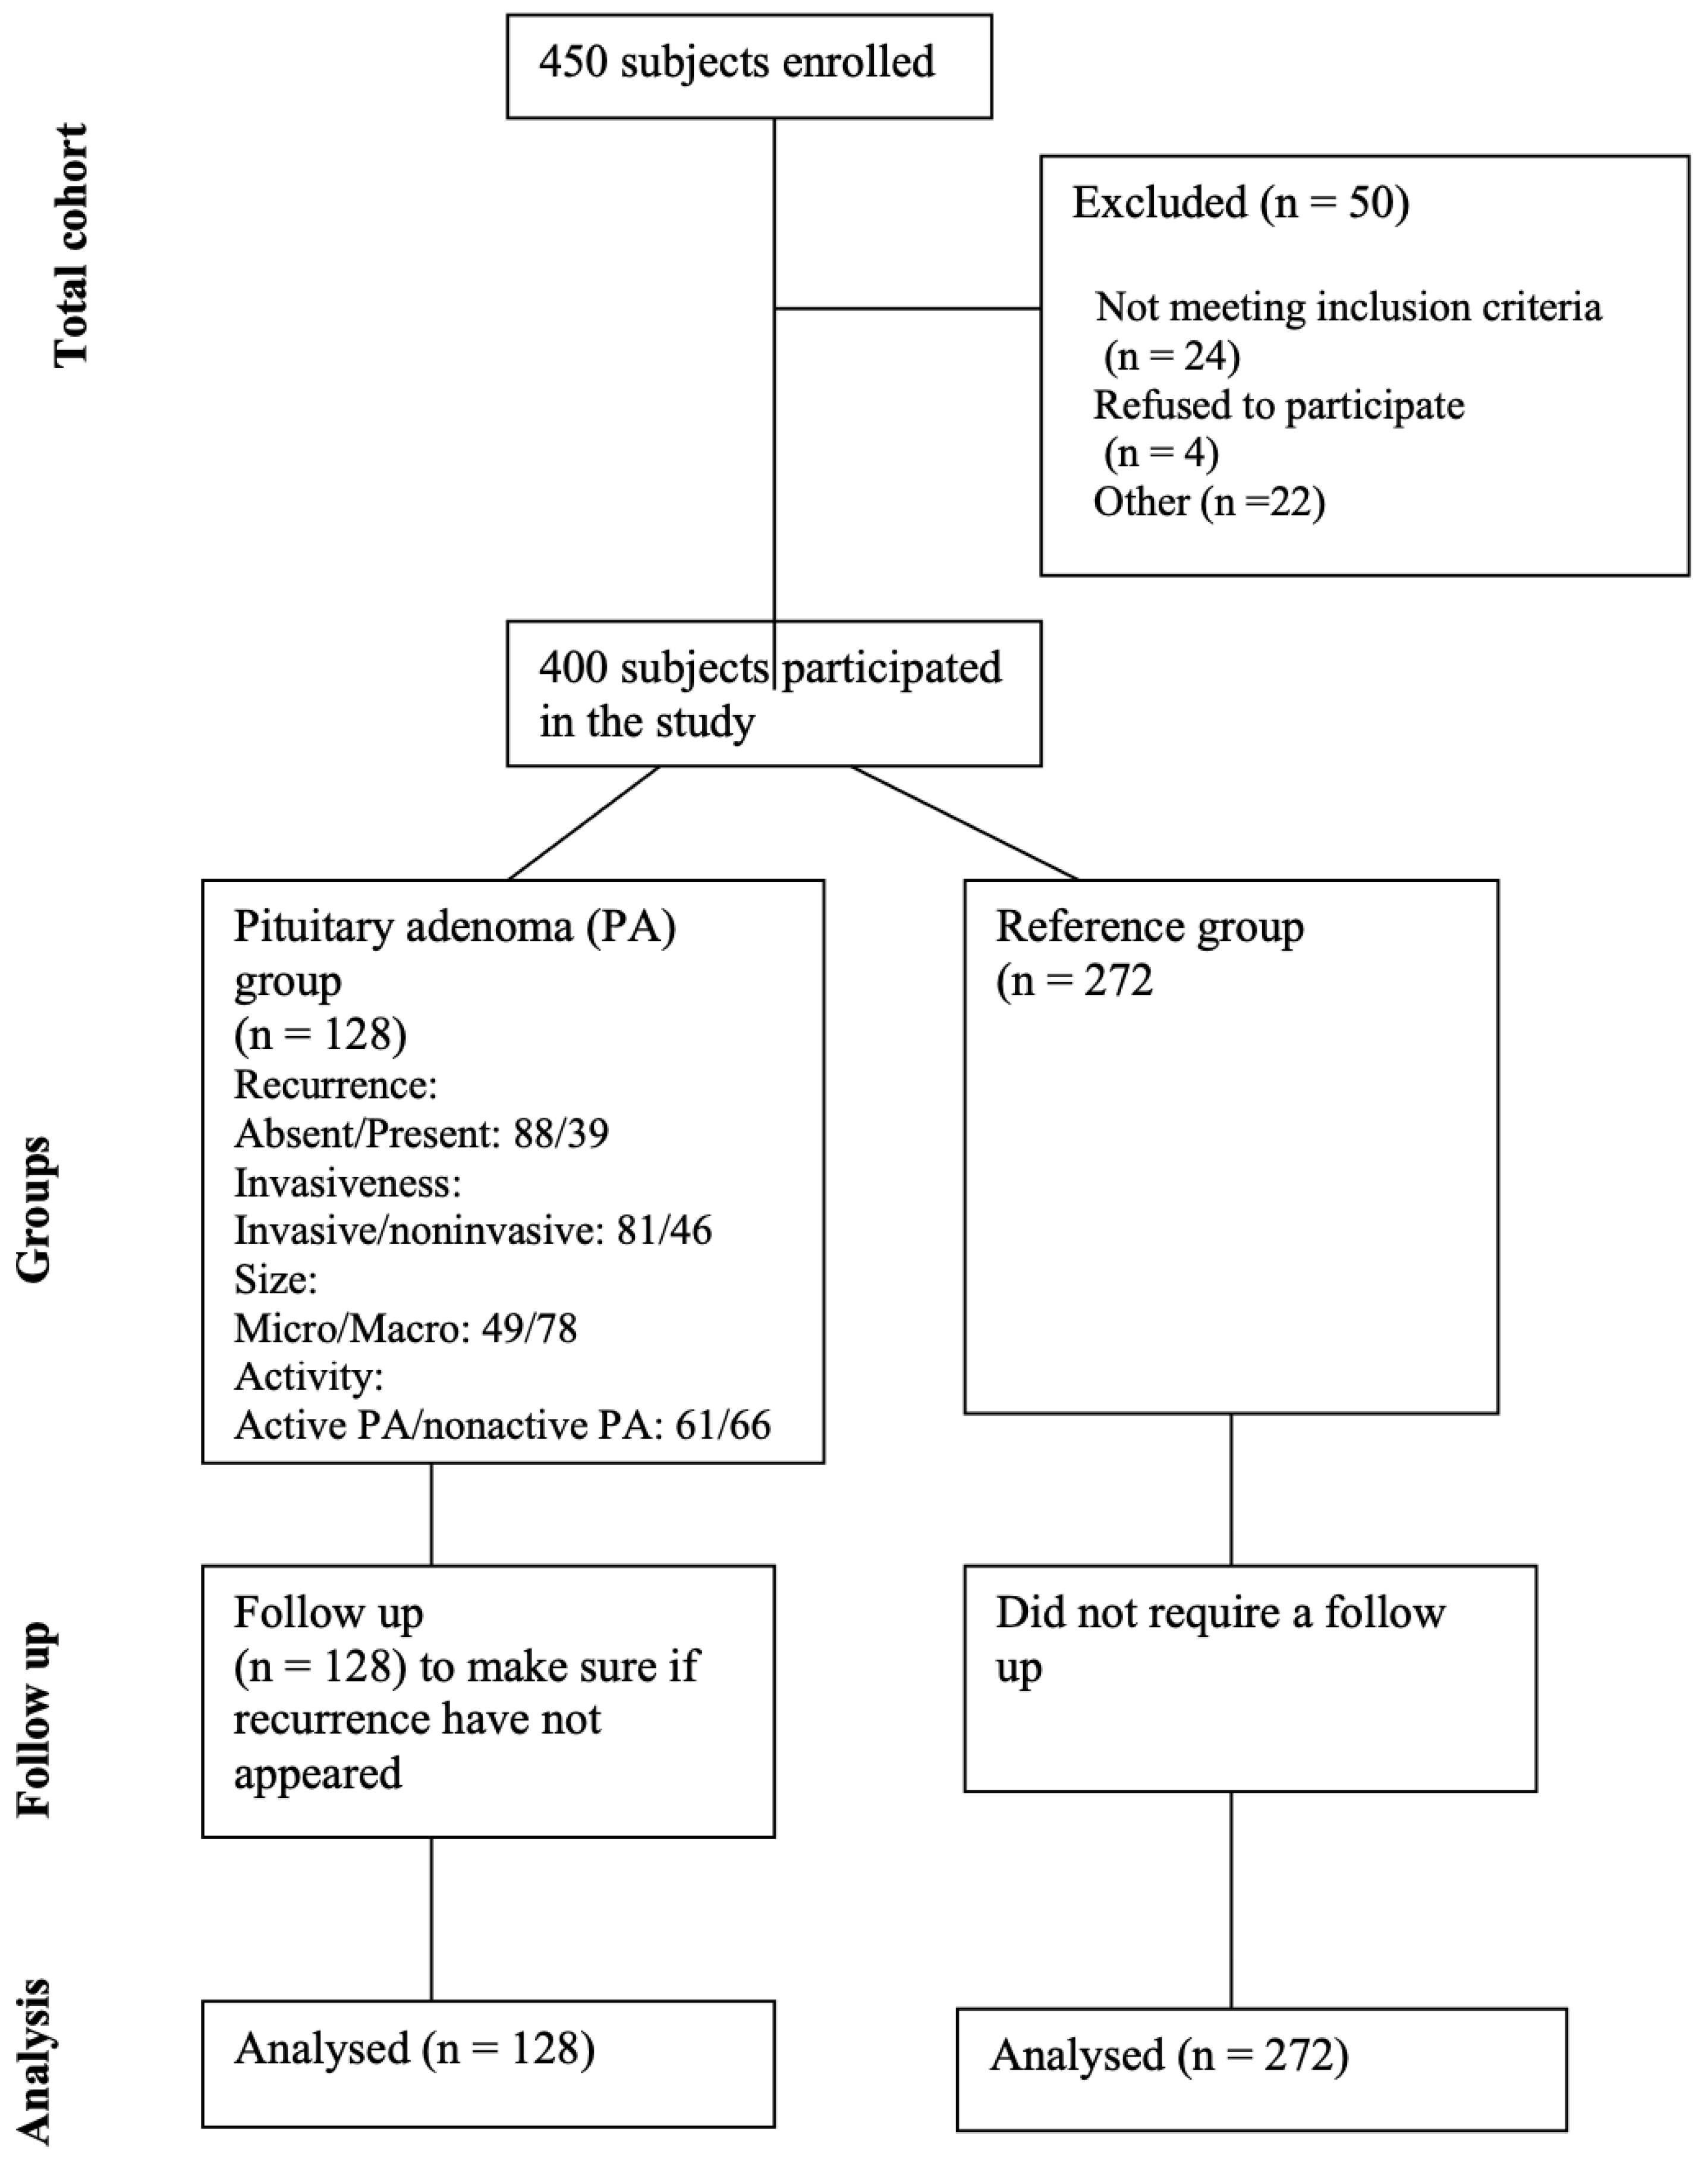
2.4. Study Group
- Confirmed diagnosis: only patients with a confirmed diagnosis of PA through imaging (MRI/CT) and/or histopathological examination were included.
- Age and health status: patients were included regardless of age (age of 18 years or older) and overall good health status, provided they met the diagnostic criteria for PA.
- Our study exclusively included patients whose PA was investigated and diagnosed based on clinical symptoms.
- Overall good health condition of the patient.
- Absence of other brain tumors, tumors in other locations, intracranial infections, demyelinating lesions, or cerebrovascular diseases.
- Consent: an informed consent form was obtained from all patients included in the study.
- Comprehensive data collection: we included a broad range of patients with different types of PAs (functional and non-functional) to ensure diversity and representativeness.
- Standardized diagnostic criteria: Consistent diagnostic criteria were applied to all patients to ensure uniformity in inclusion. PAs in our study were detected while investigating symptomatic patients. The diagnosis was based on clinical symptoms suggestive of PAs, such as hormonal imbalances, visual disturbances, or headaches.
- Non-confirmed diagnosis: patients without a confirmed diagnosis of pituitary adenoma (PA) through imaging (MRI/CT) and/or histopathological examination were excluded.
- Age and health status: patients younger than 18 years of age, or those with significant health issues that could impact their participation or the study results, were excluded.
- Non-clinical diagnosis: patients whose PAs were not investigated and diagnosed based on clinical symptoms were excluded.
- Poor health condition: patients in poor overall health, as determined by their clinical assessment, were excluded.
- Other brain or systemic conditions: patients with other brain tumors, tumors in other locations, intracranial infections, demyelinating lesions, or cerebrovascular diseases were excluded.
- Lack of consent: patients who did not provide informed consent were excluded from the study.
- Healthy status: individuals must be in overall good health, with no history of pituitary adenomas or other significant health issues that could affect the study’s results.
- Age: individuals must be 18 years of age or older to ensure comparability with the patient group.
- No brain or systemic disorders: individuals must have no history of brain tumors, tumors in other locations, intracranial infections, demyelinating lesions, cerebrovascular diseases, or any other major systemic disorders.
- No prior diagnosis of pituitary disorders: individuals must not have a history or diagnosis of pituitary disorders, including pituitary adenomas, as confirmed through imaging or clinical evaluation.
- Consent: informed consent must be obtained from all individuals included in the reference group.
- Presence of health issues: individuals with significant health conditions, including pituitary disorders, brain tumors, or major systemic diseases, were excluded.
- Age restrictions: individuals younger than 18 years were excluded to match the age range of the patient group.
- History of pituitary or brain disorders: individuals with a history of pituitary disorders, brain tumors, or other relevant conditions were excluded.
- Informed consent: individuals who did not provide informed consent were excluded from the reference group.
2.5. Statistical Analysis
2.6. Strengths and Limitations of the Study
3. Results
Ki-67 Labeling Index
4. Discussion
5. Conclusions
Author Contributions
Funding
Institutional Review Board Statement
Informed Consent Statement
Data Availability Statement
Conflicts of Interest
References
- Russ, S.; Anastasopoulou, C.; Shafiq, I. Pituitary Adenoma. In StatPearls [Internet]; StatPearls Publishing: Treasure Island, FL, USA, 2022. [Google Scholar]
- Daly, A.F.; Beckers, A. The Epidemiology of Pituitary Adenomas. Endocrinol. Metab. Clin. N. Am. 2020, 49, 347–355. [Google Scholar] [CrossRef] [PubMed]
- Hashmi, F.A.; Shamim, M.S. Pituitary Adenoma: A review of existing classification systems based on anatomic extension and invasion. JPMA J. Pak. Med. Assoc. 2020, 70, 368–370. [Google Scholar] [PubMed]
- Chen, X.; Pang, B.; Liang, Y.; Xu, S.C.; Xin, T.; Fan, H.T.; Yu, Y.B.; Pang, Q. Overexpression of EpCAM and Trop2 in pituitary adenomas. Int. J. Clin. Exp. Pathol. 2014, 7, 7907–7914. [Google Scholar] [PubMed]
- Jiang, X.; Zhang, X. The molecular pathogenesis of pituitary adenomas: An update. Endocrinol. Metab. 2013, 28, 245–254. [Google Scholar] [CrossRef] [PubMed]
- Cavaleri, D.; Capogrosso, C.A.; Guzzi, P.; Bernasconi, G.; Re, M.; Misiak, B.; Crocamo, C.; Bartoli, F.; Carrà, G. Blood concentrations of anterior pituitary hormones in drug-naïve people with first-episode psychosis: A systematic review and meta-analysis. Psychoneuroendocrinology 2023, 158, 1–12. [Google Scholar] [CrossRef] [PubMed]
- Chanson, P.; Raverot, G.; Castinetti, F.; Cortet-Rudelli, C.; Galland, F.; Salenave, S. Management of clinically non-functioning pituitary adenoma. In Annales D’endocrinologie; Elsevier Masson: Amsterdam, The Netherlands, 2015; Volume 76, pp. 239–247. [Google Scholar]
- Buchfelder, M. Management of aggressive pituitary adenomas: Current treatment strategies. Pituitary 2009, 12, 256–260. [Google Scholar] [CrossRef] [PubMed]
- Kontogeorgos, G. Predictive markers of pituitary adenoma behavior. Neuroendocrinology 2006, 83, 179–188. [Google Scholar] [CrossRef] [PubMed]
- Thapar, K.; Kovacs, K.; Scheithauer, B.W.; Stefaneanu, L.; Horvath, E.; Pernicone, P.J.; Murray, D.; Laws, E.R., Jr. Proliferative activity and invasiveness among pituitary adenomas and carcinomas: An analysis using the MIB-1 antibody. Neurosurgery 1996, 38, 99–107. [Google Scholar] [CrossRef]
- Fusco, A.; Zatelli, M.C.; Bianchi, A.; Cimino, V.; Tilaro, L.; Veltri, F.; Angelini, F.; Lauriola, L.; Vellone, V.; Doglietto, F.; et al. Prognostic significance of the Ki-67 labeling index in growth hormone-secreting pituitary adenomas. J. Clin. Endocrinol. Metab. 2008, 93, 2746–2750. [Google Scholar] [CrossRef]
- Reisine, T.; Bell, G.I. Molecular biology of somatostatin receptors. Endocr. Rev. 1995, 16, 427–442. [Google Scholar]
- Shimon, I. Somatostatin receptors in pituitary and development of somatostatin receptor subtype-selective analogs. Endocrine 2003, 20, 265–269. [Google Scholar] [CrossRef]
- Pedraza-Arevalo, S.; Ibáñez-Costa, A.; Blázquez-Encinas, R.; Branco, M.R.; Vázquez-Borrego, M.C.; Herrera-Martínez, A.D.; Castaño, J.P. Epigenetic and post-transcriptional regulation of somatostatin receptor subtype 5 (SST5) in pituitary and pancreatic neuroendocrine tumors. Mol. Oncol. 2022, 16, 764–779. [Google Scholar] [CrossRef]
- Si, Y.; Kim, S.; Ou, J.; Lu, Y.; Ernst, P.; Chen, K.; Liu, X.M. Anti-SSTR2 antibody-drug conjugate for neuroendocrine tumor therapy. Cancer Gene Ther. 2021, 28, 799–812. [Google Scholar] [CrossRef] [PubMed]
- Daly, A.F.; Vanbellinghen, J.F.; Khoo, S.K.; Jaffrain-Rea, M.L.; Naves, L.A.; Guitelman, M.A.; Murat, A.; Emy, P.; Gimenez-Roqueplo, A.P.; Tamburrano, G.; et al. Aryl hydrocarbon receptor-interacting protein gene mutations in familial isolated pituitary adenomas: Analysis in 73 families. J. Clin. Endocrinol. Metab. 2007, 92, 1891–1896. [Google Scholar] [CrossRef]
- Igreja, S.; Chahal, H.S.; King, P.; Bolger, G.B.; Srirangalingam, U.; Guasti, L.; Chapple, J.P.; Trivellin, G.; Gueorguiev, M.; Guegan, K.; et al. Characterization of aryl hydrocarbon receptor-interacting protein (AIP) mutations in familial isolated pituitary adenoma families. Hum. Mutat. 2010, 31, 950–960. [Google Scholar] [CrossRef] [PubMed]
- Chahal, H.S.; Chapple, J.P.; Frohman, L.A.; Grossman, A.B.; Korbonits, M. Clinical, genetic and molecular characterization of patients with familial isolated pituitary adenomas (FIPA). Trends Endocrinol. Metab. TEM 2010, 21, 419–427. [Google Scholar] [CrossRef]
- Korbonits, M.; Storr, H.; Kumar, A.V. Familial pituitary adenomas—Who should be tested for AIP mutations? Clin. Endocrinol. 2012, 77, 351–356. [Google Scholar] [CrossRef] [PubMed]
- Ciganoka, D.; Balcere, I.; Kapa, I.; Peculis, R.; Valtere, A.; Nikitina-Zake, L.; Klovins, J. Identification of somatostatin receptor type 5 gene polymorphisms associated with acromegaly. Eur. J. Endocrinol. 2011, 165, 517–525. [Google Scholar] [CrossRef] [PubMed]
- Salehi, F.; Agur, A.; Scheithauer, B.W.; Kovacs, K.; Lloyd, R.V.; Cusimano, M. Ki-67 in pituitary neoplasms: A review–part I. Neurosurgery 2009, 65, 429–437. [Google Scholar] [CrossRef]
- Grimm, F.; Maurus, R.; Beschorner, R.; Naros, G.; Stanojevic, M.; Gugel, I.; Giese, S.; Bier, G.; Bender, B.; Honegger, J. Ki-67 labeling index and expression of p53 are non-predictive for invasiveness and tumor size in functional and nonfunctional pituitary adenomas. Acta Neurochir. 2019, 161, 1149–1156. [Google Scholar] [CrossRef]
- Trouillas, J.; Roy, P.; Sturm, N.; Dantony, E.; Cortet-Rudelli, C.; Viennet, G.; Bonneville, J.F.; Assaker, R.; Auger, C.; Brue, T. A new prognostic clinicopathological classification of pituitary adenomas: A multicentric case-control study of 410 patients with 8 years post-operative follow-up. Acta Neuropathol. 2013, 126, 123–135. [Google Scholar] [CrossRef] [PubMed]
- Chatzellis, E.; Alexandraki, K.I.; Androulakis, I.I.; Kaltsas, G. Aggressive pituitary tumors. Neuroendocrinology 2015, 101, 87–104. [Google Scholar] [CrossRef] [PubMed]
- Petry, C.; Poli, J.H.Z.; de Azevedo Dossin, I.; Rech, C.G.S.L.; Pereira Lima, J.F.S.; Ferreira, N.P.; da Costa Oliveira, M. Evaluation of the potential of the Ki67 index to predict tumor evolution in patients with pituitary adenoma. Int. J. Clin. Exp. Pathol. 2019, 12, 320–326. [Google Scholar] [PubMed]
- Padrão, I.L. Pituitary Adenomas: A Clinical, Morphological and Morphometric Study: Searching for Prognostic Factors with the Immunohistochemical Method. Ph.D Thesis, Universidade of Campinas, São Paulo, Brazil, 2007. Available online: http://repositorio.unicamp.br/jspui/handle/REPOSIP/311565 (accessed on 10 August 2016).
- Magagna-Poveda, A.; Leske, H.; Schmid, C.; Bernays, R.; Rushing, E.J. Expression of somatostatin receptors, angiogenesis and proliferation markers in pituitary adenomas: An immunohistochemical study with diagnostic and therapeutic implications. Swiss Med. Wkly. 2013, 143, w13895. [Google Scholar] [CrossRef] [PubMed]
- Madsen, H.; Borges, T.M.; Knox, A.J.; Michaelis, K.A.; Xu, M.; Lillehei, K.O.; Wierman, M.E.; Kleinschmidt-DeMasters, B.K. Giant pituitary adenomas: Pathologic-radiographic correlations and lack of role for p53 and MIB-1 labeling. Am. J. Surg. Pathol. 2011, 35, 1204–1213. [Google Scholar] [CrossRef] [PubMed]
- Sánchez-Tejada, L.; Sánchez-Ortiga, R.; Moreno-Pérez, O.; Montañana, C.F.; Niveiro, M.; Tritos, N.A.; Alfonso, A.M. Pituitary tumor transforming gene and insulin-like growth factor 1 receptor expression and immunohistochemical measurement of Ki-67 as potential prognostic markers of pituitary tumors aggressiveness. Endocrinol. Nutr. 2003, 60, 358–367. [Google Scholar] [CrossRef] [PubMed]
- Patel, Y.C. Somatostatin and its receptor family. Front. Neuroendocrinol. 1999, 20, 157–198. [Google Scholar] [CrossRef] [PubMed]
- Neto, L.V.; Machado Ede, O.; Luque, R.M.; Taboada, G.F.; Marcondes, J.B.; Chimelli, L.M.; Gadelha, M.R. Expression analysis of dopamine receptor subtypes in normal human pituitaries, nonfunctioning pituitary adenomas and somatotropinomas, and the association between dopamine and somatostatin receptors with clinical response to octreotide-LAR in acromegaly. J. Clin. Endocrinol. Metab. 2009, 94, 1931–1937. [Google Scholar] [CrossRef]
- Wildemberg, L.E.; Vieira Neto, L.; Costa, D.F.; Nasciuti, L.E.; Takiya, C.M.; Alves, L.M.; Gadelha, M.R. Low somatostatin receptor subtype 2, but not dopamine receptor subtype 2, expression predicts the lack of biochemical response of somatotropinomas to treatment with somatostatin analogs. J. Endocrinol. Investig. 2013, 36, 38–43. [Google Scholar]
- Wildemberg, L.E.; Vieira Neto, L.; Costa, D.F.; Nasciutti, L.E.; Takiya, C.M.; Alves, L.M.; Gadelha, M.R. Validation of immunohistochemistry for somatostatin receptor subtype 2A in human somatotropinomas: Comparison between quantitative real time RT-PCR and immunohistochemistry. J. Endocrinol. Investig. 2012, 35, 580–584. [Google Scholar]
- Syro, L.V.; Sundsbak, J.L.; Scheithauer, B.W.; Toledo, R.A.; Camargo, M.; Heyer, C.M.; Sekiya, T.; Uribe, H.; Escobar, J.I.; Vasquez, M.; et al. Somatotroph pituitary adenoma with acromegaly and autosomal dominant polycystic kidney disease: SSTR5 polymorphism and PKD1 mutation. Pituitary 2012, 15, 342–349. [Google Scholar] [CrossRef] [PubMed]
- Peculis, R.; Balcere, I.; Rovite, V.; Megnis, K.; Valtere, A.; Stukens, J.; Arnicane, L.; Nikitina-Zake, L.; Lejnieks, A.; Pirags, V.; et al. Polymorphisms in MEN1 and DRD2 genes are associated with the occurrence and characteristics of pituitary adenomas. Eur. J. Endocrinol. 2016, 175, 145–153. [Google Scholar] [CrossRef]
- Pisarek, H.; Pawlikowski, M.; Kunert-Radek, J.; Radek, M. Expression of somatostatin rece-ptor subtypes in human pituitary adenomas-immunohistochemical studies. Endokrynol. Pol. 2009, 60, 240–251. [Google Scholar]
- Taboada, G.F.; Luque, R.M.; Bastos, W.; Guimaraes, R.F.; Marcondes, J.B.; Chimelli, L.M.; Gadelha, M.R. Quantitative analysis of somatostatin receptor subtype (SSTR1-5) gene expression levels in somatotrophinomas and non-functioning pituitary adenomas. Eur. J. Endocrinol. 2007, 156, 65–74. [Google Scholar] [CrossRef] [PubMed]
- Horiguchi, K.; Yamada, M.; Umezawa, R.; Satoh, T.; Hashimoto, K.; Tosaka, M.; Yamada, S.; Mori, M. Somatostatin receptor subtypes mRNA in TSH-secreting pituitary adenomas: A case showing a dramatic reduction in tumor size during short octreotide treatment. Endocr J. 2007, 54, 371–378. [Google Scholar] [CrossRef]
- Hassaneen, W.; Cahill, D.P.; Fuller, G.N.; Levine, N.B. Immunohistochemical detection of somatostatin receptor subtype 5 (SSTR-5) in cushing adenoma. J. Neurooncol. 2010, 98, 151–152. [Google Scholar] [CrossRef]
- Tateno, T.; Kato, M.; Tani, Y.; Oyama, K.; Yamada, S.; Hirata, Y. Differential expression of somatostatin and dopamine receptor subtype genes in adrenocorticotropin (ACTH)-secreting pituitary tumors and silent corticotroph adenomas. Endocr. J. 2009, 56, 579–584. [Google Scholar] [CrossRef] [PubMed]
- Tahir, A.; Chahal, H.S.; Korbonits, M. Chapter 10—Molecular Genetics of the Aip Gene in Familial Pituitary Tumorigenesis. In Progress in Brain Research; Elsevier: Amsterdam, The Netherlands, 2010; Volume 182. [Google Scholar]
- Vierimaa, O.; Georgitsi, M.; Lehtonen, R.; Vahteristo, P.; Kokko, A.; Raitila, A.; Tuppurainen, K.; Ebeling, T.M.; Salmela, P.I.; Paschke, R.; et al. Pituitary adenoma predisposition caused by germline mutations in the AIP gene. Science 2006, 312, 1228–1230. [Google Scholar] [CrossRef]
- (Beckers, A.; Aaltonen, L.A.; Daly, A.F.; Karhu, A. Familial isolated pituitary adenomas (FIPA) and the pituitary adenoma predSchmidisposition due to mutations in the aryl hydrocarbon receptor interacting protein (AIP) gene. Endocr. Rev. 2013, 34, 239–277. [Google Scholar] [CrossRef]
- Cazabat, L.; Bouligand, J.; Salenave, S.; Bernier, M.; Gaillard, S.; Parker, F.; Young, J.; Guiochon-Mantel, A.; Chanson, P. Germline AIP mutations in apparently sporadic pituitary adenomas: Prevalence in a prospective single-center cohort of 443 patients. J. Clin. Endocrinol. Metab. 2012, 97, E663–E670. [Google Scholar] [CrossRef]
- Georgitsi, M.; Heliovaara, E.; Paschke, R.; Kumar, A.V.; Tischkowitz, M.; Vierimaa, O.; Salmela, P.; Sane, T.; De Menis, E.; Cannavo, S.; et al. Large genomic deletions in AIP in pituitary adenoma predisposition. J. Clin. Endocrinol. Metab. 2008, 93, 4146–4151. [Google Scholar] [CrossRef] [PubMed]
- Leontiou, C.A.; Gueorguiev, M.; van der Spuy, J.; Quinton, R.; Lolli, F.; Hassan, S.; Chahal, H.S.; Igreja, S.C.; Jordan, S.; Rowe, J.; et al. The role of the aryl hydrocarbon receptor-interacting protein gene in familial and sporadic pituitary adenomas. J. Clin. Endocrinol. Metab. 2008, 93, 2390–2401. [Google Scholar] [CrossRef] [PubMed]
- Tichomirowa, M.A.; Barlier, A.; Daly, A.F.; Jaffrain-Rea, M.L.; Ronchi, C.; Yaneva, M.; Urban, J.D.; Petrossians, P.; Elenkova, A.; Tabarin, A.; et al. High prevalence of AIP gene mutations following focused screening in young patients with sporadic pituitary macroadenomas. Eur. J. Endocrinol. 2011, 165, 509–515. [Google Scholar] [CrossRef] [PubMed]
- Cuny, T.; Pertuit, M.; Sahnoun-Fathallah, M.; Daly, A.; Occhi, G.; Odou, M.F.; Tabarin, A.; Nunes, M.L.; Delemer, B.; Rohmer, V.; et al. Genetic analysis in young patients with sporadic pituitary macroadenomas: Besides AIP don’t forget MEN1 genetic analysis. Eur. J. Endocrinol. 2013, 168, 533–541. [Google Scholar] [CrossRef] [PubMed]
- Zhou, Y.; Zhang, X.; Klibanski, A. Genetic and epigenetic mutations of tumor suppressive genes in sporadic pituitary adenoma. Mol. Cell. Endocrinol. 2014, 386, 16–33. [Google Scholar] [CrossRef] [PubMed]
- Trivellin, G.; Korbonits, M. AIP and its interacting partners. J. Endocrinol. 2011, 210, 137–155. [Google Scholar] [CrossRef] [PubMed]
- Buchbinder, S.; Bierhaus, A.; Zorn, M.; Nawroth, P.P.; Humpert, P.; Schilling, T. Aryl hydrocarbon receptor interacting protein gene (AIP) mutations are rare in patients with hormone secreting or non-secreting pituitary adenomas. Exp. Clin. Endocrinol. Diabetes 2008, 116, 625–628. [Google Scholar] [CrossRef]
- Barlier, A.; Vanbellinghen, J.F.; Daly, A.F.; Silvy, M.; Jaffrain-Rea, M.L.; Trouillas, J.; Tamagno, G.; Cazabat, L.; Bours, V.; Brue, T.; et al. Mutations in the aryl hydrocarbon receptor interacting protein gene are not highly prevalent among subjects with sporadic pituitary adenomas. J. Clin. Endocrinol. Metab. 2007, 92, 1952–1955. [Google Scholar] [CrossRef]

| Characteristics | Group | p-Value | ||
|---|---|---|---|---|
| PA Group | Reference Group | |||
| Gender | Males, N (%) | 52 (40.6) | 86 (31.6) | 0.077 * |
| Females, N (%) | 76 (59.4) | 186 (68.4) | ||
| Age, Median (IQR) | 54.5 (20) | 56.0 (40) | 0.821 ** | |
| Recurrence: Absent/Present | 88/39 | NA | - | |
| Invasiveness: Invasive/Noninvasive | 81/46 | NA | - | |
| Size: Micro/Macro | 49/78 | NA | - | |
| Activity: | NA | - | ||
| Active PA/Nonactive PA | 61/66 | |||
| Prolactin producing PA | 48 | |||
| IGF1 producing PA | 3 | |||
| GF producing PA | 6 | |||
| ACTH producing PA | 4 | |||
| Ki-67: | NA | - | ||
| <1% | 53 | |||
| 1% | 11 | |||
| >1% | 15 | |||
| Gene, SNP | Genotype, Allele | PA Group, n (%) | Reference Group, n (%) | p-Value |
|---|---|---|---|---|
| SSTR2 rs2236750 | AA | 43 (33.6) | 118 (43.4) | |
| AG | 73 (57.0) | 126 (46.3) | 0.125 | |
| GG | 12 (9.4) | 28 (10.3) | ||
| Total | 128 (100) | 272 (100) | ||
| Allele | ||||
| A | 159 (62.1) | 362 (66.5) | 0.220 | |
| G | 97 (37.9) | 182 (33.5) | ||
| SSTR5 rs34037914 | CC | 114 (89.1) | 238 (87.5) | |
| CT | 12 (9.4) | 33 (12.1) | 0.322 | |
| TT | 2 (1.6) | 1 (0.4) | ||
| Total | 128 (100) | 272 (100) | ||
| Allele | ||||
| C | 240 (93.8) | 509 (93.6) | 0.921 | |
| T | 16 (6.2) | 35 (6.4) | ||
| AIP rs267606574 | TAC | 128 (100) | 272 (100) | |
| Total | 128 (100) | 272 (100) | 1.000 | |
| Allele | ||||
| T | 128 (33.3) | 272 (33.3) | ||
| A | 128 (33.3) | 272 (33.3) | 1.000 | |
| C | 128 (33.3) | 272 (33.3) |
| Gene and SNP | Allele Frequencies | Genotype Distribution | p-Value | |
|---|---|---|---|---|
| SSTR2 rs2236750 | 0.67 A | 0.33 G | 28/126/118 | 0.505 |
| SSTR5 rs34037914 | 0.94 C | 0.06 T | 1/33/238 | 0.899 |
| AIP rs267606574 | NA | NA | 0/0/272 | NA |
| Model | Genotype/Allele | OR (95% CI) | p-Value | AIC |
|---|---|---|---|---|
| SSTR2 rs2236750 | ||||
| Co-dominant | AG vs. AA GG vs. AA | 1.602 (1.015–2.527) 1.170 (0.543–2.522) | 0.043 0.688 | 498.138 |
| Dominant | AG + GG vs. AA | 1.524 (0.980–2.371) | 0.062 | 496.848 |
| Recessive | AA vs. GG + AG | 0.890 (0.435–1.822) | 0.749 | 500.300 |
| Over-dominant | AG vs. AA + GG | 1.550 (1.013–2.373) | 0.044 | 496.298 |
| Adityve | G | 1.241 (0.892–1.725) | 0.200 | 498.760 |
| SSTR5 rs34037914 | ||||
| Co-dominant | CT vs. CC TT vs. CC | 0.781 (0.387–1.576) 4.348 (0.384–49.187) | 0.490 0.235 | 500.343 |
| Dominant | CT + TT vs. CC | 0.887 (0.456–1.725) | 0.724 | 500.277 |
| Recessive | TT vs. CC + CT | 4.447 (0.393–50.299) | 0.228 | 498.834 |
| Over-dominant | CT vs. CC + TT | 0.772 (0.383–1.557) | 0.470 | 499.865 |
| Adityve | T | 0.999 (0.550–1.814) | 0.997 | 500.404 |
| Gene, SNP | Genotype, Allele | PA Group Females, n (%) | Reference Group Females, n (%) | p-Value |
|---|---|---|---|---|
| SSTR2 rs2236750 | AA | 24 (31.6) | 82 (44.1) | 0.171 |
| AG | 44 (57.9) | 87 (46.8) | ||
| GG | 8 (10.5) | 17 (9.1) | ||
| Total | 76 (100) | 186 (100) | ||
| Allele | ||||
| A | 92 (60.5) | 251 (67.5) | 0.129 | |
| G | 60 (39.5) | 121 (32.5) | ||
| SSTR5 rs34037914 | CC | 64 (84.2) | 163 (87.6) | |
| CT | 10 (13.2) | 23 (12.4) | 0.082 | |
| TT | 2 (2.6) | 0 (0) | ||
| Total | 76 (100) | 186 (100) | ||
| Allele | ||||
| C | 138 (90.8) | 349 (93.8) | 0.219 | |
| T | 14 (9.2) | 23 (6.2) |
| Gene, SNP | Genotype, Allele | PA Group Males, n (%) | Reference Group Males, n (%) | p-Value |
|---|---|---|---|---|
| SSTR2 rs2236750 | AA | 19 (36.5) | 36 (41.9) | 0.423 |
| AG | 29 (55.8) | 39 (45.3) | ||
| GG | 4 (7.7) | 11 (12.8) | ||
| Total | 52 (100) | 86 (100) | ||
| Allele | ||||
| A | 67 (64.4) | 111 (64.5) | 0.984 | |
| G | 37 (35.6) | 61 (35.5) | ||
| SSTR5 rs34037914 | CC | 50 (96.2) | 75 (87.2) | 0.207 |
| CT | 2 (3.8) | 10 (11.6) | ||
| TT | 0 (0) | 1 (1.2) | ||
| Total | 52 (100) | 86 (100) | ||
| Allele | ||||
| C | 102 (98.1) | 160 (93) | 0.063 | |
| T | 2 (1.9) | 12 (7) |
| Model | Genotype/Allele | OR (95% CI) | p-Value | AIC |
|---|---|---|---|---|
| SSTR2 rs2236750 | ||||
| Co-dominant | AG vs. AA GG vs. AA | 1.722 (0.962–3.083) 1.600 (0.615–4.164) | 0.067 0.335 | 315.898 |
| Dominant | AG + GG vs. AA | 1.702 (0.968–2.993) | 0.065 | 313.923 |
| Recessive | AA vs. GG + AG | 1.165 (0.480–2.828) | 0.735 | 317.324 |
| Over-dominant | AG vs. AA + GG | 1.560 (0.910–2.675) | 0.106 | 314.796 |
| Adityve | G | 1.402 (0.923–2.131) | 0.114 | 314.927 |
| SSTR5 rs34037914 | ||||
| Co-dominant | CT vs. CC TT vs. CC | 1.117 (0.502–2.486) - | 0.786 0.999 | 314.452 |
| Dominant | CT + TT vs. CC | 1.345 (0.630–2.869) | 0.444 | 316.864 |
| Recessive | TT vs. CC + CT | - | 0.999 | 312.525 |
| Over-dominant | CT vs. CC + TT | 1.088 (0.490–2.420) | 0.835 | 317.394 |
| Adityve | T | 1.526 (0.771–3.023) | 0.225 | 316.008 |
| Model | Genotype/Allele | OR (95% CI) | p-Value | AIC |
|---|---|---|---|---|
| SSTR2 rs2236750 | ||||
| Co-dominant | AG vs. AA GG vs. AA | 1.449 (0.690–3.044) 0.736 (0.202–2.685) | 0.327 0.643 | 184.776 |
| Dominant | AG + GG vs. AA | 1.305 (0.635–2.682) | 0.468 | 183.976 |
| Recessive | AA vs. GG + AG | 0.591 (0.176–1.990) | 0.396 | 183.743 |
| Over-dominant | AG vs. AA + GG | 1.544 (0.770–3.096) | 0.221 | 182.996 |
| Adityve | G | 1.039 (0.605–1.786) | 0.889 | 184.486 |
| SSTR5 rs34037914 | ||||
| Co-dominant | CT vs. CC TT vs. CC | 0.295 (0.062–1.408) - | 0.126 1 | 182.751 |
| Dominant | CT + TT vs. CC | 0.271 (0.058–1.278) | 0.099 | 181.054 |
| Recessive | TT vs. CC + CT | - | 1 | 183.649 |
| Over-dominant | CT vs. CC + TT | 0.298 (0.062–1.422) | 0.129 | 181.656 |
| Adityve | T | 0.279 (0.062–1.267) | 0.098 | 180.844 |
| Gene, SNP | Genotype, Allele | Reference Group, n (%) | Micro-PA Group, n (%) | Macro-PA Group, n (%) | p-Value |
|---|---|---|---|---|---|
| SSTR2 rs2236750 | AA | 118 (43.4) | 18 (38.3) | 25 (30.9) | 0.423 * |
| AG | 126 (46.3) | 25 (53.2) | 48 (59.3) | 0.103 ** | |
| GG | 28 (10.3) | 4 (8.5) | 8 (9.9) | 0.691 *** | |
| Total | 272 (100) | 47 (100) | 81 (100) | ||
| Allele | 0.754 * | ||||
| A | 362 (66.5) | 61 (64.9) | 98 (60.5) | 0.156 ** | |
| G | 182 (33.5) | 33 (35.1) | 64 (39.5) | 0.484 *** | |
| SSTR5 rs34037914 | CC | 238 (87.5) | 42 (89.4) | 72 (88.9) | 0.022 * |
| CT | 33 (12.1) | 3 (6.4) | 9 (11.1) | 0.833 ** | |
| TT | 1 (0.4) | 2 (4.3) | 0 (0.0) | 0.125 *** | |
| Total | 272 (100) | 47 (100) | 81 (100) | ||
| Allele | 0.715 * | ||||
| C | 509 (93.6) | 87 (92.6) | 153 (94.4) | 0.685 ** | |
| T | 35 (6.4) | 7 (7.4) | 9 (5.6) | 0.547 *** |
| Model | Genotype/Allele | OR (95% CI) | p-Value | AIC |
|---|---|---|---|---|
| Micro-PA | ||||
| SSTR2 rs2236750 | ||||
| Co-dominant | AG vs. AA GG vs. AA | 1.301 (0.675–2.506) 0.937 (0.294–2.985) | 0.432 0.912 | 269.952 |
| Dominant | AG + GG vs. AA | 1.234 (0.654–2.330) | 0.516 | 268.295 |
| Recessive | AA vs. GG + AG | 0.811 (0.271–2.427) | 0.708 | 268.575 |
| Over-dominant | AG vs. AA + GG | 1.317 (0708–2.449) | 0.385 | 267.965 |
| Adityve | G | 1.081 (0.673–1.737) | 0.747 | 268.618 |
| SSTR5 rs34037914 | ||||
| Co-dominant | CT vs. CC TT vs. CC | 0.515 (0.151–1.756) 11.333 (1.005–127.806) | 0.289 0.050 | 265.188 |
| Dominant | CT + TT vs. CC | 0.833 (0.308–2.253) | 0.719 | 268.588 |
| Recessive | TT vs. CC + CT | 12.044 (1.070–135.599) | 0.044 | 264.500 |
| Over-dominant | CT vs. CC + TT | 0.494 (0.145–1.681) | 0.259 | 267.217 |
| Adityve | T | 1.156 (0.515–2.593) | 0.726 | 268.602 |
| Macro-PA | ||||
| SSTR2 rs2236750 | ||||
| Co-dominant | AG vs. AA GG vs. AA | 1.798 (1.043–3.100) 1.349 (0.550–3.305) | 0.035 0.513 | 379.660 |
| Dominant | AG + GG vs. AA | 1.716 (1.011–2.913) | 0.045 | 378.113 |
| Recessive | AA vs. GG + AG | 0.955 (0.417–2.186) | 0.913 | 282.257 |
| Over-dominant | AG vs. AA + GG | 1.685 (1.019–2.788) | 0.042 | 378.074 |
| Adityve | G | 1.333 (0.911–0.952) | 0.139 | 380.090 |
| SSTR5 rs34037914 | ||||
| Co-dominant | CT vs. CC TT vs. CC | 0.902 (0.412–1.972) - | 0.795 - | 383.679 |
| Dominant | CT + TT vs. CC | 0.875 (0.401–1.910) | 0.737 | 382.155 |
| Recessive | TT vs. CC + CT | - | - | - |
| Over-dominant | CT vs. CC + TT | 0.905 (0.414–1.980) | 0.803 | 382.206 |
| Adityve | T | 0.853 (0.399–1.826) | 0.682 | 382.097 |
| Gender | Serum Level (pg/mL) | p-Value | |
|---|---|---|---|
| PA Group Mean (Std. Deviation) | Reference Group Mean (Std. Deviation) | ||
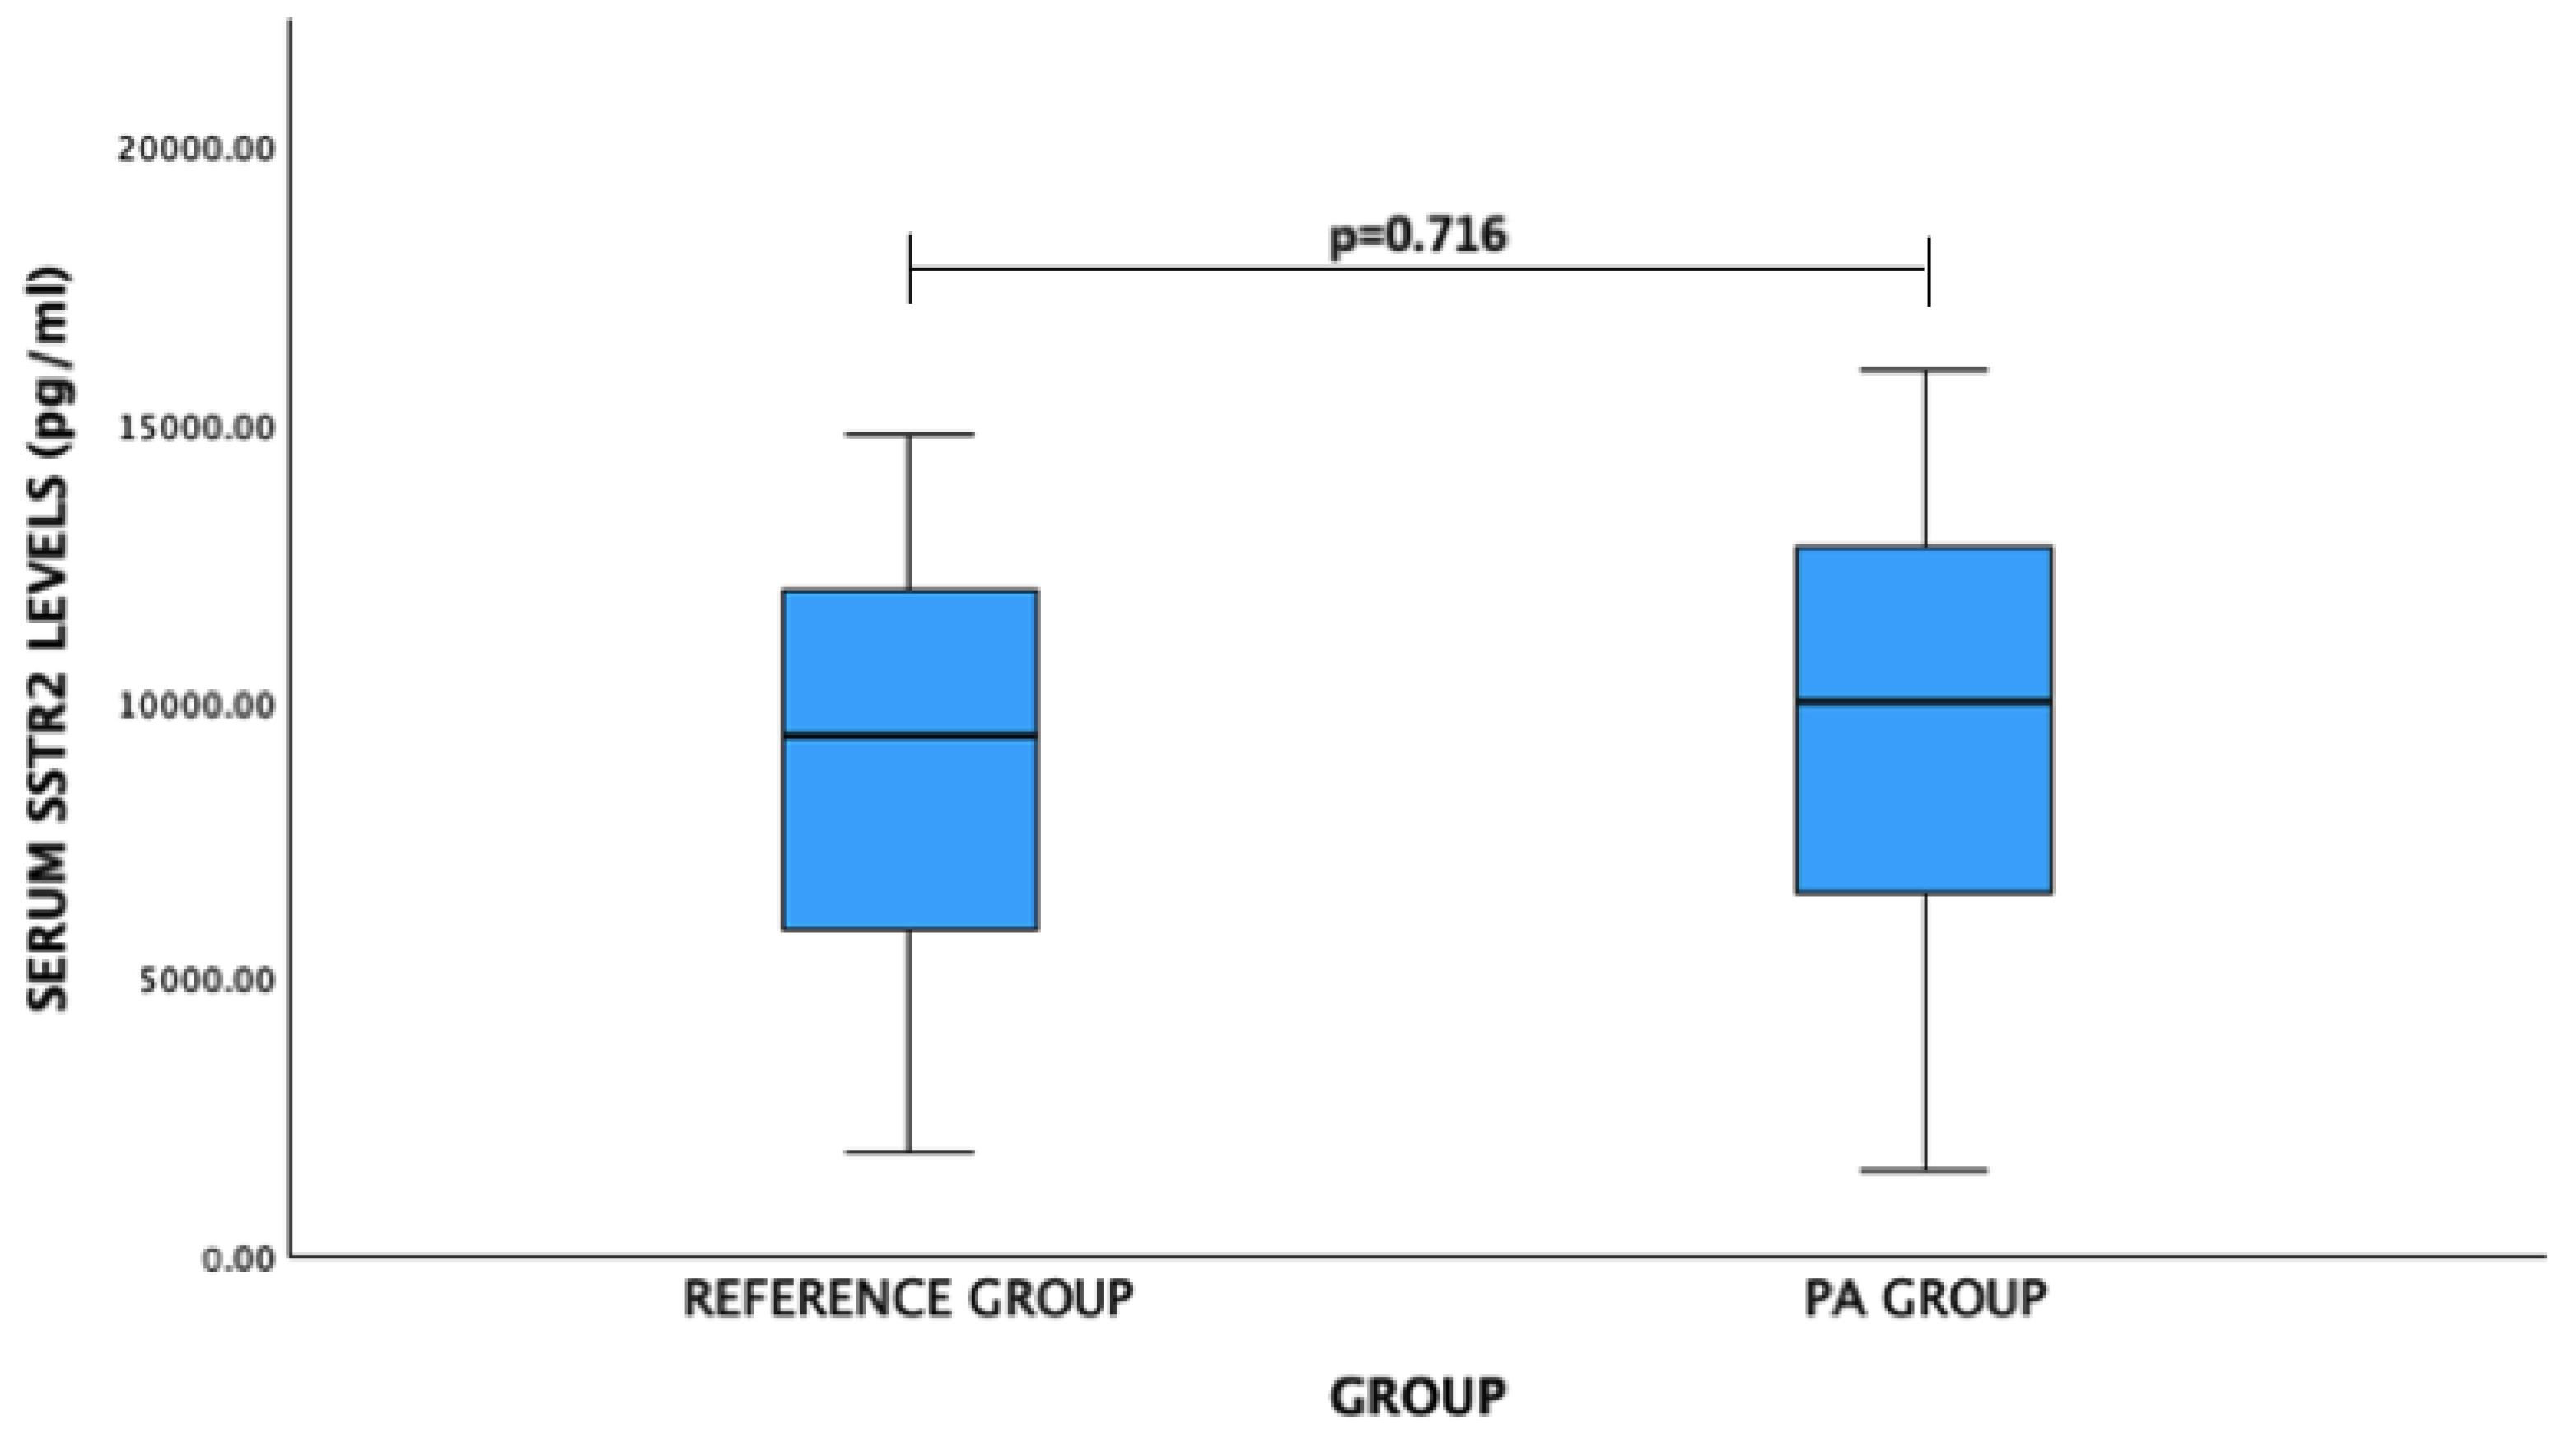
| SSTR2 | |||
| Male | 9643.05 (3797.57) | 8004.66 (3660.49) | 0.122 |
| Female | 9159.36 (4819.88) | 9501.08 (3581.27) | 0.778 |
| Gender | Serum Level (pg/mL) | p-Value | |
|---|---|---|---|
| PA Group Median (IQR) | Reference Group Median (IQR) | ||
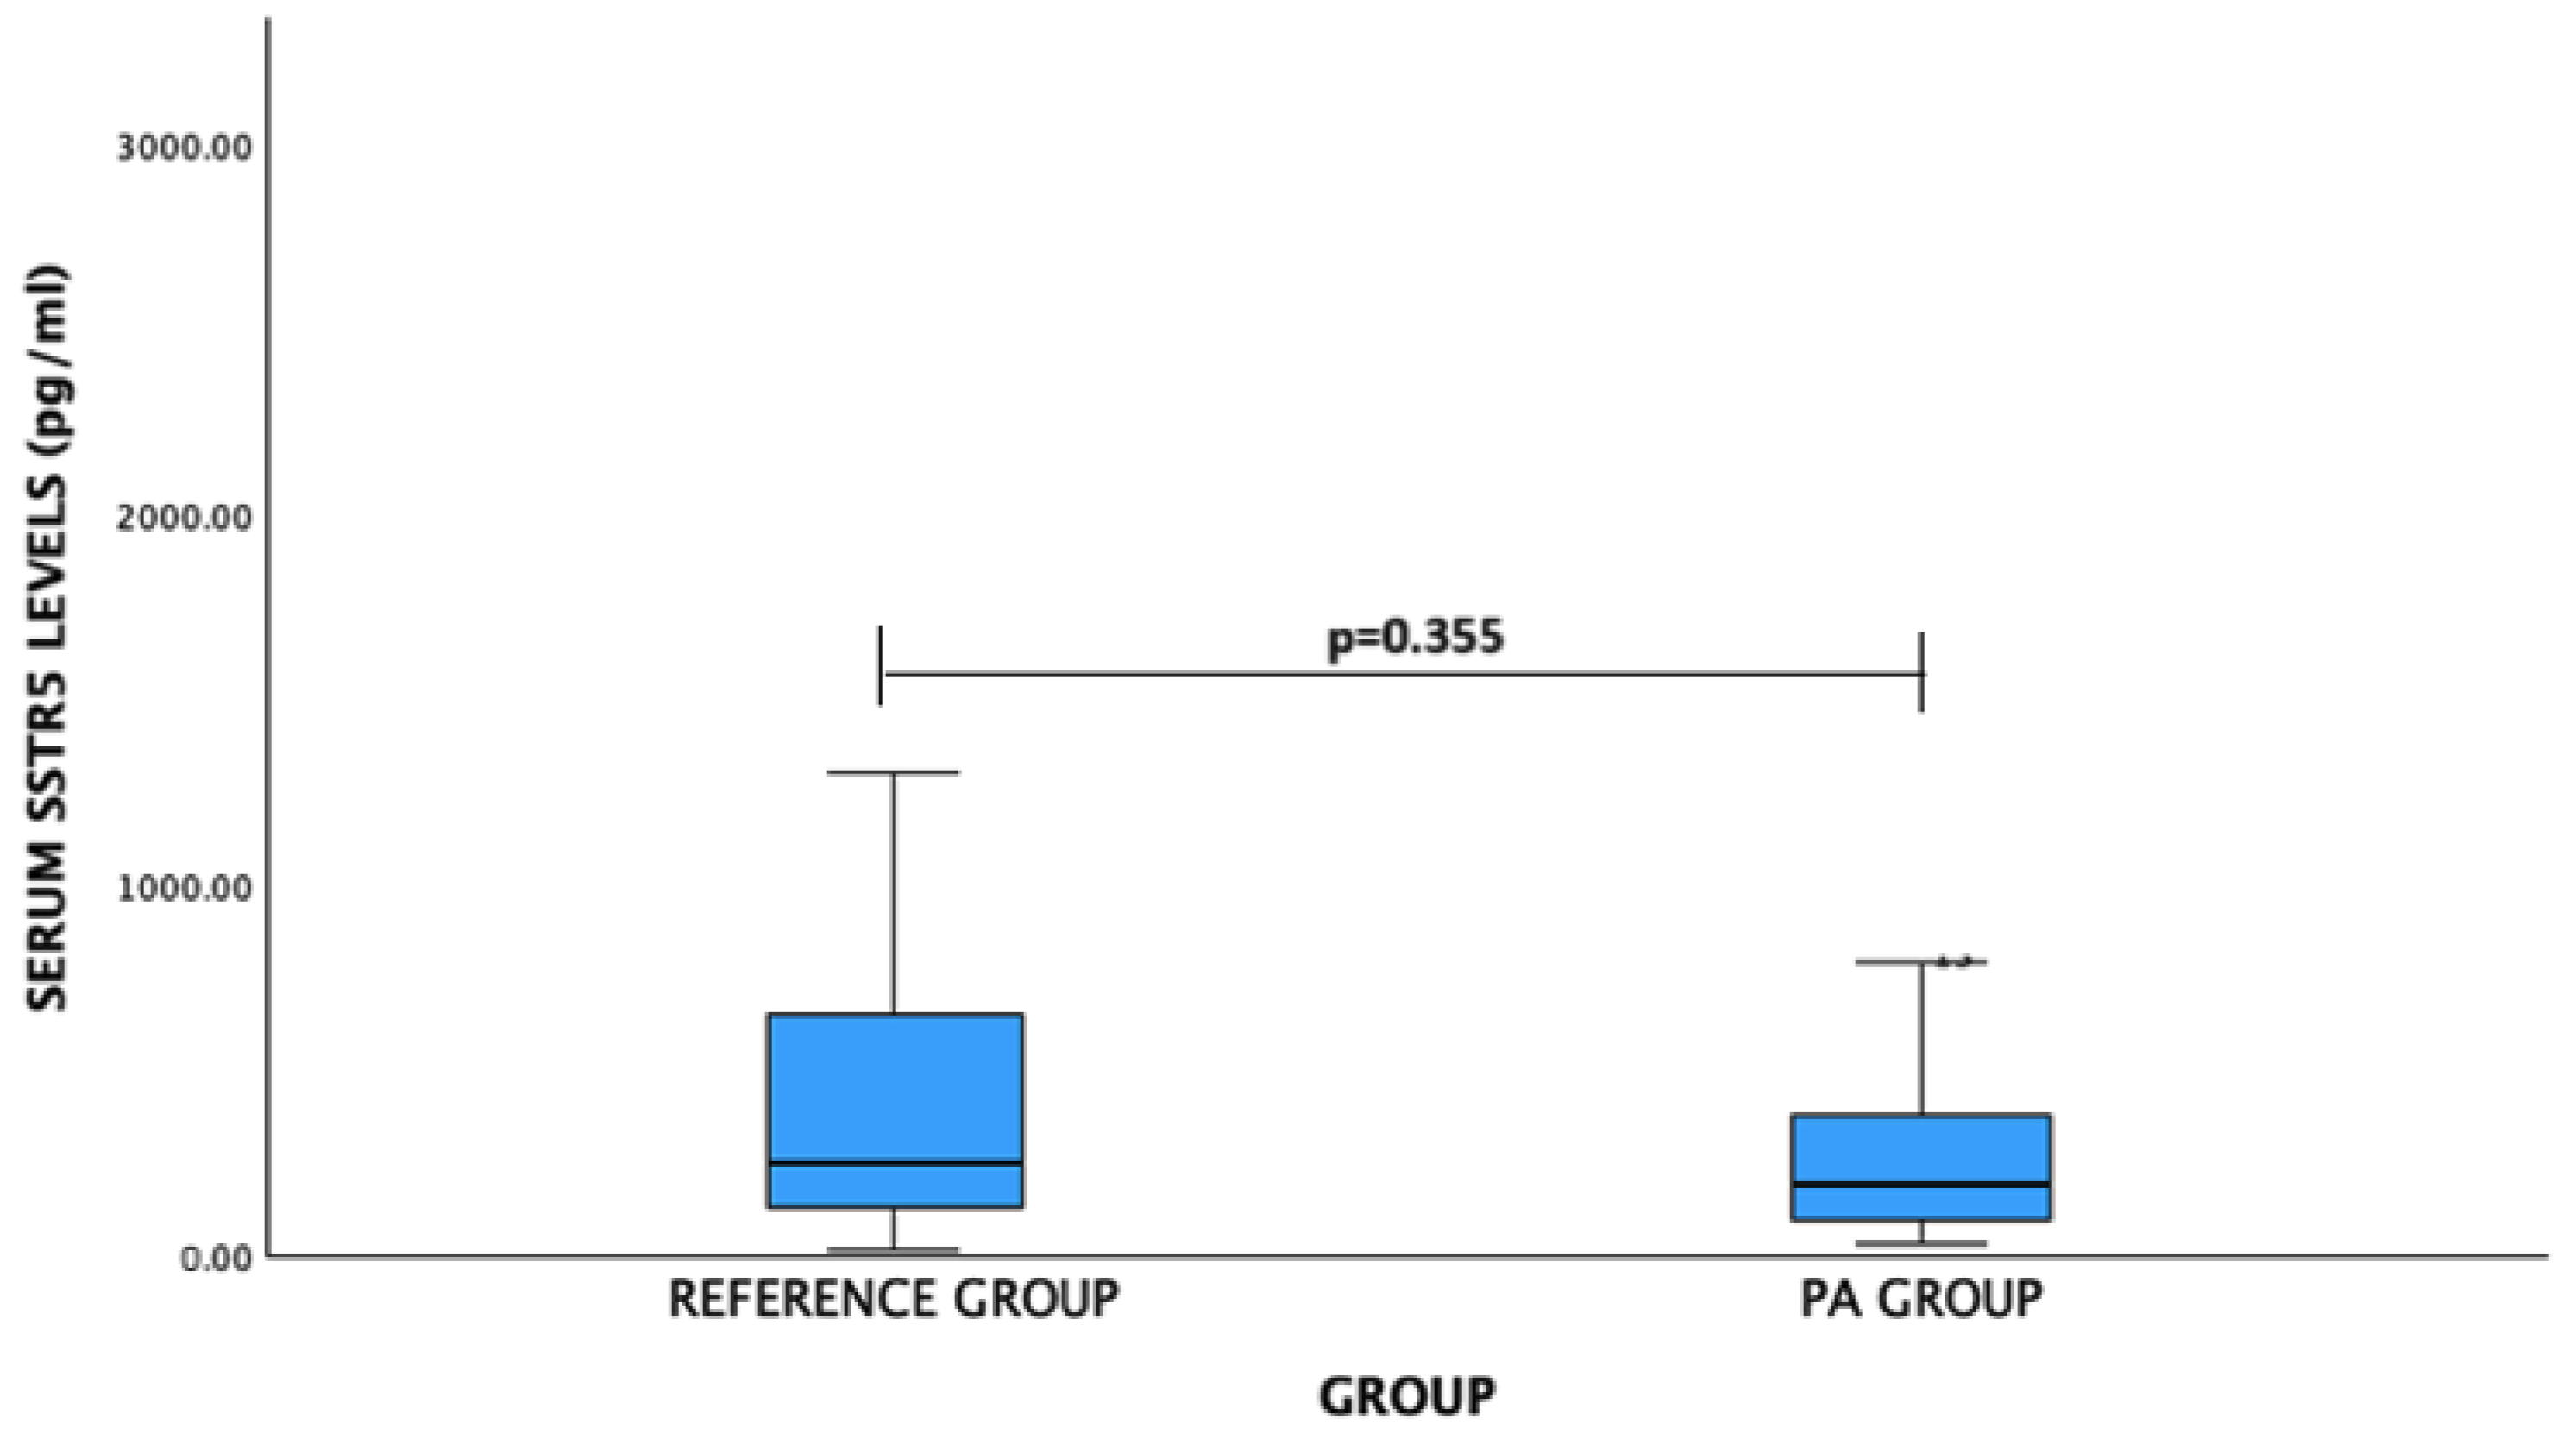
| SSTR5 | |||
| Male | 190.75 (209.98) | 247.74 (201.46) | 0.490 |
| Female | 197.56 (396.82) | 255.09 (746.07) | 0.675 |
| Gender | Serum Level (ng/mL) | p-Value | |
|---|---|---|---|
| PA Group Mean (Std. Deviation) | Reference Group Mean (Std. Deviation) | ||
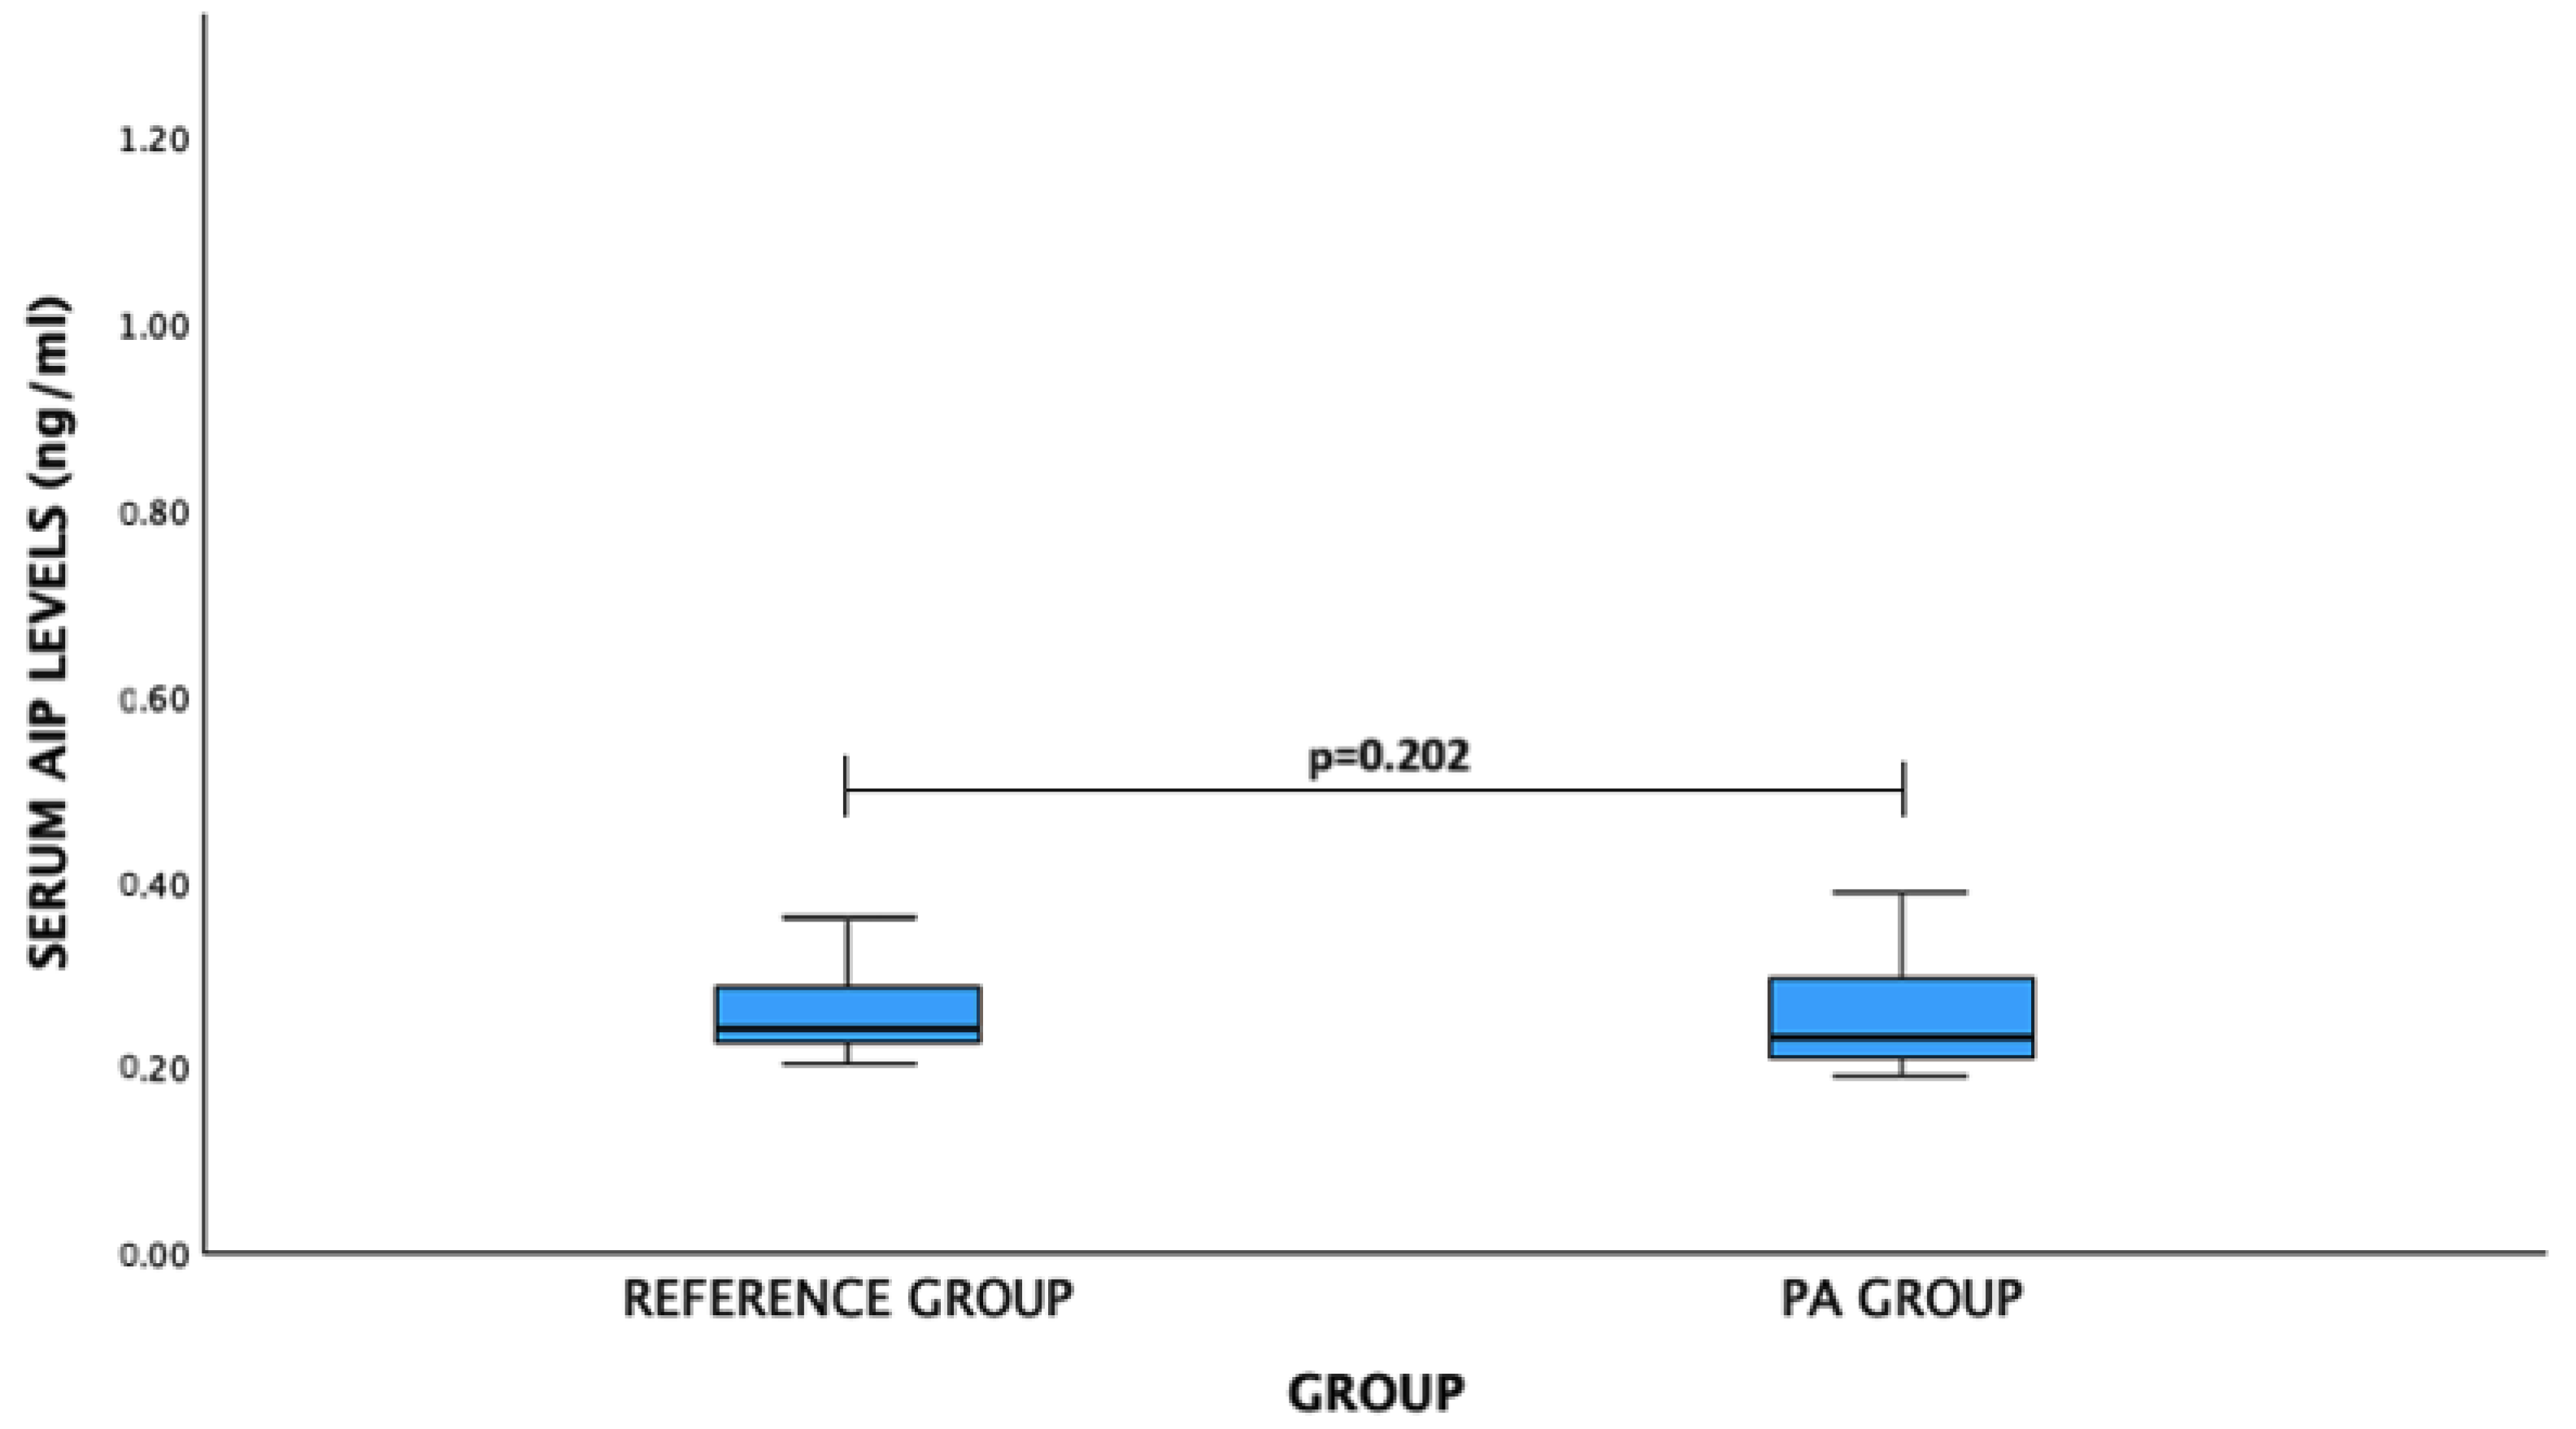
| AIP | |||
| Male | 0.242 (0.055) | 0.303 (0.130) | 0.149 |
| Female | 0.250 (0.121) ng/mL | 0.246 (0.056) | 0.943 |
| Invasiveness | Ki-67 LI | p-Value | ||
|---|---|---|---|---|
| <1% | 1% | >1% | ||
| Noninvasive PA n = 22 (27.8%) | 16 (72.7%) | 2 (9.1%) | 4 (18.2%) | 0.717 |
| Invasive PA n = 57 (72.2%) | 37 (64.9%) | 9 (15.8%) | 11 (19.3%) | |
| Recurrence | Ki-67 LI | p-Value | ||
|---|---|---|---|---|
| <1% | 1% | >1% | ||
| Absent n = 56 (70.9%) | 38 (67.9%) | 7 (12.5%) | 11 (19.6%) | 0.843 |
| Present n = 23 (29.1%) | 15 (62.2%) | 4 (17.4%) | 4 (17.4%) | |
| Activity | Ki-67 LI | p-Value | ||
|---|---|---|---|---|
| <1% | 1% | >1% | ||
| Active PA n = 44 (55.7%) | 31 (70.5%) | 4 (9.1%) | 9 (20.5%) | 0.378 |
| Nonactive PA n = 35 (44.3%) | 122 (62.9%) | 7 (20.0%) | 6 (17.1%) | |
| Size | Ki-67 LI | p-Value | ||
|---|---|---|---|---|
| <1% | 1% | >1% | ||
| Micro-PA n = 31 (39.2%) | 23 (74.2%) | 4 (12.9%) | 4 (19.9%) | 0.492 |
| Macro-PA n = 48 (60.8%) | 30 (62.2%) | 7 (14.6%) | 11 (22.9%) | |
| Gene, SNP | Genotype/Allele | Ki-67 LI | p-Value | ||
|---|---|---|---|---|---|
| <1% | 1% | >1% | |||
| SSTR2 rs2236750 | Genotype | 20 (37.7) | 5 (45.5) | 4 (26.7) | 0.636 |
| AA | 27 (50.9) | 4 (36.4) | 10 (66.7) | ||
| AG | 6 (11.3) | 2 (18.2) | 1 (6.7) | ||
| GG | 53 (100) | 11 (100) | 15 (100) | ||
| Total | |||||
| Allele | |||||
| A | 67 (63.2) | 14 (62.6) | 18 (60.0) | ||
| G | 39 (36.8) | 8 (36.4) | 12 (40.0) | 0.945 | |
| SSTR5 rs34037914 | Genotype | 47 (88.7) | 9 (81.8) | 15 (100) | 0.087 |
| CC | 6 (11.3) | 1 (9.1) | 0 (0.0) | ||
| CT | 0 (0.0) | 1 (9.1) | 0 (0.0) | ||
| TT | 53 (100) | 11 (100) | 15 (100) | ||
| Total | |||||
| Allele | |||||
| C | 100 (93.6) | 19 (86.4) | 30 (100) | ||
| T | 6 (6.4) | 3 (13.6) | 0 (0) | 0.275 | |
Disclaimer/Publisher’s Note: The statements, opinions and data contained in all publications are solely those of the individual author(s) and contributor(s) and not of MDPI and/or the editor(s). MDPI and/or the editor(s) disclaim responsibility for any injury to people or property resulting from any ideas, methods, instructions or products referred to in the content. |
© 2024 by the authors. Licensee MDPI, Basel, Switzerland. This article is an open access article distributed under the terms and conditions of the Creative Commons Attribution (CC BY) license (https://creativecommons.org/licenses/by/4.0/).
Share and Cite
Gedvilaite-Vaicechauskiene, G.; Kriauciuniene, L.; Tamasauskas, A.; Rovite, V.; Mandrika, I.; Wu, S.-N.; Huang, C.-W.; Poskiene, L.; Liutkeviciene, R. Pituitary Adenoma: SSTR2 rs2236750, SSTR5 rs34037914, and AIP rs267606574 Genetic Variants, Serum Levels, and Ki-67 Labeling Index Associations. Medicina 2024, 60, 1252. https://doi.org/10.3390/medicina60081252
Gedvilaite-Vaicechauskiene G, Kriauciuniene L, Tamasauskas A, Rovite V, Mandrika I, Wu S-N, Huang C-W, Poskiene L, Liutkeviciene R. Pituitary Adenoma: SSTR2 rs2236750, SSTR5 rs34037914, and AIP rs267606574 Genetic Variants, Serum Levels, and Ki-67 Labeling Index Associations. Medicina. 2024; 60(8):1252. https://doi.org/10.3390/medicina60081252
Chicago/Turabian StyleGedvilaite-Vaicechauskiene, Greta, Loresa Kriauciuniene, Arimantas Tamasauskas, Vita Rovite, Ilona Mandrika, Sheng-Nan Wu, Chin-Wei Huang, Lina Poskiene, and Rasa Liutkeviciene. 2024. "Pituitary Adenoma: SSTR2 rs2236750, SSTR5 rs34037914, and AIP rs267606574 Genetic Variants, Serum Levels, and Ki-67 Labeling Index Associations" Medicina 60, no. 8: 1252. https://doi.org/10.3390/medicina60081252