Abstract
We aimed to assess the effects of plyometric jump training (PJT) on female soccer player’s physical fitness. To this aim, a systematic review with meta-analysis (SRMA) was conducted. The electronic databases PubMed, MEDLINE, Web of Science, and SCOPUS were used. To qualify for inclusion, peer-reviewed studies must have included (i) a PJT programme of ≥2 weeks, (ii) healthy athletes, (iii) a control group, and (iv) physical fitness outcomes (e.g., jump; sprint). Studies were excluded if (i) they incorporated injuried female soccer players, (ii) did not involve PJT or an active control group, (iv) lack of baseline and/or follow-up data. Data was meta-analyzed using the inverse variance random-effects model. Ten moderate-to-high quality studies were included in the analyses, comprising 13 training groups (n = 140) and 10 control groups (n = 110). Small to large (ES = 0.60–2.24; p = 0.040 to <0.001) effects were noted for countermovement jump, drop jump, kicking performance, linear sprint, change of direction speed, and endurance. The moderator analyses (i.e., PJT duration, age groups, competitive level, and soccer experience) revealed no significant differences between groups. In conclusion, PJT may improve the physical fitness of female soccer players. Such improvements might be expected after PJT interventions with six or more weeks of duration, and in players with different chronological ages, competitive levels and soccer experience.
1. Introduction
Endurance (cardiorespiratory capacity) is a relevant physical fitness trait in soccer [1]. However, jumping, single and repeated sprinting, change of direction, and kicking are also key proxies of soccer performance [2,3,4]. Indeed, these maximal-intensity single-effort physical fitness traits preceded goal opportunities in competitive leagues [2,5]. For example, sprinting and jumping actions occur in more than 50% of goal situations [2]. Moreover, mean values of acceleration >2.26 m·s−2 occur 1.78 times per minute, in addition to sprint distance of 2.87 m per minute, and/or highs-peed running of 6 meter per minute, with greater values during highly-competitive matches [6]. In addition, maximal-intensity short-duration actions such as jumping and sprinting may be associated with team position in a given tournament and/or players’ competitive level [4,7,8].
Several training approaches are used among female soccer players to improve jumping, single and repeated sprinting, change of direction and kicking power, as well as endurance attributes [5]. However, plyometric jump training (PJT) may be particularly effective, offering several advantages (e.g., reduced cost; injury prevention) compared to other methods (e.g., traditional resistance training) [9,10]. Additionally, the incorporation of PJT among training practices in soccer might be highly translated into game scenarios. For instance, there is a strong reliance on vertical and horizontal expressions of power during various game scenarios in soccer such as when defending, shooting, and attacking [1,5,11]. In turn, according to the principle of training specificity, soccer players should regularly engage in PJT programs. Indeed, PJT have demonstrated a significant transference effect between jump training exercises and soccer-specific physical performance [12,13,14].
From a physiological perspective, PJT capitalizes on the stretch-shortening cycle (SSC) where musculotendinous units are eccentrically stretched during the loading or impact phase before concentrically shortening in the push-off or take-off [15,16]. In this regard, PJT results in a wide range of distinct physiological and biomechanical adaptations (e.g., increased motor unit recruitment and rate of force development (RFD) [17,18,19,20]. Among soccer athletes (mixed with other sports), after 8 weeks of PJT, significant changes were noted at the muscle fiber level, including myosin heavy chain isoform composition in type I/IIa fibers, increased cross-sectional area, absolute peak calcium-activated force, maximum unloaded and loaded shortening velocity, absolute and normalized peak power, velocity at peak power, absolute force at which peak power was reached, and increased stiffness [21]. In a similar study, increased percentage of type I/IIa and IIa fibers were noted, in line with a decrease in IIx fibres from the vastus lateralis [22]. In another study with soccer players, 8 weeks of PJT combined with resistance training increased electromyography activity (72–110%) in the vastus medialis and rectus femoris muscles during jumping [23]. Another study with soccer players reported significant increases (4–15%; ES = 0.3–1.3) in leg stiffness after 4 weeks of training [24].
Due to the beneficial effects of PJT, several systematic reviews and meta-analysis (SRMA) have been published evidencing the effectiveness of this training mode to improve distinct power-related attributes in athletes from different sports disciplines including handball [25] and volleyball [26]. Likewise, there is a growing body of experimental evidence examining the effects of PJT on physical fitness attributes in female soccer players [27]; however, this evidence has not yet been comprehensively aggregated. Although a recent SRMA examined the effects of PJT on female soccer, only vertical jump height (i.e., countermovement jump) was analyzed [28]. Another SRMA examined the effects of PJT on male soccer players physical fitness [29], including measures such as jumping, sprinting and strength. However, considering the differences between female and male soccer players [1,5] and their potential different response to PJT [30], it would be adventurous to extrapolate results derived from male to female soccer players.
Given the increased scientific awareness of PJT relevance regarding physical fitness improvement, it was deemed appropriate to aggregate PJT studies conducted in female soccer players in a SRMA to strengthen the level of scientific evidence [31] on this topic. This knowledge can guide practitioners to use PJT routines that are effective in female soccer, avoiding the simple transfer from the knowledge related to male soccer players. Thus, the aim of this SRMA was to assess the effects of PJT on female soccer player’s physical fitness (e.g., jump, sprint, kicking ability, change of direction speed; anaerobic performance; endurance).
2. Materials and Methods
This SRMA was conducted and reported in accordance with the PRISMA statement [32].
2.1. Eligibility Criteria
A Participants, Intervention, Comparators, Outcomes, and Study (PICOS) design approach was used to rate studies for eligibility [32]. The respective inclusion criteria adopted in our meta-analysis was as follow: (i) apparently healthy female soccer players, with no restrictions on their playing level or age, (ii) a PJT programme, defined as lower-body unilateral or bilateral bounds, jumps, and hops that commonly utilise a pre-stretch or countermovement stressing the stretch-shortening cycle, (iii) a control group, (iv) at least one measure of physical fitness (e.g., jump, sprint, kicking ability, change of direction speed; anaerobic performance; endurance) before and after PJT, (v) controlled trials. The respective exclusion criteria adopted in our meta-analysis was as follow: (i) female soccer players with health problems (e.g., injuries, recent surgery), (ii) exercise interventions not involving PJT or exercise interventions involving PJT programmes representing less than 50% of the total training load when delivered in conjunction with other training interventions (e.g., high-load resistance training), (iii) absence of active control group, (iv) lack of baseline and/or follow-up data, (v) non-controlled trials. Of note, two previous scoping reviews [27,33] indicated that several otherwise high-quality studies in the field of PJT did not include a randomization design. In order to avoid the exclusion of potentially relevant studies, we considered for inclusion non-randomized study designs, as long as baseline values between groups were similar for the main outcome of the study. In contrast, the inclusion of an active control group was considered essential in order to isolate the effect of PJT from the rest of training methods that female soccer players commonly conduct in their regular training schedule.
Additionally, only full-text, peer-reviewed, original studies written in English were considered, excluding cross-sectional, review papers, or training-related studies that did not focus on the effects of PJT exercises (e.g., studies examining the effects of upper-body plyometric exercises). Retrospective studies, prospective studies, studies in which the use of jump exercises was not clearly described, studies for which only the abstract was available, case reports, special communications, letters to the editor, invited commentaries, errata, overtraining studies, and detraining studies were also excluded from the present meta-analysis. In the case of detraining studies, if there was a training period prior to a detraining period, the study was considered for inclusion.
2.2. Information Sources
We considered previous recommendations from the two largest scoping reviews examining PJT to conduct the literature search [27,33]. Computerized literature searches were conducted in the electronic databases PubMed (comprising MEDLINE), Web of Science Core Collection, and SCOPUS. The search strategy was conducted using the Boolean operators AND as well as OR with the following keywords: “ballistic”, “complex”, “explosive”, “force-velocity”, “plyometric”, “stretch-shortening cycle”, “jump”, “training”, “female”, “women”, “football”, and “soccer”. For example, the following search was adopted using Pubmed: (((((((((“randomized controlled trial” [Publication Type]) OR “controlled clinical trial” [Publication Type]) OR “randomized” [Title/Abstract]) OR “trial” [Title]) OR “clinical trials as topic” [MeSH Major Topic]) AND “soccer” [Title/Abstract]) OR “football” [Title/Abstract]) AND “training” [Title/Abstract]) OR “plyometric” [Title/Abstract]). After an initial search (April 2017), accounts were created in the respective databases. Through these accounts, automatically generated emails were received for updates regarding the search terms used. The search was refined in May 2019 and updates were received daily (if available), and studies were eligible for inclusion up to January 2020. Following the formal systematic searches, we conducted additional hand-searches (e.g., personal libraries). One author (RRC) performed the only search.
2.3. Study Selection and Data Collection Process
After the exclusion of repeated article titles, a review of retrieved article titles was conducted. Then, examination of article abstracts followed. Thereafter, full articles were assessed. The reasons to exclude full-text articles were recorded. The data extracted from the included articles was recorded in a pre-form created in Microsoft Excel (Microsoft Corporation, Redmond, WA, USA). Two authors (MSG and JSS) conducted the process independently, and a third author (RRC) resolved disagreements regarding study eligibility.
2.4. Data Items
For the current review, physical fitness was chosen as the main outcome. A priori, common measures of physical fitness were considered, but not limited to: (i) jump (i.e., height; distance; flight time; power; reactive strength [i.e., mm.ms; ms.ms]), (ii) sprint (i.e., time; velocity), (iii) kicking ability (i.e., distance; velocity), (iv) change of direction speed (i.e., time; speed), (v) anaerobic performance (e.g., repeated sprint ability mean time; 30-s Wingate test mean power), (vi) endurance (e.g., shuttle-run total time or distance).
In addition to the aforementioned data items, adverse effects were registered, and descriptive characteristics of the PJT interventions (e.g., duration; frequency) and athletes (e.g., age; fitness level) were extracted. A complete description of the additional PJT and athletes’ characteristics have been previously published [33].
2.5. Methodological Quality in Individual Studies
The methodological quality of eligible studies was assessed using the Physiotherapy Evidence Database (PEDro) scale, as previously described [34] and interpreted for PJT literature [28,35]. Briefly, studies with ≤3 points were considered of poor quality, 4–5 points as moderate quality, and 6–10 points as high quality. Two of the authors (RRC and MSG) independently scored the articles. Disagreements in the rating between both authors was resolved through discussion with a third author (JSS). Aiming to control the risk of bias between authors, the Kappa correlation test was used to analyse the agreement level for the included studies. An agreement level of k = 0.89 was obtained.
2.6. Summary Measures and Synthesis of Results, and Publication Bias
For analysis and interpretation of results, we followed previous recommendations for PJT meta-analyses [26,28,36,37]. Briefly, using a random-effects model meta-analyses were conducted only if ≥3 studies provided means and standard deviations for the same pre-post PJT parameter (e.g., sprint time), in order to calculate an effect size (ES; Hedges’ g ES) alongside their respective 95% confidence intervals (CIs). Data was standardized using post-intervention standard deviation score. Calculated ES were interpreted as previously recommended for sport sciences studies: <0.2, trivial; 0.2–0.6, small; >0.6–1.2, moderate; >1.2–2.0, large; >2.0–4.0, very large; >4.0, extremely large [38]. For studies that incorporated ≥2 intervention groups and only one control group, the sample size in the control group was proportionately divided during analyses [39]. Heterogeneity was assessed using the I2 statistic, with values of <25%, 25–75%, and >75% considered as representative of low, moderate and high heterogeneity, respectively. The risk of bias was analyzed with the Egger’s test [40]. To adjust for publication bias, a sensitivity analysis was conducted using the trim and fill method [41], with L0 as the default estimator for the number of missing studies [42]. Subgroup analyses to assess the potential influence of PJT duration (number of weeks), training frequency (number of sessions per week), total number of training sessions, in addition to the age, the expertise level of the participants (i.e., moderate-level vs. high-level players), and the athletes years of soccer experience were performed according to the median split technique. Analyses were performed using specialized software (Comprehensive Meta-Analysis; version 2; Biostat, Englewood, NJ, USA). Statistical significance was set at p < 0.05.
3. Results
3.1. Study Selection
The electronic search process identified 7206 studies (2261 from PUBMED, 2280 from SCOPUS, and 2665 from WOS), plus 24 studies through other sources. Duplicate studies were then removed (n = 4761). Study titles and abstracts were screened with a further 2020 studies removed. Accordingly, full-text versions of 449 studies were screened. From these, 224 studies did not include an appropriate study design (e.g., control group), 188 studies did not include soccer players or female soccer players only, and 27 were excluded for different reasons (e.g., no measure of physical fitness provided). The remaining 10 studies [43,44,45,46,47,48,49,50,51,52] were included in the SRMA (Figure 1). The included studies involved 13 individual experimental groups and 140 participants, and 110 participants in the 10 control groups. The characteristics of the participants and PJT interventions are indicated in the Table 1 and Table 2. Briefly, the age of the participants was between a mean of 13.4 to 26.6 years, with a fitness level that varied from recreationally trained to professional athletes. The PJT interventions lasted between six up to 12 weeks. Almost all studies (except one) incorporated PJT during the in-season period. A complete description of the physical fitness measures used in the meta-analyses is provided in Table 3.
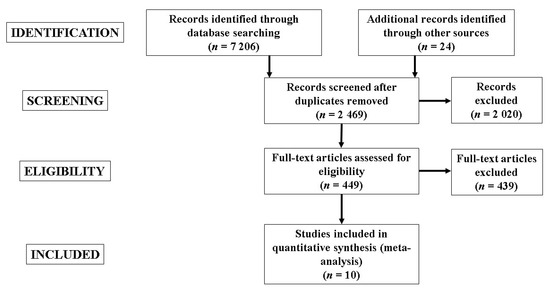
Figure 1.
Flow diagram of the search process.

Table 1.
Characteristics of included study participants and of PJT programs.
Table 2.
Characteristics of PJT programs.
Table 3.
Study groups and their physical fitness.
3.2. Methodological Quality
Using the PEDro checklist, five studies achieved 4 or 5 points and were classified as being of “moderate” quality, while five studies achieved 6–10 points and were therefore considered as being of “high” methodological quality (Table 4).
Table 4.
Physiotherapy Evidence Database (PEDro) scale ratings.
3.3. Meta-Analysis Results for Countermovement Jump
Seven studies provided data for CMJ, involving 10 experimental and seven control groups (pooled n = 182). There was a significant effect of PJT on CMJ (ES = 0.71; 95% CI = 0.20 to 1.23; p = 0.007; I2 = 62.9%; Egger’s test p = 0.224; Figure 2A). The relative weight of each study in the analysis ranged from 6.9% to 13.3%.
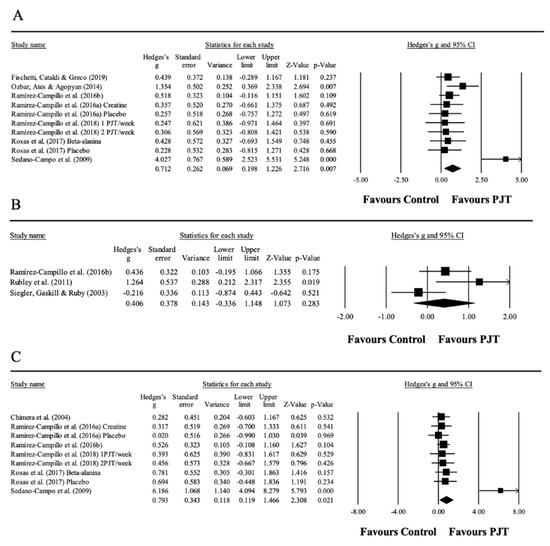
Figure 2.
Forest plot of changes in countermovement jump (A), countermovement jump with arms awing (B), and drop jump performance (C) in athletes participating in plyometric jump training (PJT) compared to controls. Values shown are effect sizes (Hedges’s g) with 95% confidence intervals (CI). The size of the plotted squares reflects the statistical weight of the study.
No significant sub-group difference (between-group p = 0.188) was found when PJT interventions with ≤6 weeks (5 study groups; ES = 0.40; 95% CI = −0.01 to 0.80; within-group I2 = 0.0%) were compared to PJT interventions with >6 weeks (5 study groups; ES = 1.18; 95% CI = 0.09 to 2.28; within-group I2 = 81.1%).
Similarly, no significant sub-group difference (between-group p = 0.664) was found when PJT interventions with players ≤22.8 years old (4 study groups; ES = 0.62; 95% CI = 0.17 to 1.07; within-group I2 = 0.0%) were compared to PJT interventions with players >22.8 years old (6 study groups; ES = 0.84; 95% CI = −0.04 to 1.71; within-group I2 = 76.6%).
Moreover, no significant sub-group difference (between-group p = 0.080) was found when PJT interventions with high-level players (4 study groups; ES = 1.41; 95% CI = 0.26 to 2.56; within-group I2 = 85.3%) were compared to PJT interventions with moderate-level players (6 study groups; ES = 0.30; 95% CI = −0.14 to 0.75; within-group I2 = 0.0%).
Furthermore, no significant sub-group difference (between-group p = 0.420) was found when PJT interventions conducted on players with ≤5.7 years of soccer experience (4 study groups; ES = 1.42; 95% CI = −0.05 to 2.89; within-group I2 = 83.8%) were compared to PJT interventions conducted on players with >5.7 years of soccer experience (5 study groups; ES = 0.40; 95% CI = −0.01 to 0.80; within-group I2 = 0.0%).
3.4. Meta-Analysis Results for Countermovement Jump with Arm Swing
Three studies provided data for CMJA, involving three experimental and three control groups (pooled n = 88). There was a non-significant effect of PJT on CMJA (ES = 0.41; 95% CI = −0.34 to 1.15; p = 0.28; I2 = 65.3%; Egger’s test p = 0.452; Figure 2B). The relative weight of each study in the analysis ranged from 25.4% to 37.8%.
3.5. Meta-Analysis Results for Drop Jump
Six studies provided data for DJ, involving nine experimental and six control groups (pooled n = 154). There was a significant effect of PJT on DJ (ES = 0.79; 95% CI = 0.12 to 1.47; p = 0.021; I2 = 73.1%; Egger’s test p = 0.063; Figure 2C). The relative weight of each study in the analysis ranged from 6.3% to 14.0%.
3.6. Meta-Analysis Results for Kicking Performance
Three studies provided data for kicking performance, involving four experimental and three control groups (pooled n = 59). There was a significant effect of PJT on kicking performance (ES = 2.24; 95% CI = 0.13 to 4.36; p = 0.037; I2 = 89.4%; Egger’s test p = 0.040; Figure 3). After the trim and fill method, the adjusted values remained as the observed values. The relative weight of each study in the analysis ranged from 22.8% to 26.2%.
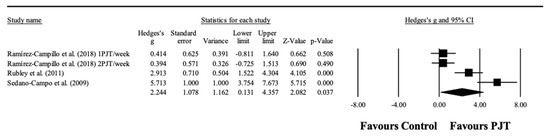
Figure 3.
Forest plot of changes in kicking performance, in athletes participating in plyometric jump training (PJT) compared to controls. Values shown are effect sizes (Hedges’s g) with 95% confidence intervals (CI). The size of the plotted squares reflects the statistical weight of the study.
3.7. Meta-Analysis Results for Linear Sprint
Seven studies provided data for linear sprint performance, involving 10 experimental and seven control groups (pooled n = 186). There was a significant effect of PJT on linear sprint performance (ES = 0.79; 95% CI = 0.39 to 1.18; p < 0.001; I2 = 38.2%; Egger’s test p = 0.257; Figure 4A). The relative weight of each study in the analysis ranged from 5.4% to 15.3%.
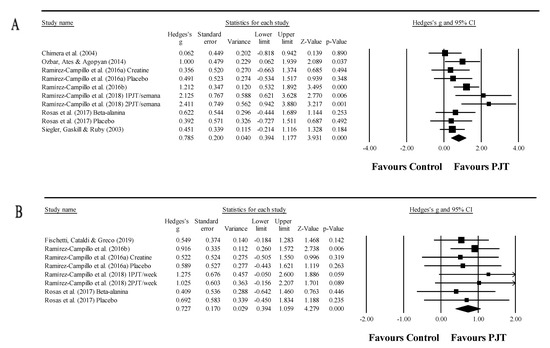
Figure 4.
Forest plot of changes in linear sprint performance (A) (upper) and change of direction speed performance (B) (bottom), in athletes participating in plyometric jump training (PJT) compared to controls. Values shown are effect sizes (Hedges’s g) with 95% confidence intervals (CI). The size of the plotted squares reflects the statistical weight of the study.
No significant sub-group difference (between-group p = 0.167) was found when PJT interventions with ≤6 weeks (six study groups; ES = 0.62; 95% CI = 0.24 to 1.00; within-group I2 = 0.0%) were compared to PJT interventions with >6 weeks (four study groups; ES = 1.30; 95% CI = 0.41 to 2.20; within-group I2 = 63.9%).
Similarly, no significant sub-group difference (between-group p = 0.545) was found when PJT interventions with players ≤21.45 years old (five study groups; ES = 1.02; 95% CI = 0.25 to 1.79; within-group I2 = 65.3%) were compared to PJT interventions with players >21.45 years old (five study groups; ES = 0.75; 95% CI = 0.33 to 1.16; within-group I2 = 0.0%).
3.8. Meta-Analysis Results for Change of Direction Speed
Five studies provided data for CODS performance, involving eight experimental and five control groups (pooled n = 144). There was a significant effect of PJT on CODS performance (ES = 0.73; 95% CI = 0.39 to 1.06; p < 0.001; I2 = 0.0%; Egger’s test p = 0.813; Figure 4B). The relative weight of each study in the analysis ranged from 6.3% to 25.8%.
3.9. Meta-Analysis Results for Endurance
Five studies provided data for endurance performance, involving eight experimental and five control groups (pooled n = 150). There was a significant effect of PJT on endurance performance (ES = 0.60; 95% CI = 0.09 to 1.10; p = 0.020; I2 = 53.7%; Egger’s test p = 0.328; Figure 5A). The relative weight of each study in the analysis ranged from 10.0% to 17.3%.
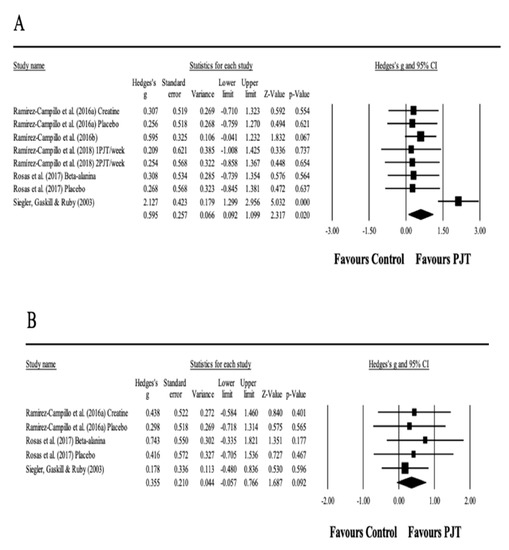
Figure 5.
Forest plot of changes in endurance performance (A) and anaerobic performance (B), in athletes participating in plyometric jump training (PJT) compared to controls. Values shown are effect sizes (Hedges’s g) with 95% confidence intervals (CI). The size of the plotted squares reflects the statistical weight of the study. Split figure and place (B) under (A) to fit on the page.
3.10. Meta-Analysis Results for Anaerobic Performance
Three studies provided data for anaerobic performance, involving five experimental and three control groups (pooled n = 89). There was a non-significant effect of PJT on anaerobic performance (ES = 0.36; 95% CI = −0.06 to 0.77; p = 0.092; I2 = 0.0%; Egger’s test p = 0.121; Figure 5B). The relative weight of each study in the analysis ranged from 13.5% to 39.2%. Of note, from a pool of 48 potential moderator analyses, due to a limited number of studies (i.e., <3 per moderator), only six moderator analyses were possible (as indicated above).
3.11. Adverse Effects
None of the included studies reported soreness, pain, fatigue, injury, damage, or adverse effects related to the PJT intervention.
4. Discussion
Our findings revealed that PJT is effective in improving CMJ and DJ, kicking performance, speed on sprint and COD tests and endurance performance in female soccer players. A discussion of such findings follows below.
4.1. Countermovement Jump
A moderate increase in CMJ was observed. The positive effect of PJT on CMJ was previously noted in female athletes [28,35]. Similarly, a meta-analysis in male soccer players revealed also a significant effect of PJT on male athletes’ vertical jump height performance [29]. Although the moderate ES can be considered consistent across the included studies, caution should be taken since one study [47] out of 10 resulted in an extremely large (ES = 4.027) effect, even though the sample was composed by Spanish National Women’s First Division players who are supposed to be highly trained. Similarly, Stojanović et al. [35] showed a large effect in female athletes, but also warned about the presence of one study (out of seven) reporting uncommon large gains (ES = 5.10) in CMJA. In both cases, discrepant effects can inflate results and reveal the necessity of performing more highly controlled studies to reach firm conclusions about the effectiveness of PJT on CMJ with and without arm swing in female soccer players. Nonetheless, after a moderator analysis for the current SRMA, excluding the study that yielded extremely large CMJ improvements [47], a significant improvement in CMJ (ES = 0.48; p = 0.002) was still observed. Therefore, PJT seems effective in the improvement of CMJ in female soccer players. Such improvement can be explained by the improved specific neural activation patterns and enhanced SSC utilization after training [17], even though CMJ can be considered a slow SSC movement [53].
4.2. Countermovement Jump with Arm Swing
Although two out of three studies demonstrated an improvement in CMJA performance, in contrast to CMJ, the CMJA increase was not significant. Although three studies provided data for the current meta-analysis, complying with previous recommendations for robust meta-analysis [54,55,56], the interpretation of results derived from such a limited number of studies should be performed with caution. Firstly, in the study of Ramirez-Campillo et al. [44] and Rubley et al. [46] the participants in the experimental groups had an increase in performance, while the soccer players in the control groups reduced their performance. In contrast, in the study of Siegler et al. [48] the participants from both the PJT and control groups exhibited an improved performance, with a greater improvement observed in the control group, which may explain the negative ES in Figure 2B for the Siegler et al. study [48]. Of note, in the study of Rubley et al. [46], one PJT session was applied each week, in the study of Ramirez-Campillo et al. [44] two sessions per week, whereas in the Siegler et al. study [48] up to three sessions were applied each week. According to a previous meta-analysis in female soccer players, PJT interventions with two or more sessions per week produced a moderate effect on vertical jump height (ES = 0.8), while those with less than two sessions per week produced a large effect (ES = 1.47). Is unlikely that overtraining occurred in the Siegler et al. study [48], since an improvement in performance was observed (similar to the control group). However, the possibility that a reduced frequency of PJT may induce an optimization of the training process, with optimal and efficient training volumes, particularly in female soccer players [50], should be further explored.
The lack of a significant increase in CMJA among female soccer players after PJT is in contrast with the findings from a previous meta-analysis in male adult soccer players, were a significant effect of PJT was noted for vertical jump height [29]. Further, among youth male soccer players a PJT meta-analysis revealed a significant increase in vertical jump height (i.e., CMJ and CMJA) [57]. Future studies may elucidate if different biological mechanisms or if differences in methodological issues between published studies (e.g., training duration; testing procedures) underlay the apparent different responses to PJT between male and female soccer athletes.
4.3. Drop Jump
A moderate improvement was noted for DJ (ES = 0.43; p = 0.012). Improvements in DJ (i.e., reactive strength) may be associated with several neuromechanically factors [17,58]. Of particular relevance may be the increased musculotendinous stiffness associated to DJ improvements after PJT [17,59]. Such an increase may be associated with a better running economy [60], particularly at high speeds [61], commonly occurring during female soccer matches [5]. In addition, a better DJ performance may reflect an improved ability to tolerate greater eccentric forces and improved concentric RFD [17,20,62,63] which may contribute to several key soccer-specific movements such as change of direction ability, to better tolerate landings after a jump, and explosive actions such as sprinting capabilities [5,59,64,65].
Of note, the improvement in DJ performance in our meta-analysis (ES = 0.43) was lower to that observed in a previous meta-analysis that analyzed the effects of PJT on DJ performance (ES = 0.66) [30]. Moreover, in the aforementioned meta-analyses females improved less their jumping performance (ES = 0.5) compared to males (ES = 0.8) [30]. Moreover, male soccer players showed a large improvement in DJ performance after a PJT intervention (ES=1.6), while female athletes showed only a moderate improvement (ES=0.6) [44]. Independent from the magnitude of the response to PJT in female compared to male soccer players, future studies should elucidate the mechanisms underlying the physical fitness improvements in soccer players after PJT.
4.4. Kicking Performance
A very large improvement was noted for kicking performance. Kicking performance is a key ability in soccer, involved in key moments of a match, such as passing actions and scoring goals [5]. Indeed, shooting performance is related with match success and league positioning [66,67,68]. Therefore, improvements in kicking performance after PJT may be important for female soccer players. Such improvement after PJT might be mediated through neuromechanically adaptations, including increased force and rate of force development [17,69,70]. However, from three studies that provided data for kicking performance, one [47] yielded an improvement value that was unusually high (ES = 5.71). Such result may be related to low SD values reported by the authors, probably due to the high performance level (Spanish National Women’s First Division) of the athletes involved in the study. Independent of this, the fact that high-level athletes achieved an improvement in kicking performance of ~Δ12% [47] after PJT should be highlighted. In the study of Rubley et al. [46] a very large improvement was noted (ES = 2.91; Δ22%). Such improvement may not be uncommon among youth players. Indeed, in the study of Rubley et al. [46], youth (age = 13.4 y) athletes were included. In a previous work [71] with youth (male) soccer players (age = 11.8 y), an improvement of ES=1.83 was noted for kicking performance, after a PJT with a comparable load (i.e., 8-16 sessions) as in the study of Rubley et al. [46]. In this sense, soccer skills (e.g., kicking) may be particularly improved at certain age [72], such as in the study by Rubley et al. [46], whereas adult (female) athletes may achieve comparatively less improvements (ES = 0.42–0.45) [50]. When the total volume of PJT was compared between studies, values of 810 jumps [50] 1680 jumps [46] and 3240 jumps were noted. [47]. Whether such volume difference may explain the different magnitude of observed improvements deserves to be examined in future PJT research with female soccer players. Such research may allow to stablish optimal volumes for both increased performance and reduced injury risk [10,73].
4.5. Linear Sprint
Linear sprint performance obtained a moderate improvement after PJT. Considering the high frequency of short-distance (<30 m) sprints occurring in soccer matches, improving sprinting ability may increase the probability to winning ball possession and stand out from other players [5,74]. Interestingly, the studies analyzed in this SRMA provided data for 15 m to 20 m sprints (one study provided data for 30 m sprint). Therefore, improvements in linear sprinting probably reflect improved acceleration capabilities [75,76,77]. Considering the relevance of the force-velocity spectrum parameters (i.e., force, power and velocity) during sprinting among soccer players [78], it seems plausible that an optimization of the force-velocity spectrum may help to explain the improvements in sprinting after PJT. Indeed, PJT may provide positive adaptations in the force-velocity spectrum [79,80].
Compared to male soccer players, there are some contrast findings in the literature. For example, as in the current meta-analysis, a previous meta-analysis conducted with youth male soccer players observed significant improvements in linear sprint performance after PJT in distances between 5 m, 10 m, 20 m, 30 m, but not 40 m [57]. On the other side, a previous meta-analysis conducted with adult male soccer players observed non-significant improvements in linear sprint performance after PJT in distances between 5, 10, 15 and 30 m, with a significant improvement noted only for 20 m [29]. Future studies may elucidate how sex and maturity might interact to moderate the effects of PJT on linear sprint performance among soccer players.
4.6. Change of Direction Speed
A moderate improvement in COD was observed after PJT. Considering the relevance of COD performance among female soccer players (e.g., 1,336–1,529 movement changes during a match) [81], such improvement may reflect an advantage during competitive matches (e.g., increased goal chances) [2]. Neuromechanically adaptations such as greater muscle activation of the knee flexors (eccentric phase) and extensors (concentric or propulsive phase) [17,82,83] may favor COD improvements [64]. This may allow greater absorption of forces and increase ground reaction force production required in task execution of the COD [84]. Additionally, improvements in plyometric ability may also explain the improved COD capability [85].
The improvement in COD performance among female soccer players is in contrast with the result observed in male soccer players. Indeed, no improvement was noted in COD assessed with the t test and the zig-zag test in a previous PJT meta-analysis conducted in male soccer players [29]. Of note, in our meta-analysis female soccer players were assessed for COD performance with the t test and the zig-zag test, although also with the Illinois agility test, the latter requiring longer distances. Future studies may elucidate if differences in measurement protocols or sex-related differences might explain the apparently contrast COD performance changes after PJT between male and female soccer players.
4.7. Endurance
Endurance performance obtained a moderate improvement after PJT. Similarly, a meta-analysis revealed a significant effect of PJT on male soccer players endurance capability [29]. Improvements in endurance capacity has shown significant correlations with repeat sprint ability (RSA) [86], the latter positively associated with match-play performance [87]. These improvements could be explained due to better phosphocreatine resynthesize rate [87]. Therefore, increments of absolute strength would result enhancement in economy running due to a reduced recruitment of higher threshold motor units, producing a more economical behavior [88]. Resistance training methods with an emphasis on PJT and eccentric contractions could be advantageous for female soccer players to improve neuromuscular performance such as maximal strength, tendon stiffness and rate of force development.
4.8. Anaerobic Performance
Regarding anaerobic performance, most studies addressed the effects of PJT on performance during the repeated-sprint ability (RSA) test, and no meaningful result was obtained while comparing the experimental groups with controls. Though maximal sprinting speed is one of the performance composites of anaerobic performance during repeated sprints [89] other factors affecting recovery between sprints and neuromuscular performance maintenance are key to improve RSA [89,90,91]. Therefore, PJT may have limited potential to improve anaerobic performance, especially when endurance and fatigue-resistance factors need to be changed in order to induce adaptation. However, compared to controls, the PJT groups achieved an ES = 0.36 (p = 0.092). This effect probably is related to the significant and moderate effect of PJT on maximal linear sprinting ability in female soccer players.
Current findings are difficult to compare with those obtained in male soccer players, as most PJT studies that included RSA assessments included youth male soccer players. In one of such studies, youth males (age, 12.7 years; APHV, −1.3), after 8 weeks of jump training, improved (2.1–2.5%; ES = 0.2–1.6) best and total RSA times [92]. Also, in male youth soccer players (age, 13.6 years; Tanner stage II-III) small (0.7–0.8%) improvements were noted in best and mean RSA times after 6 weeks of training [93]. Relatedly, in young adult soccer players (age, 18.4 years), 8 weeks of training induced an improvement (1.4%; ES = 0.85) in mean RSA with COD time (1.4%; ES = 0.85) and related fatigue index (27.8%; ES = 0.91) [94]. Future studies may elucidate if differences in measurement protocols (i.e., RSA vs RSA-COD), players biological maturity or sex-related differences might explain the apparently contrast findings between our results and those previously reported for RSA changes after PJT for male soccer players.
4.9. Potential Limitations
Some potential limitations of this SRMA should be acknowledged. Firstly, additional analyses were not always possible as <3 studies were available for at least one of the moderators. Additionally, the use of the median split technique may induce residual confounding and reduced statistical power [95]. Moreover, a meta-regression was not possible due to reduced number of studies available. Further, even though the included studies did not specify any adverse events associated with the PJT intervention, it is unclear if there was an attempt by the researchers to comprehensively record all possible adverse events. Therefore, future studies are encouraged to describe with more detailed data about possible injuries, pain and/ or any other potential adverse effects, as this would expand our knowledge on the safety of PJT. Finally, only two of the included studies recruited youth female soccer players, and their biological maturity was not described. Considering the potential of biological maturity as a moderator of the effects of PJT on youth female physical fitness adaptations [96,97,98], future studies should strive for the inclusion of biological maturity description among youth female soccer players.
4.10. Practical Applications Derived from the Systematic Review
According to the results of our meta-analysis female soccer players should incorporate PJT programs into their regular training schedules in order to achieve small-large improvements in several physical fitness measures of key relevance in soccer, including jumping, sprinting, kicking, change of direction speed, and endurance. According to our systematic review results, PJT is effective in both youth and adult female soccer players, (age range: 13–27 years), with or without previous experience in PJT, from amateur to professional level. The PJT among the included studies in this meta-analysis proved to be safe, with no injuries reported. Indeed, PJT may be considered an integral part of neuromuscular training programs focused on injury prevention [9,99].
Regarding the characteristics of effective PJT interventions, it seems that a training frequency of 1-3 sessions per week, during 6–12 weeks, with a maximal- near-maximal intensity, is an adequate stimulus to boost physical fitness. Most studies incorporated some form of drop-like jump, although all the studies included different types of jump drills into their programs. The total number of jumps range between 800 up to 5620 jumps. Caution is warranted when high volume of PJT is prescribed. Indeed, a high volume of PJT may increase the injury risk among female soccer players [73]. As a moderate volume of PJT may be as effective compared to a program with a greater volume [50,100] a moderate-volume of PJT is advised, particularly during initial stages of PJT, in those unexperienced with PJT, poor technical ability, and reduced ability to cope with the eccentric forces associated to jumping drills. In line with the volume of PJT, most studies in the meta-analysis did not incorporated a taper. Such strategy may allow to boost performance before important competitions, thus its incorporation may be adequate, particularly with a high-volume PJT program [101].
Rest between sets range from 30 s up to 300 s, and for inter-repetition rest values from 5 up to 60 s were noticed. As 30 s and 120 s of inter-set rest are equally effective in order to allow significant physical fitness improvements after PJT among soccer players [102], and 15 s of inter-repetition rest is adequate to recover between maximal jumping efforts [103], in order to reduce the total duration of a PJT session, coaches may consider values from the low spectrum of above mentioned rest intervals. The minimum inter-session rest was 48 h among the included studies, which seems a common an adequate minimal recovery time between sessions.
A grass surface was the most common type of surface used among the included studies, which seems to be in line with the training principle of specificity, as soccer players usually train and compete on this type of surface. All the studies included in this meta-analysis incorporated a progressive overload, either in the form of volume, type of drill (e.g., two leg, progressing toward one leg), intensity, or a combination of these. Of note, most studies incorporated PJT during the in-season period, demonstrating that during such period of the season significant improvement in relevant physical fitness measures are possible among female soccer players, which may boost performance during important competitive match dates, thus increasing chances to achieve a better league positioning [4].
5. Conclusions
Several key physical fitness traits for female soccer players may be improved after PJT, including CMJ, DJ, kicking performance, linear speed, COD speed, and aerobic endurance performance, without changing anaerobic performance. Such improvements may be expected after PJT interventions with 6 or more weeks of duration, and among players with different chronological age, competitive level and soccer experience.
Author Contributions
Conceptualization, M.S., J.S.-S. and R.R.-C.; methodology, M.S., F.Y.N., F.M.C., R.R.-C.; software, R.R.-C.; validation, M.S., J.S.-S., F.Y.N., F.M.C., B.R.-M., and R.R.-C., formal analysis, M.S. and R.R.-C., investigation, M.S., B.R.-M.; resources, R.R.-C., data curation, M.S. and R.R.-C. Writing—original draft preparation, M.S. and R.R.-C.; writing—review and editing, M.S., J.S.-S., F.Y.N., F.M.C., B.R.-M., and R.R.-C.; visualization, M.S. and J.S.-S.; supervision, R.R.-C.; project administration, F.Y.N., B.R.-M., and R.R.-C.; funding acquisition, not applicable. All authors have read and agreed to the published version of the manuscript.
Funding
This research received no external funding.
Conflicts of Interest
The authors declare no conflict of interest.
References
- Stølen, T.; Chamari, K.; Castagna, C.; Wisloff, U. Physiology of soccer: An update. Sports Med. 2005, 35, 501–536. [Google Scholar] [CrossRef]
- Faude, O.; Koch, T.; Meyer, T. Straight sprinting is the most frequent action in goal situations in professional football. J. Sports Sci. 2012, 30, 625–631. [Google Scholar] [CrossRef]
- Barnes, C.; Archer, D.T.; Hogg, B.; Bush, M.; Bradley, P.S. The Evolution of Physical and Technical Performance Parameters in the English Premier League. Int. J. Sports Med. 2014, 35, 1095–1100. [Google Scholar] [CrossRef] [PubMed]
- Arnason, A.; Sigurdsson, S.B.; Gudmundsson, A.; Holme, I.; Engebretsen, L.; Bahr, R. Physical Fitness, Injuries, and Team Performance in Soccer. Med. Sci. Sports Exerc. 2004, 36, 278–285. [Google Scholar] [CrossRef] [PubMed]
- Datson, N.; Hulton, A.; Andersson, H.; Lewis, T.; Weston, M.; Drust, B.; Gregson, W. Applied Physiology of Female Soccer: An Update. Sports Med. 2014, 44, 1225–1240. [Google Scholar] [CrossRef]
- Meylan, C.; Trewin, J.; Mckean, K. Quantifying Explosive Actions in International Women’s Soccer. Int. J. Sports Physiol. Perform. 2017, 12, 310–315. [Google Scholar] [CrossRef] [PubMed]
- Devismes, M.; Aeles, J.; Philips, J.; Vanwanseele, B. Sprint force-velocity profiles in soccer players: Impact of sex and playing level. Sports Biomech. 2019. [Google Scholar] [CrossRef]
- Lockie, R.G.; Dawes, J.J.; Jones, M.T. Relationships between Linear Speed and Lower-Body Power with Change-of-Direction Speed in National Collegiate Athletic Association Divisions I and II Women Soccer Athletes. Sports 2018, 6, 30. [Google Scholar] [CrossRef]
- Rössler, R.; Donath, L.; Verhagen, E.; Junge, A.; Schweizer, T.; Faude, O. Exercise-Based Injury Prevention in Child and Adolescent Sport: A Systematic Review and Meta-Analysis. Sports Med. 2014, 44, 1733–1748. [Google Scholar] [CrossRef]
- Stevenson, J.H.; Beattie, C.S.; Schwartz, J.B.; Busconi, B.D. Assessing the Effectiveness of Neuromuscular Training Programs in Reducing the Incidence of Anterior Cruciate Ligament Injuries in Female Athletes: A systematic review. Am. J. Sports Med. 2014, 43, 482–490. [Google Scholar] [CrossRef]
- Lees, A.; Nolan, L. The biomechanics of soccer: A review. J. Sports Sci. 1998, 16, 211–234. [Google Scholar] [CrossRef] [PubMed]
- Ramirez-Campillo, R.; Alvarez, C.; García-Pinillos, F.; Gentil, P.; Moran, J.; Pereira, L.A.; Loturco, I. Plyometric training in young male soccer players: Potential effect of jump height. Pediatric Exerc. Sci. 2019, 31, 306–313. [Google Scholar] [CrossRef] [PubMed]
- LoTurco, I.; Pereira, L.A.; Kobal, R.; Zanetti, V.; Kitamura, K.; Abad, C.C.C.; Nakamura, F.Y. Transference effect of vertical and horizontal plyometrics on sprint performance of high-level U-20 soccer players. J. Sports Sci. 2015, 33, 2182–2191. [Google Scholar] [CrossRef] [PubMed]
- LoTurco, I.; Tricoli, V.; Roschel, H.; Nakamura, F.Y.; Abad, C.C.C.; Kobal, R.; Gil, S.; González-Badillo, J.J. Transference of Traditional Versus Complex Strength and Power Training to Sprint Performance. J. Hum. Kinet. 2014, 41, 265–273. [Google Scholar] [CrossRef]
- Taube, W.; Leukel, C.; Gollhofer, A. How neurons make us jump: The neural control of stretch-shortening cycle movements. Exerc. Sport Sci. Rev. 2012, 40, 106–115. [Google Scholar] [CrossRef]
- Komi, P.V.; Gollhofer, A. Stretch Reflexes Can Have an Important Role in Force Enhancement during SSC Exercise. J. Appl. Biomech. 1997, 13, 451–460. [Google Scholar] [CrossRef]
- Markovic, G.; Mikulic, P. Neuro-Musculoskeletal and Performance Adaptations to Lower-Extremity Plyometric Training. Sports Med. 2010, 40, 859–895. [Google Scholar] [CrossRef]
- Granacher, U.; Elesinski, M.; Ebüsch, D.; Emuehlbauer, T.; Eprieske, O.; Eputa, C.; Egollhofer, A.; Behm, D.G. Effects of Resistance Training in Youth Athletes on Muscular Fitness and Athletic Performance: A Conceptual Model for Long-Term Athlete Development. Front. Physiol. 2016, 7, 164. [Google Scholar] [CrossRef]
- Cormie, P.; McGuigan, M.R.; Newton, R.U. Developing maximal neuromuscular power: Part 2—Training considerations for improving maximal power production. Sports Med. 2011, 41, 125–146. [Google Scholar] [CrossRef]
- Bobbert, M.F. Drop Jumping as a Training Method for Jumping Ability. Sports Med. 1990, 9, 7–22. [Google Scholar] [CrossRef]
- Malisoux, L.; Francaux, M.; Nielens, H.; Theisen, D. Stretch-shortening cycle exercises: An effective training paradigm to enhance power output of human single muscle fibers. J. Appl. Physiol. 2006, 100, 771–779. [Google Scholar] [CrossRef] [PubMed]
- Malisoux, L.; Francaux, M.; Nielens, H.; Renard, P.; Lebacq, J.; Theisen, D. Calcium Sensitivity of Human Single Muscle Fibers following Plyometric Training. Med. Sci. Sports Exerc. 2006, 38, 1901–1908. [Google Scholar] [CrossRef] [PubMed]
- Hammami, M.; Gaamouri, N.; Shephard, R.J.; Chelly, M.S. Effects of Contrast Strength vs. Plyometric Training on Lower-Limb Explosive Performance, Ability to Change Direction and Neuromuscular Adaptation in Soccer Players. J. Strength Cond. Res. 2019, 33, 2094–2103. [Google Scholar] [CrossRef] [PubMed]
- Hammami, R.; Granacher, U.; Makhlouf, I.; Behm, D.G.; Chaouachi, A. Sequencing Effects of Balance and Plyometric Training on Physical Performance in Youth Soccer Athletes. J. Strength Cond. Res. 2016, 30, 3278–3289. [Google Scholar] [CrossRef] [PubMed]
- Ramírez-Campillo, R.; Alvarez, C.; Garcia-Hermoso, A.; Keogh, J.W.L.; García-Pinillos, F.; Pereira, L.A.; LoTurco, I. Effects of jump training on jumping performance of handball players: A systematic review with meta-analysis of randomised controlled trials. Int. J. Sports Sci. Coach. 2020, 15, 584–594. [Google Scholar] [CrossRef]
- Ramirez-Campillo, R.; Andrade, D.C.; Nikolaidis, P.T.; Moran, J.; Clemente, F.M.; Chaabene, H.; Comfort, P. Effects of Plyometric Jump Training on Vertical Jump Height of Volleyball Players: A Systematic Review with Meta-Analysis of Randomized-Controlled Trial. J. Sports Sci. Med. 2020, 19, 489–499. [Google Scholar] [PubMed]
- Ramirez-Campillo, R.; Moran, J.; Chaabène, H.; Granacher, U.; Behm, D.G.; Garcia-Hermoso, A.; Izquierdo, M. Methodological characteristics and future directions for plyometric jump training research: A scoping review update. Scand. J. Med. Sci. Sports 2020, 30, 983–997. [Google Scholar] [CrossRef] [PubMed]
- Ramírez-Campillo, R.; Sanchez-Sanchez, J.; Romero-Moraleda, B.; Yanci, J.A.; Garcia-Hermoso, A.; Clemente, F.M. Effects of plyometric jump training in female soccer player’s vertical jump height: A systematic review with meta-analysis. J. Sports Sci. 2020, 38, 1475–1487. [Google Scholar] [CrossRef]
- Van De Hoef, P.A.; Brauers, J.J.; Van Smeden, M.; Backx, F.J.G.; Brink, M.S. The Effects of Lower-Extremity Plyometric Training on Soccer-Specific Outcomes in Adult Male Soccer Players: A Systematic Review and Meta-Analysis. Int. J. Sports Physiol. Perform. 2020, 15, 3–17. [Google Scholar] [CrossRef]
- De Villarreal, E.S.-S.; Kellis, E.; Kraemer, W.J.; Izquierdo, M. Determining Variables of Plyometric Training for Improving Vertical Jump Height Performance: A Meta-Analysis. J. Strength Cond. Res. 2009, 23, 495–506. [Google Scholar] [CrossRef]
- Murad, M.H.; Asi, N.; Alsawas, M.; Alahdab, F. New evidence pyramid. Evid. Based Med. 2016, 21, 125–127. [Google Scholar] [CrossRef] [PubMed]
- Liberati, A.; Altman, D.G.; Tetzlaff, J.; Mulrow, C.; Gøtzsche, P.C.; Ioannidis, J.P.A.; Clarke, M.; Devereaux, P.J.; Kleijnen, J.; Moher, D. The PRISMA statement for reporting systematic reviews and meta-analyses of studies that evaluate healthcare interventions: Explanation and elaboration. BMJ 2009, 339, b2700. [Google Scholar] [CrossRef] [PubMed]
- Ramirez-Campillo, R.; Álvarez, C.; Garcia-Hermoso, A.; Ramírez-Vélez, R.; Gentil, P.; Asadi, A.; Chaabene, H.; Moran, J.; Meylan, C.; García-De-Alcaraz, A.; et al. Methodological Characteristics and Future Directions for Plyometric Jump Training Research: A Scoping Review. Sports Med. 2018, 48, 1059–1081. [Google Scholar] [CrossRef] [PubMed]
- De Morton, N.A. The PEDro scale is a valid measure of the methodological quality of clinical trials: A demographic study. Aust. J. Physiother. 2009, 55, 129–133. [Google Scholar] [CrossRef]
- Stojanović, E.; Ristić, V.; McMaster, D.T.; Milanović, Z. Effect of Plyometric Training on Vertical Jump Performance in Female Athletes: A Systematic Review and Meta-Analysis. Sports Med. 2017, 47, 975–986. [Google Scholar] [CrossRef]
- Moran, J.; Clark, C.C.T.; Ramírez-Campillo, R.; Davies, M.J.; Drury, B. A Meta-Analysis of Plyometric Training in Female Youth: Its efficacy and shortcomings in the literature. J. Strength Cond. Res. 2019, 33, 1996–2008. [Google Scholar] [CrossRef]
- Moran, J.; Sandercock, G.R.; Ramirez-Campillo, R.; Meylan, C.M.; Collison, J.A.; Parry, D.A. Age-Related Variation in Male Youth Athletes’ Countermovement Jump After Plyometric Training: A meta-analysis of controlled trials. J. Strength Cond. Res. 2017, 31, 552–565. [Google Scholar] [CrossRef]
- Hopkins, W.G.; Marshall, S.W.; Batterham, A.M.; Hanin, J. Progressive Statistics for Studies in Sports Medicine and Exercise Science. Med. Sci. Sports Exerc. 2009, 41, 3–13. [Google Scholar] [CrossRef]
- Higgins, J.P.; Deeks, J.J.; Altman, D.G. Special topics in statistics. In Cochrane Handbook for Systematic Reviews of Interventions; Higgins, J.P., Green, S., Eds.; The Cochrane Collaboration: London, UK, 2008; pp. 481–529. [Google Scholar]
- Egger, M.; Smith, G.D.; Schneider, M.; Minder, C. Bias in meta-analysis detected by a simple, graphical test. BMJ 1997, 315, 629–634. [Google Scholar] [CrossRef]
- Duval, S.; Tweedie, R. Trim and Fill: A Simple Funnel-Plot-Based Method of Testing and Adjusting for Publication Bias in Meta-Analysis. Biometrics 2000, 56, 455–463. [Google Scholar] [CrossRef]
- Shi, L.; Lin, L. The trim-and-fill method for publication bias: Practical guidelines and recommendations based on a large database of meta-analyses. Medicine 2019, 98, e15987. [Google Scholar] [CrossRef] [PubMed]
- Ramírez-Campillo, R.; González-Jurado, J.; Martínez, C.; Nakamura, F.Y.; Peñailillo, L.; Meylan, C.M.; Caniuqueo, A.; Cañas-Jamet, R.; Moran, J.; Alonso-Martínez, A.M.; et al. Effects of plyometric training and creatine supplementation on maximal-intensity exercise and endurance in female soccer players. J. Sci. Med. Sport 2016, 19, 682–687. [Google Scholar] [CrossRef] [PubMed]
- Ramírez-Campillo, R.; Vergara-Pedreros, M.; Henríquez-Olguín, C.; Martínez-Salazar, C.; Álvarez, C.; Nakamura, F.Y.; De La Fuente, C.I.; Caniuqueo, A.; Alonso-Martinez, A.M.; Izquierdo, M. Effects of plyometric training on maximal-intensity exercise and endurance in male and female soccer players. J. Sports Sci. 2016, 34, 687–693. [Google Scholar] [CrossRef] [PubMed]
- Ozbar, N.; Ates, S.; Agopyan, A. The Effect of 8-Week Plyometric Training on Leg Power, Jump and Sprint Performance in Female Soccer Players. J. Strength Cond. Res. 2014, 28, 2888–2894. [Google Scholar] [CrossRef]
- Rubley, M.D.; Haase, A.C.; Holcomb, W.R.; Girouard, T.J.; Tandy, R.D. The Effect of Plyometric Training on Power and Kicking Distance in Female Adolescent Soccer Players. J. Strength Cond. Res. 2011, 25, 129–134. [Google Scholar] [CrossRef]
- Campo, S.S.; Vaeyens, R.; Philippaerts, R.M.; Redondo, J.C.; De Benito, A.M.; Cuadrado, G. Effects of Lower-Limb Plyometric Training on Body Composition, Explosive Strength, and Kicking Speed in Female Soccer Players. J. Strength Cond. Res. 2009, 23, 1714–1722. [Google Scholar] [CrossRef]
- Siegler, J.; Gaskill, S.; Ruby, B. Changes evaluated in soccer-specific power endurance either with or without a 10-week, in-season, intermittent, high-intensity training protocol. J. Strength Cond. Res. 2003, 17, 379–387. [Google Scholar]
- Rosas, F.; Ramírez-Campillo, R.; Martínez, C.; Caniuqueo, A.; Cañas-Jamet, R.; McCrudden, E.; Meylan, C.; Moran, J.; Nakamura, F.Y.; Pereira, L.A.; et al. Effects of Plyometric Training and Beta-Alanine Supplementation on Maximal-Intensity Exercise and Endurance in Female Soccer Players. J. Hum. Kinet. 2017, 58, 99–109. [Google Scholar] [CrossRef]
- Ramirez-Campillo, R.; García-Pinillos, F.; García-Ramos, A.; Yanci, J.; Gentil, P.; Chaabene, H.; Granacher, U. Effects of Different Plyometric Training Frequencies on Components of Physical Fitness in Amateur Female Soccer Players. Front. Physiol. 2018, 9, 934. [Google Scholar] [CrossRef]
- Chimera, N.J.; Swanik, K.A.; Swanik, C.B.; Straub, S.J. Effects of Plyometric Training on Muscle-Activation Strategies and Performance in Female Athletes. J. Athl. Train. 2004, 39, 24–31. [Google Scholar]
- Fischetti, F.; Cataldi, F.; Greco, G. Lower-limb plyometric training improves vertical jump and agility abilities in adult female soccer players. J. Phys. Edu. Sport 2019, 19, 1254–1261. [Google Scholar]
- Komi, P.V. Stretch shortening cycle. In Strength and Power in Sport; Komi, P.V., Ed.; Blackwell Science: Oxford, UK, 2003. [Google Scholar]
- Skrede, T.; Steene-Johannessen, J.; Anderssen, S.A.; Resaland, G.K.; Ekelund, U. The prospective association between objectively measured sedentary time, moderate-to-vigorous physical activity and cardiometabolic risk factors in youth: A systematic review and meta-analysis. Obes. Rev. 2019, 20, 55–74. [Google Scholar] [CrossRef] [PubMed]
- García-Hermoso, A.; Ramirez-Campillo, R.; Izquierdo, M. Is Muscular Fitness Associated with Future Health Benefits in Children and Adolescents? A Systematic Review and Meta-Analysis of Longitudinal Studies. Sports Med. 2019, 49, 1079–1094. [Google Scholar] [CrossRef] [PubMed]
- Moran, J.; Ramírez-Campillo, R.; Granacher, U. Effects of Jumping Exercise on Muscular Power in Older Adults: A Meta-Analysis. Sports Med. 2018, 48, 2843–2857. [Google Scholar] [CrossRef]
- Ramirez-Campillo, R.; Castillo, D.; Raya-González, J.; Moran, J.; De Villarreal, E.S.; Lloyd, R.S. Effects of Plyometric Jump Training on Jump and Sprint Performance in Young Male Soccer Players: A Systematic Review and Meta-analysis. Sports Med. 2020, 50, 2125–2143. [Google Scholar] [CrossRef]
- Ullrich, B.; Pelzer, T.; Pfeiffer, M. Neuromuscular Effects to 6 Weeks of Loaded Countermovement Jumping With Traditional and Daily Undulating Periodization. J. Strength Cond. Res. 2018, 32, 660–674. [Google Scholar] [CrossRef]
- Hammami, M.; Negra, Y.; Aouadi, R.; Shephard, R.J.; Chelly, M.S. Effects of an In-season Plyometric Training Program on Repeated Change of Direction and Sprint Performance in the Junior Soccer Player. J. Strength Cond. Res. 2016, 30, 3312–3320. [Google Scholar] [CrossRef]
- Balsalobre-Fernández, C.; Santos-Concejero, J.; Grivas, G.V. Effects of Strength Training on Running Economy in Highly Trained Runners: A systematic review with meta-analysis of controlled trials. J. Strength Cond. Res. 2016, 30, 2361–2368. [Google Scholar] [CrossRef]
- Saunders, P.U.; Telford, R.D.; Pyne, D.B.; Peltola, E.M.; Cunningham, R.B.; Gore, C.J.; Hawley, J.A. Short-term plyometric training improves running economy in highly trained middle and long distance runners. J. Strength Cond. Res. 2006, 20, 947–954. [Google Scholar] [CrossRef]
- Bobbert, M.F.; Huijing, P.A.; van Ingen Schenau, G.J. Drop jumping. II. The influence of dropping height on the biomechanics of drop jumping. Med. Sci. Sports Exerc. 1987, 19, 339–346. [Google Scholar] [CrossRef]
- Bobbert, M.F.; Huijing, P.A.; van Ingen Schenau, G.J. Drop jumping. I. The influence of jumping technique on the biomechanics of jumping. Med. Sci. Sports Exerc. 1987, 19, 332–338. [Google Scholar] [CrossRef] [PubMed]
- Sheppard, J.M.; Young, W.B. Agility literature review: Classifications, training and testing. J. Sports Sci. 2006, 24, 919–932. [Google Scholar] [CrossRef] [PubMed]
- Tous-Fajardo, J.; Gonzalo-Skok, O.; Arjol-Serrano, J.L.; Tesch, P. Enhancing Change-of-Direction Speed in Soccer Players by Functional Inertial Eccentric Overload and Vibration Training. Int. J. Sports Physiol. Perform. 2016, 11, 66–73. [Google Scholar] [CrossRef] [PubMed]
- Castellano, J.; Casamichana, D.; Lago, C. The Use of Match Statistics that Discriminate Between Successful and Unsuccessful Soccer Teams. J. Hum. Kinet. 2012, 31, 137–147. [Google Scholar] [CrossRef]
- Liu, H.; Hopkins, W.G.; Gómez, M. Ángel Modelling relationships between match events and match outcome in elite football. Eur. J. Sport Sci. 2016, 16, 516–525. [Google Scholar] [CrossRef]
- Yi, Q.; Ruano, M.; Liu, H.; Sampaio, J. Variation of match statistics and football teams’ match performance in the group stage of the EUFA Champions league from 2010 to 2017. Kinesiology 2019, 51, 170–181. [Google Scholar] [CrossRef]
- Michailidis, Y.; Fatouros, I.G.; Primpa, E.; Michailidis, C.; Avloniti, A.; Chatzinikolaou, A.; Barbero-Álvarez, J.C.; Tsoukas, D.; Douroudos, I.I.; Draganidis, D.; et al. Plyometrics’ Trainability in Preadolescent Soccer Athletes. J. Strength Cond. Res. 2013, 27, 38–49. [Google Scholar] [CrossRef]
- Lees, A.; Asai, T.; Andersen, T.B.; Nunome, H.; Sterzing, T. The biomechanics of kicking in soccer: A review. J. Sports Sci. 2010, 28, 805–817. [Google Scholar] [CrossRef]
- Bouguezzi, R.; Chaabene, H.; Negra, Y.; Ramirez-Campillo, R.; Jlalia, Z.; Mkaouer, B.; Hachana, Y. Effects of Different Plyometric Training Frequencies on Measures of Athletic Performance in Prepuberal Male Soccer Players. J. Strength Cond. Res. 2020, 34, 1609–1617. [Google Scholar] [CrossRef]
- Ford, P.; Croix, M.D.S.; Lloyd, R.; Meyers, R.; Moosavi, M.; Oliver, J.; Till, K.; Williams, C. The Long-Term Athlete Development model: Physiological evidence and application. J. Sports Sci. 2011, 29, 389–402. [Google Scholar] [CrossRef]
- Brumitt, J.; Wilson, V.; Ellis, N.; Petersen, J.; Zita, C.J.; Reyes, J. Preseason lower extremity functional test scores are not associated with lower quadrant injury—A validation study with normative data on 395 division III athletes. Int. J. Sports Phys. Ther. 2018, 13, 410–421. [Google Scholar] [CrossRef] [PubMed]
- Vigne, G.; Gaudino, C.; Rogowski, I.; Alloatti, G.; Hautier, C. Activity Profile in Elite Italian Soccer Team. Int. J. Sports Med. 2010, 31, 304–310. [Google Scholar] [CrossRef] [PubMed]
- Mero, A. Force-Time Characteristics and Running Velocity of Male Sprinters during the Acceleration Phase of Sprinting. Res. Q. Exerc. Sport 1988, 59, 94–98. [Google Scholar] [CrossRef]
- Mero, A.; Komi, P.V.; Gregor, R.J. Biomechanics of Sprint Running. Sports Med. 1992, 13, 376–392. [Google Scholar] [CrossRef] [PubMed]
- Morin, J.-B.; Bourdin, M.; Edouard, P.; Peyrot, N.; Samozino, P.; Lacour, J.-R. Mechanical determinants of 100-m sprint running performance. Eur. J. Appl. Physiol. 2012, 112, 3921–3930. [Google Scholar] [CrossRef] [PubMed]
- Jiménez-Reyes, P.; Garcia-Ramos, A.; Párraga-Montilla, J.A.; Morcillo-Losa, J.A.; Cuadrado-Peñafiel, V.; Castaño-Zambudio, A.; Samozino, P.; Morin, J.-B. Seasonal Changes in the Sprint Acceleration Force-Velocity Profile of Elite Male Soccer Players. J. Strength Cond. Res. 2020. [Google Scholar] [CrossRef]
- Jiménez-Reyes, P.; Samozino, P.; Brughelli, M.; Morin, J.-B. Effectiveness of an Individualized Training Based on Force-Velocity Profiling during Jumping. Front. Physiol. 2017, 7, 677. [Google Scholar] [CrossRef]
- Jiménez-Reyes, P.; Samozino, P.; Morin, J.-B. Optimized training for jumping performance using the force-velocity imbalance: Individual adaptation kinetics. PLoS ONE 2019, 14, e0216681. [Google Scholar] [CrossRef]
- Krustrup, P.; Mohr, M.; Ellingsgaard, H.; Bangsbo, J. Physical Demands during an Elite Female Soccer Game: Importance of Training Status. Med. Sci. Sports Exerc. 2005, 37, 1242–1248. [Google Scholar] [CrossRef]
- Ebben, W.P.; Fauth, M.L.; Garceau, L.R.; Petushek, E.J. Kinetic Quantification of Plyometric Exercise Intensity. J. Strength Cond. Res. 2011, 25, 3288–3298. [Google Scholar] [CrossRef]
- Ebben, W.P.; Simenz, C.; Jensen, R.L. Evaluation of Plyometric Intensity Using Electromyography. J. Strength Cond. Res. 2008, 22, 861–868. [Google Scholar] [CrossRef] [PubMed]
- Jones, P.A.; Thomas, C.; Dos’Santos, T.; McMahon, J.J.; Graham-Smith, P. The Role of Eccentric Strength in 180° Turns in Female Soccer Players. Sports 2017, 5, 42. [Google Scholar] [CrossRef]
- Falch, H.N.; Rædergård, H.G.; Tillaar, R.V.D. Association of strength and plyometric exercises with change of direction performances. PLoS ONE 2020, 15, e0238580. [Google Scholar] [CrossRef] [PubMed]
- Castagna, C.; D’Ottavio, S.; Gabrielli, P.R.; Póvoas, S. Sprint Endurance Abilities in Elite Female Soccer Players. Int. J. Sports Physiol. Perform. 2020, 15, 1–7. [Google Scholar] [CrossRef] [PubMed]
- Bishop, D.; Edge, J.; Goodman, C. Muscle buffer capacity and aerobic fitness are associated with repeated-sprint ability in women. Eur. J. Appl. Physiol. 2004, 92, 540–547. [Google Scholar] [CrossRef]
- Berryman, N.; Maurel, D.; Bosquet, L. Effect of Plyometric vs. Dynamic Weight Training on the Energy Cost of Running. J. Strength Cond. Res. 2010, 24, 1818–1825. [Google Scholar] [CrossRef]
- Girard, O.; Mendez-Villanueva, A.; Bishop, D. Repeated-sprint ability—Part I: Factors contributing to fatigue. Sports Med. 2011, 41, 673–694. [Google Scholar] [CrossRef]
- Mendez-Villanueva, A.; Hamer, P.; Bishop, D. Fatigue in repeated-sprint exercise is related to muscle power factors and reduced neuromuscular activity. Eur. J. Appl. Physiol. 2008, 103, 411–419. [Google Scholar] [CrossRef]
- Da Silva, J.F.; Guglielmo, L.G.; Bishop, D. Relationship Between Different Measures of Aerobic Fitness and Repeated-Sprint Ability in Elite Soccer Players. J. Strength Cond. Res. 2010, 24, 2115–2121. [Google Scholar] [CrossRef]
- Negra, Y.; Chaabene, H.; Fernandez-Fernandez, J.; Sammoud, S.; Bouguezzi, R.; Prieske, O.; Granacher, U. Short-Term Plyometric Jump Training Improves Repeated-Sprint Ability in Prepuberal Male Soccer Players. J. Strength Cond. Res. 2020, 34, 3241–3249. [Google Scholar] [CrossRef]
- Chtara, M.; Rouissi, M.; Haddad, M.; Chtara, H.; Chaalali, A.; Owen, A.; Chamari, K. Specific physical trainability in elite young soccer players: Efficiency over 6 weeks’ in-season training. Biol. Sport 2017, 34, 137–148. [Google Scholar] [CrossRef] [PubMed]
- Spineti, J.; Figueiredo, T.; De Oliveira, V.B.; Assis, M.; De Oliveira, L.F.; Miranda, H.; Reis, V.M.D.R.; Simão, R. Comparison between traditional strength training and complex contrast training on repeated-shuttle-sprint ability and muscle architecture in male elite soccer players. J. Sports Med. Phys. Fit. 2015, 56, 1269–1278. [Google Scholar]
- Altman, D.G.; Royston, P. The cost of dichotomising continuous variables. BMJ 2006, 332, 1080. [Google Scholar] [CrossRef] [PubMed]
- Radnor, J.M.; Oliver, J.L.; Waugh, C.M.; Myer, G.D.; Moore, I.S.; Lloyd, R.S. The Influence of Growth and Maturation on Stretch-Shortening Cycle Function in Youth. Sports Med. 2018, 48, 57–71. [Google Scholar] [CrossRef]
- Romero, C.; Ramirez-Campillo, R.; Alvarez, C.; Moran, J.; Slimani, M.; Gonzalez, J.; Banzer, W.E. Effects of Maturation on Physical Fitness Adaptations to Plyometric Jump Training in Youth Females. J. Strength Cond. Res. 2019. [Google Scholar] [CrossRef]
- Davies, M.J.; Drury, B.; Ramirez-Campillo, R.; Chaabane, H.; Moran, J. Effect of Plyometric Training and Biological Maturation on Jump and Change of Direction Ability in Female Youth. J. Strength Cond. Res. 2019. [Google Scholar] [CrossRef]
- Ter Stege, M.H.P.; Dallinga, J.M.; Benjaminse, A.; Lemmink, K.A.P.M. Effect of Interventions on Potential, Modifiable Risk Factors for Knee Injury in Team Ball Sports: A Systematic Review. Sports Med. 2014, 44, 1403–1426. [Google Scholar] [CrossRef]
- De Villarreal, E.S.S.; González-Badillo, J.J.; Izquierdo, M. Low and Moderate Plyometric Training Frequency Produces Greater Jumping and Sprinting Gains Compared with High Frequency. J. Strength Cond. Res. 2008, 22, 715–725. [Google Scholar] [CrossRef]
- Ramirez-Campillo, R.; Pereira, L.A.; Andrade, D.; Méndez-Rebolledo, G.; De La Fuente, C.I.; Castro-Sepulveda, M.; García-Pinillos, F.; Freitas, T.T.; LoTurco, I. Tapering strategies applied to plyometric jump training: A systematic review with meta-analysis of randomized-controlled trials. J. Sports Med. Phys. Fitness 2020. [Google Scholar] [CrossRef]
- Ramirez-Campillo, R.; Andrade, D.C.; Alvarez, C.; Henríquez-Olguín, C.; Martínez, C.; Báez-Sanmartín, E.; Silva-Urra, J.; Burgos, C.; Izquierdo, M. The Effects of Interset Rest on Adaptation to 7 Weeks of Explosive Training in Young Soccer Players. J. Sports Sci. Med. 2014, 13, 287–296. [Google Scholar]
- Read, M.M.; Cisar, C. The influence of varied rest interval lengths on depth jump performance. J. Strength Cond. Res. 2001, 15, 279–283. [Google Scholar] [PubMed]


Publisher’s Note: MDPI stays neutral with regard to jurisdictional claims in published maps and institutional affiliations. |
© 2020 by the authors. Licensee MDPI, Basel, Switzerland. This article is an open access article distributed under the terms and conditions of the Creative Commons Attribution (CC BY) license (http://creativecommons.org/licenses/by/4.0/).