
Local Food Environment and Consumption of Ultra-Processed Foods: Cross-Sectional Data from the Nutritionists’ Health Study—NutriHS
 , ,
, ,  , , and
Abstract
:1. Introduction
2. Materials and Methods
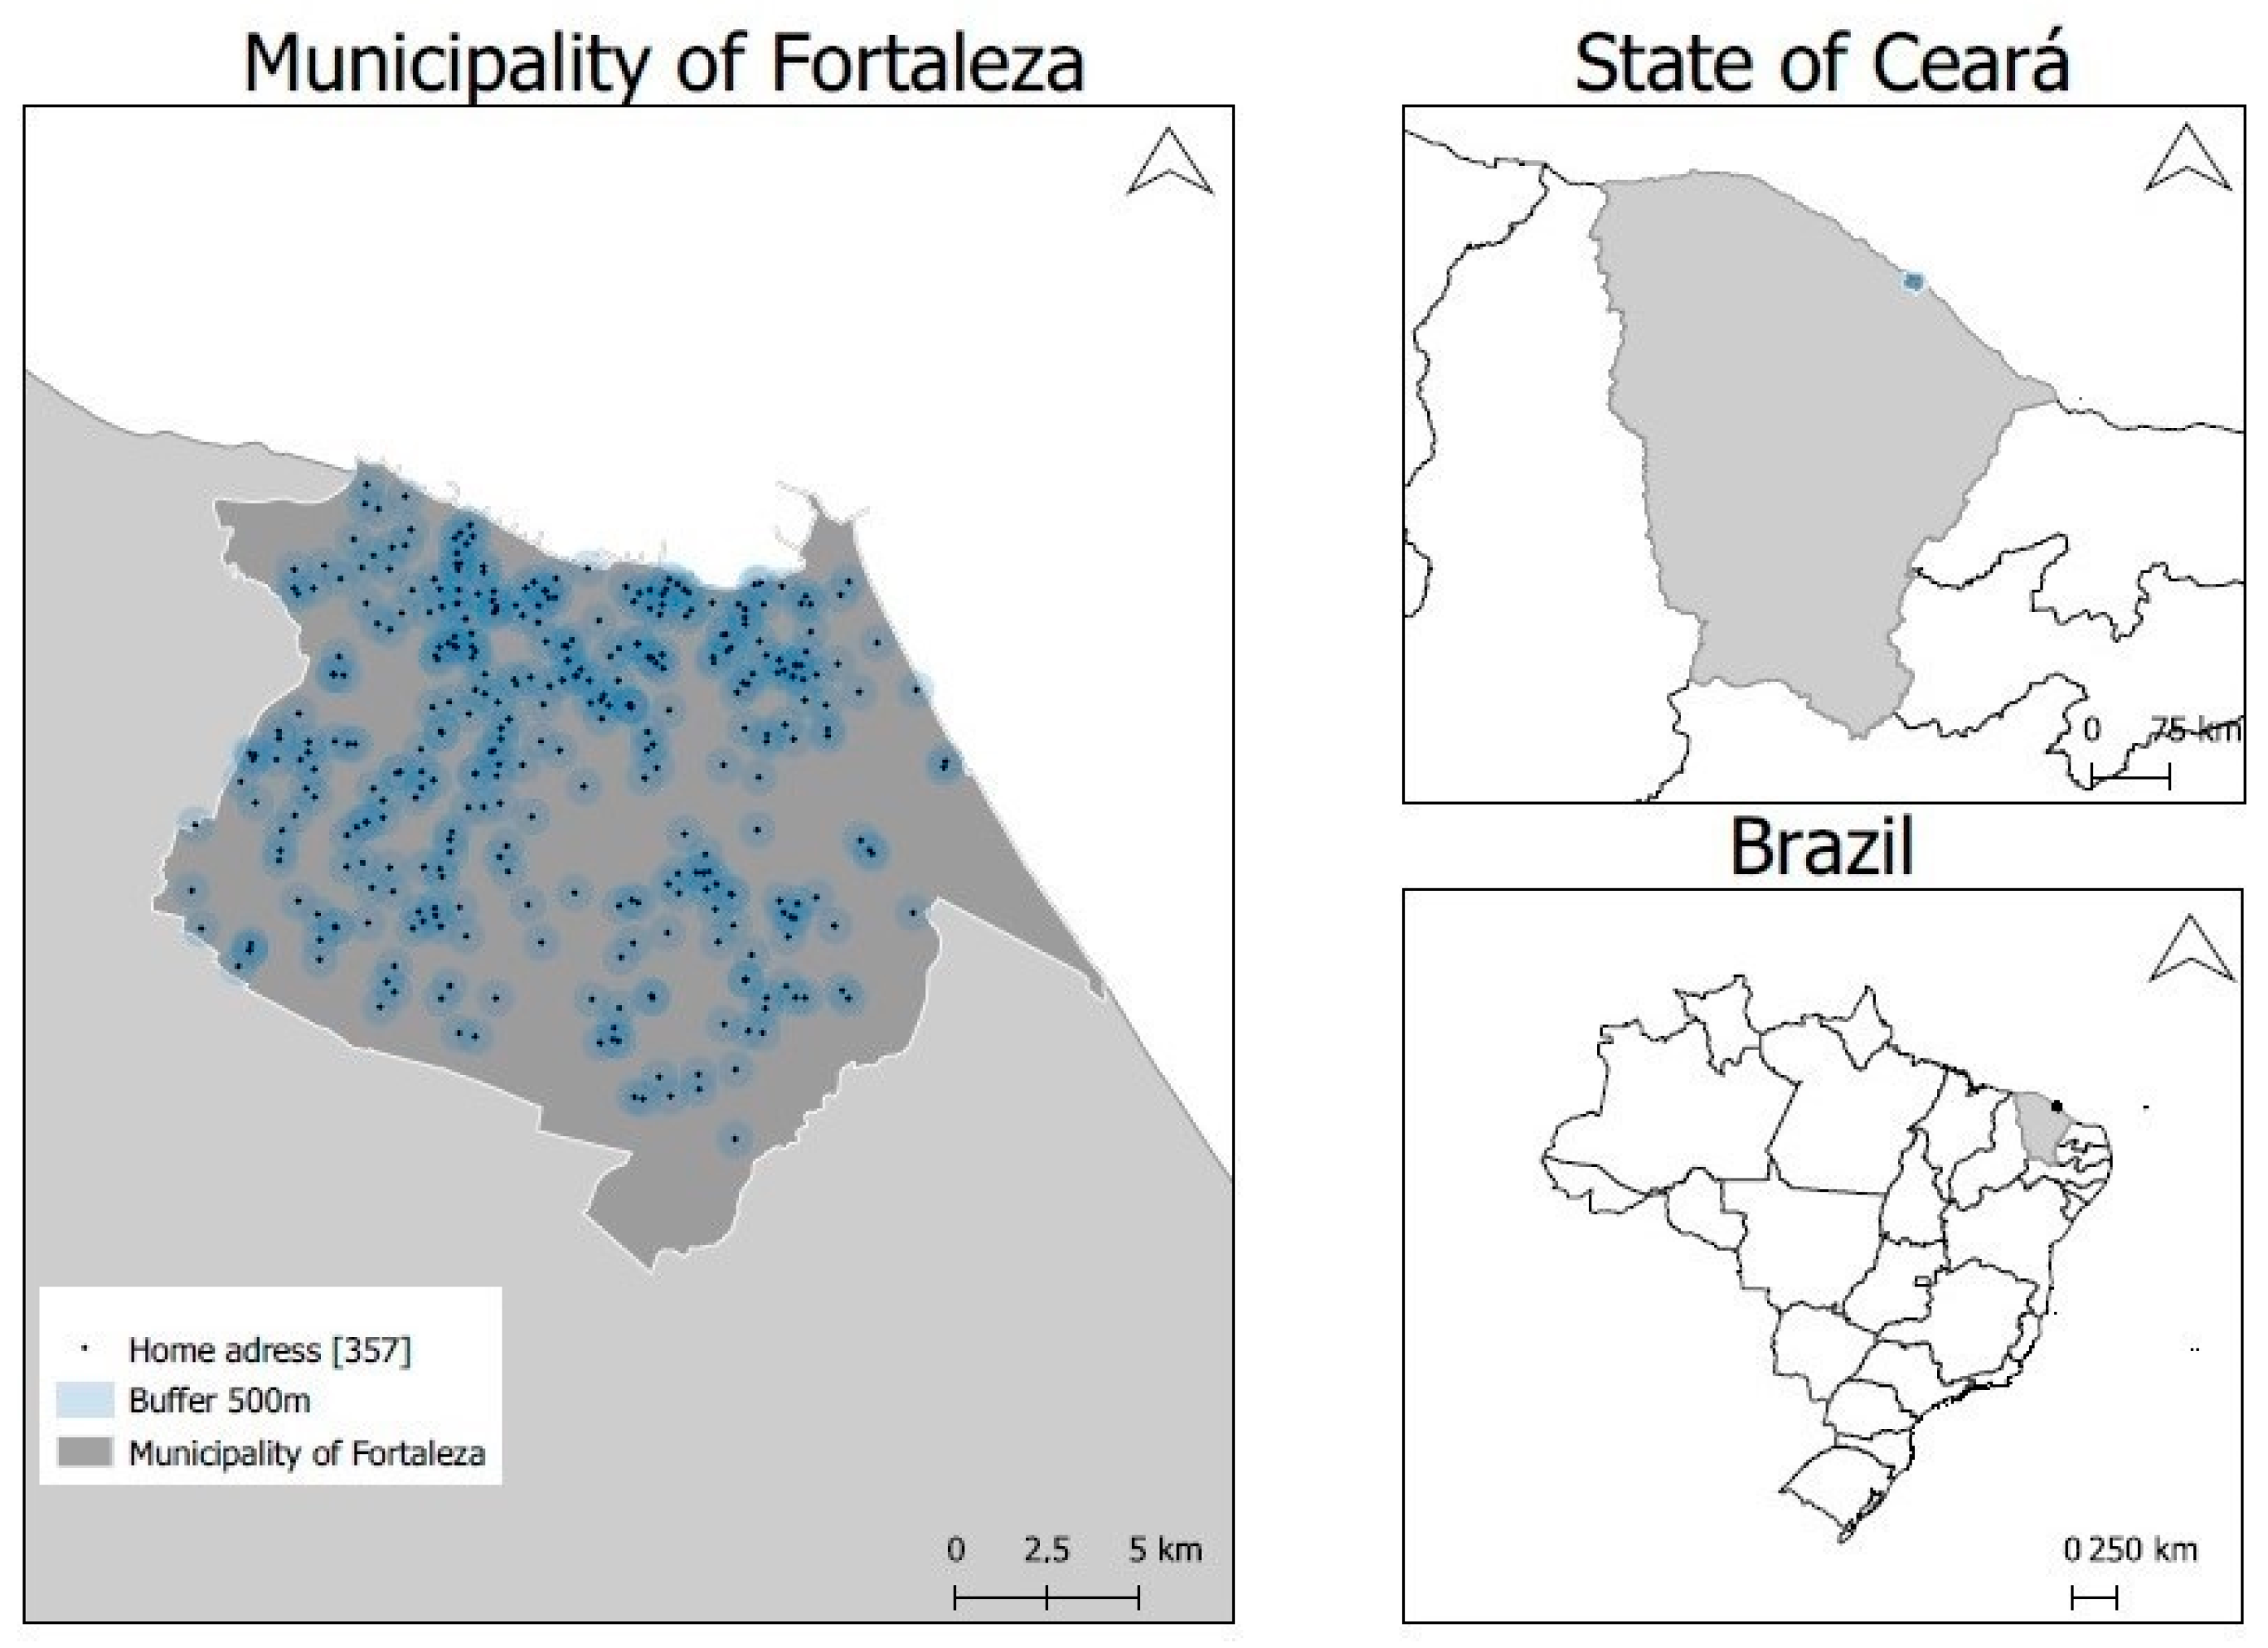
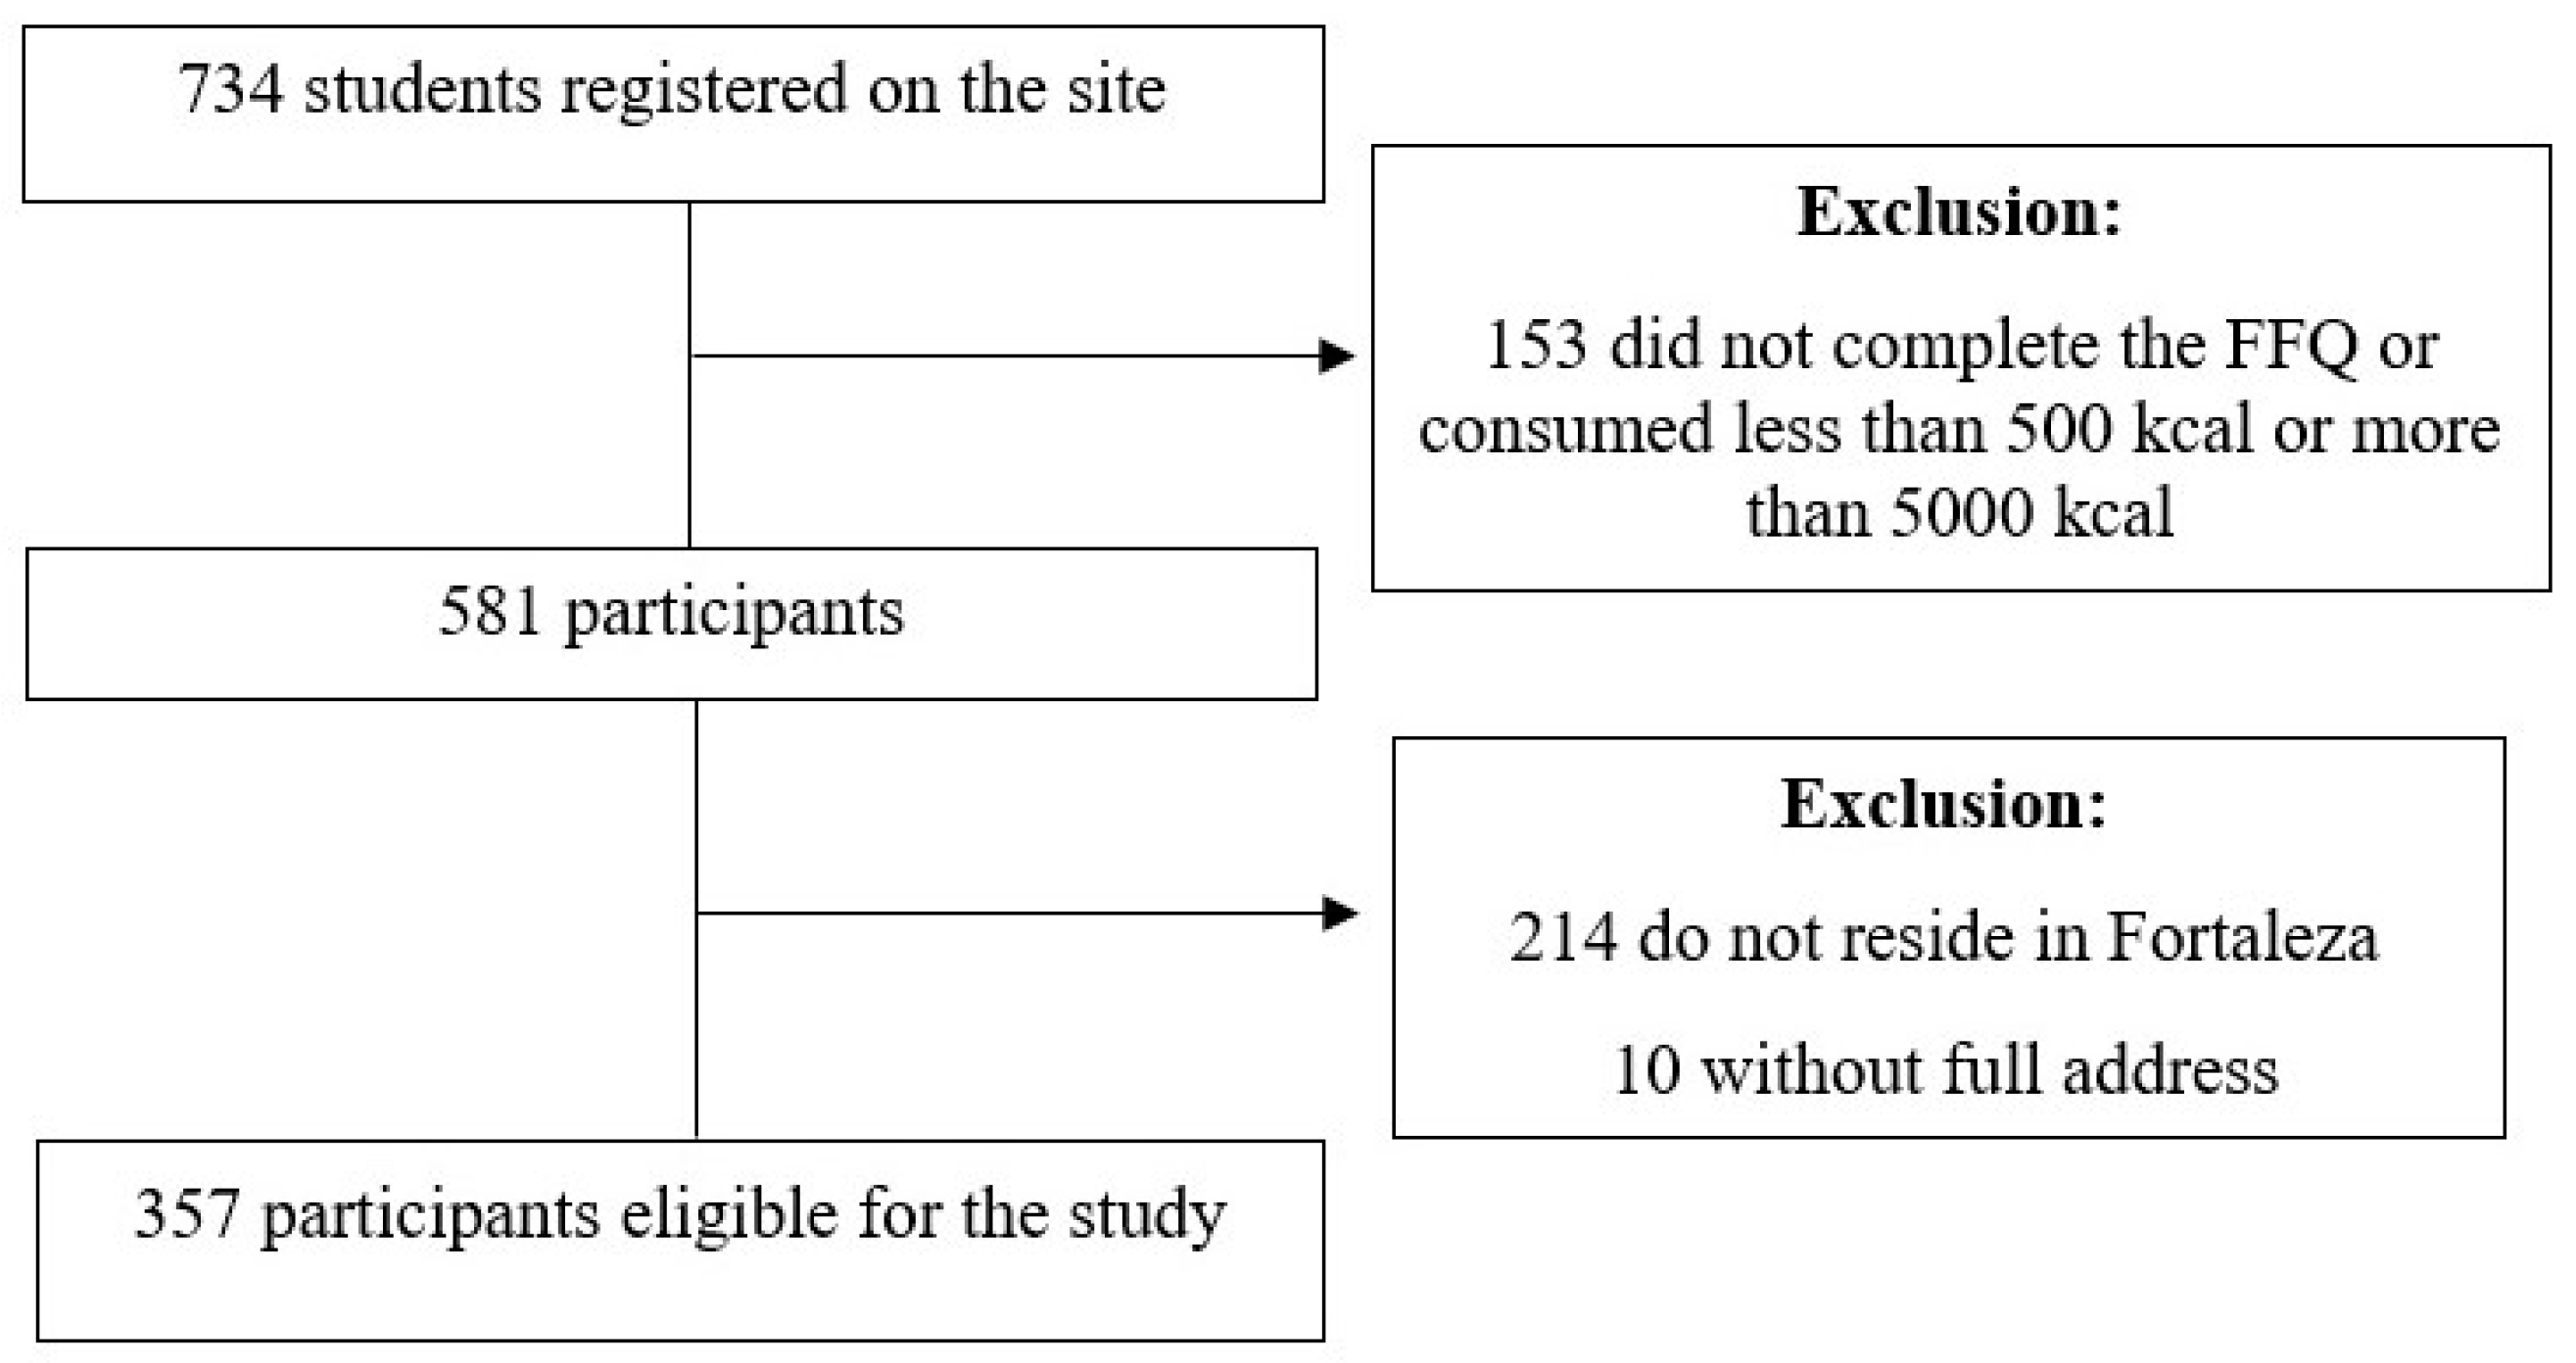
2.1. Study Scenario and Sample
2.2. Data Collection and Processing
2.2.1. Sociodemographic Characteristics
2.2.2. Anthropometric Data
2.2.3. Physical Activity
2.2.4. Food Consumption
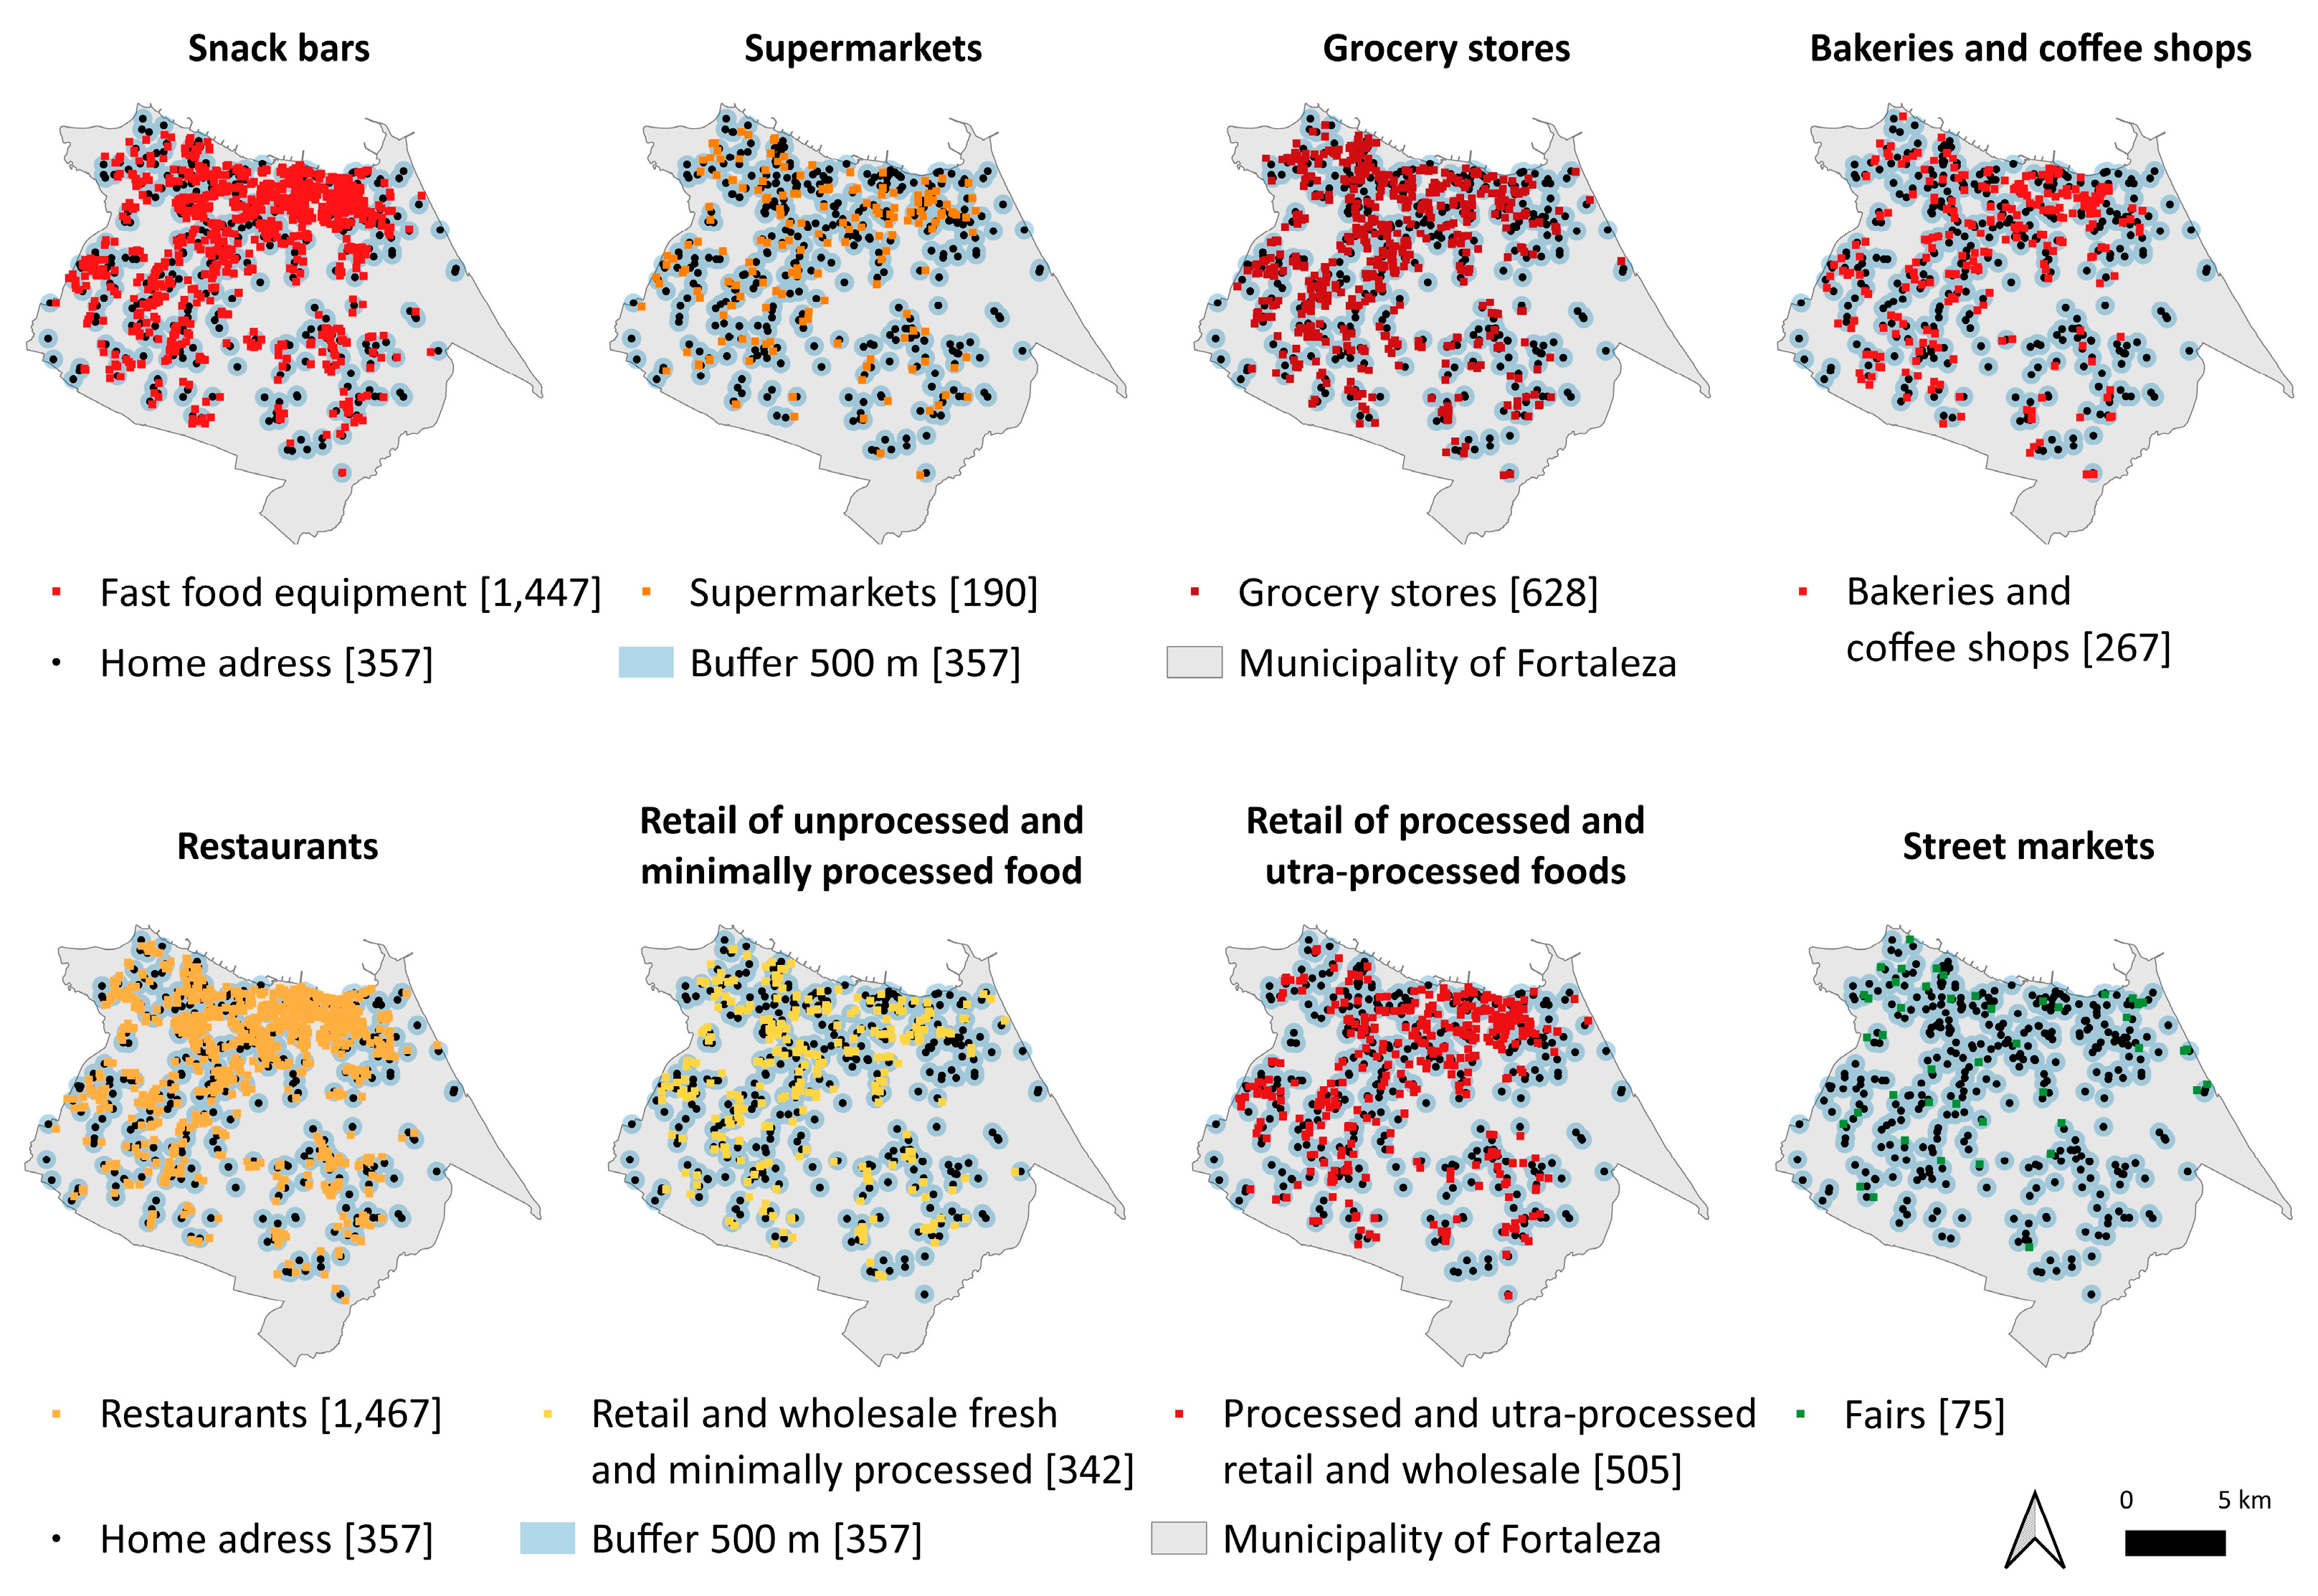
2.2.5. Local Food Environment
2.2.6. Statistical Analysis
3. Results
4. Discussion
5. Conclusions
Author Contributions
Funding
Institutional Review Board Statement
Informed Consent Statement
Data Availability Statement
Acknowledgments
Conflicts of Interest
References
- Machado, P.P.; Steele, E.M.; Levy, R.B.; Louzada, M.L.d.C.; Rangan, A.; Woods, J.; Gill, T.; Scrinis, G.; Monteiro, C.A. Ultra-processed food consumption and obesity in the Australian adult population. Nutr. Diabetes 2020, 10, 39. [Google Scholar] [CrossRef]
- Nasreddine, L.; Tamim, H.; Itani, L.; Nasrallah, M.P.; Isma’eel, H.; Nakhoul, N.F.; Abou-Rizk, J.; Naja, F. A minimally processed dietary pattern is associated with lower odds of metabolic syndrome among Lebanese adults. Public Health Nutr. 2018, 21, 160–171. [Google Scholar] [CrossRef]
- Elizabeth, L.; Machado, P.; Zinöcker, M.; Baker, P.; Mark, L. Ultra-processed foods and health outcomes: A narrative review. Nutrients 2020, 12, 1955. [Google Scholar] [CrossRef]
- Monteiro, C.A.; Cannon, G.; Levy, R.; Moubarac, J.C.; Martins, A.P.; Canella, D.; Louzada, M.; Parra, D. NOVA. The star shines bright. World Nutr. 2016, 7, 28–38. [Google Scholar]
- Monteiro, C.A.; Moubarac, J.C.; Cannon, G.; Ng, S.W.; Popkin, B. Ultra-processed products are becoming dominant in the global food system. Obes. Rev. 2013, 14, 21–28. [Google Scholar] [CrossRef]
- Zobel, E.H.; Hansen, T.W.; Rossing, P.; Scholten, B.J. Global changes in food supply and the obesity epidemic. Curr. Obes. Rep. 2016, 5, 449–455. [Google Scholar] [CrossRef]
- Downs, S.M.; Ahmed, S.; Fanzo, J.; Herforth, A. Food environment typology: Advancing an expanded definition, framework, and methodological approach for improved characterization of wild, cultivated, and built food environments toward sustainable diets. Foods 2020, 9, 532. [Google Scholar] [CrossRef]
- Glanz, K.; Sallis, J.F.; Saelens, B.E.; Frank, L.D. Healthy nutrition environments: Concepts and measures. Am. J. Health Promot. 2005, 19, 330–333. [Google Scholar] [CrossRef]
- Crino, M.; Sacks, G.; Vandevijvere, S.; Swinburn, B.; Neal, B. The influence on population weight gain and obesity of the macronutrient composition and energy density of the food supply. Curr. Obes. Rep. 2015, 4, 1–10. [Google Scholar] [CrossRef]
- Swinburn, B.; Kraak, V.; Rutter, H.; Vandevijvere, S.; Lobstein, T.; Sacks, G. Strengthening of accountability systems to create healthy food environments and reduce global obesity. Lancet 2015, 385, 2534–2545. [Google Scholar] [CrossRef]
- Murphy, M.; Koohsari, M.J.; Badland, H.; Giles-Corti, B. Supermarket access, transport mode and BMI: The potential for urban design and planning policy across socio-economic areas. Public Health Nutr. 2017, 20, 3304–3315. [Google Scholar] [CrossRef]
- Walker, B.B.; Shashank, A.; Gasevic, D.; Schuurman, N.; Poirier, P.; Teo, K.; Rangarajan, S.; Yusuf, S.; Lear, S.A. The local food environment and obesity: Evidence from three cities. Obesity 2020, 28, 40–45. [Google Scholar] [CrossRef]
- Canuto, R.; Fanton, M.; Lira, P.I.C. Iniquidades sociais no consumo alimentar no Brasil: Uma revisão crítica dos inquéritos nacionais. Cienc. Saude Coletiva. 2019, 24, 3193–3212. [Google Scholar] [CrossRef]
- Bernardo, G.L.; Jomori, M.M.; Fernandes, A.C.; Proença, R.P.C. Food intake of university students. Rev. Nutr. 2017, 30, 847–865. [Google Scholar] [CrossRef]
- Freitas, P.P.; Menezes, M.C.; Lopes, A.C.S. Consumer food environment and overweight. Nutrition 2019, 66, 108–114. [Google Scholar] [CrossRef]
- Nogueira, L.R.; Fontanelli, M.d.M.; de Aguiar, B.S.; Failla, M.A.; Florindo, A.A.; Leme, A.C.; Barbosa, J.P.d.A.S.; Fisberg, R.M. Is the local food environment associated with excess body weight in adolescents in São Paulo, Brazil? Cad. Saude Publica 2020, 36, e00048619. [Google Scholar] [CrossRef]
- Paulitsch, R.G.; Dumith, S.C. Is food environment associated with body mass index, overweight and obesity? A study with adults and elderly subjects from southern Brazil. Prev. Med. Rep. 2021, 21, 101313–101319. [Google Scholar] [CrossRef]
- De Deus Mendonça, R.; Pimenta, A.M.; Gea, A.; De La Fuente-Arrillaga, C.; Martinez-Gonzalez, M.A.; Lopes, A.C.S.; Bes-Rastrollo, M. Ultraprocessed food consumption and risk of overweight and obesity: The University of Navarra Follow-Up (SUN) cohort study. Am. J. Clin. Nutr. 2016, 104, 1433–1440. [Google Scholar] [CrossRef]
- Mendonça, R.D.; Lopes, A.C.S.; Pimenta, A.M.; Gea, A.; Martinez-Gonzalez, M.; Bes-Rastrollo, M. Ultra-processed food consumption and the incidence of hypertension in a Mediterranean cohort: The Seguimiento Universidad de Navarra Project. Am. J. Hypertens. 2017, 30, 358–366. [Google Scholar] [CrossRef]
- Souza, T.N.; Andrade, G.C.; Rauber, F.; Levy, R.B.; da Costa Louzada, M.L. Consumption of ultra-processed foods and the eating location: Can they be associated? Br. J. Nutr. 2021, 128, 1587–1594. [Google Scholar] [CrossRef]
- Pinho, M.G.M.; Lakerveld, J.; Harbers, M.C.; Sluijs, I.; Vermeulen, R.; Huss, A.; Boer, J.M.A.; Verschuren, W.M.M.; Brug, J.; Beulens, J.W.J.; et al. Ultra-processed food consumption patterns among older adults in the Netherlands and the role of the food environment. Eur. J. Nutr. 2020, 60, 2567–2580. [Google Scholar] [CrossRef]
- Folchetti, L.G.D.; Silva, I.T.; Almeida-Pititto, B.; Ferreira, S.R.G. Nutritionists’ Health Study cohort: A web-based approach of life events, habits and health outcomes. BMJ Open 2016, 6, e012081. [Google Scholar] [CrossRef]
- Instituto Brasileiro de Geografia e Estatística. IBGE Cidades; IBGE: Rio de Janeiro, Brazil, 2021. Available online: https://cidades.ibge.gov.br/brasil/ce/fortaleza/panorama (accessed on 17 May 2021).
- Ranking Universitário Folha. 2019. Available online: https://ruf.folha.uol.com.br/2019/ranking-de-universidades/principal/ (accessed on 17 May 2021).
- Willett, W. Nutritional Epidemiology; Oxford University Press: Oxford, UK, 2012. [Google Scholar]
- Diário Oficial da União. Decreto n 9.255, de 29 de dezembro de 2017. In Dispõe Sobre o Valor do Salário-Mínimo Em 2018 e a Sua Política de Valorização de Longo Prazo; Diário Oficial da União: Brasília, Brazil, 2017. [Google Scholar]
- World Health Organization. The Use and Interpretation of Anthropometry; WHO Technical Report Series, 854; World Health Organization: Geneva, Switzerland, 1995. [Google Scholar]
- Olfert, M.D.; Barr, M.L.; Charlier, C.M.; Famodu, O.A.; Zhou, W.; Mathews, A.E.; Byrd-Bredbenner, C.; Colby, S.E. Self-Reported vs. Self-reported vs. measured height, weight, and BMI in young adults. Int. J. Environ. Res. Public Health 2018, 15, 2216. [Google Scholar] [CrossRef]
- Hodge, J.M.; Shah, R.; McCullough, M.L.; Gapstur, S.M.; Patel, A.V. Validation of self-reported height and weight in a large, nationwide cohort of US adults. PLoS ONE 2020, 15, e0231229. [Google Scholar] [CrossRef]
- Craig, C.L.; Marshall, A.L.; Sjöström, M.; Bauman, A.E.; Booth, M.L.; Ainsworth, B.E.; Pratt, M.; Ekelund, U.; Yngve, A.; Sallis, J.F.; et al. International physical activity questionnaire: 12-country reliability and validity. Med. Sci. Sports Exerc. 2003, 35, 1381–1395. [Google Scholar] [CrossRef]
- World Health Organization. Physical Acivity. In Fact Sheets; World Health Organization: Geneva, Switzerland, 2020; Available online: https://www.who.int/news-room/fact-sheets/detail/physical-activity (accessed on 24 November 2021).
- Selem, S.S.A.C.; Carvalho, A.M.; Verly-Junior, E.; Carlos, J.V.; Teixeira, J.A.; Marchioni, D.M.L.; Fisberg, R.M. Validade e reprodutibilidade de um questionário de frequência alimentar para adultos de São Paulo, Brasil. Rev. Bras. Epidemiol. 2014, 17, 852–859. [Google Scholar] [CrossRef]
- Louzada, M.L.d.C.; Martins, A.P.B.; Canella, D.S.; Baraldi, L.G.; Levy, R.B.; Claro, R.M.; Moubarac, J.-C.; Cannon, G.; Monteiro, C.A. Ultra-processed foods and the nutritional dietary profile in Brazil. Rev. Saude Publica 2015, 49, 38. [Google Scholar] [CrossRef]
- Berti, T.L.; Rocha, T.F.; Curioni, C.C.; Verly Junior, E.; Bezerra, F.F.; Canella, D.S.; Faerstein, E. Consumo alimentar segundo o grau de processamento e características sociodemográficas: Estudo Pró-Saúde. Rev. Bras. Epidemiol. 2019, 22, e190046. [Google Scholar] [CrossRef]
- Prefeitura Municipal de Fortaleza. Secretaria Municipal de Saúde. Portaria n 49/2021. Regulamenta as Atividades de Interesse Sanitário Sujeitas a Licenciamento Sanitário Bem Como as Atividades de Interesse Sanitário Dispensadas de Licença Sanitária. SMS: Fortaleza, Brazil, 2021. Available online: https://www.legisweb.com.br/legislacao/?id=409465 (accessed on 24 November 2021).
- Instituto Brasileiro de Geografia e Estatística. Censo Demográfico do Brasil 2010; IBGE: Rio de Janeiro, Brazil, 2010. Available online: http://www.censo2010.ibge.gov.br/sinopse/index.php?uf=23&dados=0 (accessed on 24 November 2021).
- Costa, J.C.; Claro, R.M.; Martins, A.P.B.; Levy, R.B. Food purchasing sites. Repercussions for healthy eating. Appetite 2013, 70, 99–103. [Google Scholar] [CrossRef]
- Ministério do Desenvolvimento Social. Secretaria Executiva da Câmara Interministerial de Segurança Alimentar e Nutricional. Mapeamento dos Desertos Alimentares no Brasil; Câmara Interministerial de Segurança Alimentar e Nutricional: Brasília, Brazil, 2018. Available online: https://aplicacoes.mds.gov.br/sagirmps/noticias/arquivos/files/Estudo_T%C3%A9cnico_Mapeamento_Desertos_Alimentares_Final_30_10_2019(1).pdf (accessed on 25 August 2021).
- Santos, M.A.P.; Souza, T.A.; Medeiros, A.A.; Barbosa, I.R. Alcoholic beverage purchase by Brazilian adolescents: Individual and contextual factors associated in a multilevel analysis. Int. J. Drug. Policy 2021, 98, 103428–103435. [Google Scholar] [CrossRef]
- Instituto Brasileiro de Geografia e Estatística. Pesquisa Nacional de Saúde do Escolar 2015; IBGE: Rio de Janeiro, Brazil, 2016. Available online: https://biblioteca.ibge.gov.br/visualizacao/livros/liv97870.pdf (accessed on 24 November 2021).
- Soundararajan, S.; Narayanan, G.; Agrawal, A.; Prabhakaran, D.; Murthy, P. Relation between age at first alcohol drink & adult life drinking patterns in alcohol-dependent patients. J. Med. Res. 2017, 146, 606–611. [Google Scholar]
- Carvalho, B.G.C.; Andrade, A.C.S.; Andrade, R.G.; Mendes, L.L.; Velasquez-Mendez, G.; Xavier, C.C.; Proietti, F.A.; Caiaffa, W.T. Densidade de estabelecimentos que comercializam bebidas alcoólicas na área residencial está associada ao consumo de álcool em adolescentes? Rev. Bras. Epidemiol. 2020, 23, e200089. [Google Scholar] [CrossRef]
- Associação Brasileira da Indústria de Panificação e Confeitaria. Indicadores da Panificação e Confeitaria Brasileira. 2020. Available online: https://www.abip.org.br/site/indicadores-da-panificacao-e-confeitaria-em-2020/ (accessed on 9 December 2021).
- Horta, P.M.; Souza, J.P.M.; Freitas, P.P.; Lopes, A.C.S. Food availability and advertising within food outlets around primary healthcare services in Brazil. J. Nutr. Sci. 2020, 9, e49. [Google Scholar] [CrossRef] [PubMed]
- Rodrigues, D.C.M.; Bosi, M.L.M. O lugar do nutricionista nos Núcleos de Apoio à Saúde da Família. Rev. Nutr. 2014, 27, 735–746. [Google Scholar] [CrossRef]
- Contento, I.R. Overview of determinants of food choice and dietary change: Implications for nutrition education. Nutr. Educ. Link. Res. Theory Pract. 2011, 1, 176–179. [Google Scholar]
- Lima, J.P.; Costa, S.A.; Brandão, T.R.; Rocha, A. Food Consumption Determinants and Barriers for Healthy Eating at the Workplace—A University Setting. Foods 2021, 10, 695. [Google Scholar] [CrossRef]
- Castro-Barquero, S.; Estruch, R. Ultra-processed food consumption and disease: The jury is still out. Eur. Heart J. 2021, 43, 225–227. [Google Scholar] [CrossRef]
- Gibney, M.J. Ultra-processed foods: Definitions and policy issues. Curr. Dev. Nutr. 2018, 3, nzy077. [Google Scholar] [CrossRef] [PubMed]
- Drewnowski, A.; Gupta, S.; Darmon, N. An overlap between “ultraprocessed” foods and the preexisting Nutrient Rich Foods Index? Nutr. Today 2020, 55, 75–81. [Google Scholar] [CrossRef]
- Rocha, L.L.; Carmo, A.S.D.; Jardim, M.Z.; Leme, B.A.; Cardoso, L.d.O.; Caiaffa, W.T.; Andrade, A.C.d.S.; dos Santos, L.C.; Mendes, L.L. The community food environment of a Brazilian metropolis. Food Cult. Soc. 2021, 1, 182–192. [Google Scholar] [CrossRef]


| Variables | N | % |
|---|---|---|
| Sex | ||
| Female | 283 | 79.3 |
| Male | 74 | 20.7 |
| Age group | ||
| <25 years | 258 | 72.3 |
| ≥25 years | 99 | 27.7 |
| Self-declared skin color | ||
| White | 138 | 38.7 |
| Black/brown | 206 | 57.7 |
| Others | 13 | 3.6 |
| Education of the head of the family | ||
| Never attended school / incomplete 1st grade (from 1 to 7 years of study) | 61 | 17.1 |
| Completed 1st degree (from 8 to 10 years of study) | 36 | 10.1 |
| Completed high school (from 11 to 13 years of study) | 156 | 43.7 |
| University (14 years or more of study)/Postgraduate | 104 | 29.1 |
| Family income | ||
| <1 minimum wage | 23 | 6.4 |
| 1–5 minimum wages | 220 | 61.6 |
| 6–10 minimum wages | 58 | 16.2 |
| >10 minimum wages | 39 | 10.9 |
| BMI classification | ||
| Non-overweight/obesity | 223 | 62.5 |
| Overweight/obesity | 134 | 37.5 |
| Moderate and intense physical activity level | ||
| <150 min/week | 121 | 33.9 |
| ≥150 min/week | 232 | 65.0 |
| Regional | ||
| 1 | 42 | 11.8 |
| 2 | 87 | 24.4 |
| 3 | 46 | 12.9 |
| 4 | 49 | 13.7 |
| 5 | 60 | 16.8 |
| 6 | 73 | 20.5 |
| NOVA classification | Mean | Standard deviation |
| Unprocessed/minimally processed, % total energy | 59.3 | 14.7 |
| Culinary ingredients, % total energy | 3.6 | 3.6 |
| Processed, % total energy | 20.4 | 12.6 |
| Ultra-processed, % total energy | 16.7 | 10.4 |
| Establishments in a 500 m buffer | Median | p25–p75 |
| Snack bars | 6 | 2–13 |
| Supermarkets and hypermarkets | 1 | 0–2 |
| Small markets | 4 | 1–6 |
| Bakeries and coffee shops | 1 | 0–2 |
| Restaurants | 6 | 2–11 |
| Retail of processed and ultra-processed foods | 2 | 1–5 |
| Retail of unprocessed and minimally processed foods | 2 | 0–3 |
| N | % | |
| Street markets, ≥1 | 75 | 21.0 |
| Energy Contribution from the Consumption of Unprocessed and Minimally Processed Food a | ||||
|---|---|---|---|---|
| Model 1 b | Model 2 c | |||
| Beta | 95% CI | Beta | 95% CI | |
| Snack bars (n) | ||||
| 1° quartile (0–2) | Reference | Reference | ||
| 2° quartile (3–5) | −0.84 | −5.41, 3.73 | −1.14 | −5.69, 3.40 |
| 3° quartile (6–13) | −2.46 | −6.91, 1.99 | −2.70 | −7.11, 1.71 |
| 4° quartile (>13) | −1.56 | −6.20, 3.09 | −1.27 | −5.86, 3.32 |
| Supermarkets and hypermarkets (n) | ||||
| 1° tercile (0) | Reference | Reference | ||
| 2° tercile (1) | −2.09 | −5.84, 1.66 | −2.16 | −5.88, 1.56 |
| 3° tercile (>1) | −1.27 | −5.08, 2.54 | −1.22 | −5.03, 2.59 |
| Small markets (n) | ||||
| 1° quartile (0–1) | Reference | Reference | ||
| 2° quartile (2–3) | −1.10 | −5.53, 3.32 | −0.86 | −5.24, 3.51 |
| 3° quartile (4–5) | −0.51 | −4.90, 3.89 | −0.51 | −4.87, 3.86 |
| 4° quartile (>5) | 1.46 | −2.93, 5.84 | 0.88 | −3.48, 5.23 |
| Bakeries and coffee shops (n) | ||||
| 1° quartile (0) | Reference | Reference | ||
| 2° quartile (1) | −1.45 | −5.77, 2.88 | −1.78 | −6.09, 2.52 |
| 3° quartile (2) | 4.82 | 0.52, 9.12 | 4.84 | 0.55, 9.12 |
| 4° quartile (>2) | −1.84 | −6.17, 2.49 | −1.54 | −5.83, 2.75 |
| Restaurants | ||||
| 1° quartile (0–2) | Reference | Reference | ||
| 2° quartile (3–6) | 2.30 | −1.96, 6.56 | 2.30 | −1.91, 6.52 |
| 3° quartile (7–11) | −1.30 | −5.87, 3.27 | −1.63 | −6.16, 2.91 |
| 4° quartile (>11) | −0.05 | −4.61, 4.52 | 0.09 | −4.43, 4.61 |
| Retail of processed and ultra-processed foods | ||||
| 1° quartile (0–1) | Reference | Reference | ||
| 2° quartile (1–2) | −2.51 | −6.74, 1.72 | −2.38 | −6.61, 1.86 |
| 3° quartile (3–4) | −4.77 | −9.73, 0.19 | −4.58 | −9.53, 0.37 |
| 4° quartile (>4) | −3.84 | −8.56, 0.88 | −3.74 | −8.44, 0.96 |
| Retail of unprocessed and minimally processed foods | ||||
| 1° quartile (0) | Reference | Reference | ||
| 2° quartile (1) | −1.55 | −5.95, 2.85 | −1.75 | −6.11, 2.62 |
| 3° quartile (2–3) | −2.83 | −7.05, 1.38 | −3.05 | −7.23, 1.13 |
| 4° quartile (>3) | −2.55 | −6.92, 1.82 | −2.51 | −6.83, 1.81 |
| Street markets | ||||
| No | Reference | Reference | ||
| Yes | −2.83 | −6.68, 1.01 | −2.83 | −6.63, 0.98 |
| Energy Contribution from Processed Foods a | ||||
|---|---|---|---|---|
| Model 1 b | Model 2 c | |||
| Beta | 95% CI | Beta | 95% CI | |
| Snack bars (n) | ||||
| 1° quartile (0–1) | Reference | Reference | ||
| 2° quartile (3–5) | 2.26 | −1.66, 6.17 | 2.41 | −1.54, 6.36 |
| 3° quartile (6–13) | 4.46 | 0.65, 8.27 | 4.48 | 0.65, 8.32 |
| 4° quartile (>13) | 4.53 | 0.54, 8.51 | 4.43 | 0.44, 8.42 |
| Supermarkets and hypermarkets (n) | ||||
| 1° tercile (0) | Reference | Reference | ||
| 2° tercile (1) | 3.34 | 0.12, 6.56 | 3.26 | 0.02, 6.51 |
| 3° tercile (>1) | 0.78 | −2.50, 4.06 | 0.58 | −2.75, 3.90 |
| Small markets (n) | ||||
| 1° quartile (0–1) | Reference | Reference | ||
| 2° quartile (2–3) | 2.12 | −1.70, 5.94 | 2.00 | −1.82, 5.82 |
| 3° quartile (4–5) | 2.73 | −1.06, 6.53 | 2.60 | −1.21, 6.41 |
| 4° quartile (>5) | 2.06 | −1.73, 5.84 | 2.39 | −1.42, 6.19 |
| Bakeries and coffee shops (n) | ||||
| 1° quartile (0) | Reference | Reference | ||
| 2° quartile (1) | 1.34 | −2.40, 5.07 | 1.33 | −2.43, 5.10 |
| 3° quartile (2) | −1.26 | −4.97, 2.45 | −1.39 | −5.14, 2.36 |
| 4° quartile (>2) | 5.00 | 1.25, 8.74 | 4.88 | 1.13, 8.64 |
| Restaurants (n) | ||||
| 1° quartile (0–2) | Reference | Reference | ||
| 2° quartile (3–6) | −0.68 | −4.35, 2.98 | −0.59 | −4.27, 3.09 |
| 3° quartile (7–11) | 2.50 | −1.44, 6.43 | 2.62 | −1.34, 6.58 |
| 4° quartile (>11) | 3.02 | −0.91, 6.95 | 3.04 | −0.90, 6.99 |
| Retail of processed and ultra-processed foods (n) | ||||
| 1° quartile (0–1) | Reference | Reference | ||
| 2° quartile (1–2) | 2.45 | −1.17, 6.08 | 2.24 | −1.43, 5.90 |
| 3° quartile (3–4) | 6.54 | 2.30, 10.79 | 6.34 | 2.04, 10.63 |
| 4° quartile (>4) | 4.63 | 0.59, 8.67 | 4.62 | 0.54, 8.70 |
| Retail of unprocessed and minimally processed foods (n) | ||||
| 1° quartile (0) | Reference | Reference | ||
| 2° quartile (1) | 4.51 | 0.73, 8.29 | 4.74 | 0.95, 8.54 |
| 3° quartile (2–3) | 1.62 | −2.00, 5.24 | 1.63 | −2.01, 5.26 |
| 4° quartile (>3) | −0.51 | −1.56, 0.55 | −0.54 | −1.61, 0.52 |
| Street markets | ||||
| No | Reference | Reference | ||
| Yes | 2.66 | −0.66, 5.98 | 2.79 | −0.54, 6.12 |
| Energy Contribution from the Consumption of Ultra-Processed Products a | ||||
|---|---|---|---|---|
| Model 1 b | Model 2 c | |||
| Beta | 95% CI | Beta | 95% CI | |
| Snack bars (n) | ||||
| 1° quartile (0–2) | Reference | Reference | ||
| 2° quartile (3–5) | −1.00 | −4.24, 2.23 | −0.81 | −4.06, 2.44 |
| 3° quartile (6–13) | −2.84 | −5.99, 0.31 | −2.63 | −5.78, 0.52 |
| 4° quartile (>13) | −2.36 | −5.65, 0.93 | −2.52 | −5.80, 0.76 |
| Supermarkets and hypermarkets (n) | ||||
| 1° tercile (0) | Reference | Reference | ||
| 2° tercile (1) | −1.36 | −4.02, 1.31 | −1.18 | −3.84, 1.49 |
| 3° tercile (>1) | 0.43 | −2.28, 3.13 | 0.56 | −2.17, 3.29 |
| Small markets (n) | ||||
| 1° quartile (0–1) | Reference | Reference | ||
| 2° quartile (2–3) | −0.62 | −3.74, 2.51 | −0.72 | −3.83, 2.40 |
| 3° quartile (4–5) | −2.64 | −5.74, 0.46 | −2.53 | −5.64, 0.57 |
| 4° quartile (>5) | −3.55 | −6.65, −0.45 | −3.29 | −6.39, −0.19 |
| Bakeries and coffee shops (n) | ||||
| 1° quartile (0) | Reference | Reference | ||
| 2° quartile (1) | −0.30 | −3.40, 2.80 | 0.09 | −3.02, 3.19 |
| 3° quartile (2) | −3.10 | −6.18, −0.02 | −3.00 | −6.08, 0.10 |
| 4° quartile (>2) | −2.56 | −5.67, 0.54 | −2.73 | −5.83, 0.36 |
| Restaurants (n) | ||||
| 1° quartile (0–2) | Reference | Reference | ||
| 2° quartile (3–6) | −2.01 | −5.03, 1.01 | −2.11 | −5.13, 0.91 |
| 3° quartile (7–11) | −1.49 | −4.74, 1.76 | −1.32 | −4.57, 1.93 |
| 4° quartile (>11) | −2.70 | −5.94, 0.55 | −2.85 | −6.09, 0.38 |
| Retail of processed and ultra-processed foods (n) | ||||
| 1° quartile (0–1) | Reference | Reference | ||
| 2° quartile (1–2) | −0.40 | −3.42, 2.62 | −0.33 | −3.37, 2.71 |
| 3° quartile (3–4) | −1.75 | −5.29, 1.79 | −1.67 | −5.23, 1.90 |
| 4° quartile (>4) | −0.57 | −3.94, 2.80 | −0.66 | −4.04, 2.73 |
| Retail of unprocessed and minimally processed foods | ||||
| 1° quartile (0) | Reference | Reference | ||
| 2° quartile (1) | −2.91 | −6.02, 0.21 | −2.93 | −6.04, 0.19 |
| 3° quartile (2–3) | −0.01 | −3.00, 2.97 | 0.15 | −2.84, 3.14 |
| 4° quartile (>3) | −0.53 | −3.63, 2.57 | −0.45 | −3.54, 2.63 |
| Street markets | ||||
| No | Reference | Reference | ||
| Yes | −0.11 | −2.84, 2.63 | −0.23 | −2.96, 2.51 |
Disclaimer/Publisher’s Note: The statements, opinions and data contained in all publications are solely those of the individual author(s) and contributor(s) and not of MDPI and/or the editor(s). MDPI and/or the editor(s) disclaim responsibility for any injury to people or property resulting from any ideas, methods, instructions or products referred to in the content. |
© 2023 by the authors. Licensee MDPI, Basel, Switzerland. This article is an open access article distributed under the terms and conditions of the Creative Commons Attribution (CC BY) license (https://creativecommons.org/licenses/by/4.0/).
Share and Cite
Barbosa, B.B.; Nielsen, L.; de Aguiar, B.S.; Failla, M.A.; Araújo, L.F.; Mendes, L.L.; Machado, S.P.; Carioca, A.A.F. Local Food Environment and Consumption of Ultra-Processed Foods: Cross-Sectional Data from the Nutritionists’ Health Study—NutriHS. Int. J. Environ. Res. Public Health 2023, 20, 6749. https://doi.org/10.3390/ijerph20186749
Barbosa BB, Nielsen L, de Aguiar BS, Failla MA, Araújo LF, Mendes LL, Machado SP, Carioca AAF. Local Food Environment and Consumption of Ultra-Processed Foods: Cross-Sectional Data from the Nutritionists’ Health Study—NutriHS. International Journal of Environmental Research and Public Health. 2023; 20(18):6749. https://doi.org/10.3390/ijerph20186749
Chicago/Turabian StyleBarbosa, Brena Barreto, Lucca Nielsen, Breno Souza de Aguiar, Marcelo Antunes Failla, Larissa Fortunato Araújo, Larissa Loures Mendes, Soraia Pinheiro Machado, and Antonio Augusto Ferreira Carioca. 2023. "Local Food Environment and Consumption of Ultra-Processed Foods: Cross-Sectional Data from the Nutritionists’ Health Study—NutriHS" International Journal of Environmental Research and Public Health 20, no. 18: 6749. https://doi.org/10.3390/ijerph20186749