Article

Study on Evolution of the Thermophysical and Mechanical Properties of Inner Shaft Lining Concrete during Construction Period

1
State Key Laboratory for Geomechanics and Deep Underground Engineering, China University of Mining and Technology, Xuzhou 221116, China
2
China Design Group, Nanjing 210014, China
3
School of Transportation and Civil Engineering, Nantong University, Nantong 226019, China
*
Author to whom correspondence should be addressed.
Appl. Sci. 2022, 12(19), 10141; https://doi.org/10.3390/app121910141
Submission received: 24 August 2022 / Revised: 28 September 2022 / Accepted: 6 October 2022 / Published: 9 October 2022
(This article belongs to the Section Civil Engineering)

Abstract

:
The asymmetric temperature field is one of the main factors inducing the cracking of the inner shaft lining during freezing-shaft sinking. The evolution equation for the thermophysical and mechanical properties of shaft lining concrete during construction period is the basis for revealing the cracking mechanism. In this study, several experiments were conducted to reveal the evolution of the temperature field, thermal conductivity, specific heat capacity, compressive strength, tensile strength, and elastic modulus of shaft lining concrete with age and lining thickness within the first 7 d after pouring. Results show that the shaft lining concrete temperature curve after pouring can be divided into five stages: induction, slow heating, rapid heating, rapid cooling, and slow cooling. Thermal conductivity and specific heat capacity reached the maximum on Day 1 and gradually decreased with an increase in age. The compressive strength, tensile strength and elastic modulus significantly increased with age. With an increase in thickness, the shaft lining concrete at the same age improved its three mechanical parameters. Finally, the evolution equation for these thermophysical and mechanical parameters with age within the first 7 d after pouring was fitted based on experimental data. This study is expected to provide a thermophysical and mechanical basis for studying the cracking mechanism of the inner shaft lining.

1. Introduction

Freezing-shaft sinking is one of the most effective shaft sinking techniques in soft water-rich soil layers and water-rich fractured rock layers [1,2]. Compared with water separation techniques, such as grouting [3], it has higher applicability and reliability [4]. However, with the continuous development of shaft construction toward deep and large-diameter shafts [5], numerous circumferential and vertical cracks impede the application of freezing shaft sinking in deep wells [6,7]. According to the theoretical analysis results and engineering practice experiences, these cracks are mainly caused by an asymmetric temperature field on the inner edge of the inner shaft lining before thawing [8,9]. Therefore, the evolution of the thermophysical and mechanical properties of shaft lining concrete during construction needs to be studied to optimize the shaft lining design scheme and explore the solution to cracking in inner shaft lining concrete.
Since the 21st century, China’s shallow minerals have gradually dried up, and the exploitation of coal and other mine resources has gradually reached the deep strata [10]. According to the national coal resources prediction report, about 5.57 trillion tons of coal are buried 2000 m underground [11]. Among the proven coal resources, the rock stratum has a buried depth greater than 1000 m, comprising more than 53% [12]. In deep mining, the project generally encounters a deep pore–fissure water-rich rock stratum or deep topsoil, as well as a complex stratum with both conditions [13,14]. This kind of complex stratum has a soft soil layer, low rock strength, and a rich aquifer [15,16]. Adopting an ordinary approach to well construction often leads to economic and safety problems, such as the failure of precipitation and water plugging, construction delays, and even water flooding [17,18]. Engineering practices show that freezing is the most commonly used and reliable construction technique applied to such complex strata, and its proportion exceeds 90% [19,20]. In the past 20 years, more than 600 shafts in China were built under complex geological conditions by using the freezing–shaft sinking construction technique [21].
However, after the thawing of the frozen wall during shaft sinking, severe water leakage of the inner shaft lining generally occurs in the frozen shaft with a depth > 400 m and a diameter > 8 m. In the actual project, the water leakage of the Longgu Coal Mine auxiliary shaft (d = 7 m; HS = 214.6 m; HD = 950 m) and the Gaojiapu coal mine main shaft (d = 7.5 m, HS = 26.5 m, HD = 791 m) during shaft sinking reaches 34 m3/h and 74.3 m3/h, respectively, which far surpasses the allowable value of the standard design [11]. The serious water leakage in the inner shaft lining not only significantly increases the cost of grouting treatment, considerably extends the construction period of the mine, and causes serious economic losses [22], but it is also a major safety threat to the mine construction, which may lead to major accidents, such as well collapse, mine flooding, water gushing, and mud inrush. Theoretical analysis eliminates the possibility that the shaft lining would crack due to self-weight and water pressure between the inner and outer walls, which act on the shaft lining. Internal tensile stress and concrete self-shrinkage are considered the primary causes of inner shaft lining cracking [23]. These stress and shrinkage are attributed to the uneven distribution of the temperature field of the large and thick shaft lining during shaft sinking. However, the cracking mechanism has yet to be clarified. During shaft construction, shaft lining cracking mainly occurs at the inner edge during well construction [24,25]. The thermophysical and mechanical properties of the shaft lining concrete substantially change with age during this period [26,27]. In addition, mastering the evolution law for the mechanical and thermophysical properties of shaft lining concrete over time is greatly significant to explore the cracking mechanism of shaft lining concrete during well construction.
Currently, the comprehensive evolution of thermophysical and mechanical properties of shaft lining concrete with age is rarely reported. Moreover, they are always assigned fixed values during the construction period in the current theoretical analysis and numerical analysis, which can inevitably cause large errors [28,29]. Kahouadji and Dong conducted several experiments to investigate the factors affecting the mechanical properties of early-age concrete [30,31]. The compressive strength of early-age concrete was found to be related to the mix proportion and significantly affected by the curing temperature. A proper increase in curing temperature can accelerate the internal hydration reaction of concrete and improve its early-age strength. Keum studied the influence of curing time and curing age on the mechanical properties of early-age concrete and determined the variation law of compressive strength and splitting strength of early-age concrete [32]. Zhicheng Deng studied the influence of sand content and coal ash content on the thermal conductivity of ceramsite concrete; the thermal conductivity of concrete increased first and then decreased with an increase in sand content and gradually decreased with an increase in coal ash content [33]. Weiping Zhang performed an experimental study on the effects of saturation and water cement ratio on the thermal conductivity of concrete; the thermal conductivity of concrete increased with an increase in saturation and decreased with an increase in water–cement ratio [34]. Feng Zhang used the theoretical calculation method to analyze the specific heat capacity of concrete; high-strength concrete was found to have a lower specific heat capacity, compared with ordinary concrete [35]. Moreover, the effect of mix proportion on the heat capacity was less than that of water content. The evolution of the thermal and mechanical properties of early-age concrete is widely studied [36,37]; regardless, the comprehensive evolution of these properties with age under different shaft wall thicknesses is rarely reported. Therefore, relevant research needs to be conducted to explore the evolution law for the thermophysical and mechanical properties of early-age concrete after pouring.
In this study, several experiments were conducted to investigate the evolution of the thermophysical and mechanical properties of shaft lining concrete within the first 7 d after pouring. These properties include the temperature field, thermal conductivity, specific heat capacity, compressive strength, tensile strength, and elastic modulus. The evolution law for each parameter with age is discussed in detail. The evolution function is ultimately simulated to provide basic data support for further theoretical research and numerical simulation of shaft lining cracking. This study is anticipated to provide basic data support for exploring the mechanism of shaft lining cracking during the construction period and is crucial to reducing the risk of shaft lining disasters.

2. Materials and Method

2.1. Engineering Background

In freezing-shaft sinking, the double-layer composite shaft lining is one of the most commonly used shaft lining structures. The main functions of each part are shown in Figure 1. The inner shaft lining is mainly used to block water and resist the in situ stress transmitted by the outer shaft lining. However, with an increase in sinking depth, lining thickness significantly increases, and the cracking of the inner shaft lining intensifies, which considerably reduces the water resistance of the shaft and presents potential safety hazards. Engineering practice indicates that cracks in the inner lining generally develop before the thawing of the frozen wall; this occurrence is mainly attributed to a large amount of heat released from thick lining concrete and an uneven temperature between the inner and outer linings. However, the cracking mechanism remains unclear. Therefore, it is crucial to investigate the evolution law for the thermophysical and mechanical properties of shaft lining concrete during the construction period to explore the cracking mechanism of the inner shaft wall.

2.2. Experimental Method and Process

2.2.1. Simulation Model of Newly Poured Shaft Lining

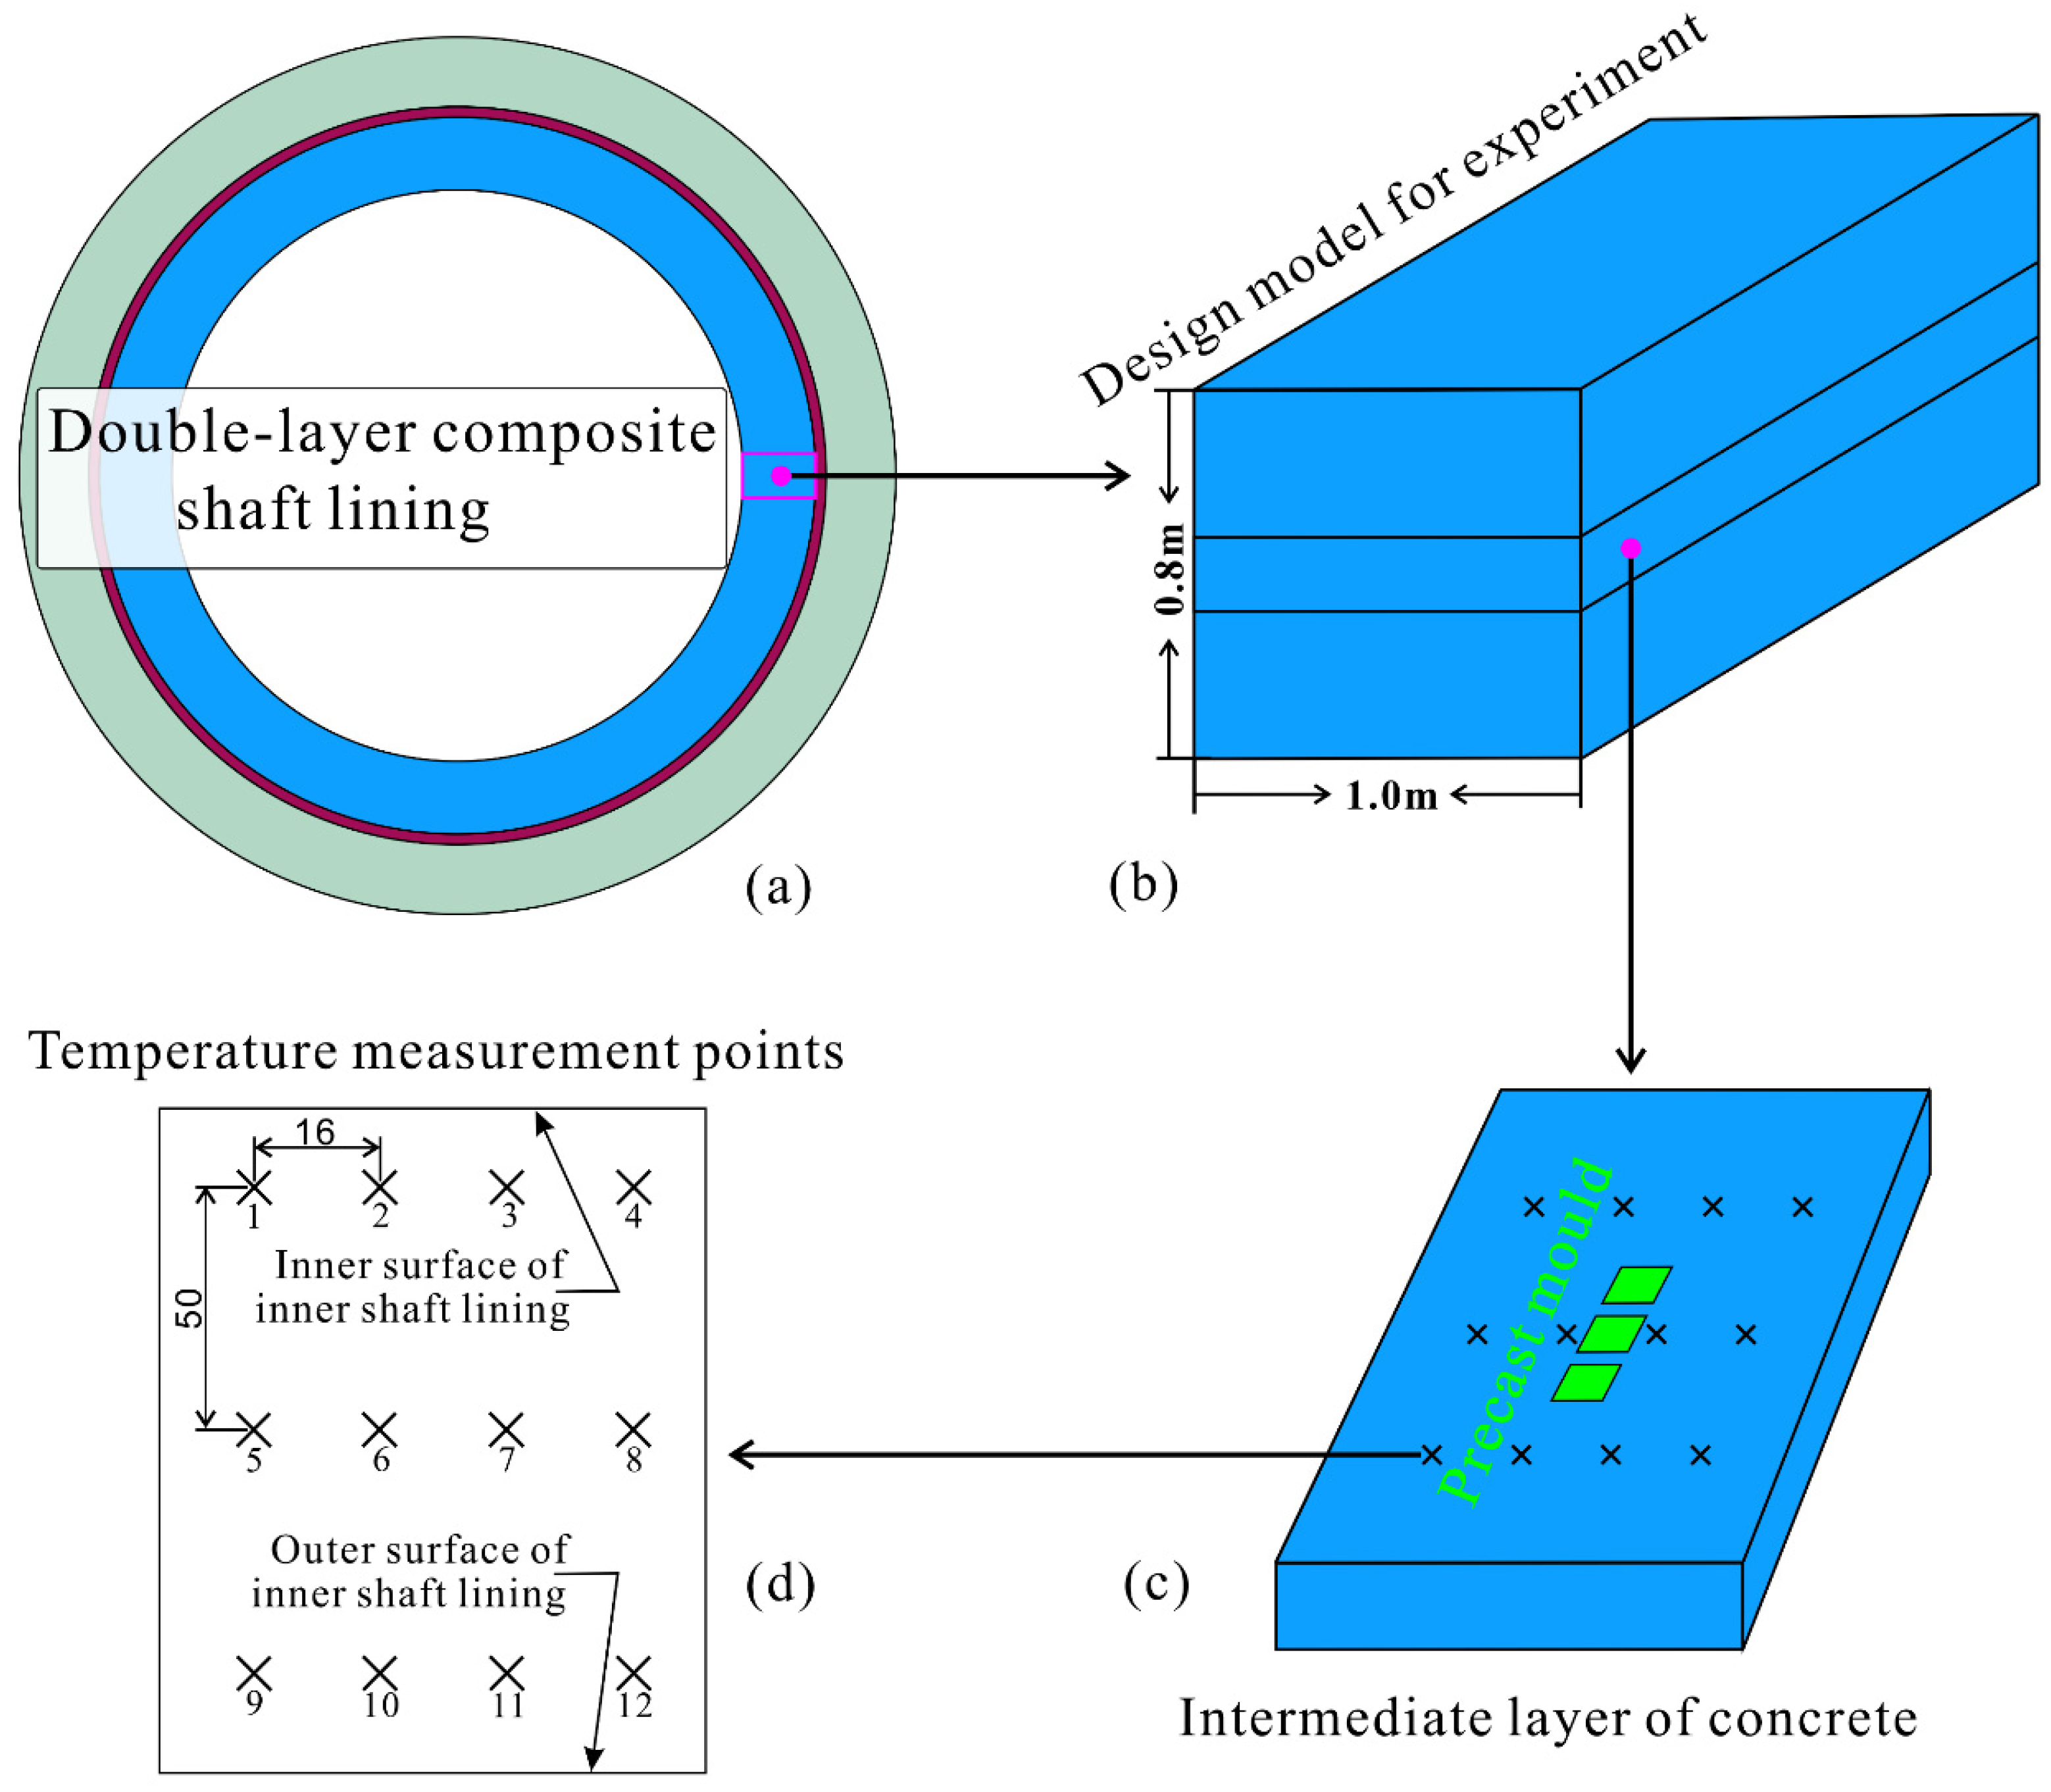
The shaft lining was simplified as a cuboid for an experiment (Figure 2) to accurately simulate the evolution law for the temperature field, thermophysical properties, and mechanical properties with age after pouring shaft lining concrete. The experiment model was 0.8 m high and 1.0 m wide, and the length direction of the model represented the radial direction of the actual shaft lining. In this study, three thicknesses of the inner shaft lining were simulated: 1, 1.2, and 1.5 m. In the middle of the model, a concrete layer with a thickness of 15 cm was separated by a polyethylene film, and three prefabricated molds were placed in the middle to facilitate the removal of internal concrete at a specific age for thermophysical and mechanical property testing (Figure 2c). Simultaneously, 24 temperature measurement points were arranged on the upper and lower surfaces of the middle concrete layer to determine the temperature at different sites in the shaft lining (Figure 2d). Based on the center of the surface, the temperature measurement points were arranged according to the dimensions in Figure 2d. Summarily, the temperature field was determined through the temperature measurement points on the upper and lower surfaces of the intermediate concrete layer, and the thermophysical and mechanical properties were measured using test blocks taken from the mold at a specific age.
The concrete used in the experiment was high-strength concrete, which was selected based on the actual project, and the strength exceeded that of C60. In the preparation of the concrete, the cement selected was P.O.52.5 ordinary Portland-cement (Xuzhou, China). The coarse aggregate was basalt (Shandong, China) with a particle size of 10–20 mm. The fine aggregate was quartz sand produced in Xuzhou, China, which contained three particle sizes—10–20, 20–40, and 40–80 mesh, with a mass ratio of 3:3:4. The PCA-1 amino acid salt superplasticizer used in the experiment was supplied by SOBUTE. According to the Concrete Mixing Water Standard (JGJ63-89), the water used in the concrete is the tap-water from Xuzhou, China. The comprehensive mix of concrete is listed in Table 1.

2.2.2. Experimental Parameters and Measurement Methods

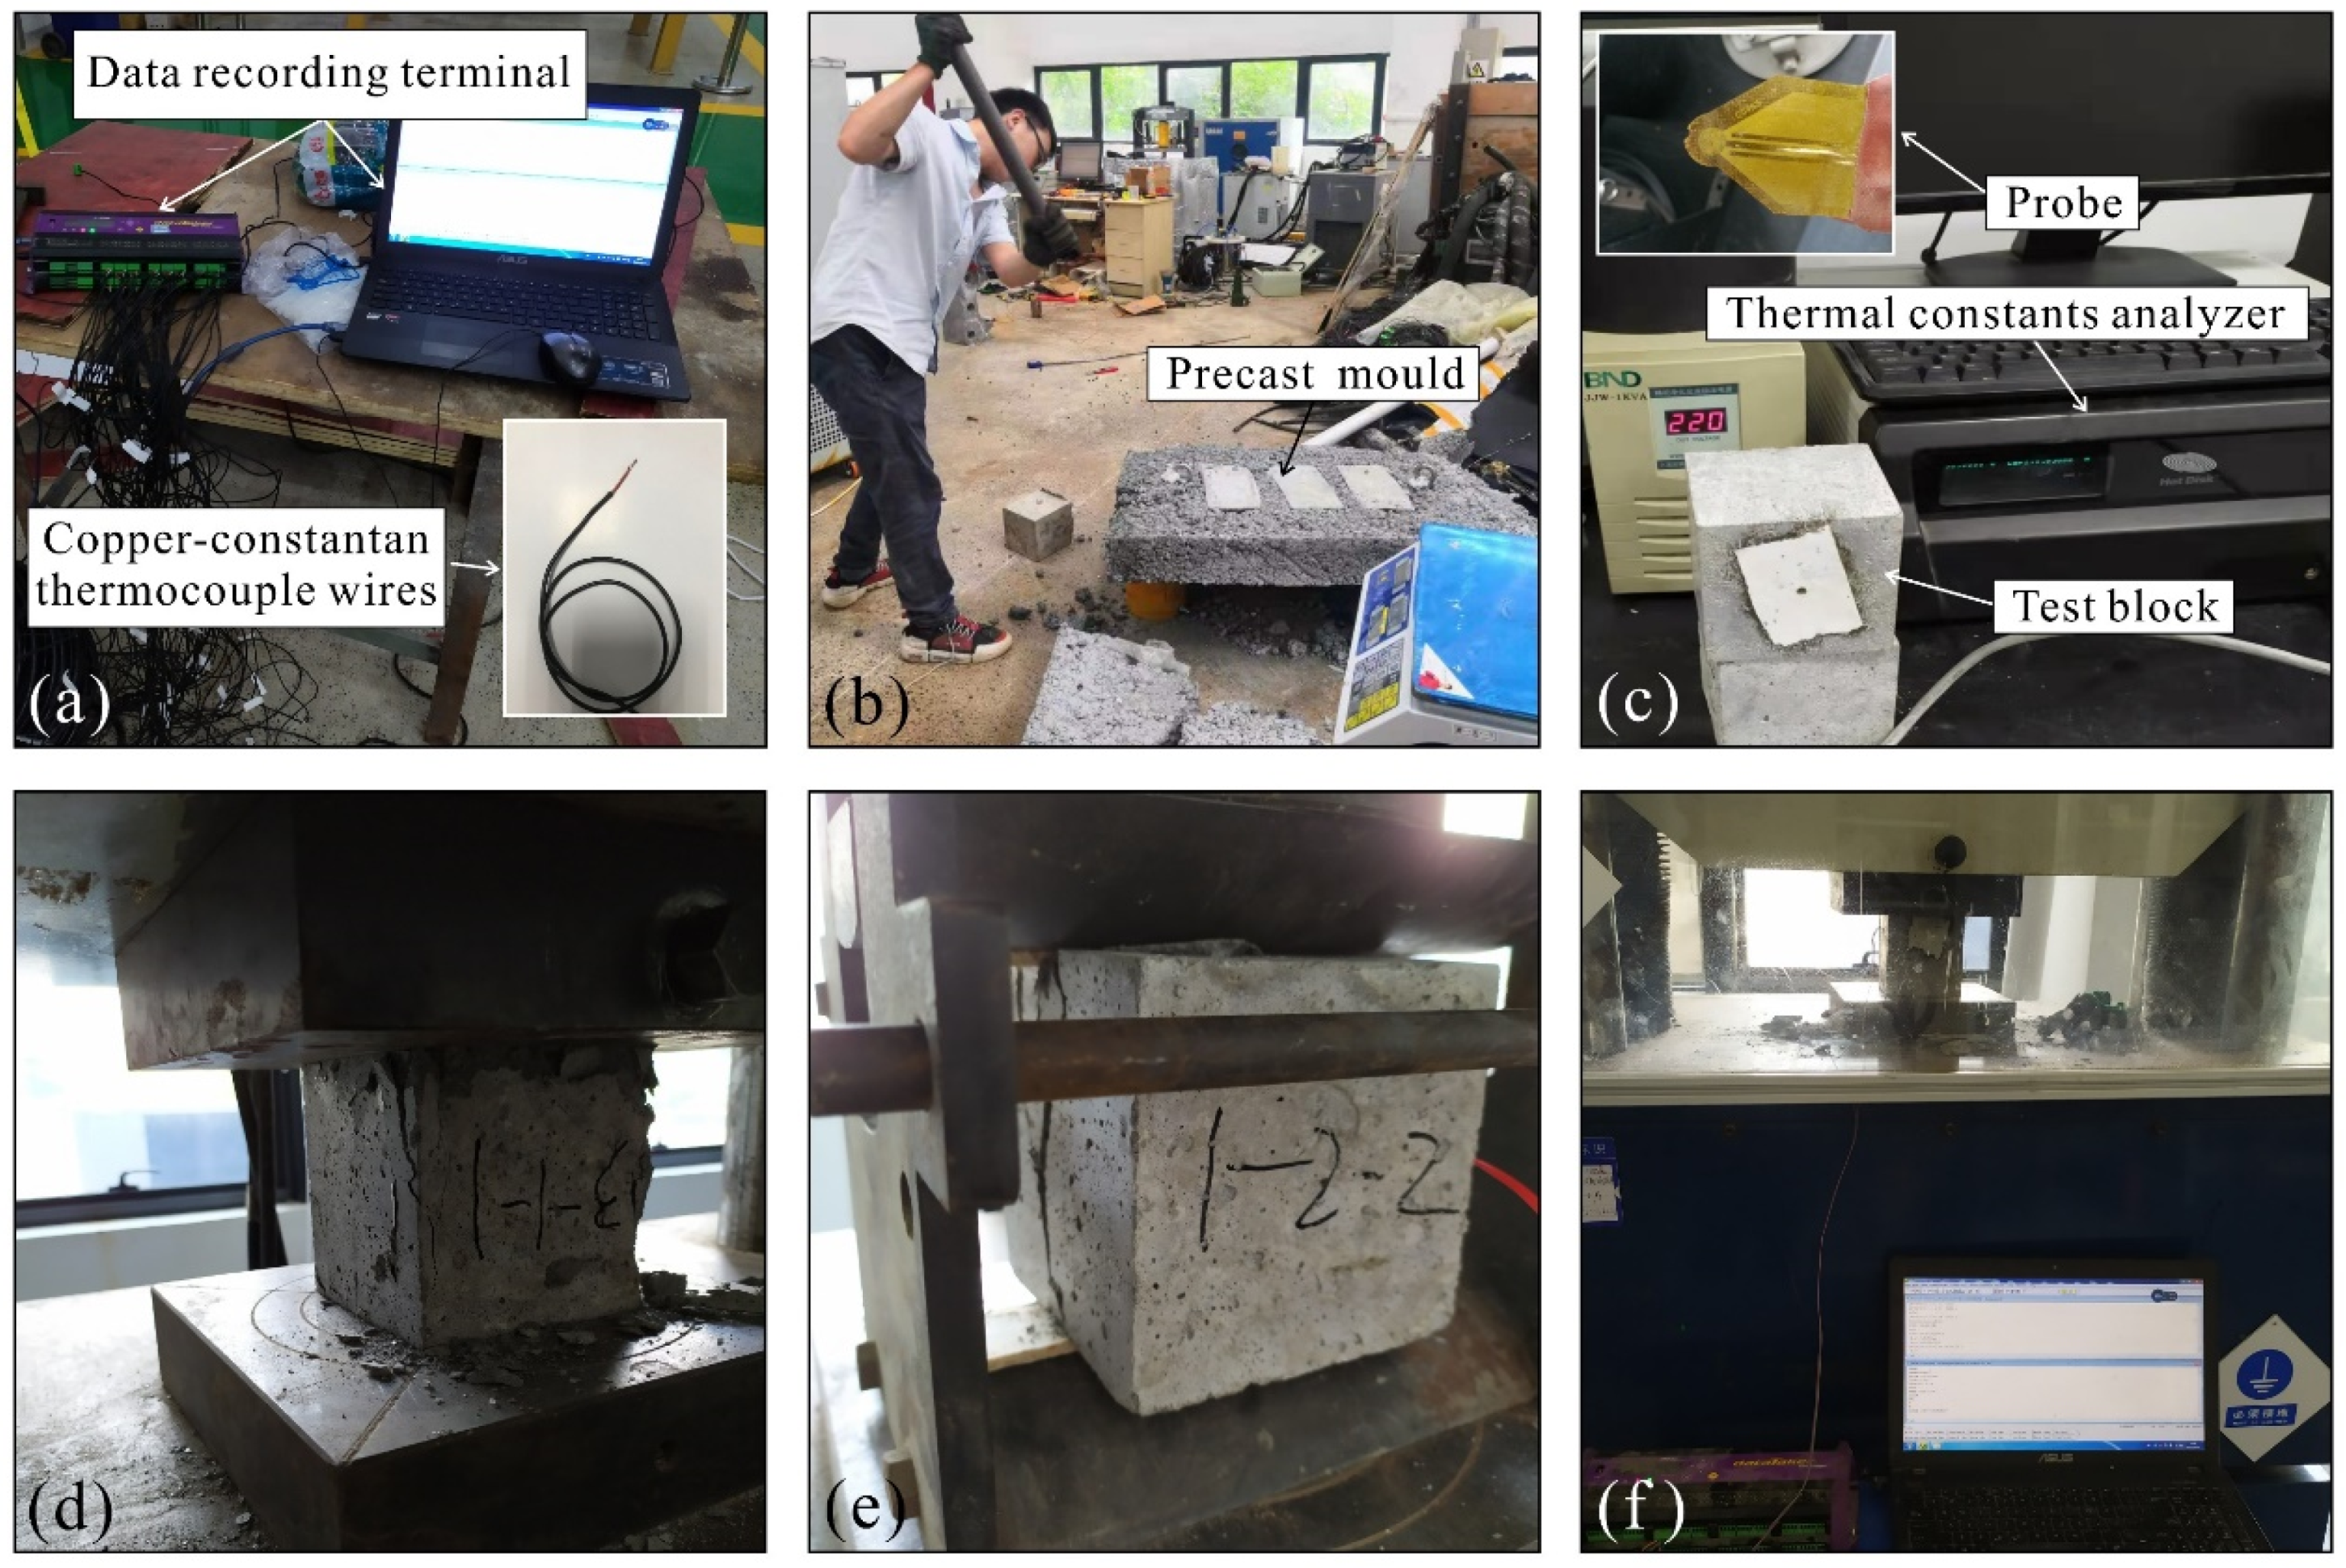
The evolution law for the temperature field, thermophysical properties, and mechanical properties with age after pouring of inner shaft lining concrete was the research object of this experiment. In the experiment, the temperature field of the shaft lining concrete in various positions was measured with copper-constantan thermocouple wires and the temperature data recording terminal (Figure 3a). In order to investigate the evolution law for the thermophysical and mechanical properties of the inner shaft lining concrete with age, the test block mold was placed inside the shaft lining before the pouring process and then taken out when it reached a specific age for parameter measurement (Figure 3b). In the thermophysical and mechanical experiment, the test process and data processing follow the Standard for Test Methods of Concrete Physical and Mechanical Properties (GB/T50081-2019). Except for the elastic modulus, which is tested with 6 test blocks (100 mm × 100 mm × 300 mm), other parameters are tested with three test blocks (100 mm × 100 mm × 100 mm) and take the average value to characterize the thermophysical and mechanical properties of shaft lining at the predetermined age.
The thermal conductivity and specific heat capacity of the shaft lining were measured using the thermal constant analyzer Hot Disk 500-V6 by adopting the transient plane heat source method. The measurement of the compressive strength f c s , tensile strength f t s , and elastic modulus E c of the test block was completed with the 200 t servo press of China University of Mining and Technology (Figure 3d,f). During the tests of compressive strength and tensile strength, the loading rate of the test block (100 mm × 100 mm × 100 mm) is kept at 0.5 mm/min, and the ultimate load F is obtained according to the loading curve. According to the Standard for Test Methods of Concrete Physical and Mechanical Properties (GB/T50081-2019), the compressive strength and tensile strength were calculated based on the ultimate load F in accordance with Equations (1) and (2), respectively. The elastic modulus E c was determined by unconfined compression testing, and six test blocks (100 mm × 100 mm × 300 mm) are used for this test, three of which are used to determine the axial compressive strength, and the other three are used to determine the compressive modulus of elasticity. The strain of the test block is measured by pasting the resistance strain gauge with a gauge length of 150 mm on the side of the test block (Figure 3f). According to the above test standard (GB/T50081-2019), the elastic modulus is calculated by using the ratio of the stress value in the elastic change stage to the strain value at the corresponding time point, as shown as Equations (1)–(3).
f c s = 0.95 F a 2
f t s = 0.85 2 F π a 2
E c = F E a 2 / ε E
where F is the ultimate load when the test block fails (N), a is the side length of the compression surface of the test block (mm), F E is the load when the stress is one-third of the ultimate axial compressive strength of the test block, ε E is the compression strain value of the test block at the time point corresponding to F E .

3. Results and Discussion

3.1. Evolution of Temperature Field

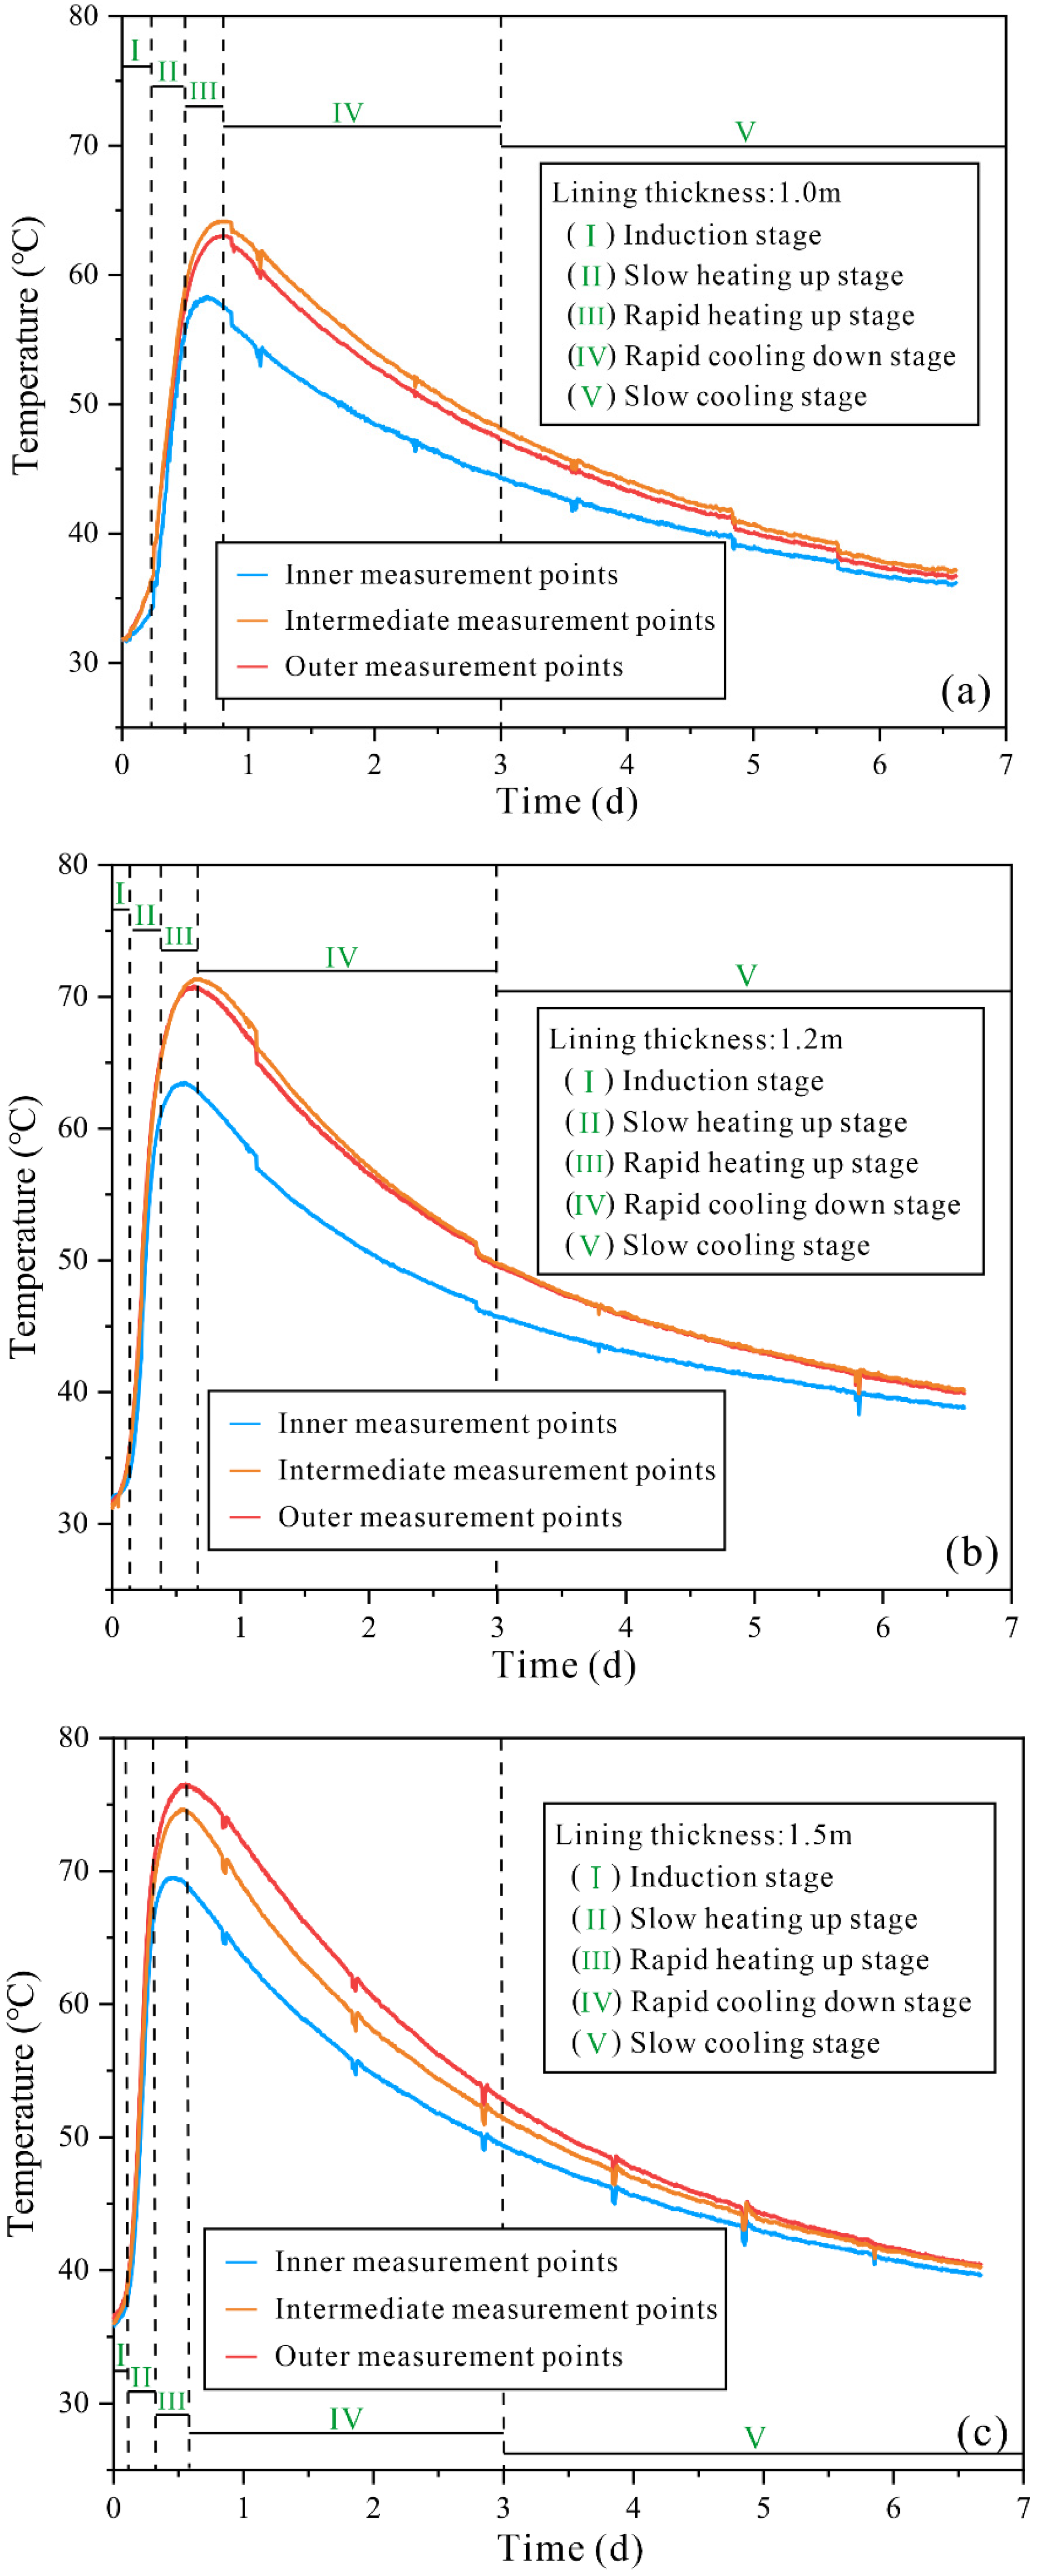
The evolution of the temperature field in the inner shaft lining with age is depicted in Figure 4. The temperature evolution trend of the shaft lining with different locations and thicknesses is highly consistent. Based on the temperature change rate, the shaft lining concrete temperature curve within the first 7 d after pouring can be divided into five stages: induction, slow heating, rapid heating, rapid cooling, and slow cooling. The location with the lowest temperature in the shaft lining is always the position radially close to the center of the shaft lining. Depending on the temperature boundary of the shaft lining in the actual project, the five surfaces of the concrete test block were treated with heat insulation, whereas the inner surface at the center of the shaft was directly exposed to air without any treatment. Therefore, the concrete at the location radially close to the center of the shaft wall loses more heat during convective heat transfer between the air and the lining.
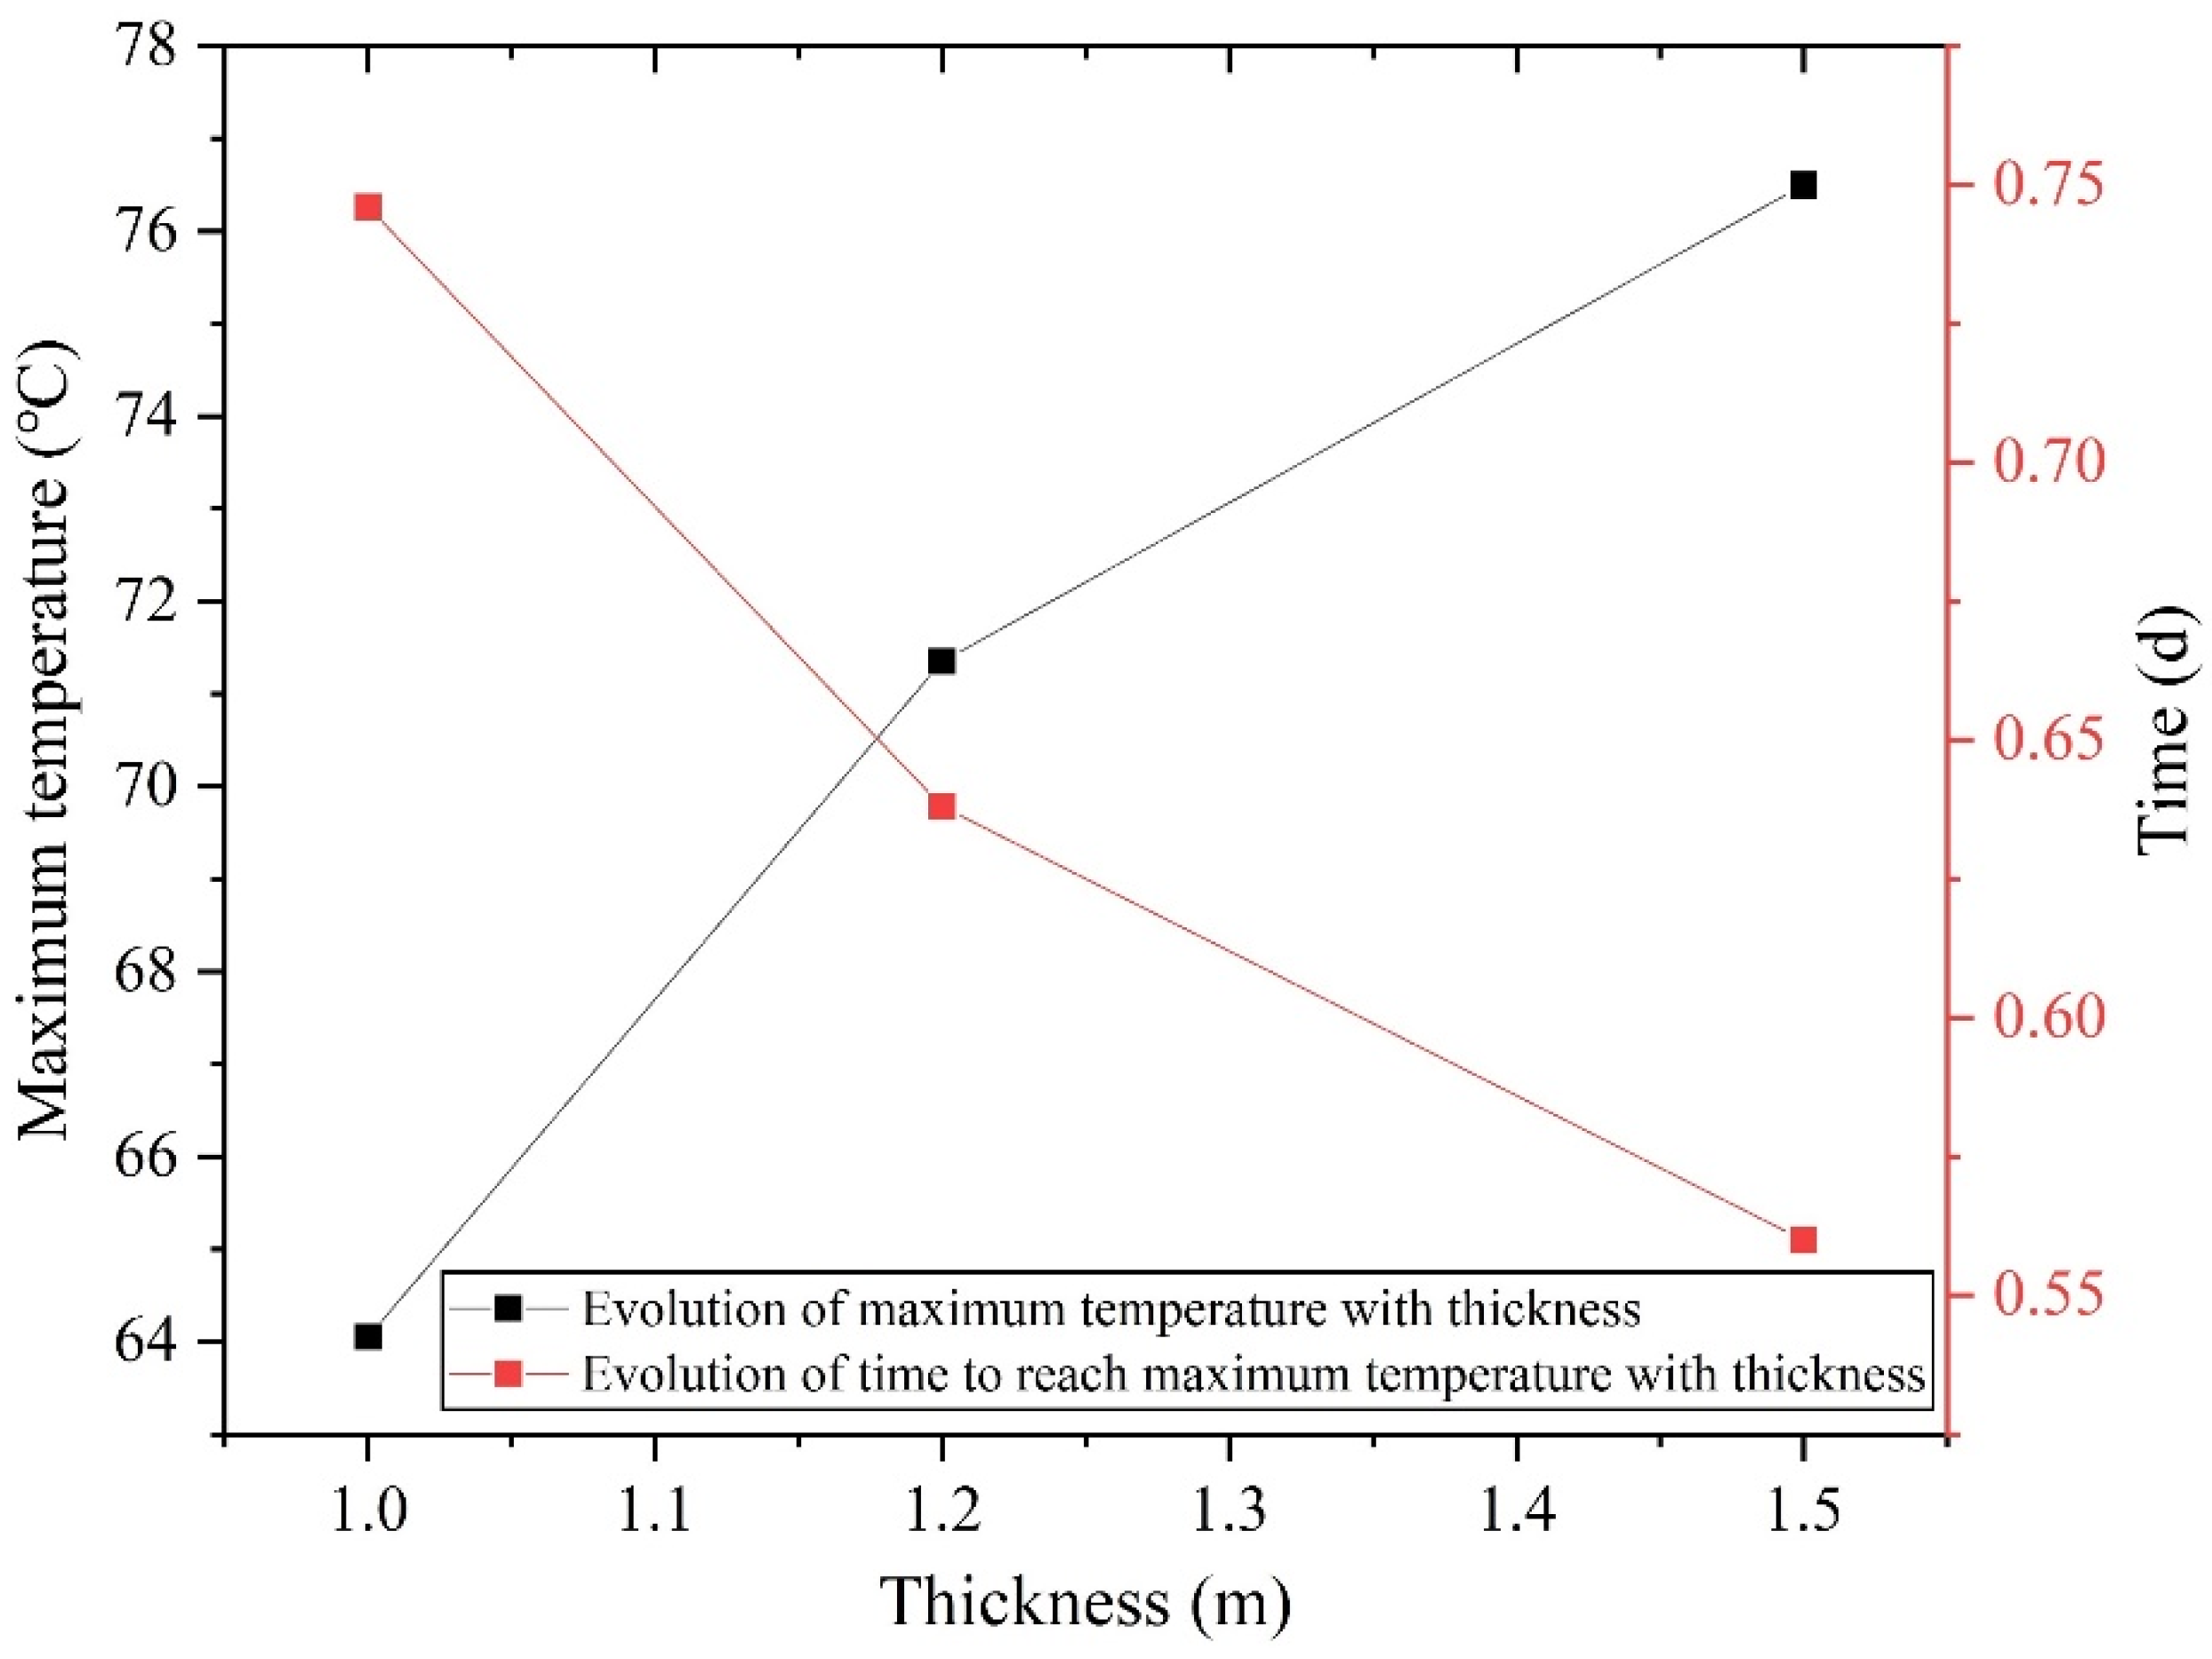
The maximum temperature in the shaft lining with different thicknesses is shown in Figure 5. As shown in the figure, the maximum temperature gradually increases with an increase in the shaft lining thickness, and the maximum temperature in shaft lining concrete can reach 76.5 °C when the thickness is 1.5 m. The time to reach the maximum temperature in the shaft lining decreases with an increase in the lining thickness. The inner surface temperature of the shaft lining is usually close to the ventilation temperature in the shaft; thus, the difference in maximum temperature between the interior and the inner surface of the newly poured shaft lining concrete gradually increases with the shaft lining thickness. Therefore, the temperature stress caused by a large difference in temperature increases the cracking risk of the shaft lining during the initial pouring period, and the probability of cracking increases with the shaft lining thickness. When the shaft lining thicknesses were 1.0 and 1.2 m, the maximum temperature was observed at the intermediate temperature measurement point (Figure 4a,b). As the thickness increased to 1.5 m, the maximum temperature was observed at the outer temperature measurement point (Figure 4c), indicating that the location of the maximum temperature in the inner shaft lining gradually moved radially outside with an increase in the lining thickness.

3.2. Evolution of Thermophysical Properties

The evolution of the thermophysical parameters of the inner shaft lining concrete with age, including the thermal conductivity and specific heat capacity, is examined based on the test block taken from the prefabricated mold on Day 1, Day 3, and Day 7 after pouring (Figure 3b). The evolution equations for these two thermophysical parameters with age are fitted by least squares and can be used as the numerical and theoretical bases for the cracking mechanism in further research.

3.2.1. Thermal Conductivity

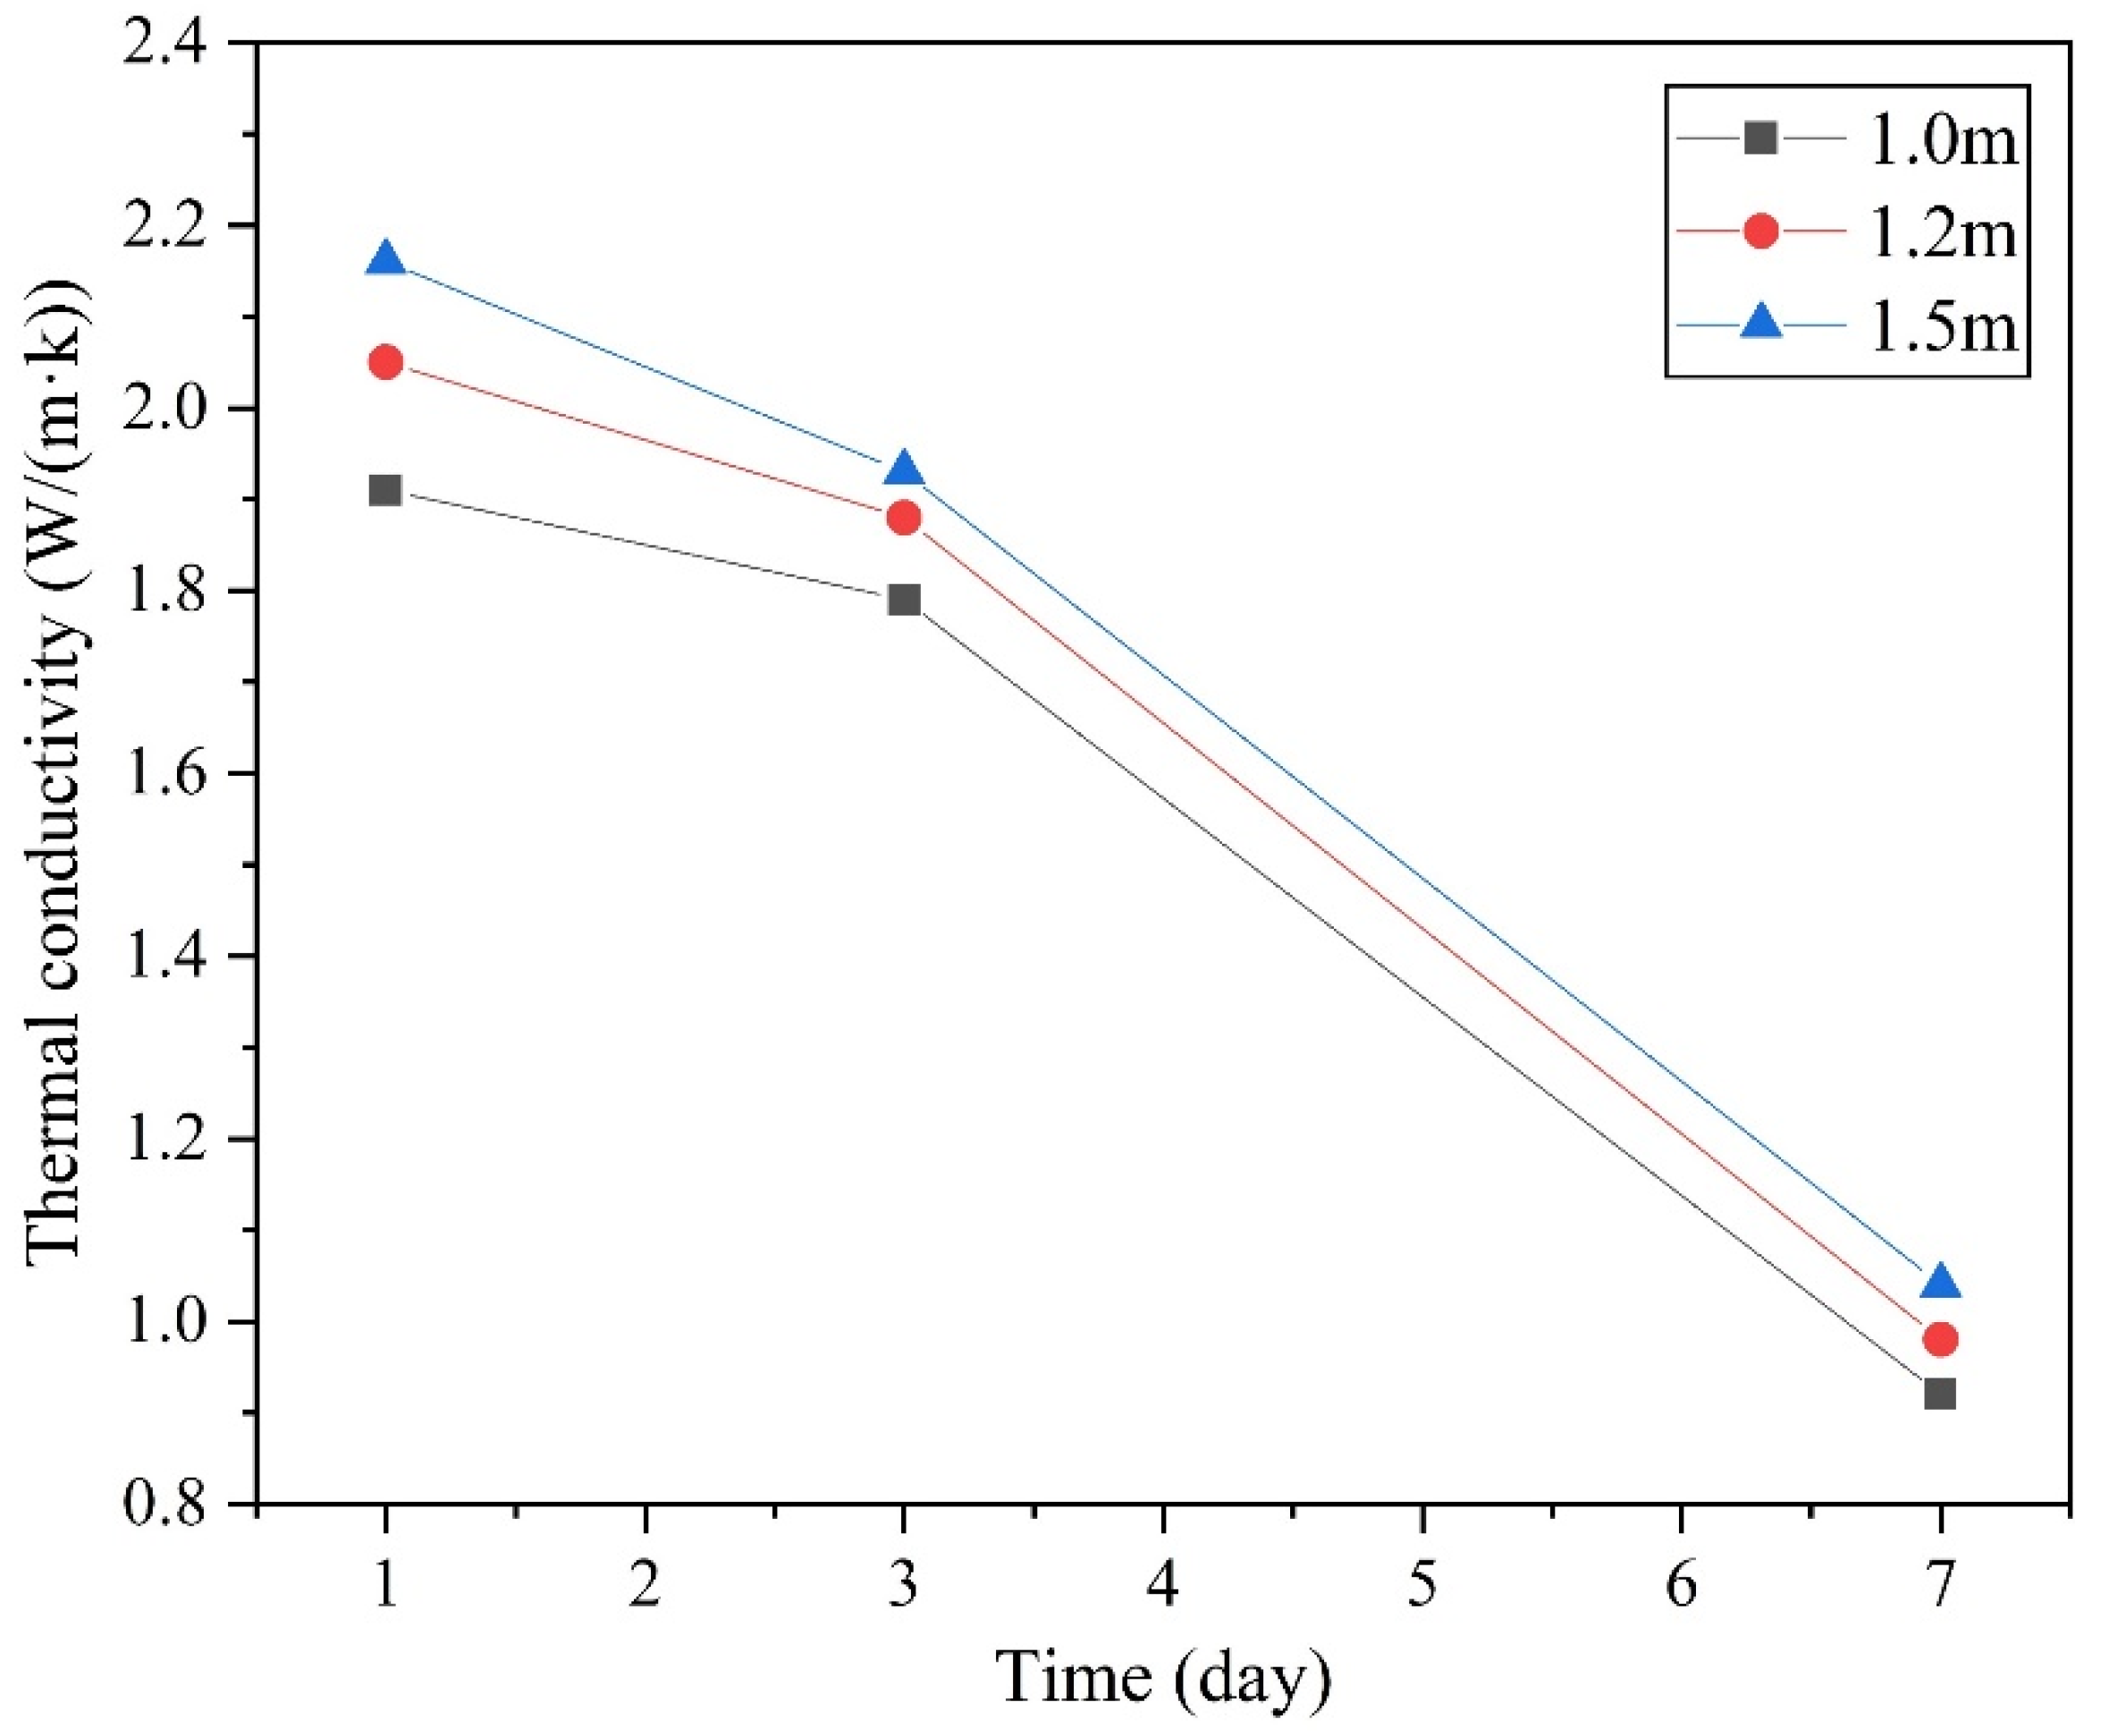
The evolution of the thermal conductivity of the inner shaft lining concrete on Day 1, Day 3, and Day 7 after pouring is depicted in Figure 6. The thermal conductivity of the shaft lining concrete decreased significantly with an increase in age. The reason is that the concrete gradually loses water and forms micro pores inside with the increase of age. The shaft lining thickness also significantly affected the thermal conductivity of the inner shaft lining concrete. The measurement results indicate that the thermal conductivity of the shaft lining at a specific age increased with its thickness. This occurrence was most likely caused by the variations in the internal moisture content of the inner shaft linings with different thicknesses, where the greater the thickness is, the more difficult it is to discharge the internal water. The thermal conductivity of the inner shaft lining concrete with three different thicknesses evolved between 0.92 and 2.16 W/(m·k) within the first 7 d after pouring. Finally, the evolution equation for thermal conductivity with age within the first 7 d after pouring is fitted based on experimental data, as shown in Table 2.

3.2.2. Specific Heat Capacity

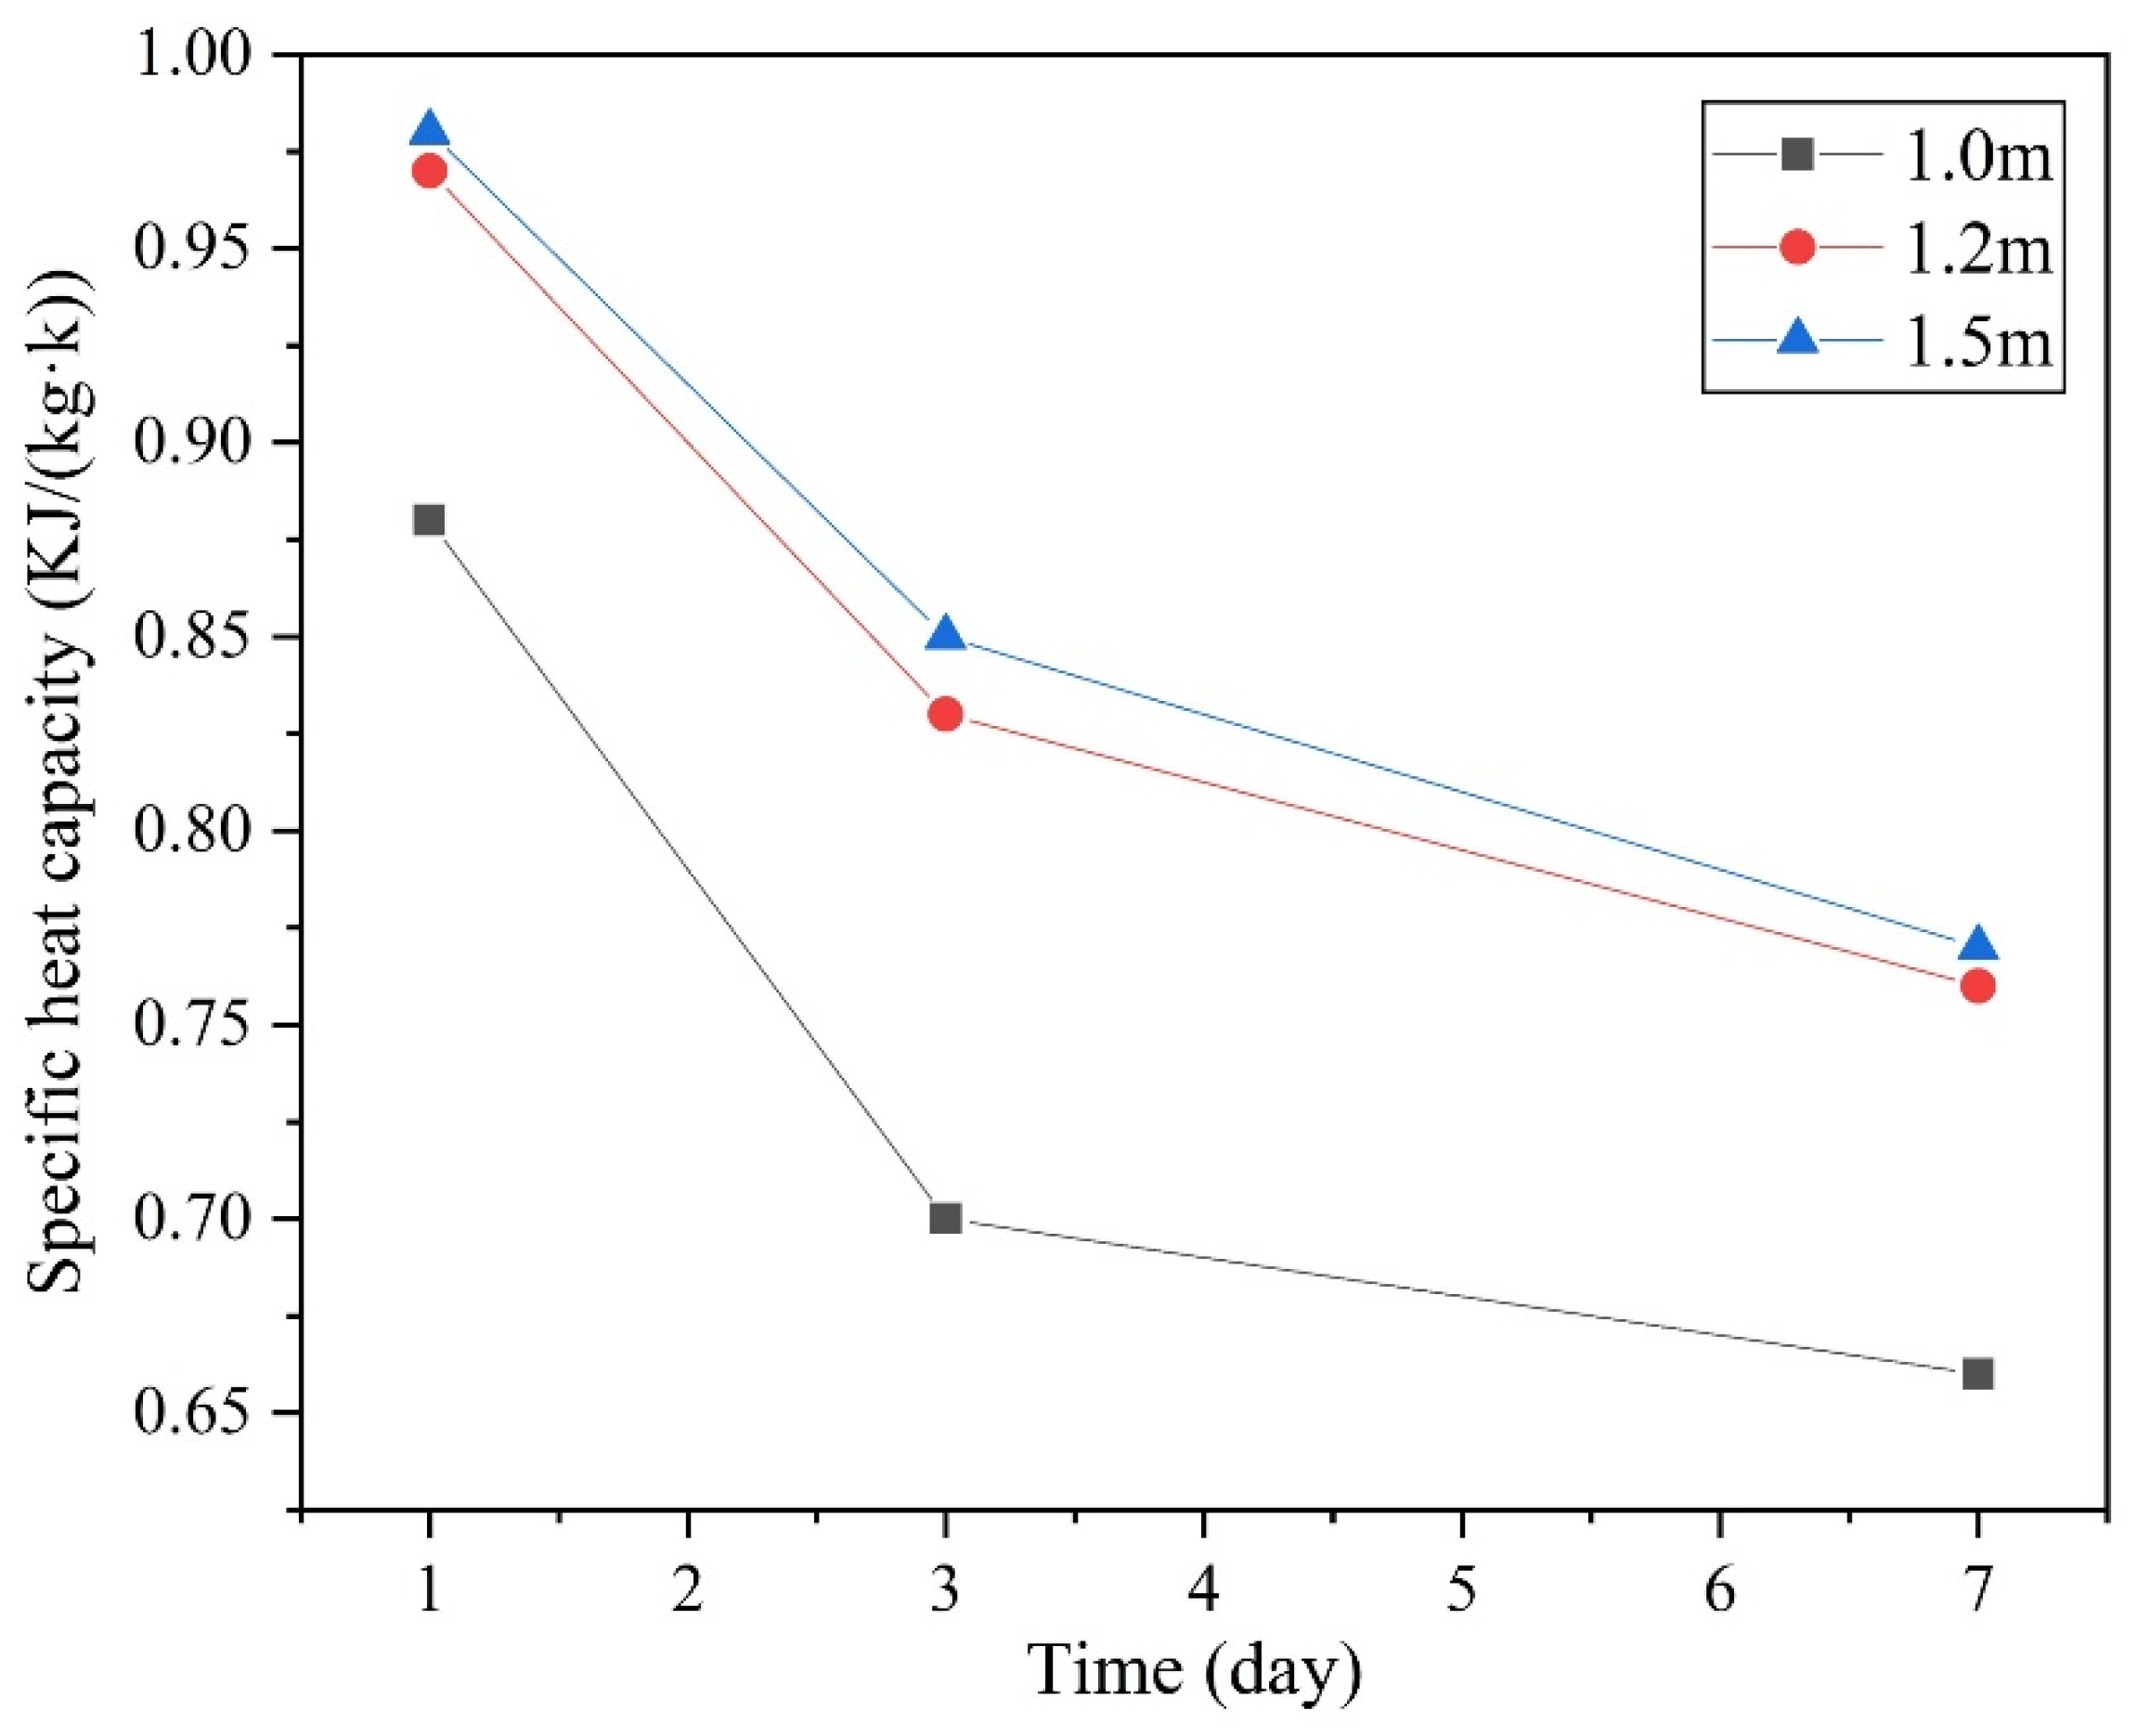
The evolution of the specific heat capacity of the inner shaft lining concrete on Day 1, Day 3, and Day 7 after pouring is depicted in Figure 7. The specific heat capacity of the shaft lining concrete decreased significantly with an increase in age, and the decline rate gradually decreased with an increase in age. The shaft wall thickness poorly affects the decline rate of specific heat capacity with age, as reflected by the parallel evolution curve of specific heat capacity at each given thickness (Figure 7). The shaft lining thickness largely influences the evolution of the specific heat capacity of the inner shaft lining concrete. The specific heat capacity increased with increasing thickness at the same age, whereas the increase rate gradually decreased. This is mainly because with the increase of age, the hydration reaction of shaft lining leads to the increase of strength, while the moisture content of free water gradually decreases, which leads to the decrease of specific heat capacity. And the thin thickness of the shaft lining results in slow internal hydration reaction rate, which leads to slower concrete strength growth and greater porosity of the thinner shaft lining at the same age. Therefore, the specific heat capacity decreased with increasing age and increased with increasing thickness. When the thickness increased from 1.0 m to 1.2 m, the specific heat capacity increased by more than 10.2%; meanwhile, when the thickness increased from 1.2 m to 1.5 m, the specific heat capacity increased by only about 1.3%. The specific heat capacity of the inner shaft lining concrete with thicknesses of 1.0, 1.2, and 1.5 m evolved between 0.66 and 0.98 KJ/(kg·k) within the first 7 d after pouring. Finally, the evolution equation for specific heat capacity with age within the first 7 d after pouring is fitted based on experimental data (Table 3).

3.3. Evolution of Mechanical Properties

The evolution of the mechanical parameters of the inner shaft lining concrete with age, including the compressive strength, tensile strength, and elastic modulus, were measured based on the test block taken from the prefabricated mold on Day 1, Day 3, and Day 7 after pouring (Figure 3b). The equations for the evolution of these three parameters with age were fitted, which could then be used as the numerical and theoretical bases for the cracking mechanism in the further study.

3.3.1. Compressive Strength

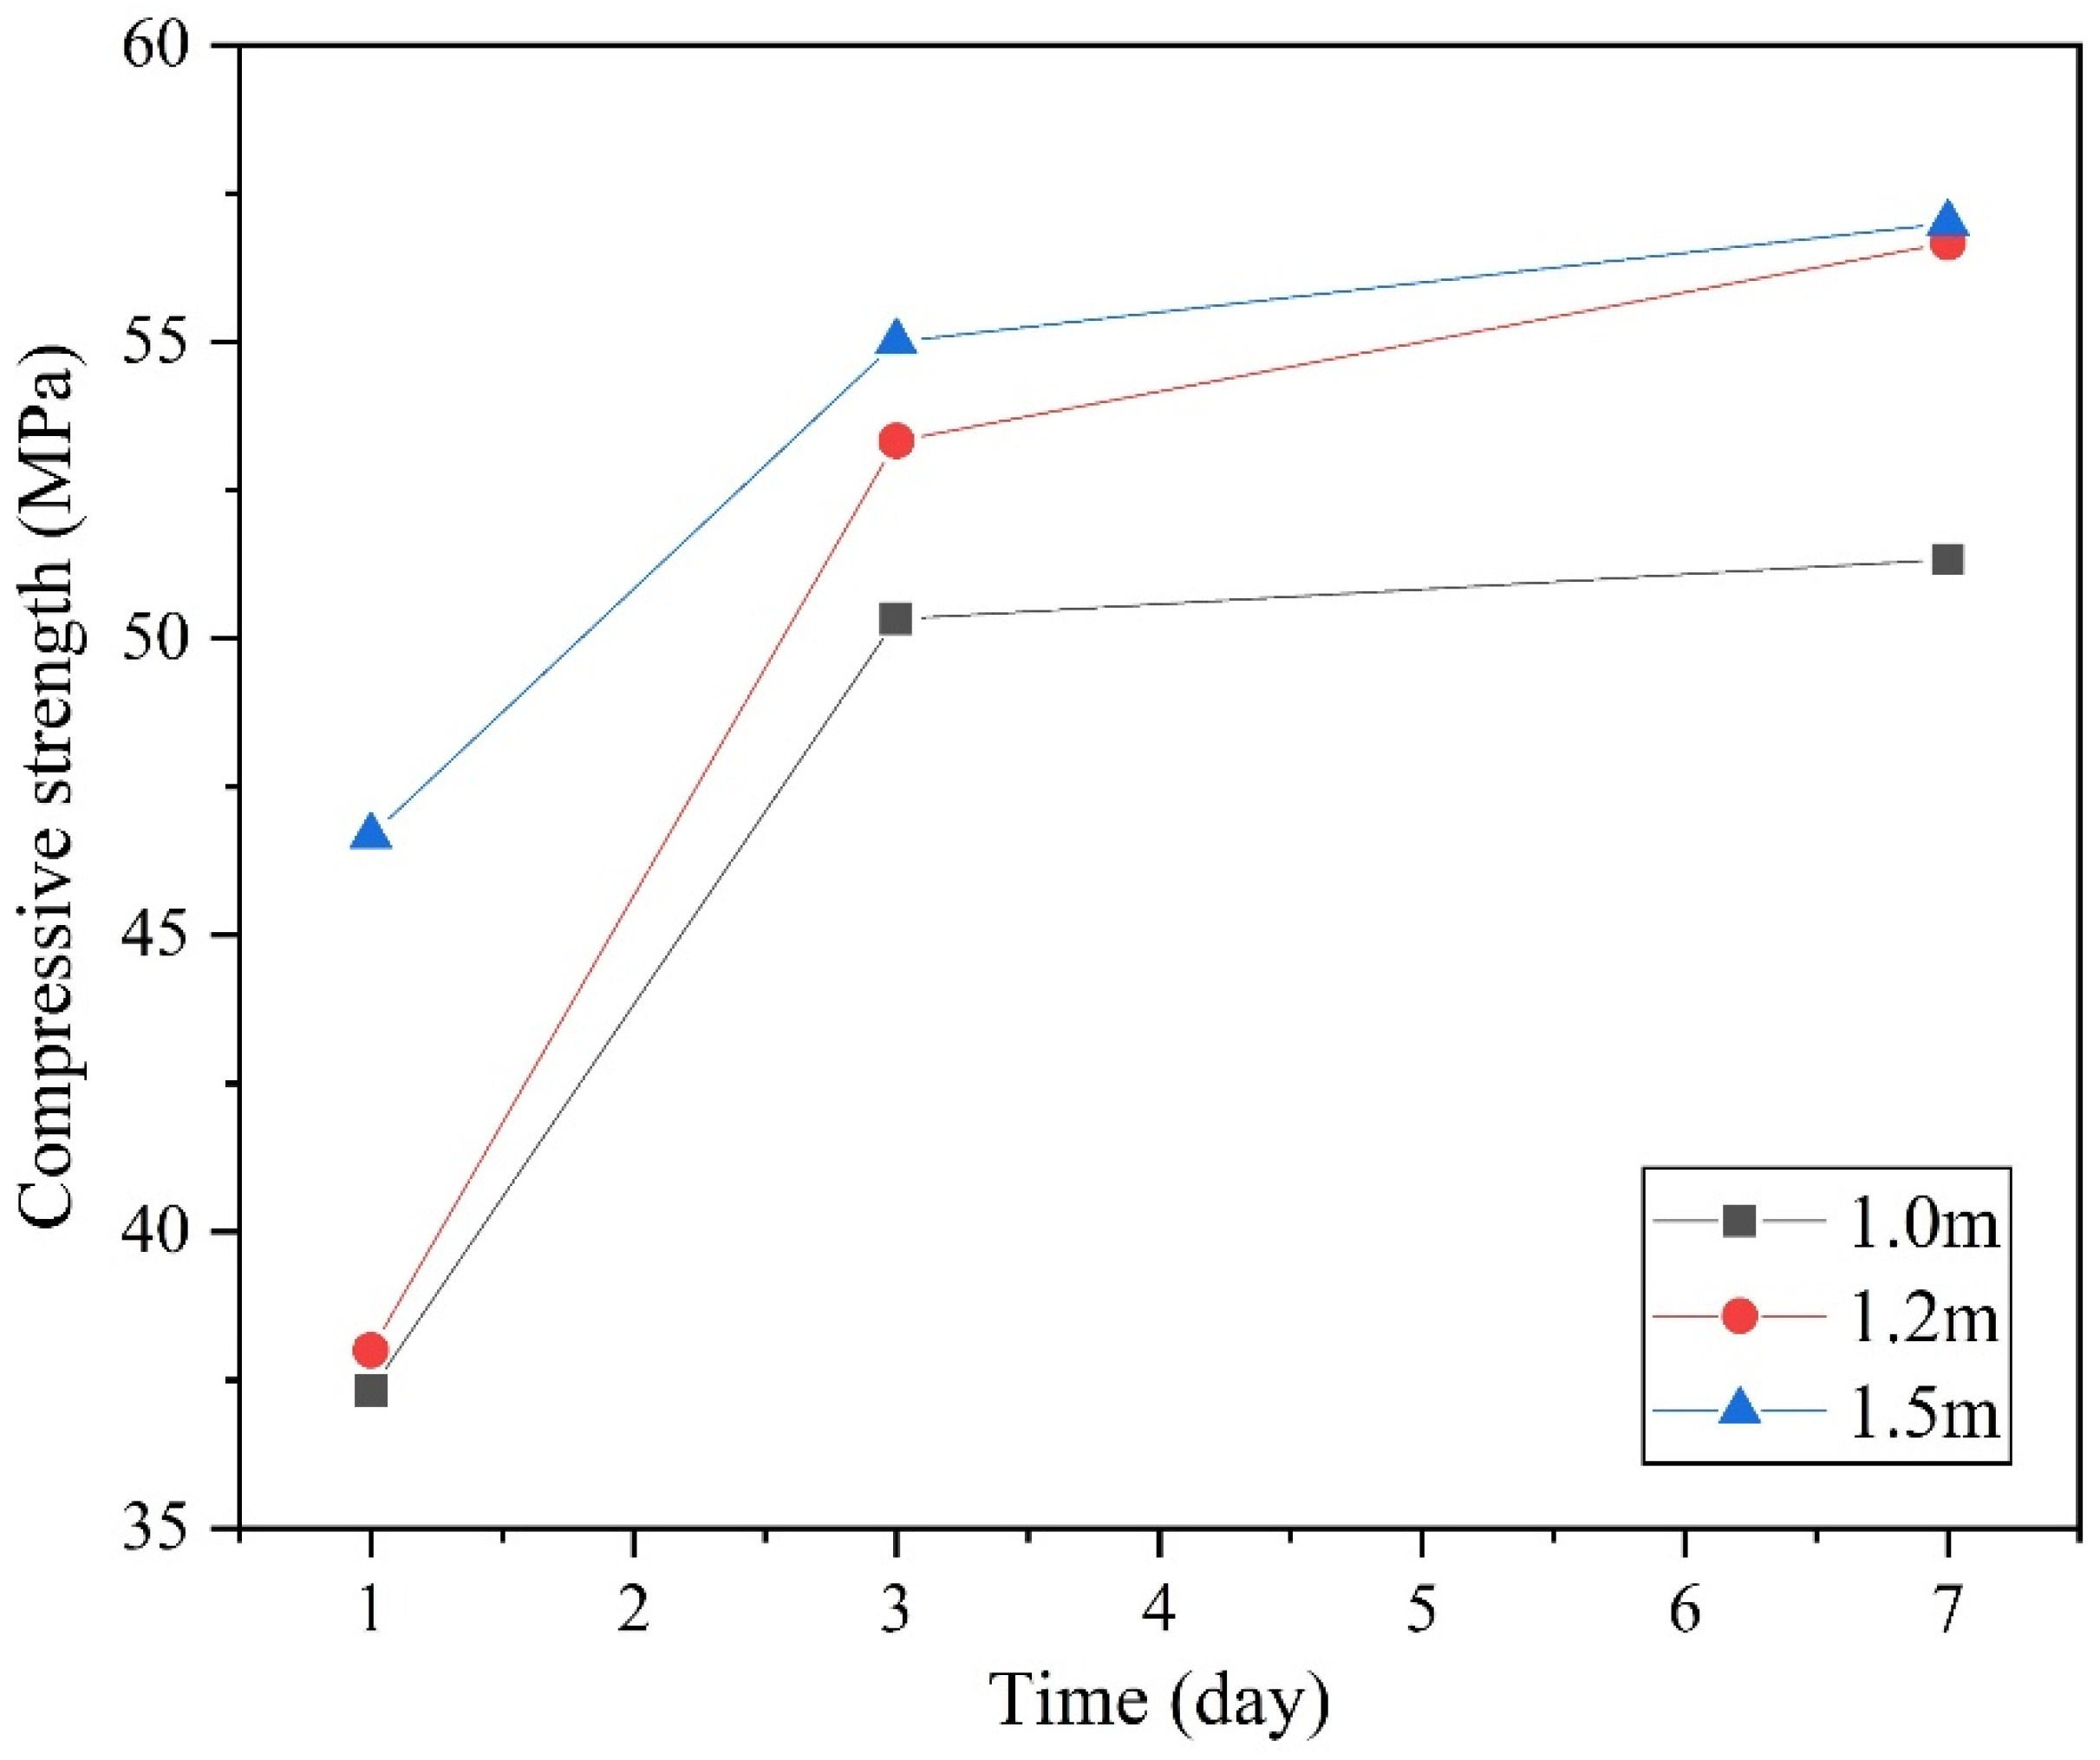
The evolution of the compressive strength of the inner shaft lining concrete on Day 1, Day 3, and Day 7 after pouring is depicted in Figure 8. As shown in the graph, the compressive strength of the shaft lining concrete increased significantly with an increase in age within the first 7 d after pouring, and the increase rate gradually decreased with an increase in age. At the same age, the compressive strength of the inner shaft lining increased with thickness, whereas the increase rate has no apparent association with the thickness. This is because the thick lining ensures higher internal moisture content and higher temperature at the same curing time, and the good curing environment increases the growth rate of concrete strength. When the thickness increased from 1.0 m to 1.2 m, the compressive strength increased by more than 1.8%; meanwhile, when the thickness increased from 1.2 m to 1.5 m, the compressive strength increased by more than 0.5%. The compressive strength of the shaft lining concrete with three thicknesses ranged between 37.33 and 57.01 MPa. Finally, the evolution equation of compressive strength with age within the first 7 days after pouring was fitted based on the experimental data (Table 4).

3.3.2. Tensile Strength

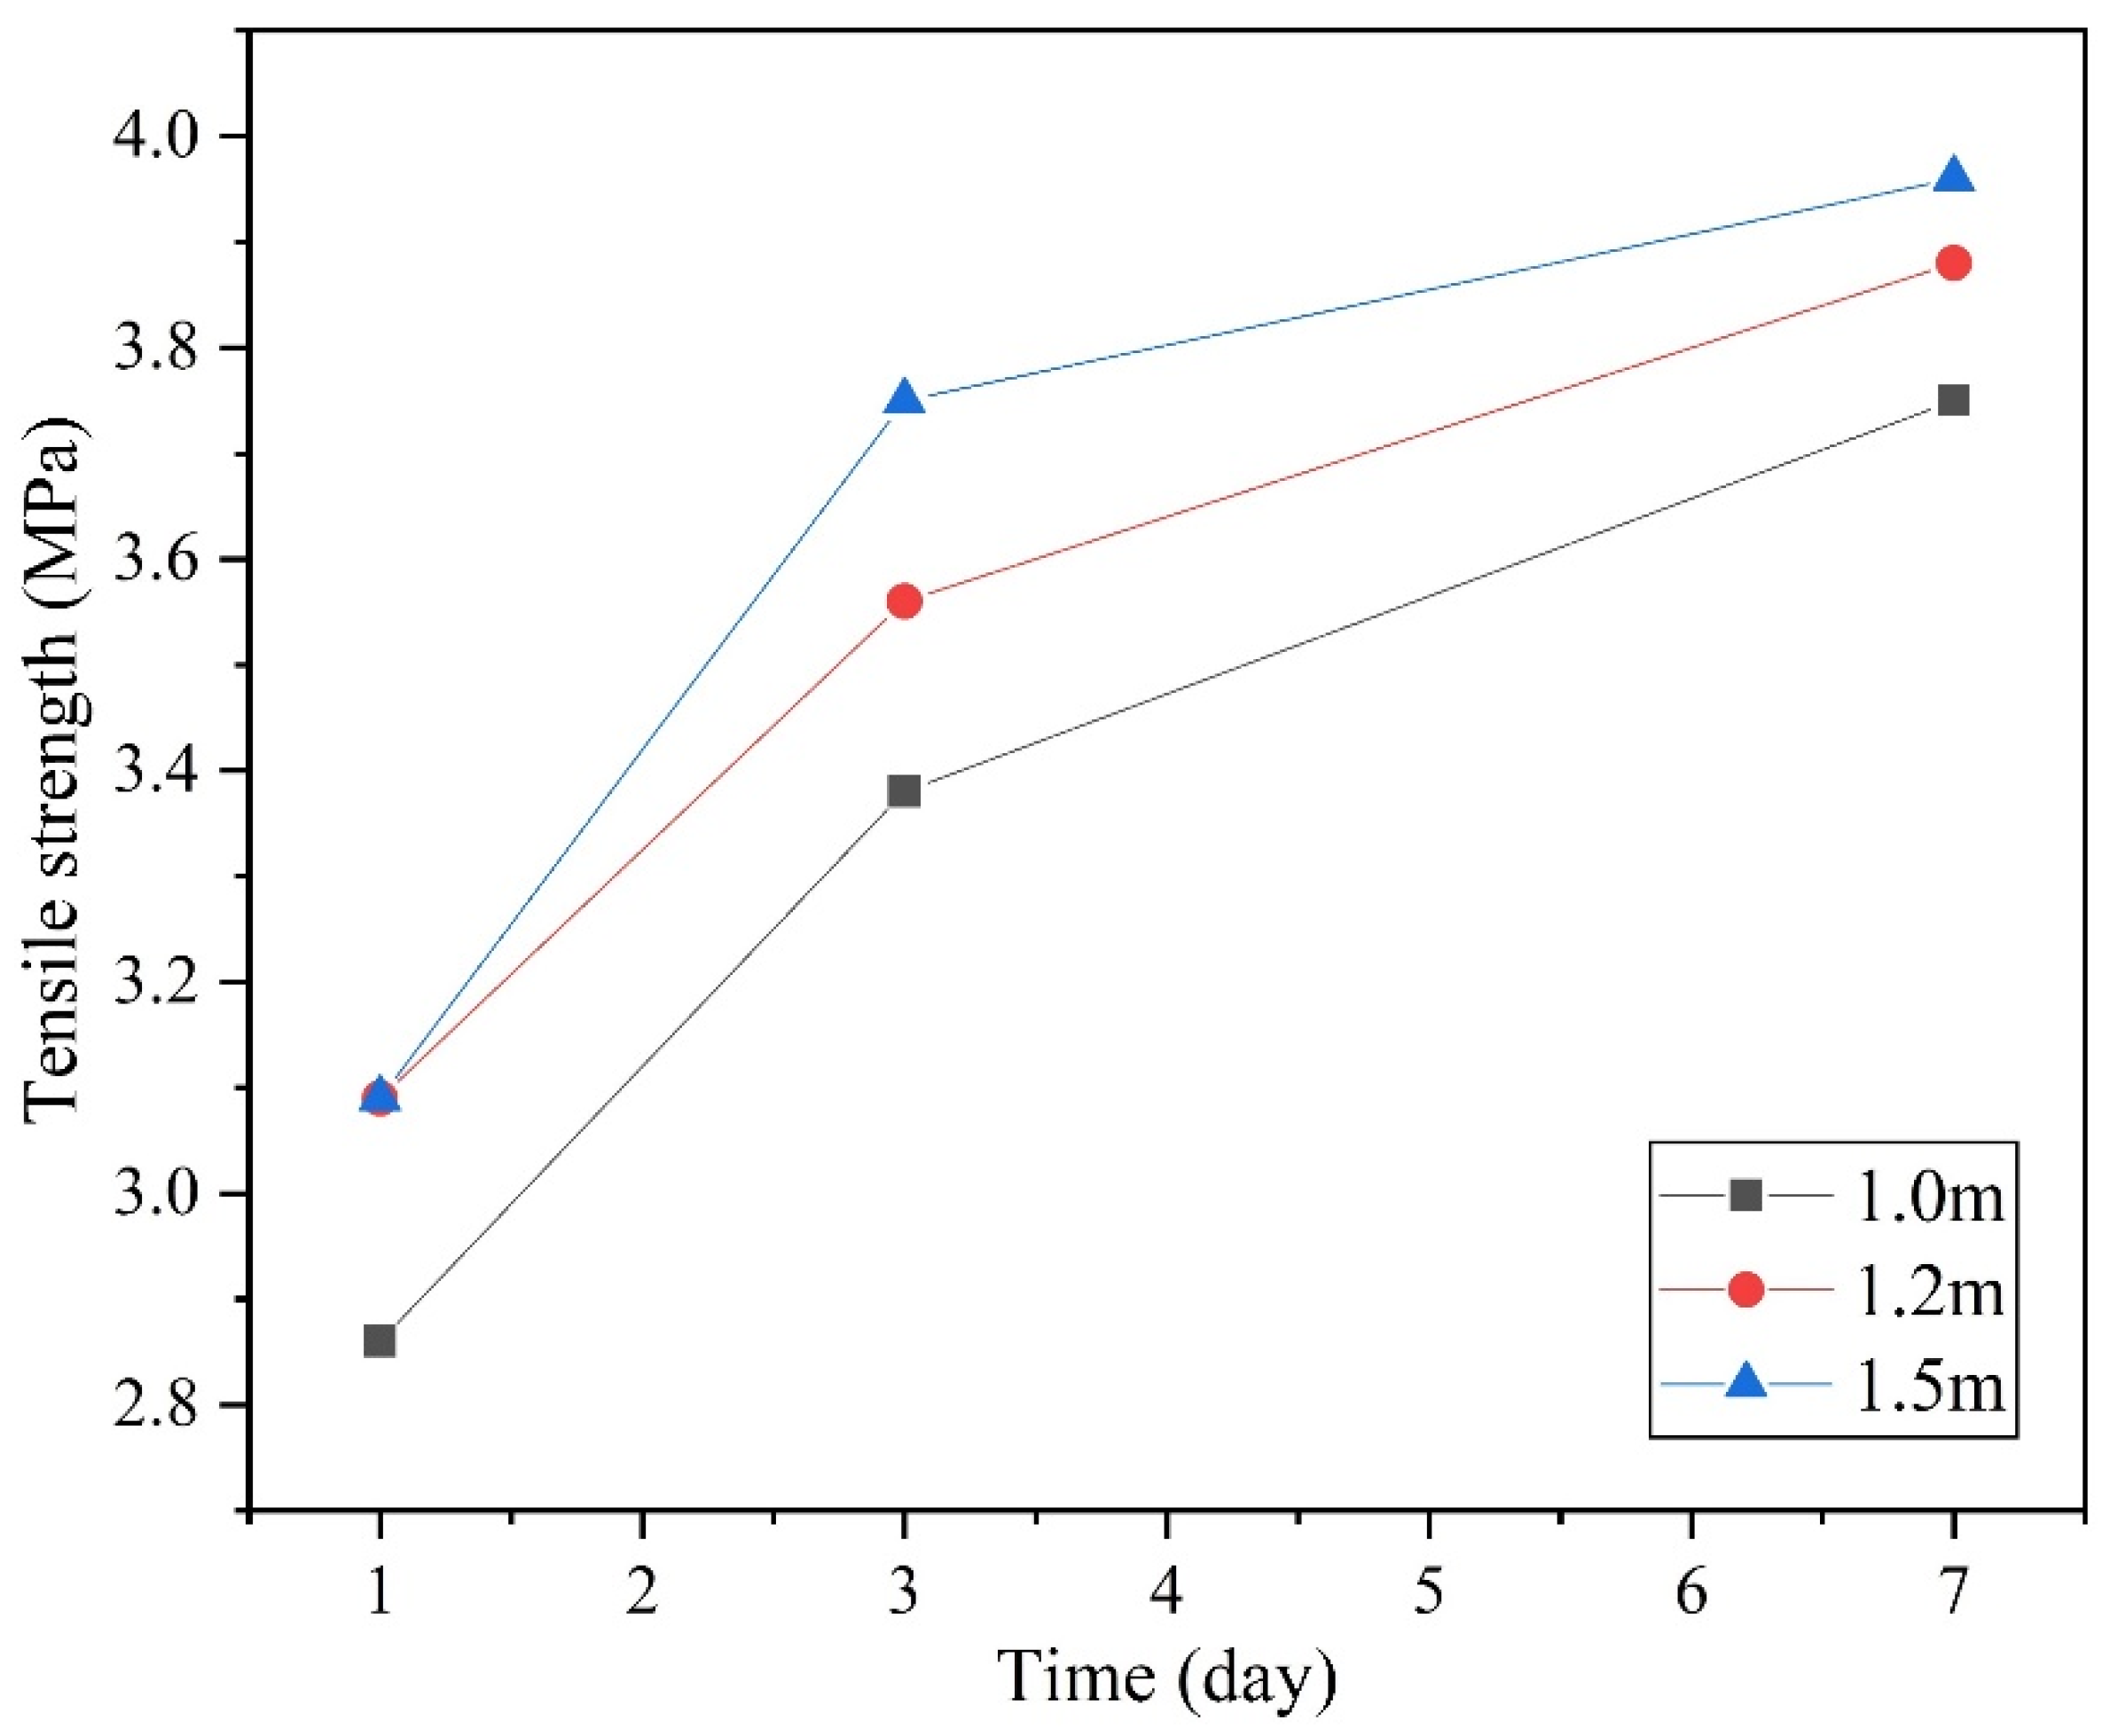
The evolution of the tensile strength of the inner shaft lining concrete on Day 1, Day 3, and Day 7 after pouring is depicted in Figure 9. As shown in the graph, the tensile strength of the shaft lining concrete significantly increases with age, and the increase rate gradually decreases with an increase in age. The tensile strength of the shaft lining concrete at the same age increased gradually with its thickness, but the increase rate showed no apparent relation to thickness. The above phenomenon is the same as the reason why the compressive strength increases with the lining thickness. Because the thick lining ensures higher internal moisture content and higher temperature at the same curing time, the good curing environment increases the growth rate of concrete strength. The tensile strength of the shaft lining concrete with three different thicknesses ranged between 2.86 and 3.96 MPa within the first 7 d. Finally, the evolution equation for tensile strength with age within the first 7 d after pouring was fitted based on the experimental data (Table 5).

3.3.3. Elastic Modulus

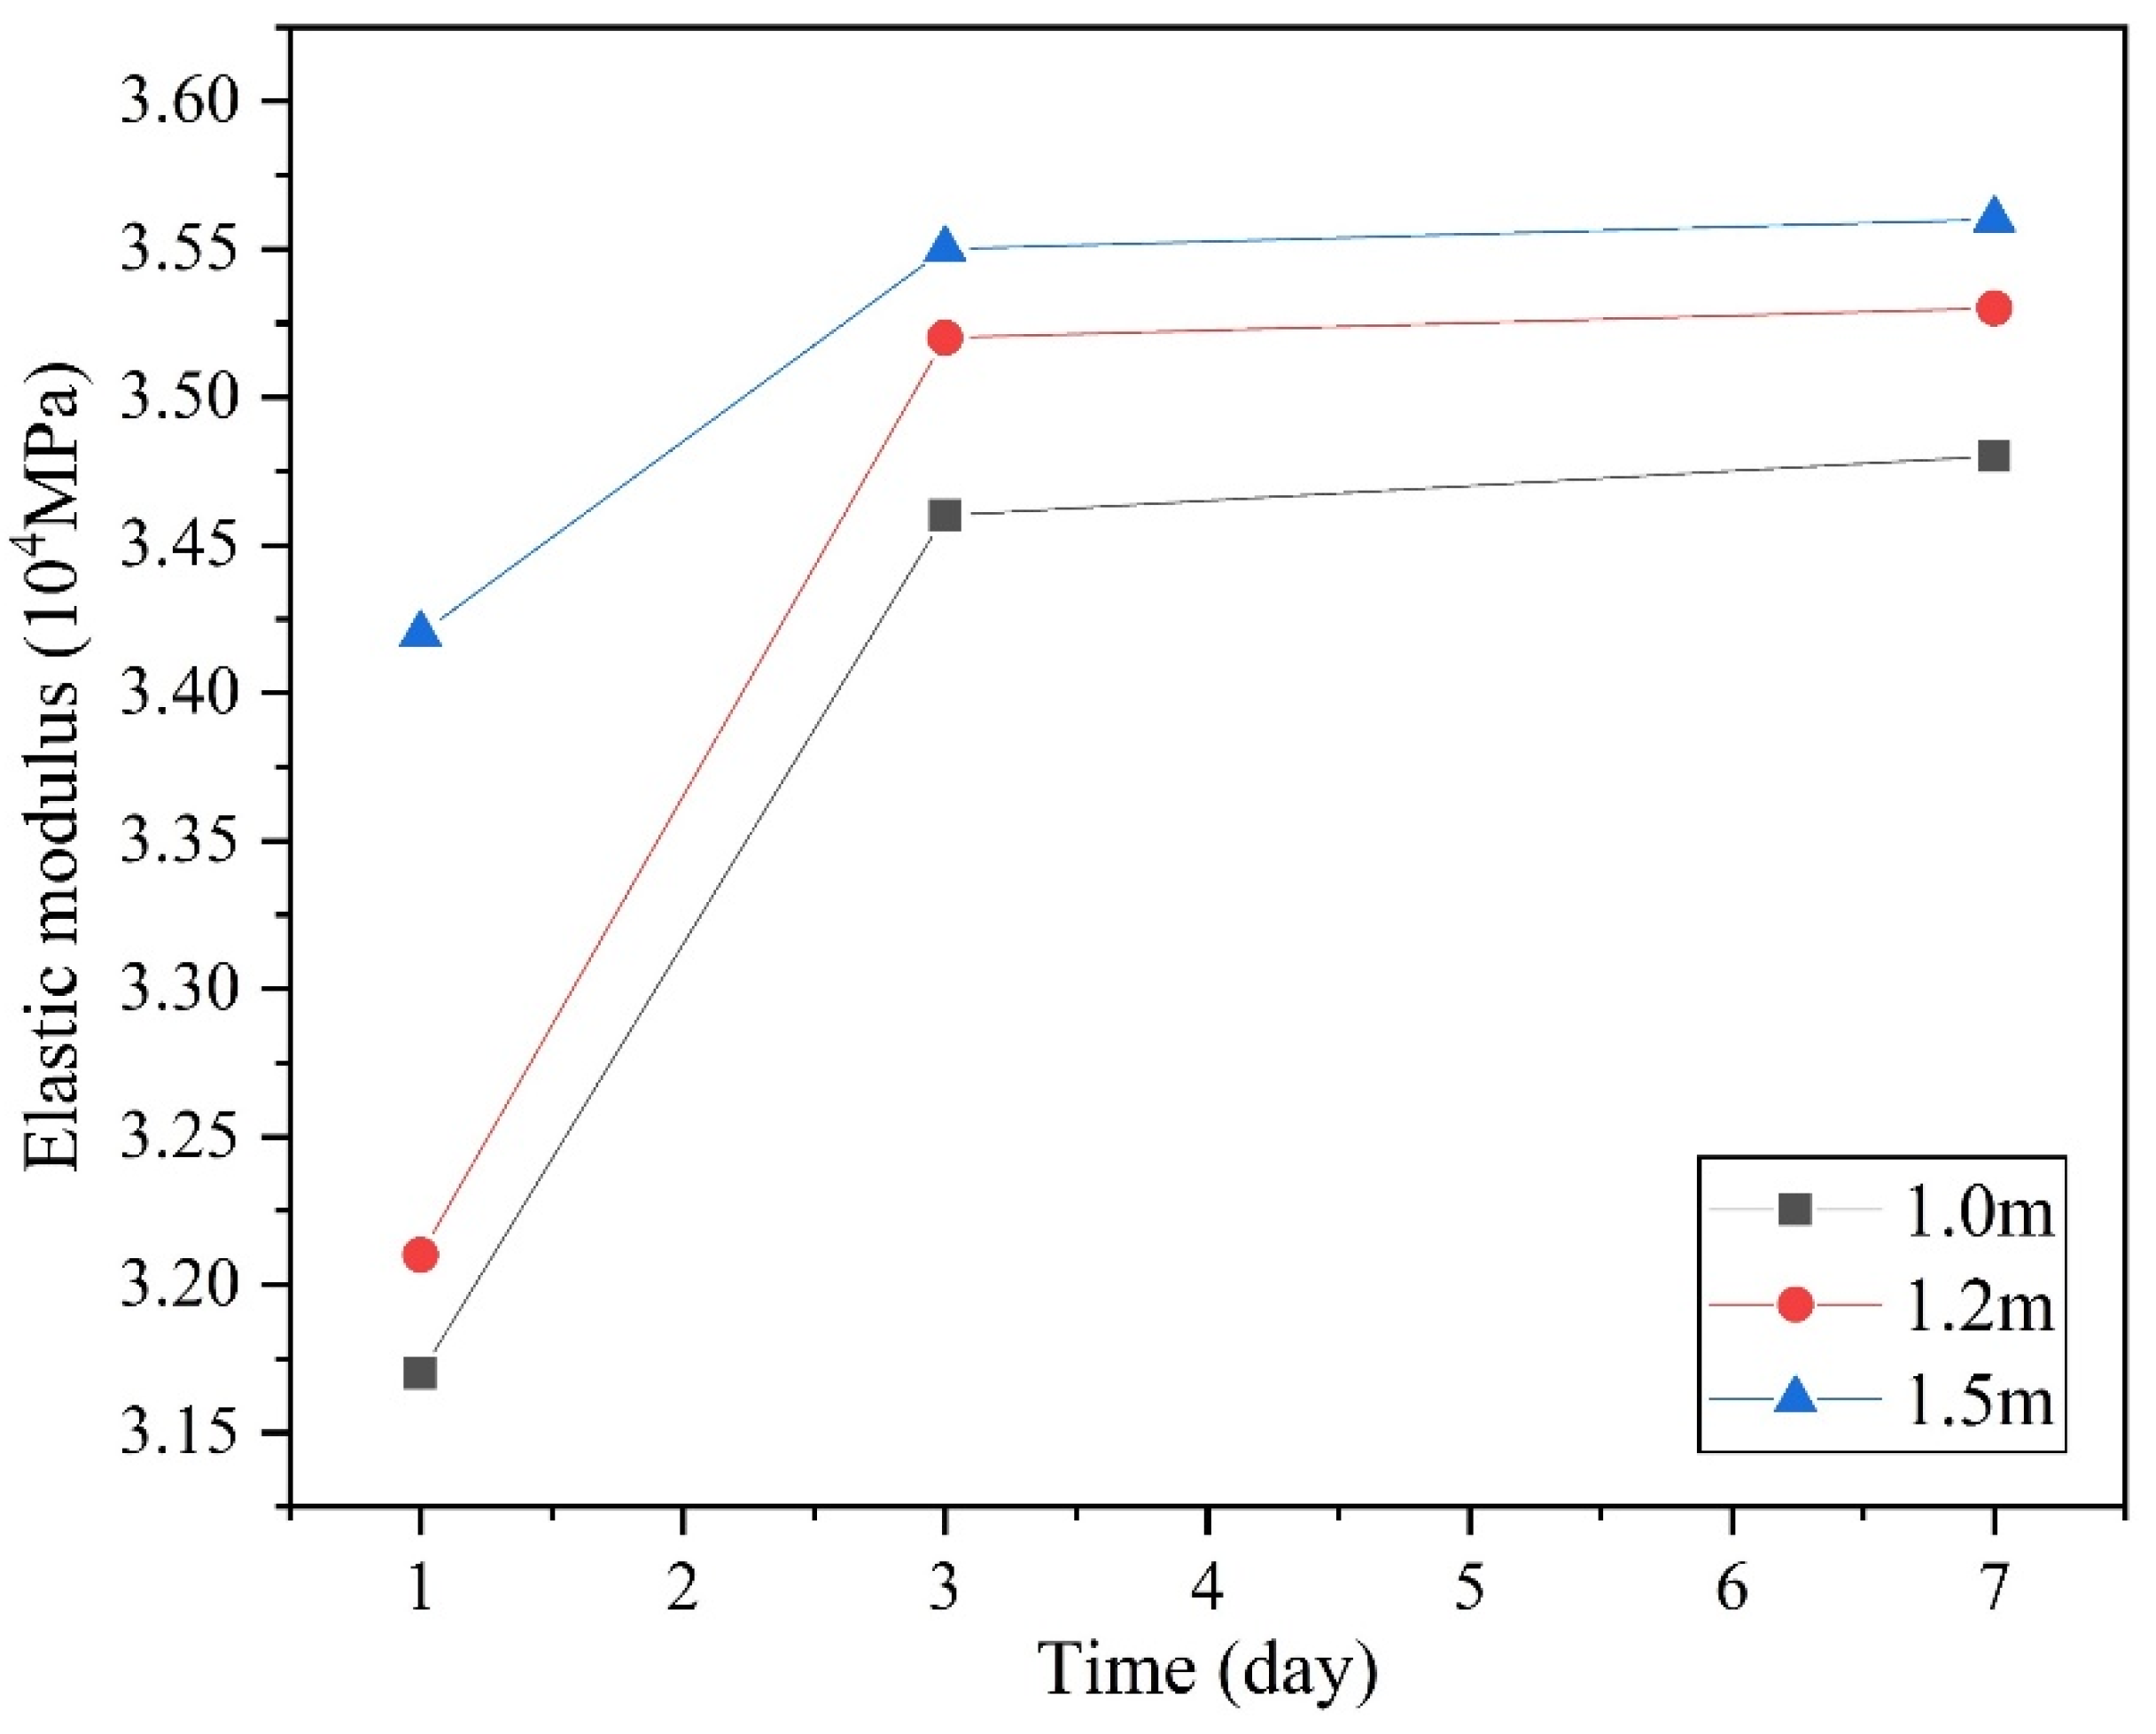
The evolution of the elastic modulus of the inner shaft lining concrete on Day 1, Day 3, and Day 7 after pouring is depicted in Figure 10. The elastic modulus of the shaft lining concrete significantly increases in the first three days and increases slightly in the later ages. In the last four days, the increase of elastic modulus of concrete in three analyzed thicknesses is less than 0.58%, which means that the elastic modulus of concrete in the lining has increased to a relatively stable state in the first three days. The tensile strength of the lining at the same age increased significantly with the thickness, but the increase rate exhibited no apparent relation to the thickness. Under the three analyzed thicknesses, the elastic modulus of the shaft lining concrete with three different thicknesses ranged between 3.17 × 10⁴ MPa and 3.56 × 10⁴ MPa within the first 7 d. Finally, the evolution equation of elastic modulus with age within the first 7 d after pouring is fitted based on experimental data, as shown in Table 6.

4. Conclusions

This study analyzes the evolution of the thermophysical and mechanical properties of inner shaft lining concrete with age during the initial pouring period through a series of experiments. The influence of shaft lining thickness on the internal temperature field and the evolution of thermal conductivity, specific heat capacity, compressive strength, tensile strength, and elastic modulus are emphatically analyzed. From the experiment results and analyses, the following major conclusions can be drawn:
(1)
The evolution of temperature in an inner shaft lining within the first 7 d after pouring can be divided into five stages: induction, slow heating, rapid heating, rapid cooling, and slow cooling. The maximum temperature of the inner shaft lining concrete gradually increases with the lining thickness and can reach 76.5 °C when the thickness is 1.5 m. The maximum temperature in the shaft lining is not always at the center in the radial direction but gradually moves outward with the increase of thickness.
(2)
The thermal conductivity of inner shaft lining concrete decreases significantly with an increase in age. Simultaneously, the thermal conductivity of the inner shaft lining concrete increases with the lining thickness. The thermal conductivity of the inner shaft lining concrete with thicknesses of 1.0, 1.2, and 1.5 m evolves between 0.92 and 2.16 W/(m·k) within the first 7 d after pouring.
(3)
The specific heat capacity of shaft lining concrete decreases significantly with an increase in age, and the decline rate gradually decreases with an increase in age. The specific heat capacity of material at the same age increases significantly with an increase in thickness. The specific heat capacity of the inner shaft lining concrete at thicknesses of 1.0, 1.2, and 1.5 m evolves between 0.66 and 0.98 KJ/(kg·k) within the first 7 d after pouring.
(4)
The compressive strength of the shaft lining concrete increased significantly with an increase in age within the first 7 d after pouring, and the increase rate gradually decreased with an increase in age. The compressive strength at the same age increases significantly with the thickness, and the increase rate has no apparent association with the thickness. The compressive strength of the inner shaft lining concrete with thicknesses of 1.0, 1.2, and 1.5 m evolves between 37.33 and 57.01 MPa within the first 7 d after pouring.
(5)
The tensile strength of shaft lining concrete significantly increases with age, and the increase rate gradually decreases with an increase in age. The tensile strength of the shaft lining concrete at the same age increases gradually with the thickness, but the increase rate has no apparent association with the thickness. The tensile strength of the inner shaft lining concrete with thicknesses of 1.0, 1.2, and 1.5 m evolves between 2.86 and 3.96 MPa within the first 7 d after pouring.
(6)
The elastic modulus of the shaft lining concrete significantly increases in the first three days and increases slightly in the later ages. The inner shaft lining thickness can accelerate the entry of the elastic modulus to the stable state. The elastic modulus of inner shaft lining concrete at the same age increases significantly with the thickness. The elastic modulus of the inner shaft lining concrete with thicknesses of 1.0, 1.2, 1.5 m evolved between 3.17 × 10⁴ MPa and 3.56 × 10⁴ MPa within the first 7 d after pouring.

Author Contributions

Writing—review and editing, C.Z.; methodology and formal analysis, C.Z. and Y.Z.; funding acquisition and conceptualization, W.Y.; data curation and validation, J.Y. and T.Z. All authors have read and agreed to the published version of the manuscript.

Funding

This study was supported by the National Natural Science Foundation of China (No.51804300; No.41771072) and the Fundamental Research Funds for the Central Universities of China (No.2021GJZPY15).

Institutional Review Board Statement

Not applicable.

Informed Consent Statement

Not applicable.

Data Availability Statement

The data used to support the findings of this study are available from the corresponding author upon request.

Conflicts of Interest

The authors declare that there are no conflict of interest.

References

  1. Yang, Y.; Liao, M.; Cai, H. Numerical simulation of the temperature fields in the shielding walls of frozen soil with multi-circle-pipe freezing in shaft sinking. Therm. Sci. 2019, 23, 647–652. [Google Scholar] [CrossRef] [Green Version]
  2. Fu, Y.; Hu, J.; Wu, Y. Finite element study on temperature field of subway connection aisle construction via artificial ground freezing method. Cold Reg. Sci. Technol. 2021, 189, 103327. [Google Scholar] [CrossRef]
  3. Zhu, H.; Han, L. Experimental study on grouting seepage characteristics of single-fracture specimen under three-dimensional stress. Arab. J. Geosci. 2022, 15, 840. [Google Scholar] [CrossRef]
  4. Ding, N.; Hu, C.L.; Yu, J.C.; Liu, Y.N. Application of distributed fiber-optic temperature sensor in shaft-sinking by freezing in coal mine. Transducer Microsyst. Technol. 2014, 33, 154–160. [Google Scholar]
  5. Wang, B.S.; Sun, P.X.; Luo, T.T.; Tao, Z. Freezing Pressurized Water into a Standard Cylindrical Ice Sample in a Triaxial Cell. Geofluids 2021, 2021, 6678966. [Google Scholar] [CrossRef]
  6. Yang, W.H. The development and Prospect of freezing drilling technology in China in the past ten years. In Proceedings of the High Level Academic Forum on the 50th Anniversary of the Founding of China Coal Society, Beijing, China, 2012. [Google Scholar]
  7. Cheng, H.; Cai, H.B. Safety Situation and Thinking about Deep Shaft Construction with Freezing Method in China. J. Anhui Univ. Sci. Technol. 2013, 33, 1–6. [Google Scholar]
  8. Yao, Z.S.; Cheng, H.; Zhang, G.Y. Research on site measurement of outer shaft wall stressing in freezing sinking shaft in special thick alluvium. Coal Sci. Technol. 2004, 32, 49–52. [Google Scholar]
  9. Wang, Y.S. Study on the Law of Strength Growth, Stress and Deformation of the Outer Wall of Freezing Shaft Lining in Extra Thick Alluvium; China University of Mining and Technology: Xuzhou, China, 2005. [Google Scholar]
  10. Deng, W.G.; Shen, J.H.; Qiao, G.L. Summary and Thinking on the existence of coal mine well construction in Western China. Mine Const Ruction Technol. 2010, 31, 29–33. [Google Scholar]
  11. Chen, J.T. Meso-Numerical Calculation of Crack Mechanism of Concrete on Inner Wall of Deep and Large Frozen Shaft During Sinking Period; China University of Mining and Technology: Xuzhou, China, 2021. [Google Scholar]
  12. Mao, J.H. Prediction and Evaluation of Coal Resources in China; Science Press: Beijing, China, 1999. [Google Scholar]
  13. Ranjith, P.G.; Zhao, J.; Ju, M.H.; Rathnaweera, T.D. Opportunities and Challenges in Deep Mining: A Brief Review. Engineering 2017, 3, 546–551. [Google Scholar] [CrossRef]
  14. Kijko, A. An Introduction to Mining Seismology; Academic Press: San Diego, CA, USA, 1994. [Google Scholar]
  15. Chen, B.; Zhang, S.; Li, Y.; Li, Z.; Zhou, H. Physical simulation study of crack propagation and instability information discrimination of rock-like materials with faults. Arab. J. Geosci. 2020, 13, 966. [Google Scholar] [CrossRef]
  16. Wang, T.; Zhang, H.; Zhou, G.Q.; Liu, X.Y. Evaluation of variability characteristics of mechanical parameters of artificially frozen clay in deep alluvium. Cold Reg. Sci. Technol. 2020, 171, 102978. [Google Scholar] [CrossRef]
  17. Zhang, J.; Zhang, X.; Guo, X. Water in rush Analysis and Manage Measures of Shaft Sinking by Freezing Method. Disaster Adv. 2012, 5, 452–456. [Google Scholar]
  18. Chen, X.S. A Space-Time-Dependant Design Method and the Stability of Ice Wall for Deep Shafts. Appl. Mech. Mater. 2012, 204, 3275–3281. [Google Scholar] [CrossRef]
  19. Zhang, C.; Zhang, Y.; Yang, W.H.; Li, H.P.; Lu, Q. Study on Temperature Field Evolution and Frozen Wall Closure Judgment Criteria of Inclined Shaft under Inclined Holes Freezing Condition. Geofluids 2022, 2022, 8002667. [Google Scholar] [CrossRef]
  20. Hu, J.; Wang, X.; Jiang, B. Numerical Analysis of Temperature Field of Vertical Frozen Soil Wall Reinforcement at Shield Shaft. In Proceedings of the 2014 3rd International Conference on Micro Nano Devices, Structure and Computing Systems, Singapore, 1–2 March 2014. [Google Scholar]
  21. Wang, Y.S.; Yang, R. Monitoring and analysis of the stress and deformation of shaft lining and the influence of freezing tube fracture in deep topsoil. Cold Reg. Sci. Technol. 2022, 193, 103420. [Google Scholar] [CrossRef]
  22. Yu, G.C. The prevention of cracking and water leakage in the concrete inner lining of frozen shafts. Int. J. Min. Geol. Eng. 1986, 4, 247–251. [Google Scholar]
  23. Meddah, M.S.; Suzuki, M.; Sato, R. Influence of a combination of expansive and shrinkage-reducing admixture on autogenous deformation and self-stress of silica fume high-performance concrete. Constr. Build. Mater. 2011, 25, 239–250. [Google Scholar] [CrossRef]
  24. Jiang, X.P.; Wang, S.L.; Yong, Y.L. Research on Controlling Mechanism of Temperature Crack of High Performance Concrete on Freezing Shaft Lining in Special Thick Alluvium. Adv. Mater. Res. 2012, 368, 1300–1306. [Google Scholar] [CrossRef]
  25. Jzab, C.; Fl, B.; Slab, C. Early age cracking potential of inner lining of coal mine frozen shaft. Energy Rep. 2022, 8, 16–24. [Google Scholar]
  26. Neji, M.; Barbe, F.B.; Imbert, C. Data-Based Modeling of Early-Age Concrete Mechanical Behavior for Structural Calculation. J. Mater. Civ. Eng. 2020, 32, 04019370. [Google Scholar] [CrossRef]
  27. Gamnitzer, P.; Drexel, M.; Brugger, A. Calibration of a Multiphase Model Based on a Comprehensive Data Set for a Normal Strength Concrete. Materials 2019, 12, 791. [Google Scholar] [CrossRef] [PubMed] [Green Version]
  28. Wang, X.S.; Cheng, H.; Wu, T.L.; Yao, Z.S.; Huang, X.W. Numerical Analysis of a Novel Shaft Lining Structure in Coal Mines Consisting of Hybrid-Fiber-Reinforced Concrete. Crystals 2020, 10, 928. [Google Scholar] [CrossRef]
  29. Jendrys, M. Analysis of stress state in mine shaft lining, taking into account superficial defects. IOP Conf. Ser. Earth Environ. Sci. 2019, 261, 012016. [Google Scholar] [CrossRef]
  30. Kahouadji, A.; Clastres, P.; Debicki, G. Early-age compressive strength prediction of concrete—Application on a construction site. Constr. Build. Mater. 1997, 11, 431–436. [Google Scholar] [CrossRef]
  31. Dong, W.; Zhou, X.; Wu, Z. A fracture mechanics-based method for prediction of cracking of circular and elliptical concrete rings under restrained shrinkage. Eng. Fract. Mech. 2014, 131, 687–701. [Google Scholar] [CrossRef] [Green Version]
  32. Kim, J.K.; Sang, H.H.; Park, S.K. Effect of temperature and aging on the mechanical properties of concrete. Cem. Concr. Res. 2002, 32, 1095–1100. [Google Scholar] [CrossRef]
  33. Deng, Z.C.; Mei, Y.J.; Yang, Z.F.; Chen, J.; Xin, Z.H. Study on Influence of Different Factors on Thermal Conductivity of Ceramite Concrete. Sichuan Build. Material. 2020, 46, 8–9. [Google Scholar]
  34. Zhang, W.P.; Tong, F.; Xing, Y.S.; Gu, X.L. Experimental Study and Prediction Model of Thermal Conductivity of Concrete. J. Build. Mater. 2015, 18, 183–189. [Google Scholar]
  35. Zhang, F. Experimental Study on Thermal Parameters of Concrete; Tongji University: Shanghai, China, 2019. [Google Scholar]
  36. Hammons, M.I.; Smith, D.M. Early-Time Strength and Elastic Modulus of Concrete with High Proportions of Fly Ash. In Serviceability & Durability of Construction Materials; ASCE: New York, NY, USA, 2015. [Google Scholar]
  37. Whiting, D.A.; Detwiler, R.J.; Lagergren, E.S. Cracking Tendency and Drying Shrinkage of Silica Fume Concrete for Bridge Deck Applications. Aci Mater. J. 2000, 91, 71–77. [Google Scholar]
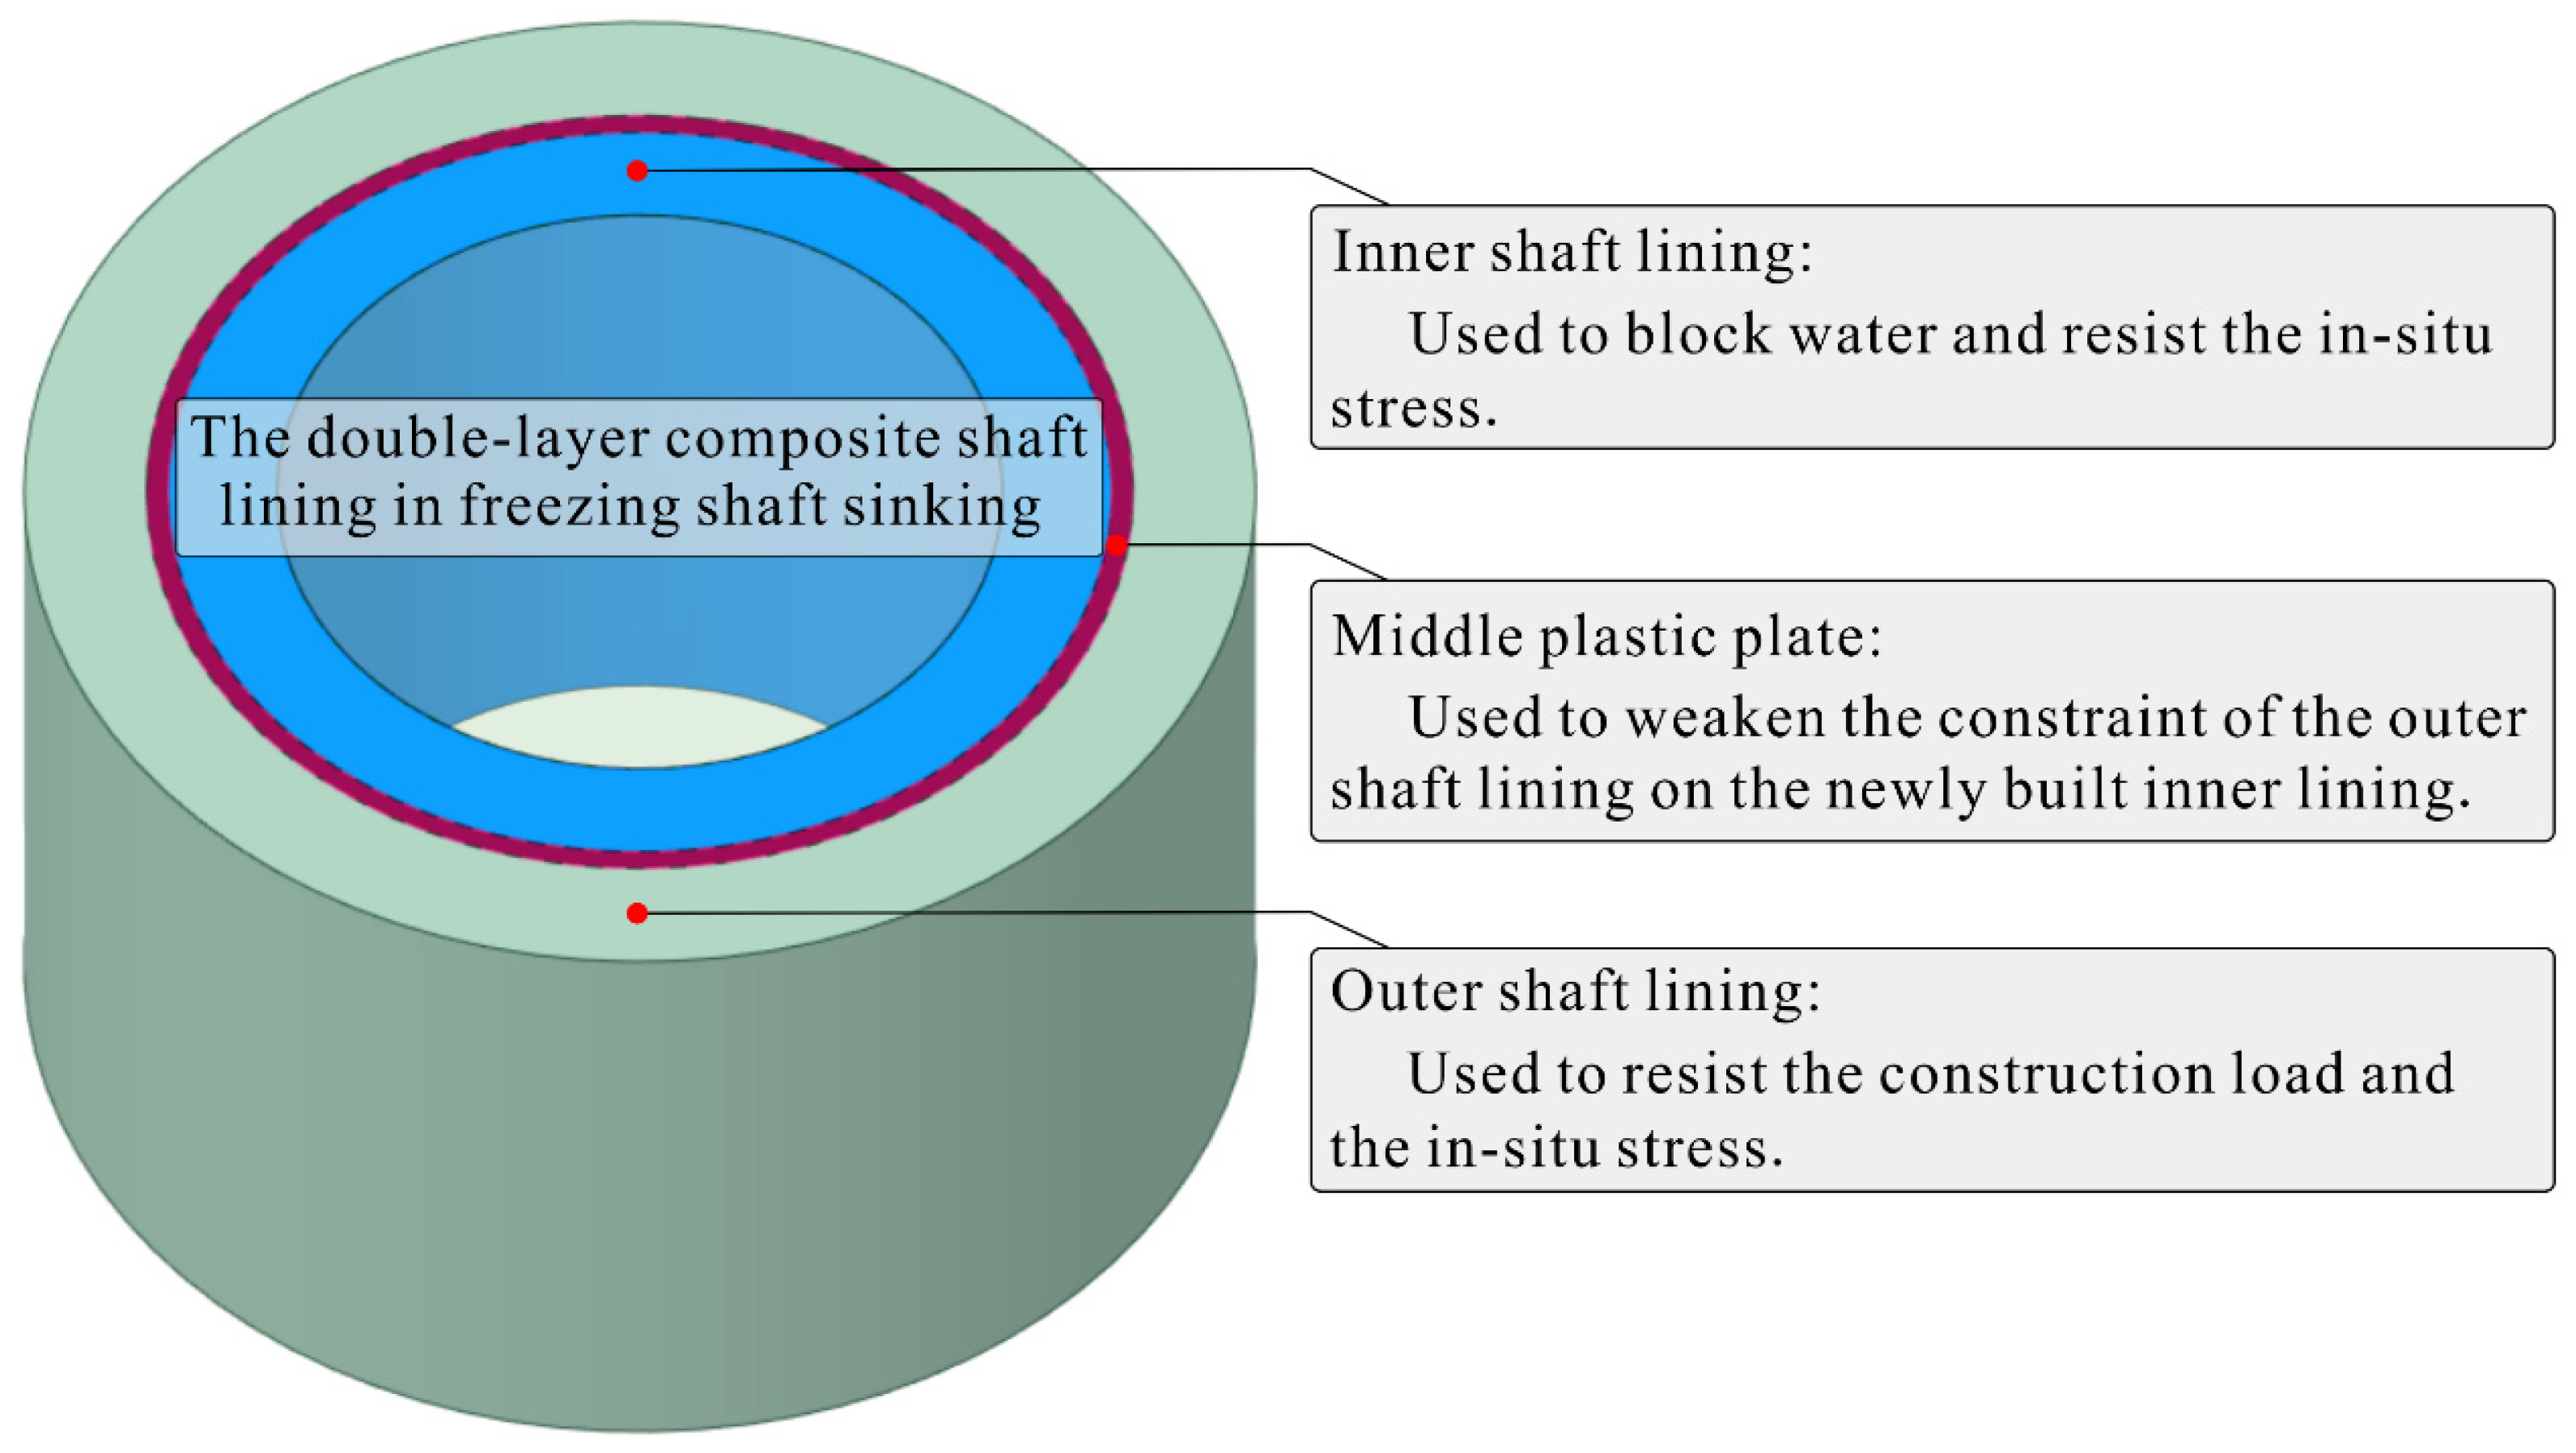
Figure 1. Schematic of the double-layer composite shaft lining structure in the freezing shaft sinking.
Applsci 12 10141 g001
Figure 2. Schematic of the experimental model: (a) structure of double-layer composite shaft lining, (b) design model for experiment based on actual lining, (c) position of prefabricated molds in experimental model, and (d) position of temperature measurement points in experimental model.
Applsci 12 10141 g002
Figure 3. Measurement of various parameters: (a) testing equipment for concrete temperature, (b) demolding of the test block, (c) testing equipment for the thermophysical properties of the material, (d) compressive strength testing, (e) tensile strength testing, and (f) elastic modulus testing.
Applsci 12 10141 g003
Figure 4. Evolution of temperature at different measurement points on the inner shaft lining with age: (a) 1.0 m thickness, (b) 1.2 m thickness, and (c) 1.5 m thickness.
Applsci 12 10141 g004
Figure 5. Evolution of the maximum temperature on the inner shaft lining with thickness and the time to reach the maximum temperature in the shaft lining.
Applsci 12 10141 g005
Figure 6. Evolution of thermal conductivity with age on Day 1, Day 3, and Day 7 after pouring.
Applsci 12 10141 g006
Figure 7. Evolution of the specific heat capacity of the shaft lining with age on Day 1, Day 3, and Day 7 after pouring.
Applsci 12 10141 g007
Figure 8. Evolution of compressive strength with age on Day 1, Day 3, and Day 7 after pouring.
Applsci 12 10141 g008
Figure 9. Evolution of tensile strength with age Day 1, Day 3, and Day 7 after pouring.
Applsci 12 10141 g009
Figure 10. Evolution of elastic modulus with age within the first 7 d after pouring.
Applsci 12 10141 g010
Table 1. Comprehensive mix of concrete used in the experiment.
Concrete GradeCement (kg)Sand (kg)Sand Ratio (%)Water Reducing Agent (%)Water Cement
Ratio(-)
C60460800380.600.34
Table 2. Evolution equation for thermal conductivity with age within the first 7 d.
NumberThermal Conductivity (W/(m·k))Time (d)Thickness (m)Fitting EquationR-Squared
1yx1.0 y = 0.0263 x 2 + 0.0450 x + 1.8913 1
2yx1.2 y = 0.0233 x 2 + 0.0083 x + 2.0650 1
3yx1.5 y = 0.0179 x 2 0.0433 x + 2.2213 1
Table 3. Evolution equation for specific heat capacity with age within the first 7 d.
NumberSpecific Heat Capacity (KJ/(kg·k))Time (d)Thickness (m)Fitting EquationR-Squared
1yx1.0 y = 0.0133 x 2 0.1433 x + 1.01 1
2yx1.2 y = 0.0088 x 2 0.105 x + 1.0663 1
3yx1.5 y = 0.0075 x 2 0.095 x + 1.0675 1
Table 4. Evolution equation for compressive strength with age within the first 7 d.
NumberCompressive Strength (MPa)Time (d)Thickness (m)Fitting EquationR-Squared
1yx1.0 y = 1.0417 x 2 + 10.667 x + 27.705 1
2yx1.2 y = 1.1383 x 2 + 12.218 x + 26.920 1
3yx1.5 y = 0.6108 x 2 + 6.6083 x + 40.672 1
Table 5. Evolution equation for tensile strength with age within the first 7 d.
NumberTensile Strength (MPa)Time (d)Thickness (m)Fitting EquationR-Squared
1yx1.0 y = 0.0279 x 2 + 0.3717 x + 2.5163 1
2yx1.2 y = 0.0258 x 2 + 0.3383 x + 2.7775 1
3yx1.5 y = 0.0462 x 2 + 0.5150 x + 2.6213 1
Table 6. Evolution equation for elastic modulus with age within the first 7 d after pouring.
NumberElastic Modulus (104 MPa)Time (d)Thickness (m)Fitting EquationR-Squared
1yx1.0 y = 0.0233 x 2 + 0.2383 x + 2.9550 1
2yx1.2 y = 0.0254 x 2 + 0.2567 x + 2.9788 1
3yx1.5 y = 0.0104 x 2 + 0.1067 x + 3.3237 1
Publisher’s Note: MDPI stays neutral with regard to jurisdictional claims in published maps and institutional affiliations.