
Determination of Aerodynamic Drag Coefficients of Longitudinal Finned Tubes of LNG Ambient Air Vaporizers Using CFD and Experimental Methods

Abstract
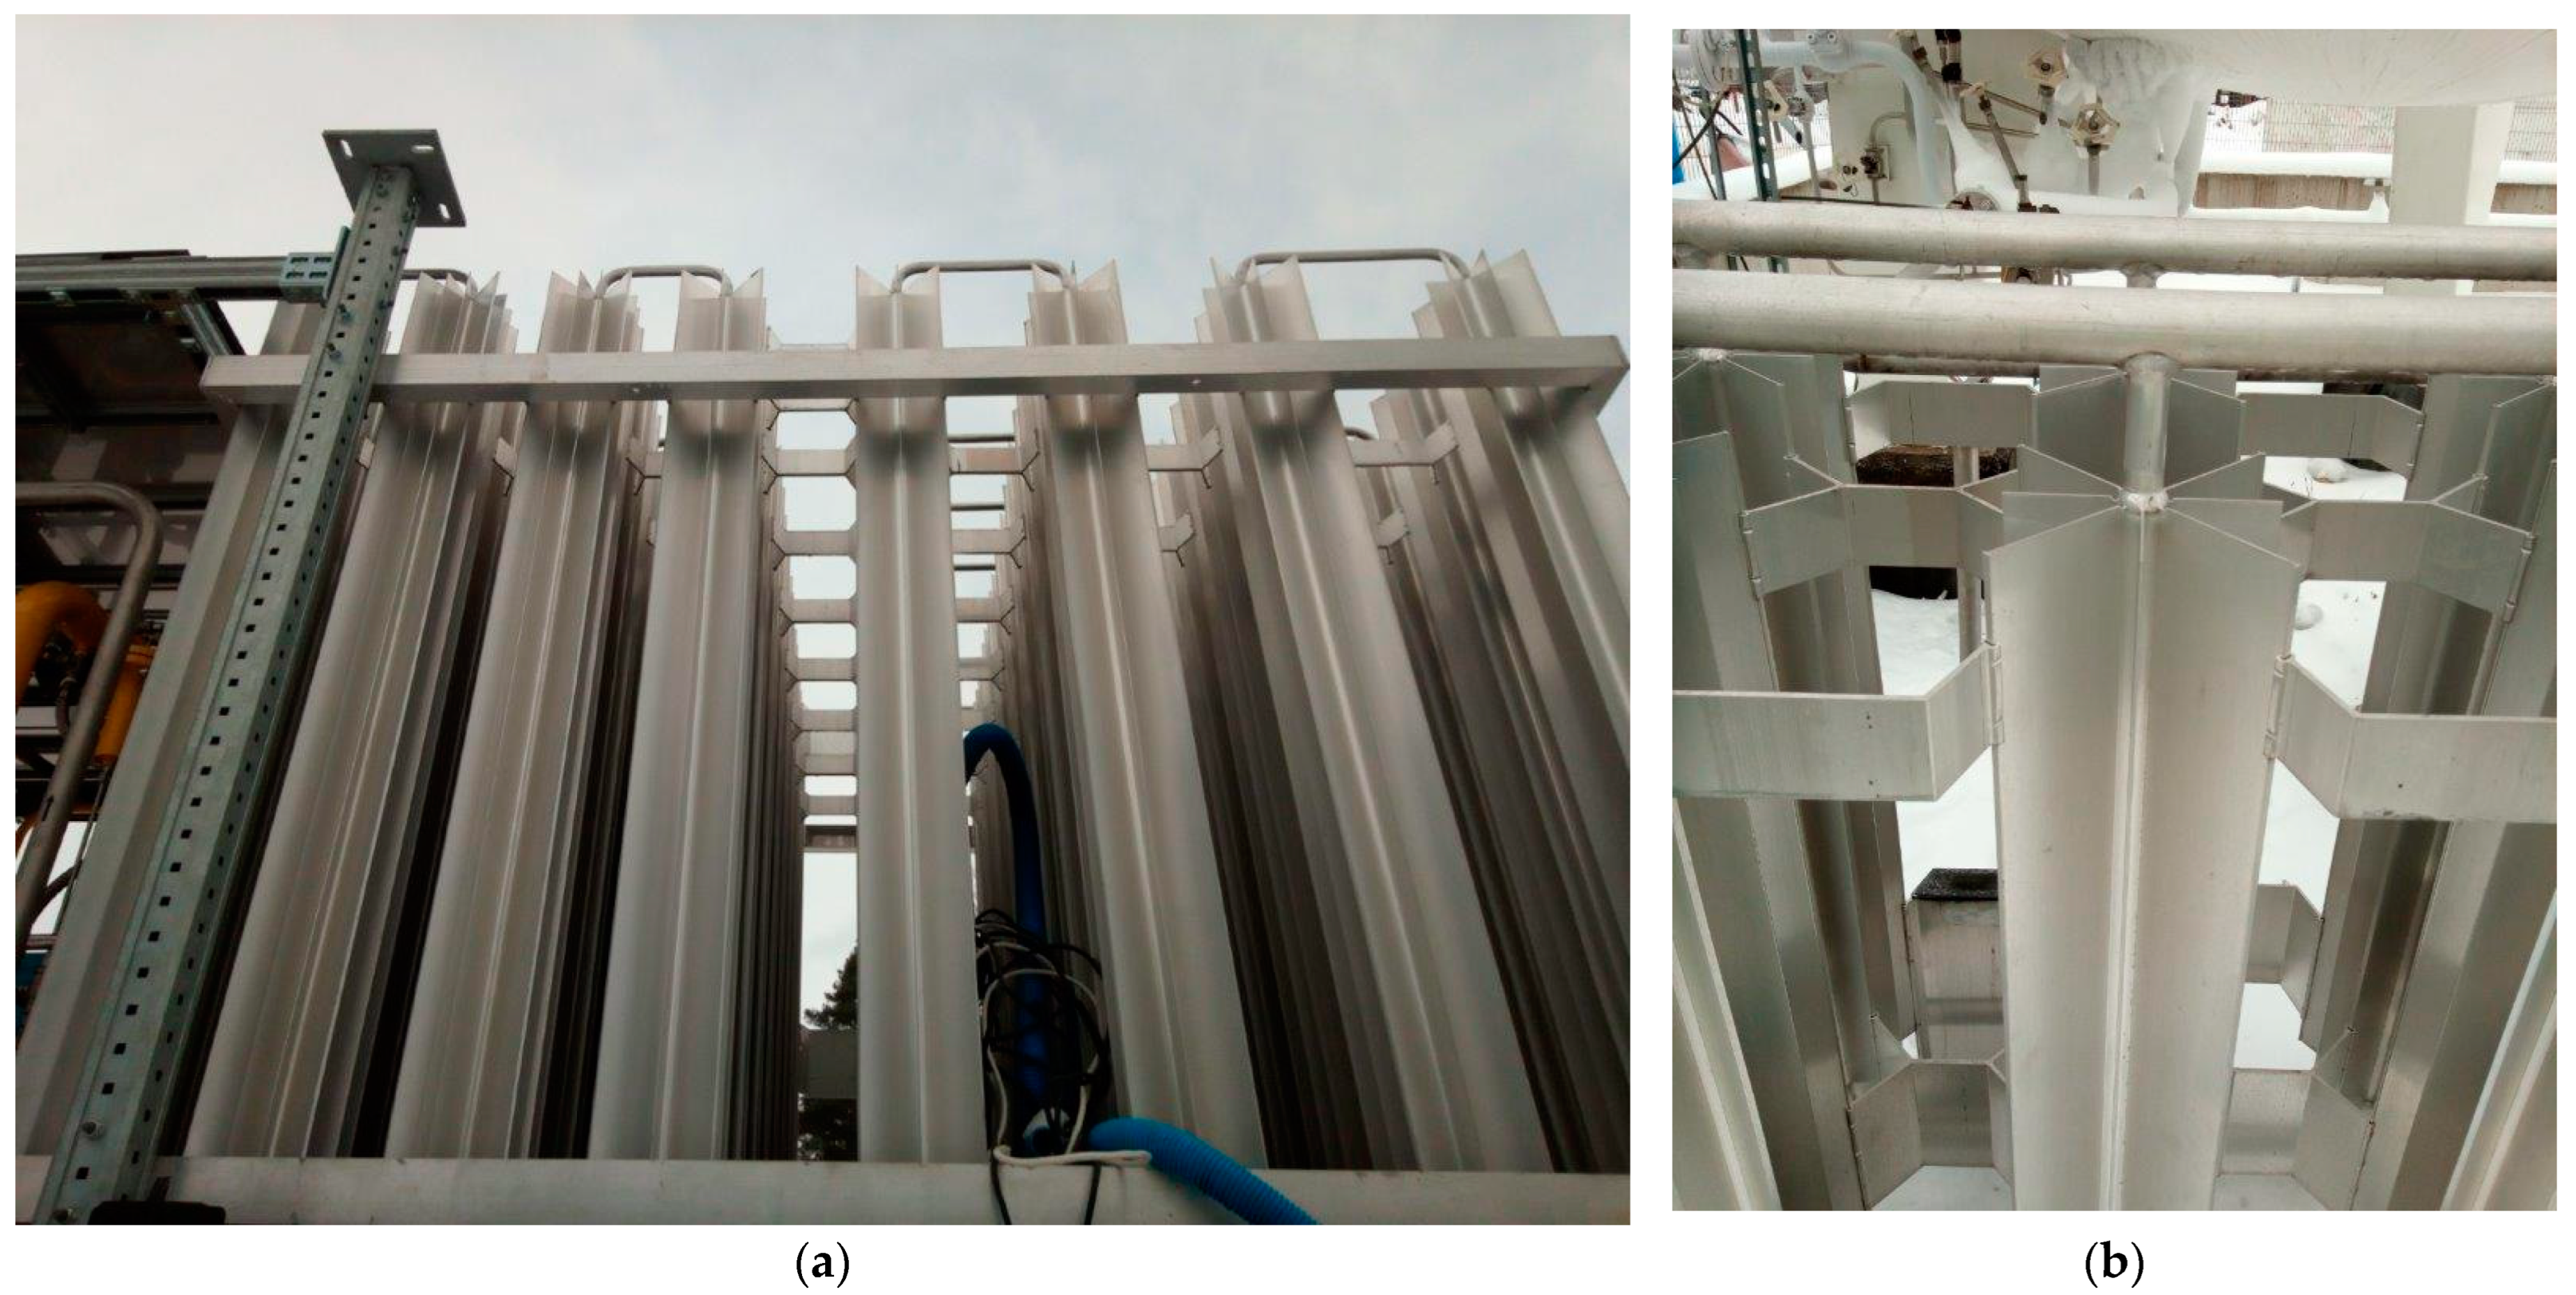
:1. Introduction
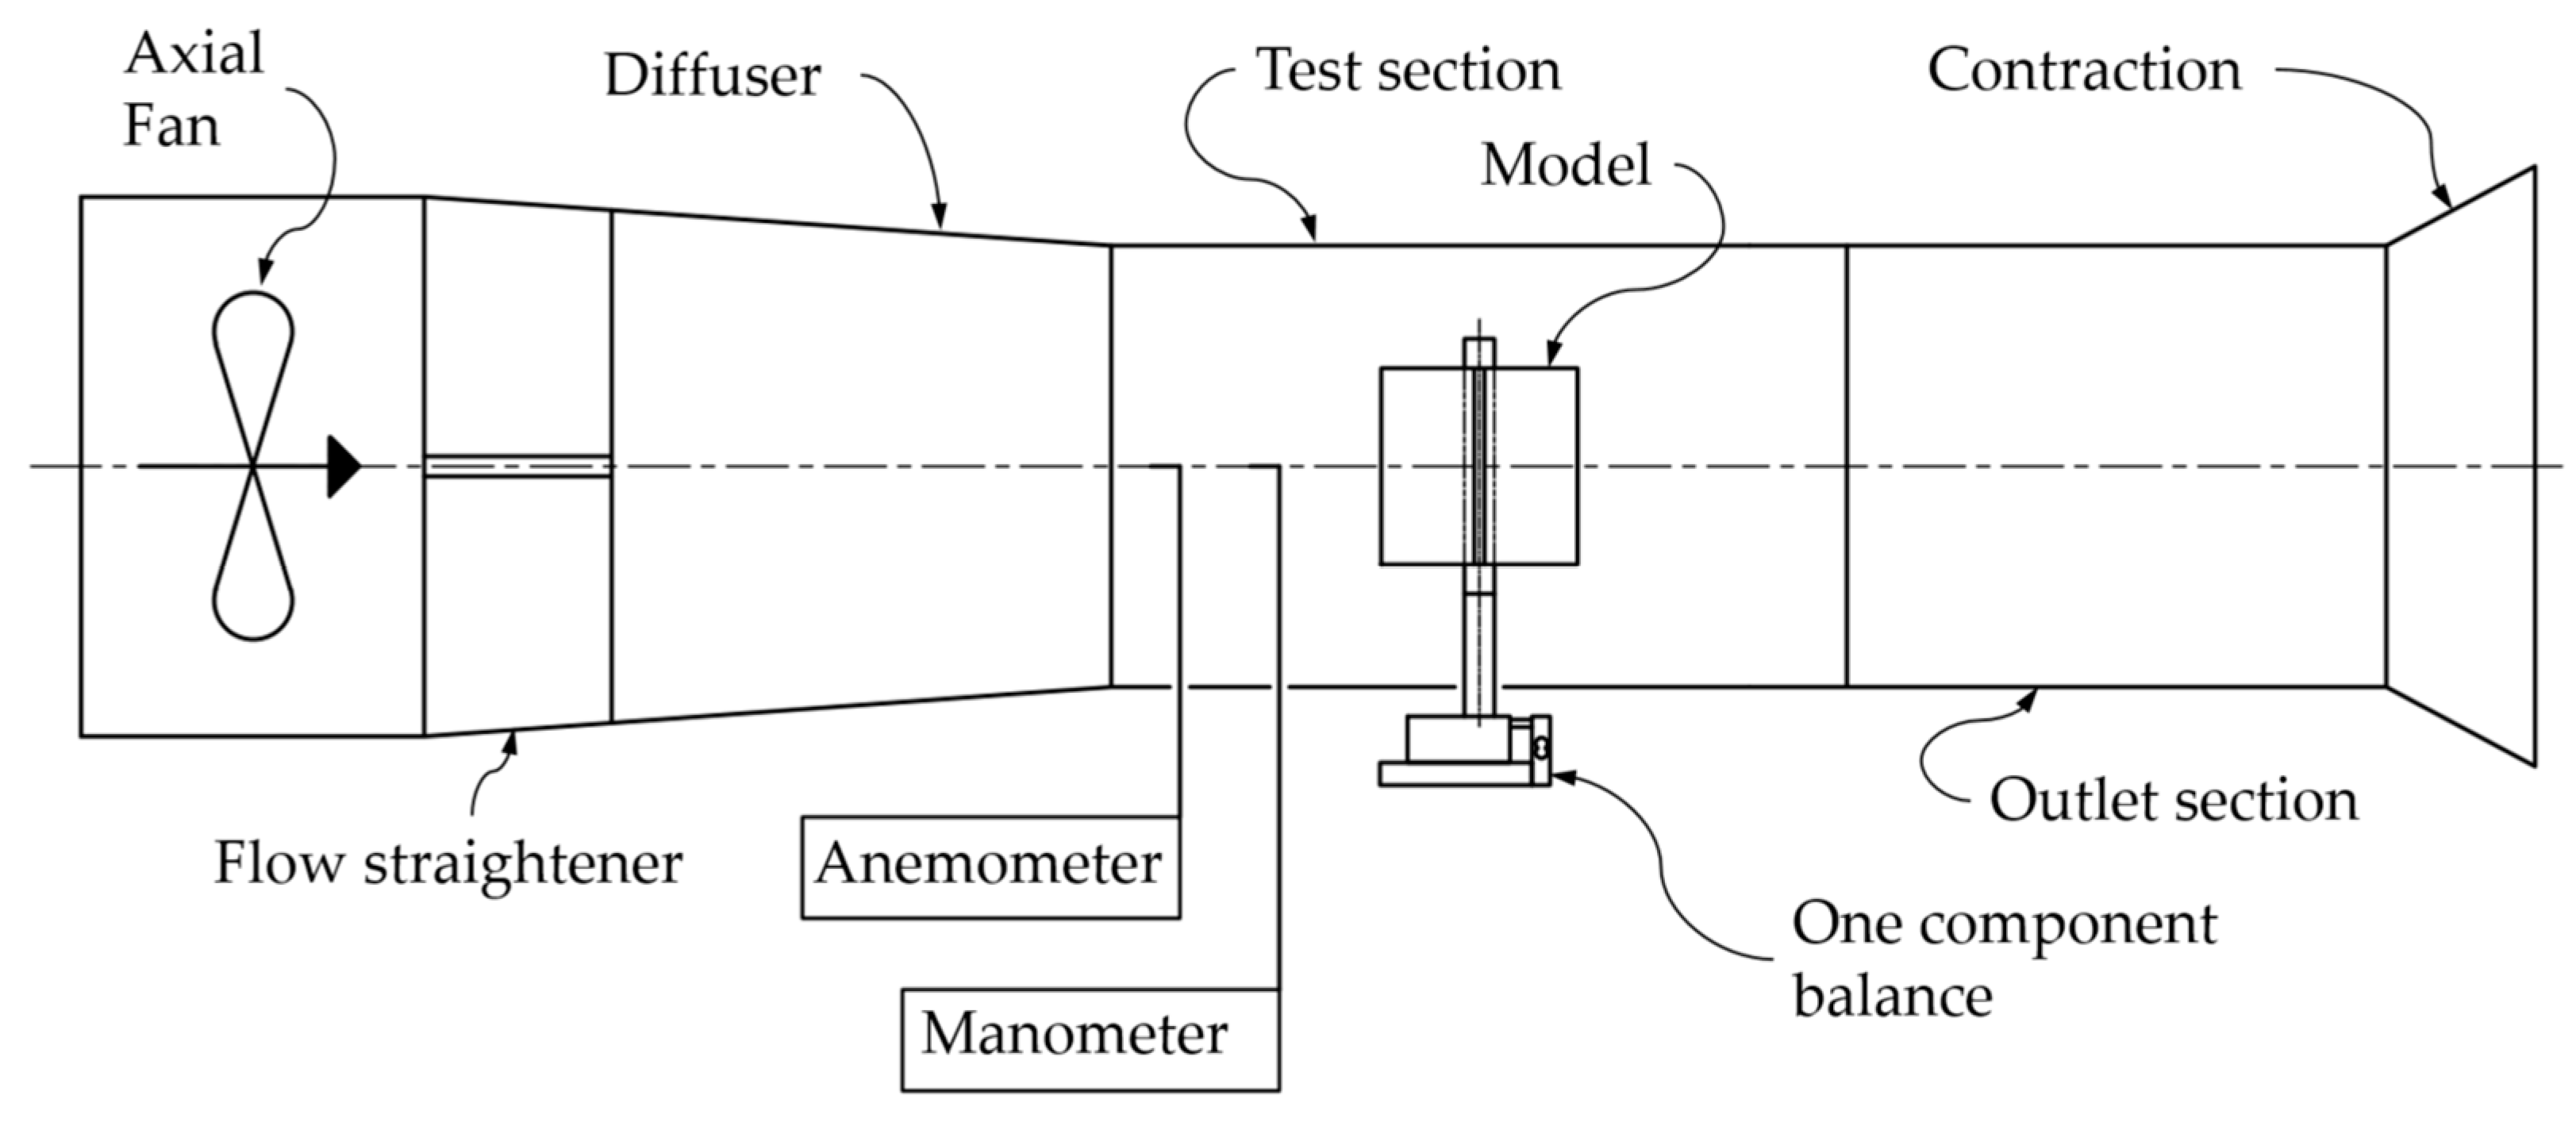
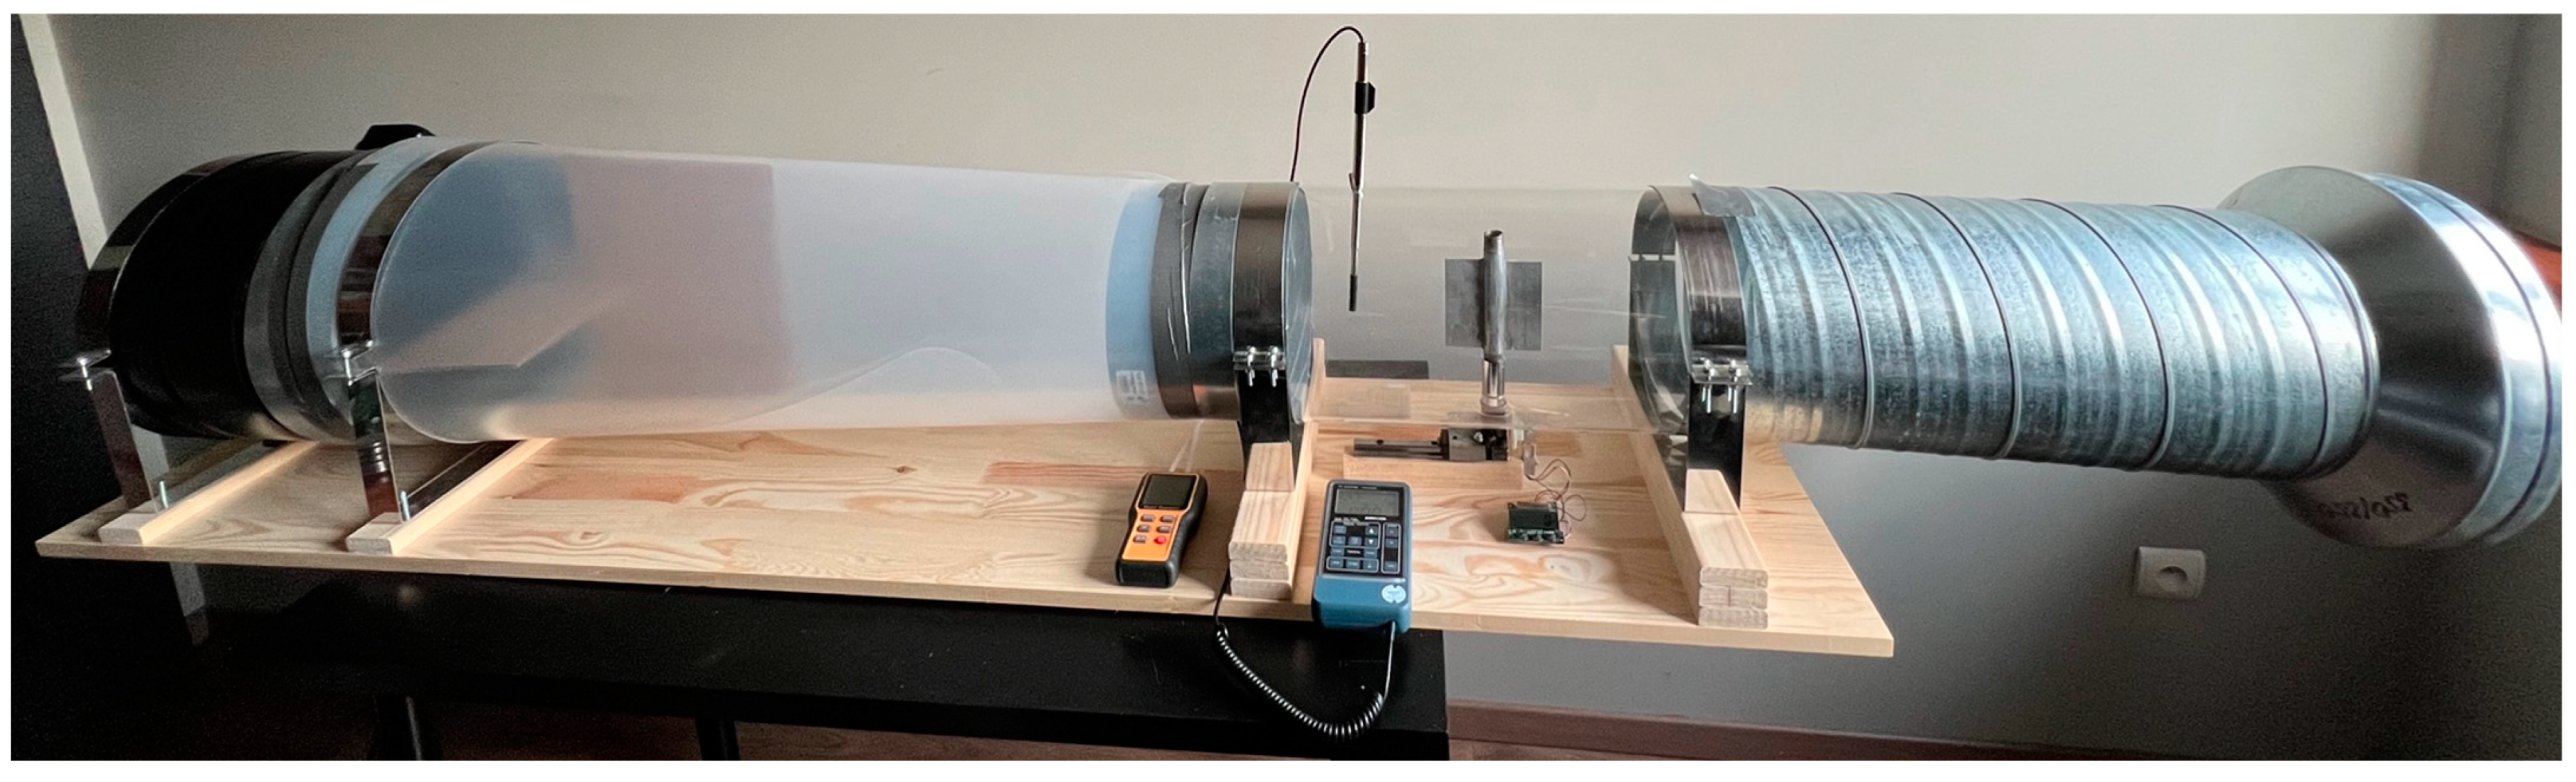
2. Wind Tunnel Tests
3. Numerical Simulation
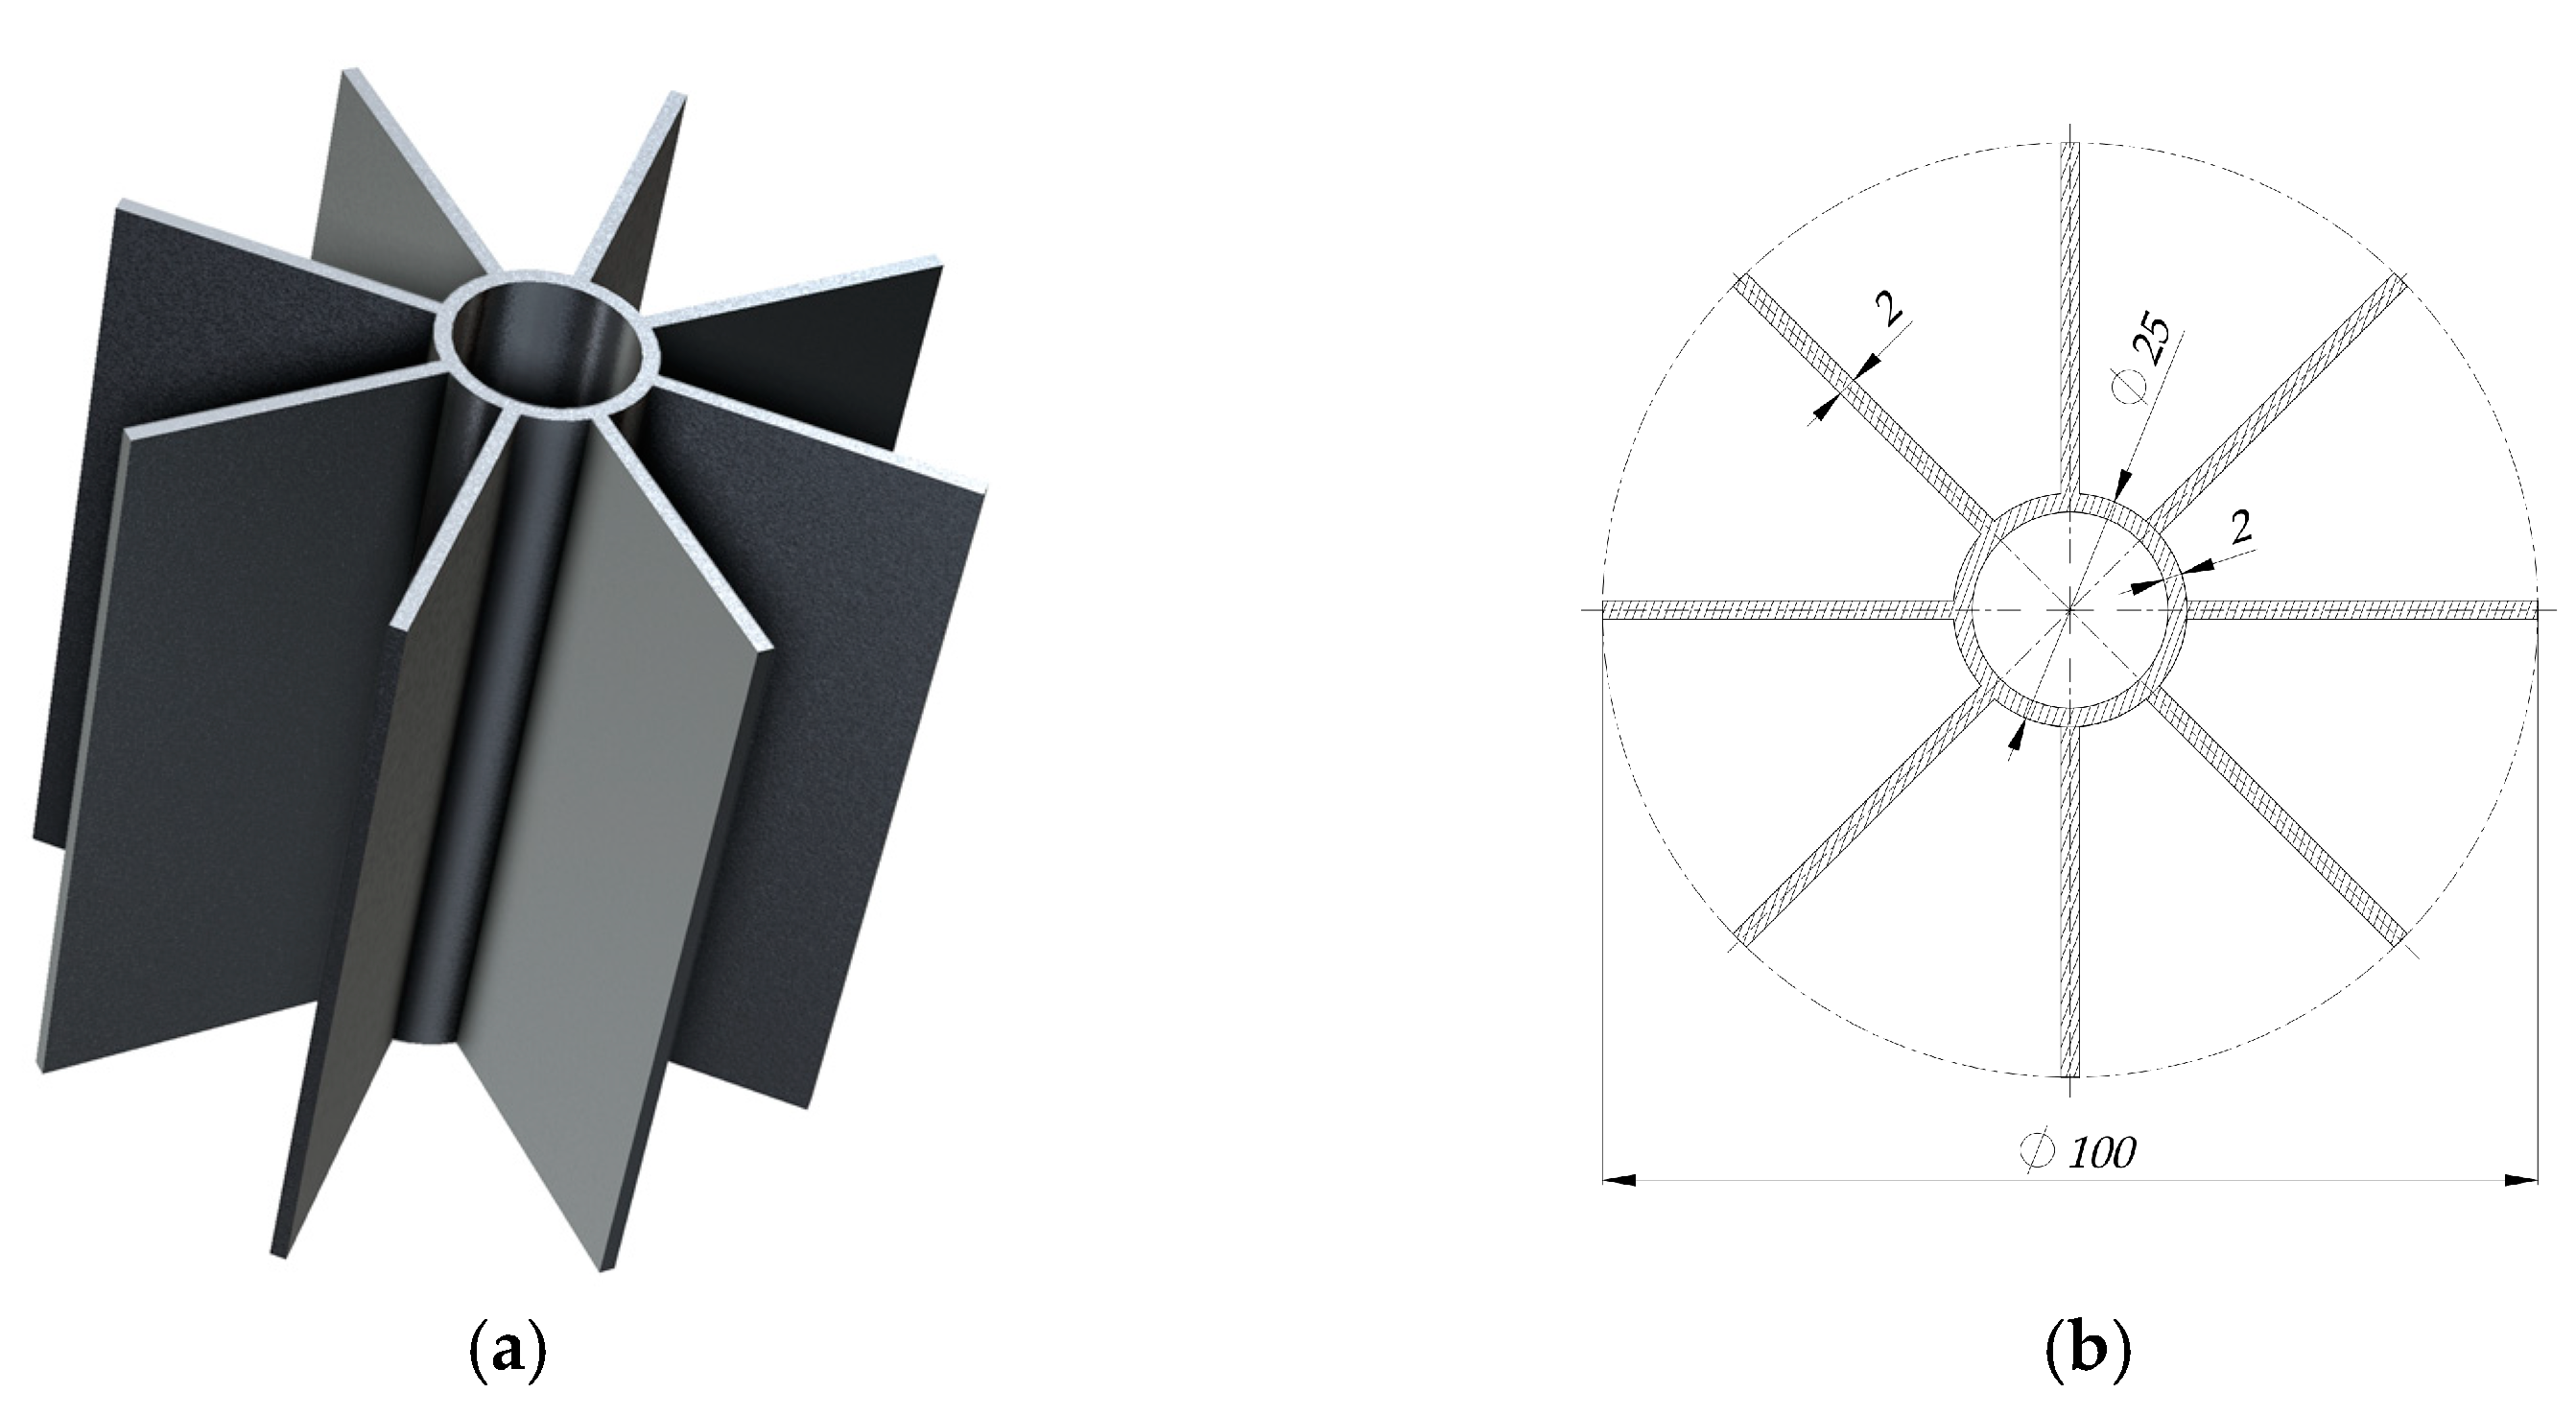
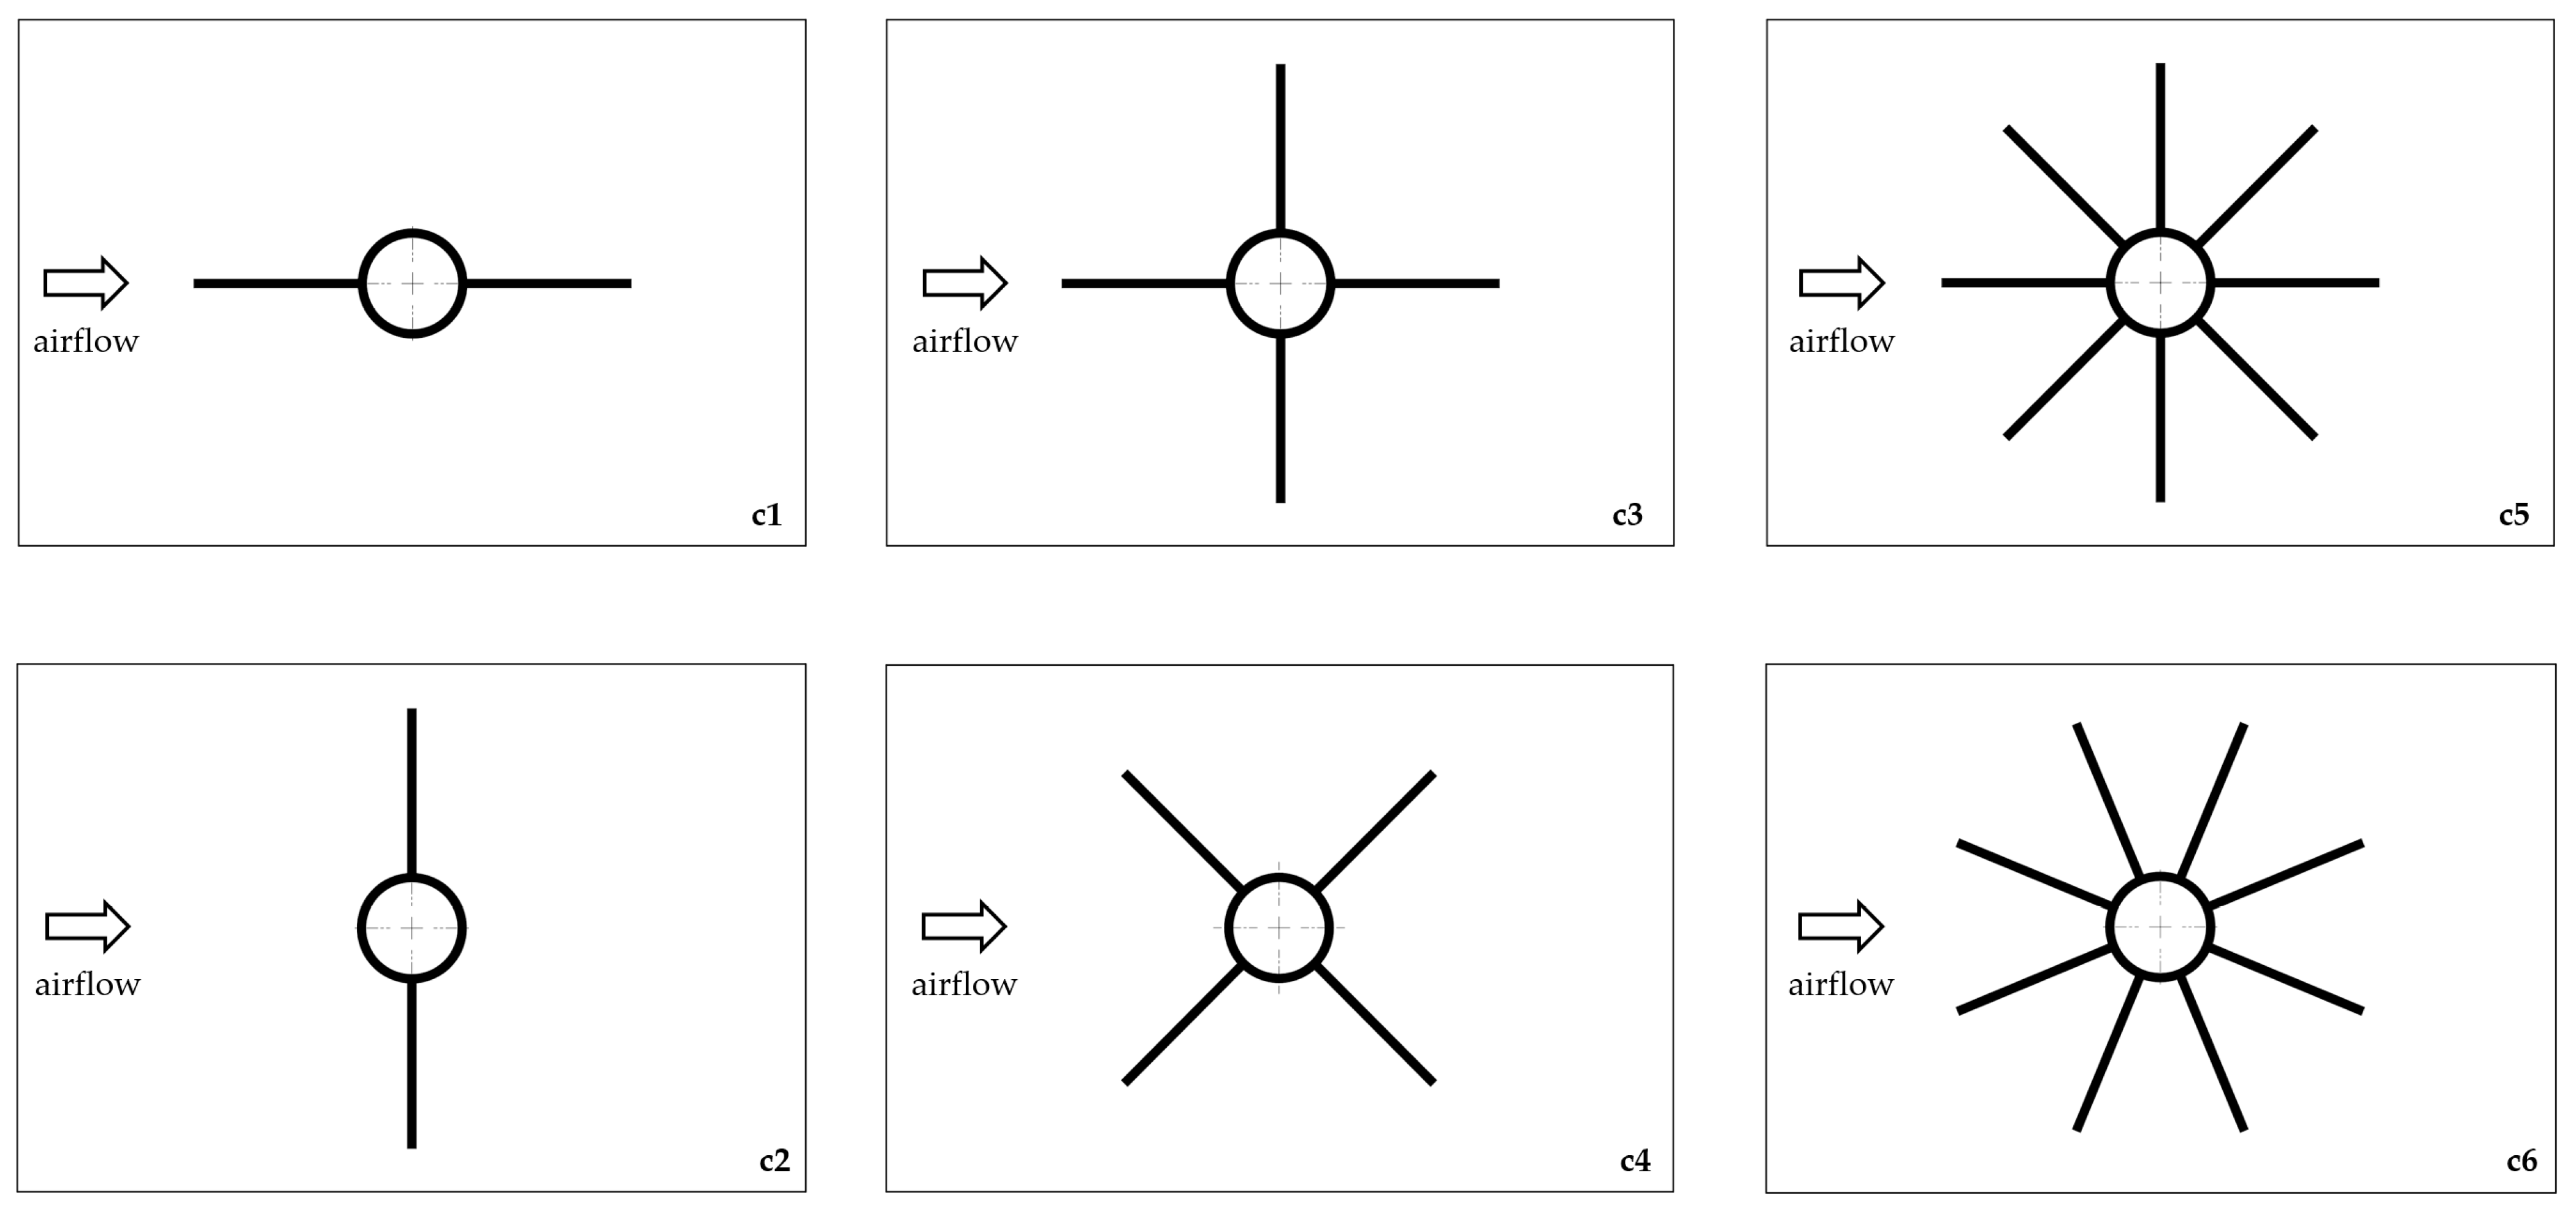
3.1. The Object of Study
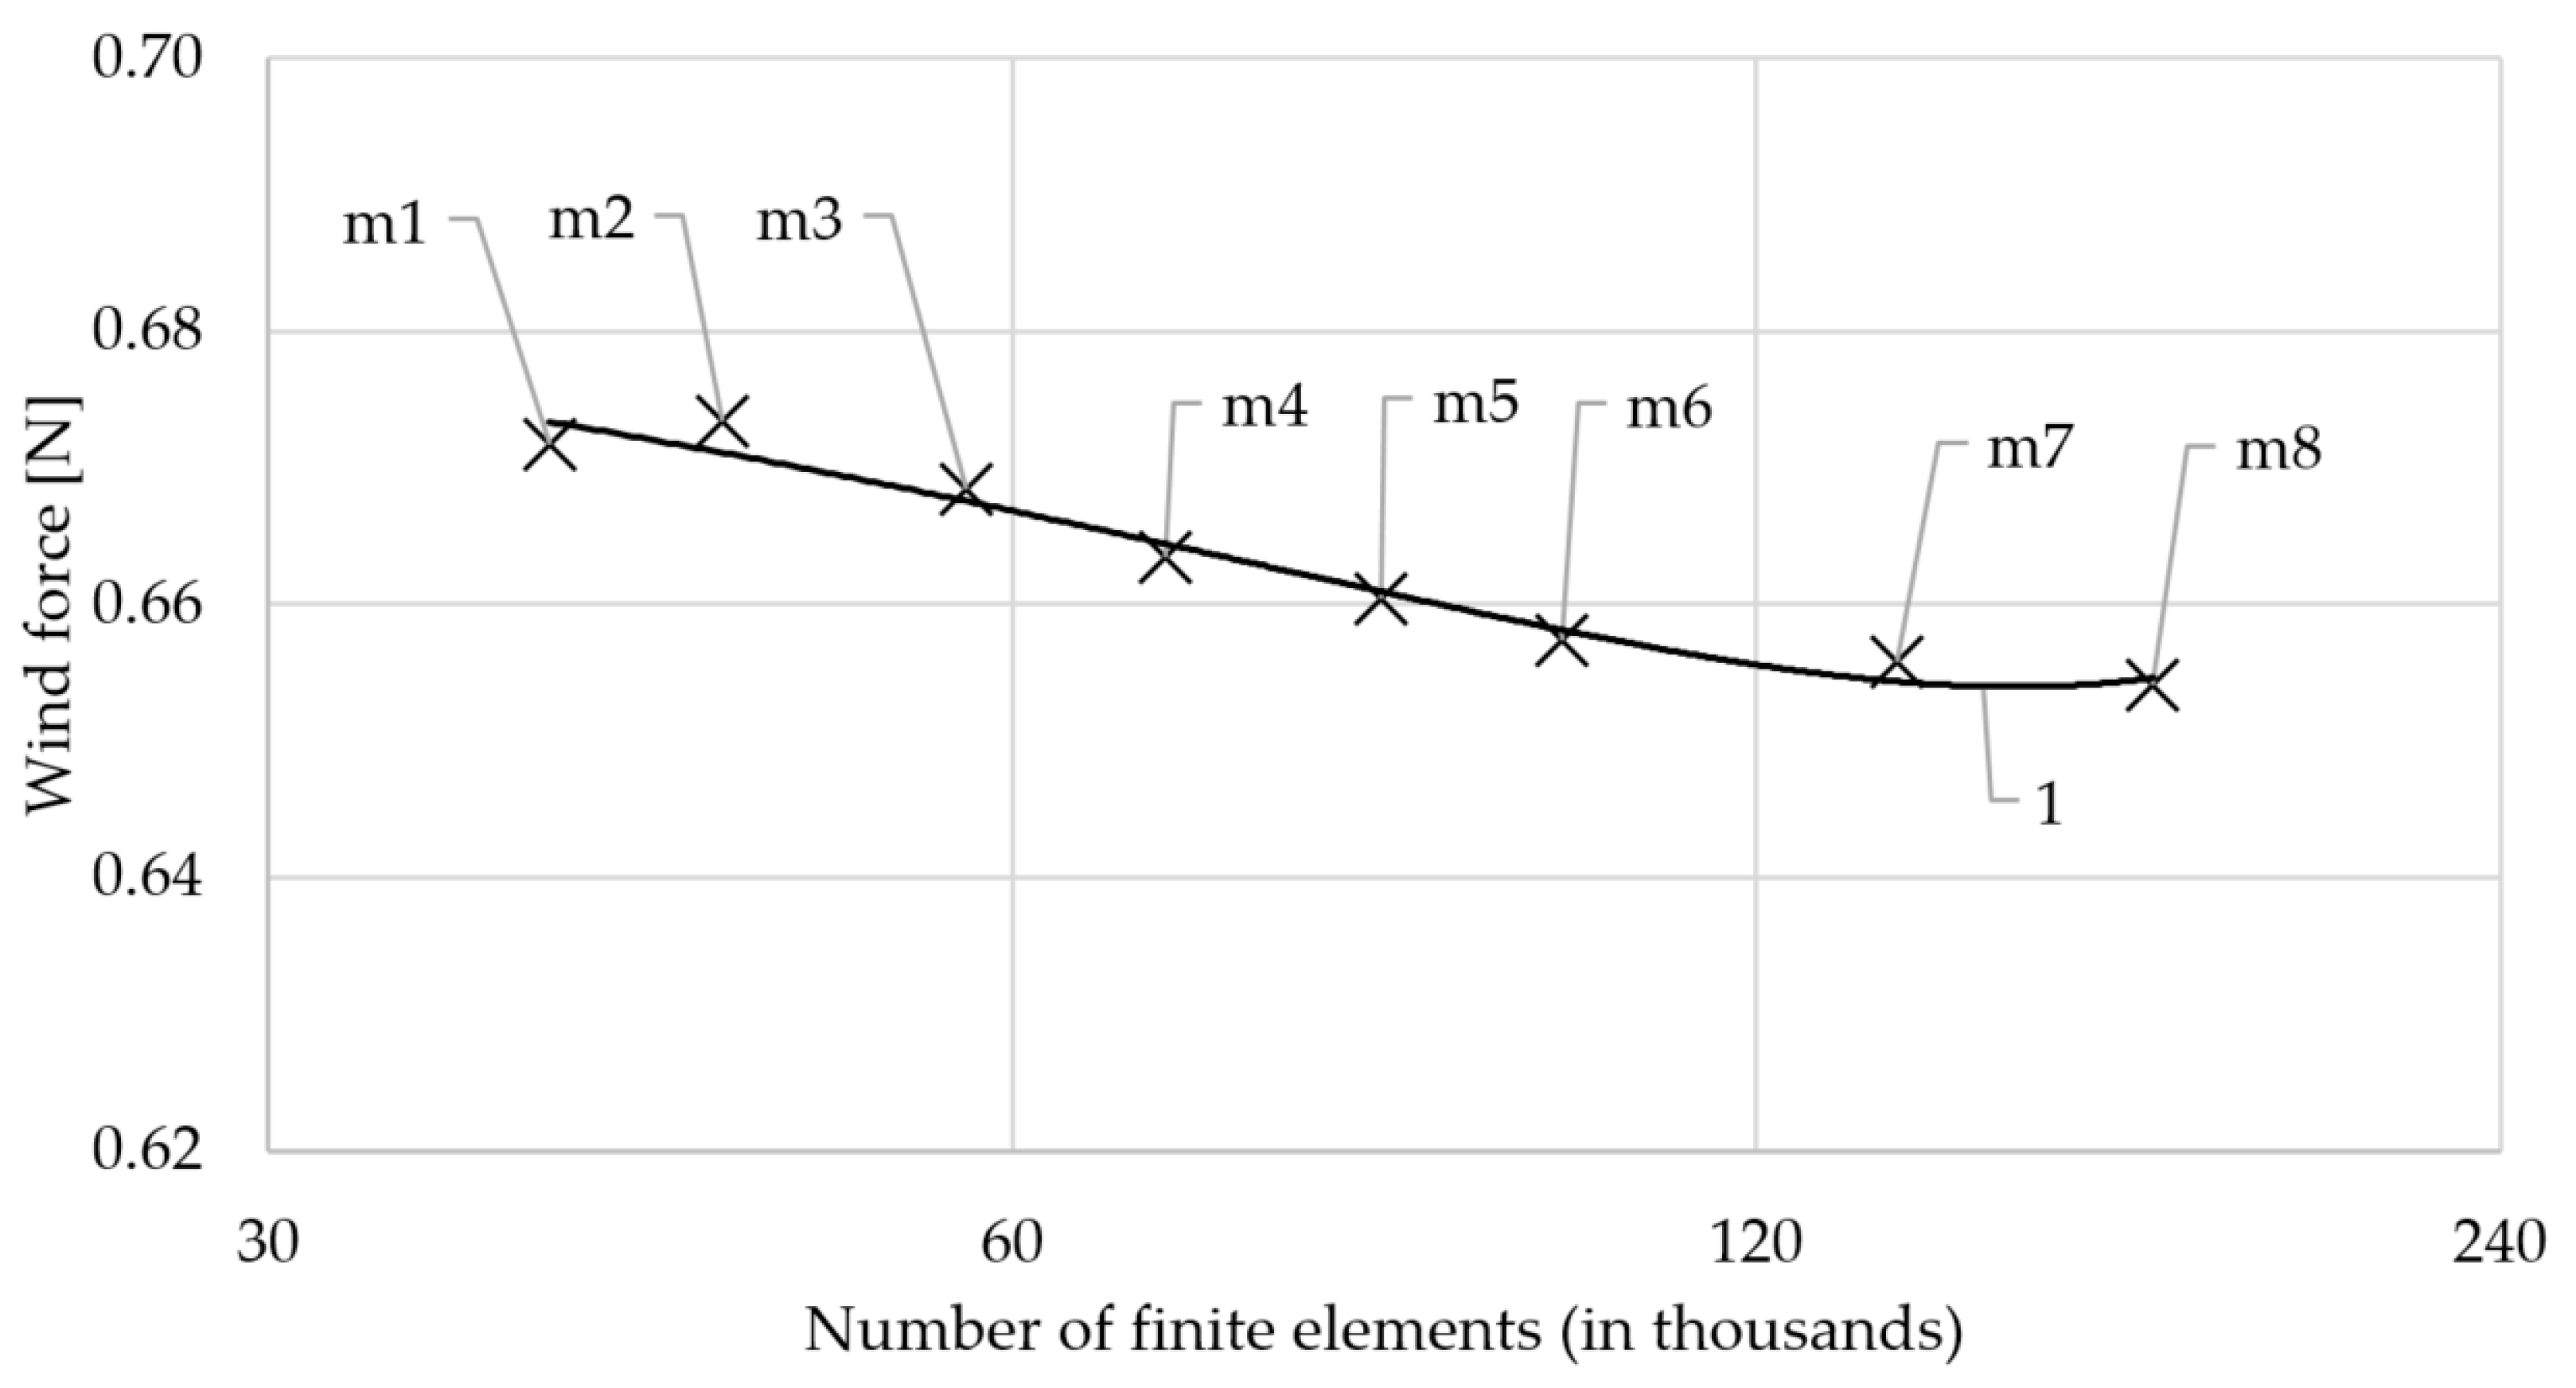
3.2. Discrete Models and Mesh Validation
3.3. Governing Equations
3.4. Turbulence Model
3.5. Analysis Assumptions
- The air velocity was constant at the inlet with the value vinlet = 10 m/s.
- Air density ρ = 1.225 kg/m3.
- Air viscosity μ = 1.7894 × 10⁻⁵ kg/ms.
- Reynolds number Re = 1.67 × 10³
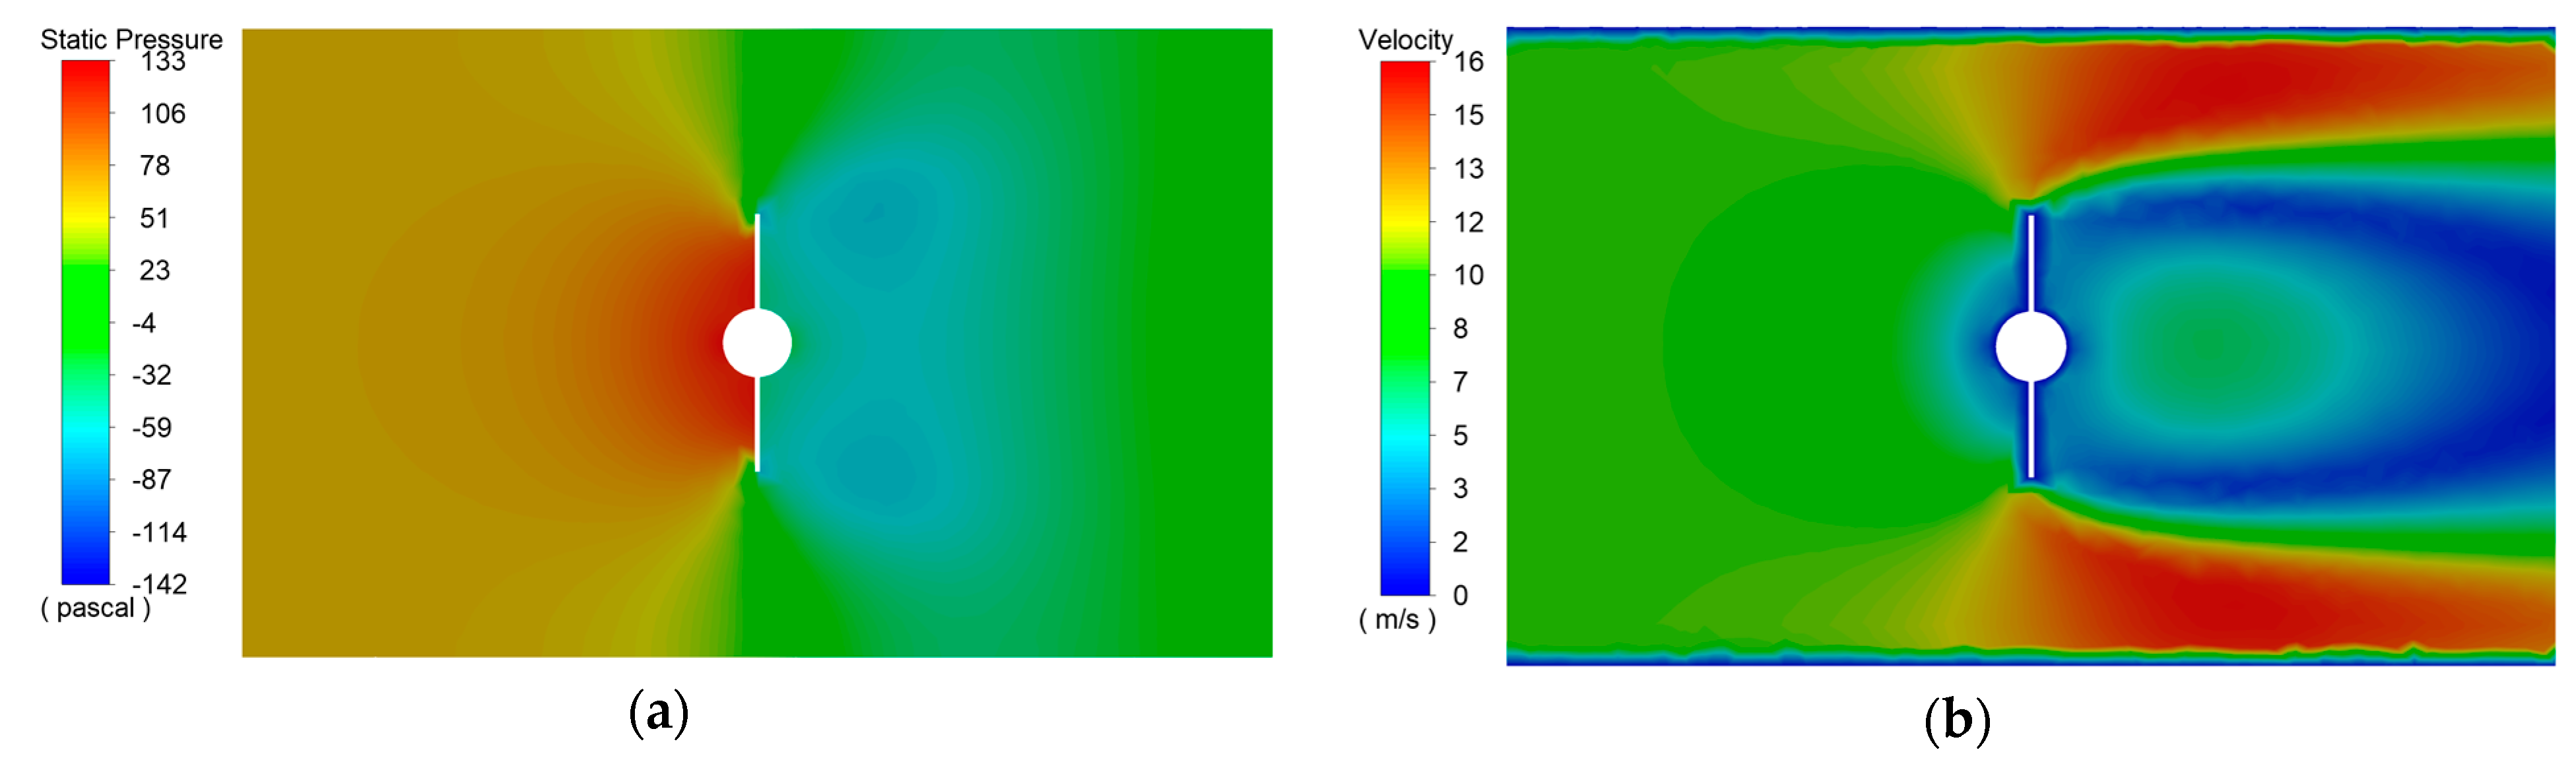
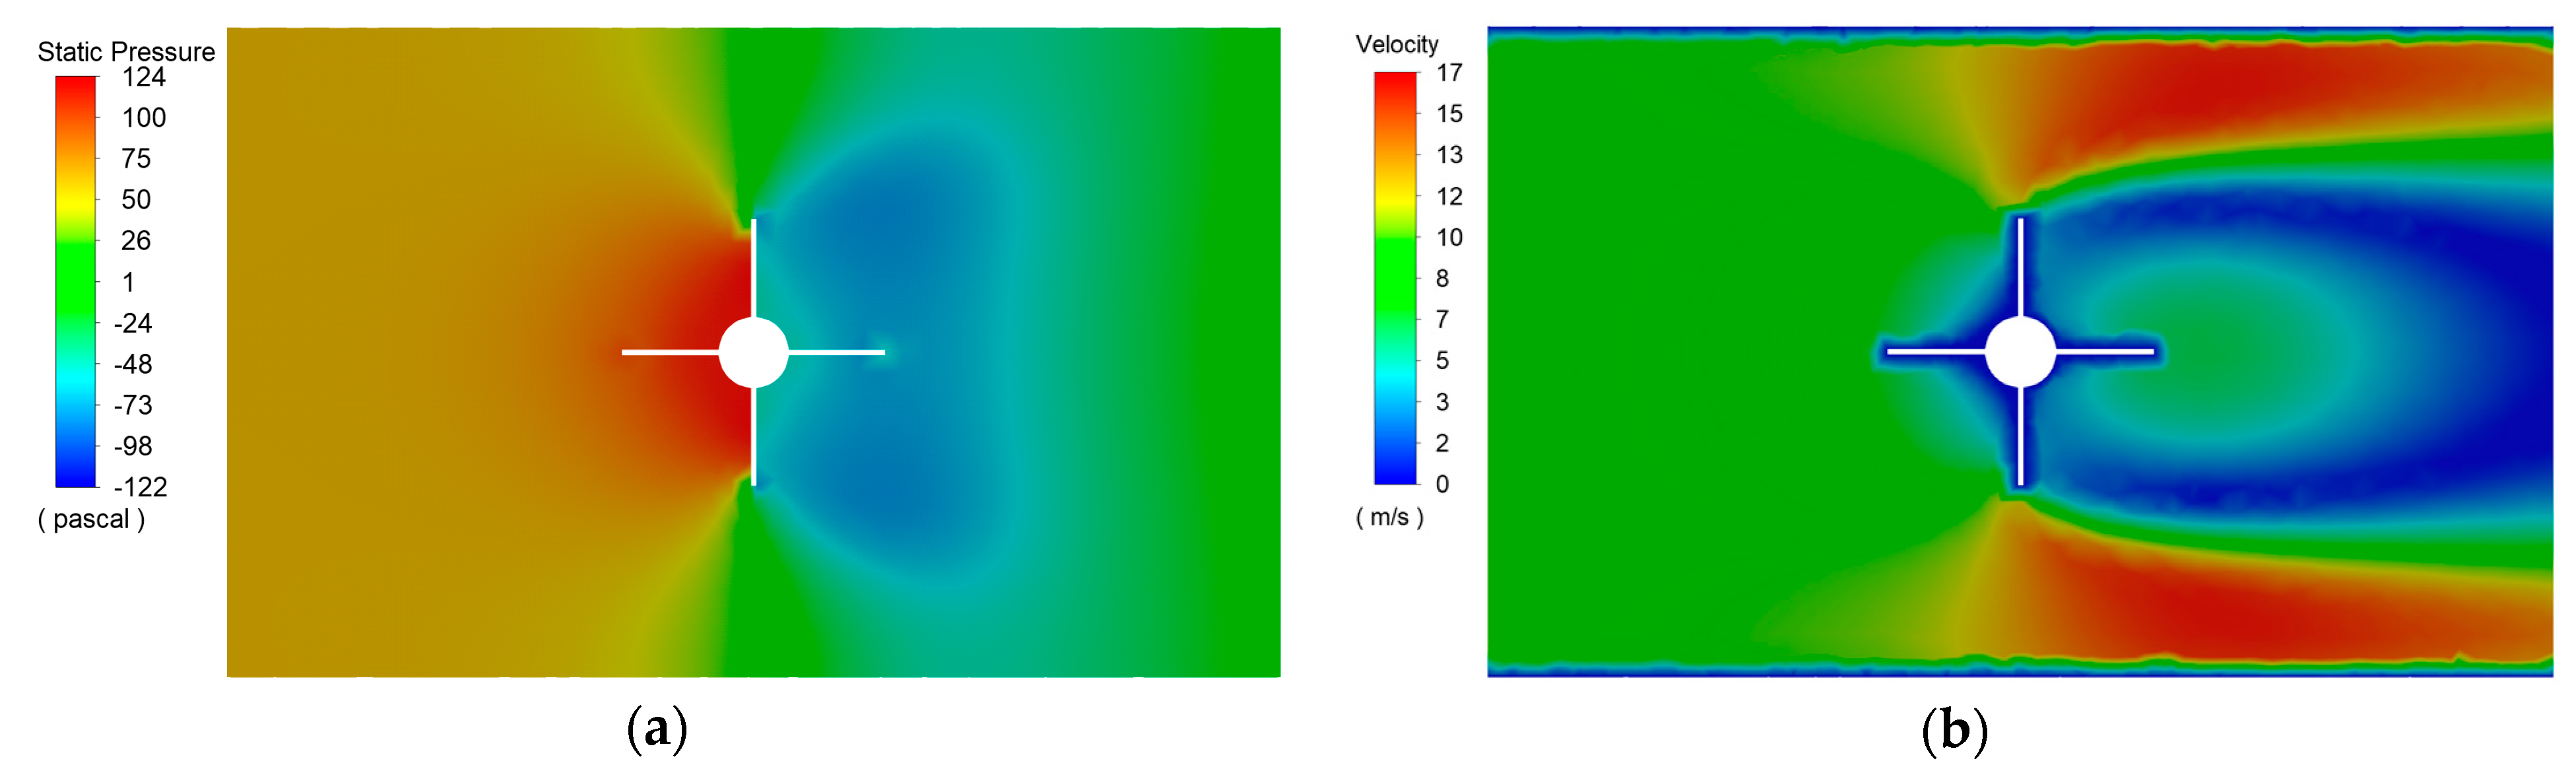
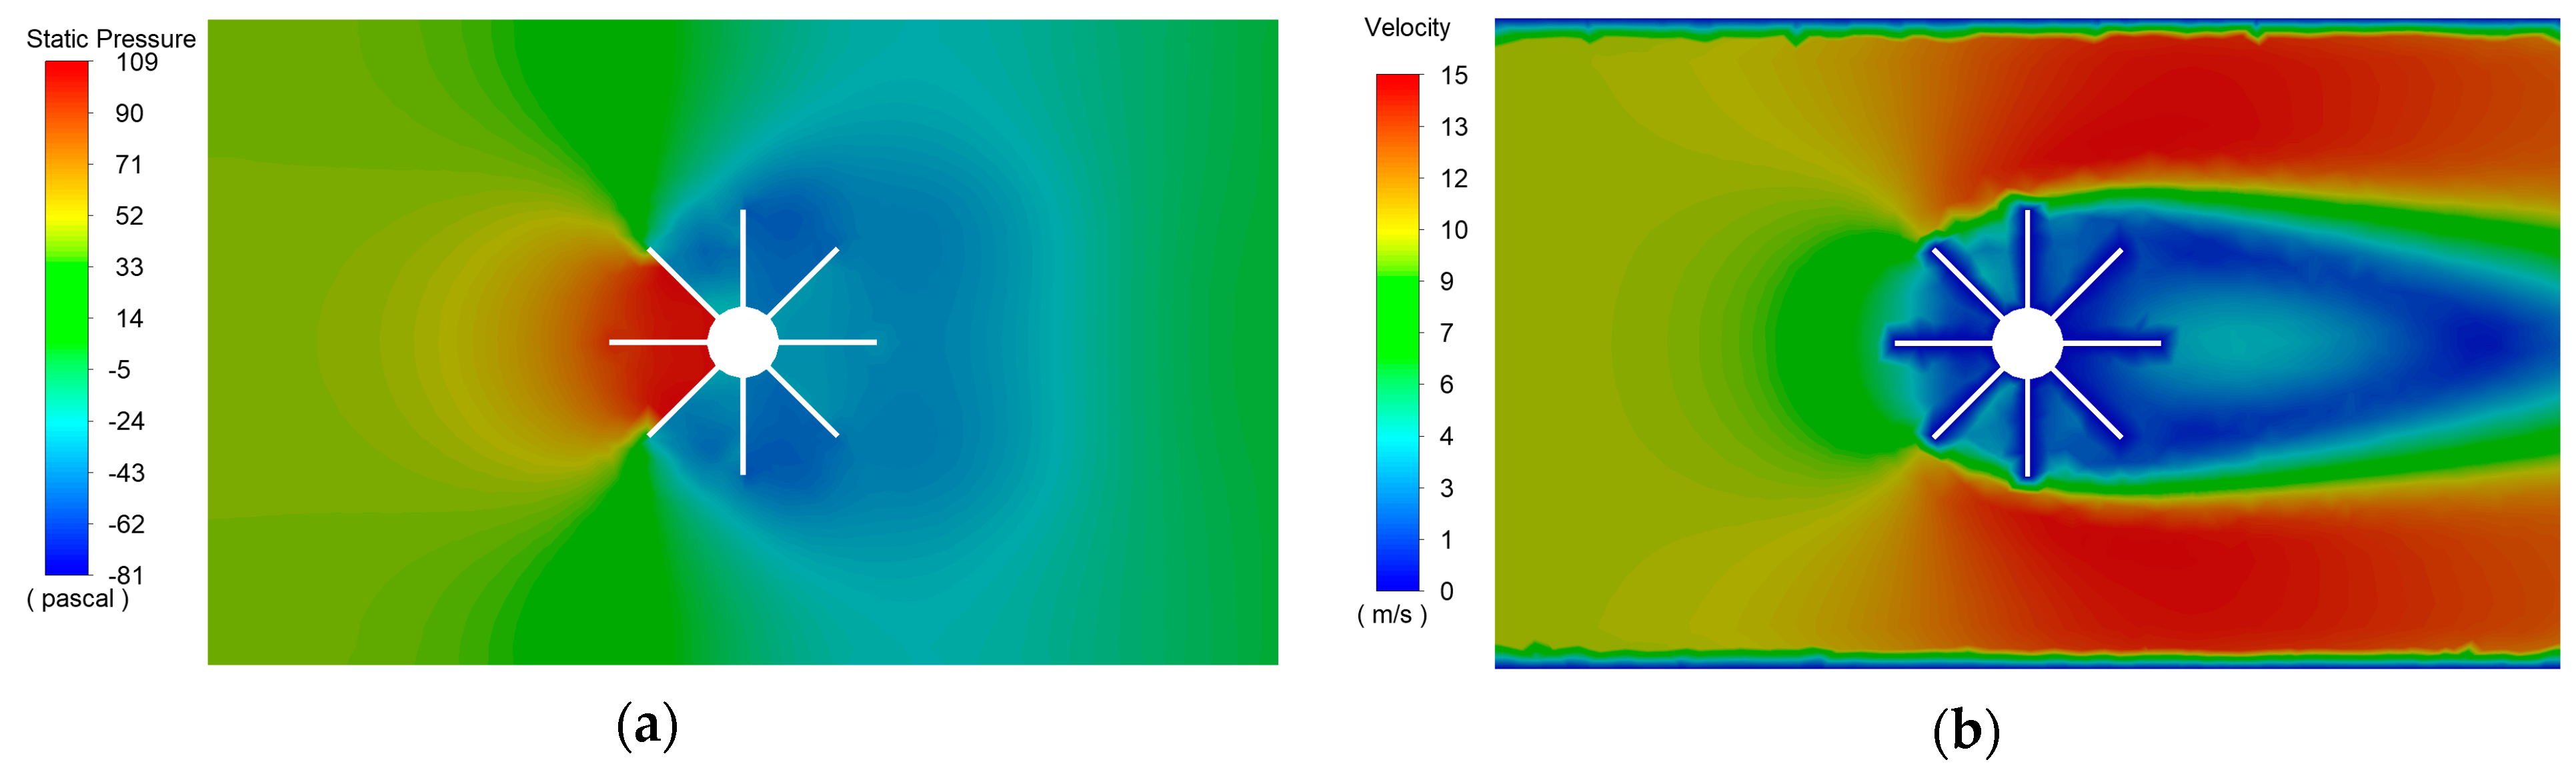
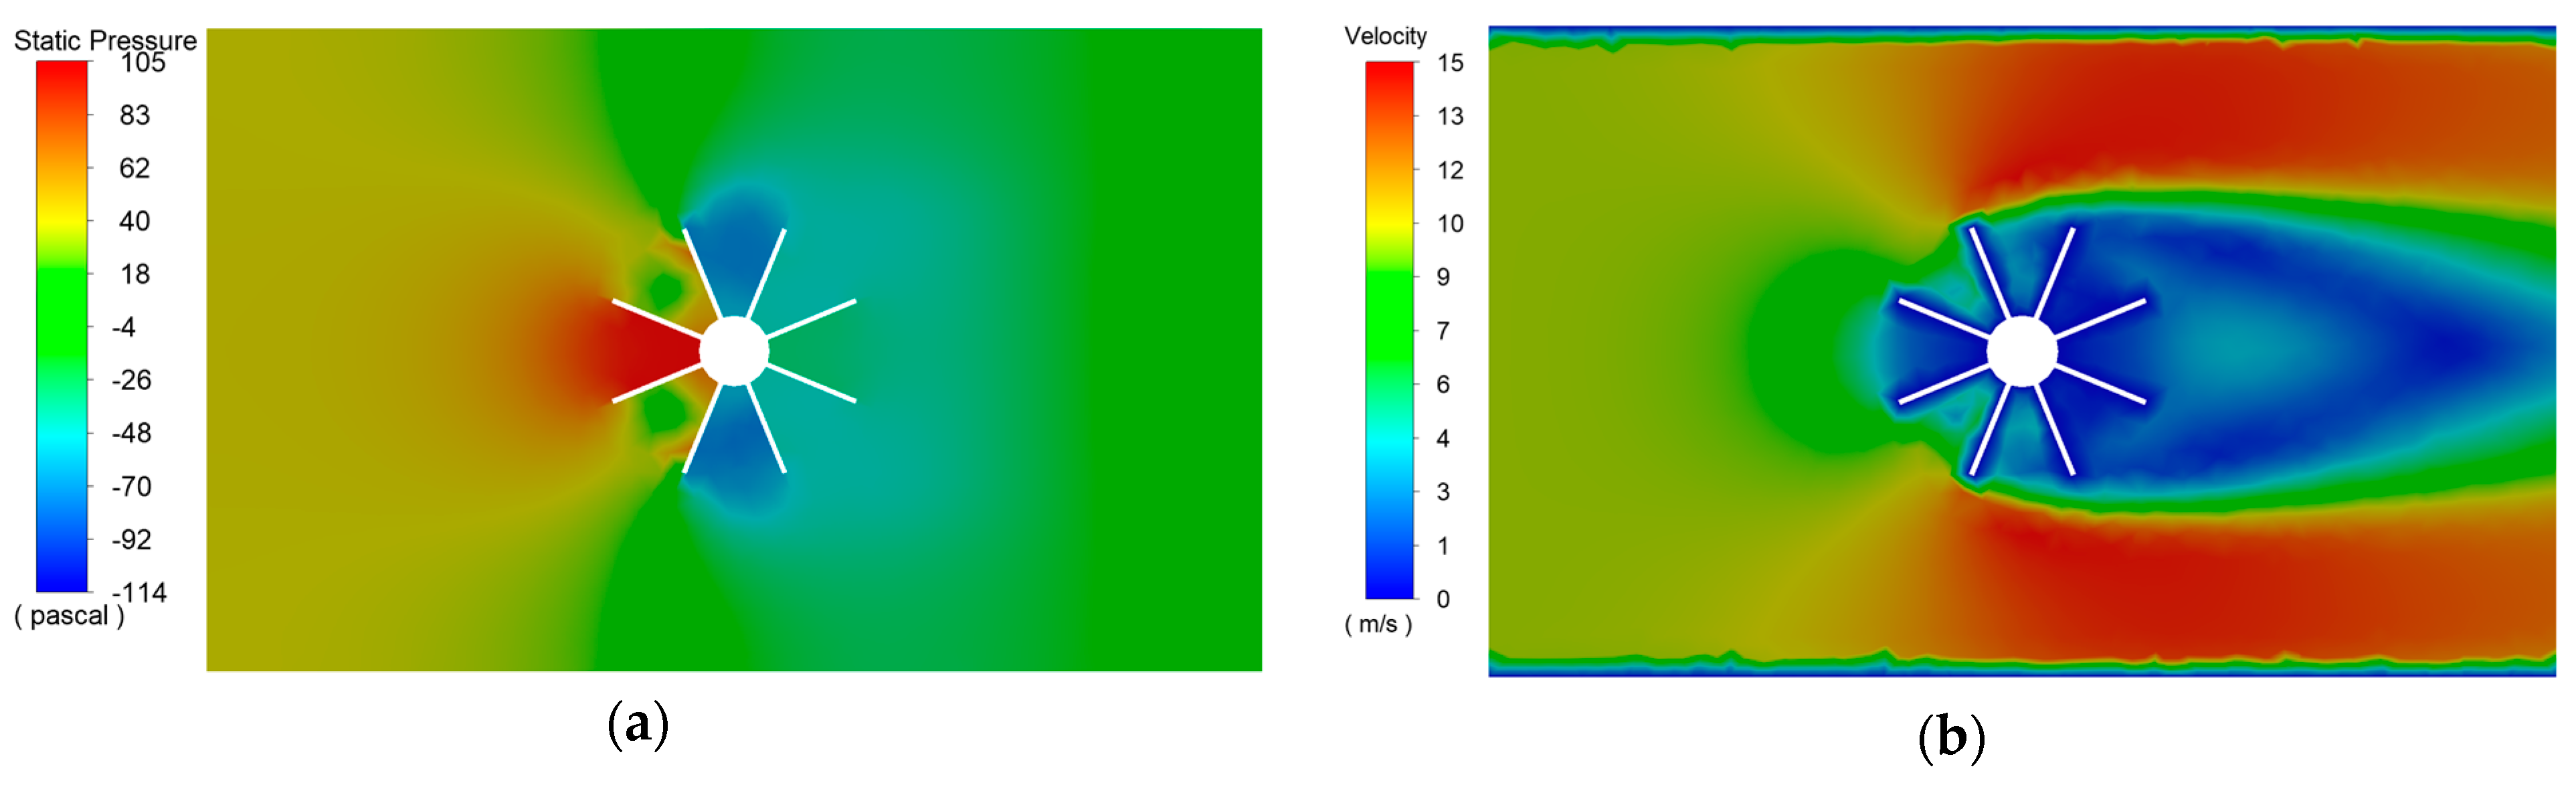
4. Results and Discussion
5. Conclusions
Author Contributions
Funding
Institutional Review Board Statement
Informed Consent Statement
Data Availability Statement
Conflicts of Interest
References
- Lisowski, E.; Czyżycki, W. Transport and storage of LNG in container tanks. J. KONES Powertrain Transp. 2011, 18, 193–201. [Google Scholar]
- Lisowski, E.; Czyżycki, W.; Łazarczyk, K. Using of polyamide in construction of supporting blocks of cryogenic tanks on example of LNG container. Arch. Foundry Eng. 2010, 10, 81–86. [Google Scholar]
- Lee, Y.; Na, J.; Lee, W.B. Robust design of ambient-air vaporizer based on time-series clustering. Comput. Chem. Eng. 2018, 118, 236–247. [Google Scholar] [CrossRef]
- Lisowski, F.; Lisowski, E. Influence of Fins Number and Frosting on Heat Transfer through Longitudinal Finned Tubes of LNG Ambient Air Vaporizers. Energies 2022, 15, 280. [Google Scholar] [CrossRef]
- Jeong, H.M.; Chung, H.S.; Lee, S.C.; Kong, T.W.; Yi, C.S. Optimum design of vaporizer fin with liquefied natural gas by numerical analysis. J. Mech. Sci. Technol. 2006, 20, 545–553. [Google Scholar] [CrossRef]
- Niezgoda-Żelasko, B.; Żelasko, J. Free and forced convection on the outer surface of vertical longitudinally finned tubes. Exp. Therm. Fluid Sci. 2014, 57, 145–156. [Google Scholar] [CrossRef]
- Kopeć, P.; Niezgoda-Żelasko, B. Optimisation of the Geometric Parameters of Longitudinally Finned Air Cooler Tubes Operating in Mixed Convection Conditions. Processes 2021, 9, 111. [Google Scholar] [CrossRef]
- Sun, B.; Wadnerkar, D.; Utikar, R.P.; Tade, M.; Kavanagh, N.; Faka, S.; Evans, G.M.; Pareek, V.K. Modeling of Cryogenic Liquefied Natural Gas Ambient Air. Ind. Eng. Chem. Res. 2018, 57, 9281–9291. [Google Scholar] [CrossRef]
- Wang, J.; Li, C.; Jia, W.; Wang, K. Study on the Heat Transfer Characteristics of an Ambient Air Vaporizer with Multi-Component Fluids. Processes 2022, 10, 851. [Google Scholar] [CrossRef]
- Jeong, H.M.; Lee, Y.H.; Ji, M.K.; Bae, K.Y.; Chung, H.S. Natural convection heat transfer estimation from a longitudinally finned vertical pipe using CFD. J. Mech. Sci. Technol. 2009, 23, 1517–1527. [Google Scholar] [CrossRef]
- Chen, S.; Yao, S.; Xie, F. Analysis of thermal conductivity of frost on cryogenic finned-tube vaporizer using fractal method. Energy Power Eng. 2013, 5, 109–115. [Google Scholar] [CrossRef]
- Kuang, Y.; Yi, C.; Wang, W. Numerical simulation of frosting behavior and its effect on a direct-contact ambient air vaporizer. J. Nat. Gas Sci. Eng. 2015, 27, 55–63. [Google Scholar] [CrossRef]
- Liu, S.; Jiao, W.; Wang, H. Three-dimensional numerical analysis of the coupled heat transfer performance of LNG ambient air vaporizer. Renew. Energy 2016, 87, 1105–1112. [Google Scholar] [CrossRef]
- Liu, S.; Jiao, W.; Ren, L.; Wang, H.; Zhang, P. Dynamic heat transfer analysis of liquefied natural gas ambient air vaporizer under frost conditions. Appl. Therm. Eng. 2017, 110, 999–1006. [Google Scholar] [CrossRef]
- Lee, Y.; Park, J.; Han, C. Modeling and Analysis of Frost Growth in Pilot-Scale Ambient Air Vaporizer. Ind. Eng. Chem. Res. 2018, 57, 5933–5943. [Google Scholar] [CrossRef]
- Liu, S.; Jiao, W.; Ren, L.; Tian, X. Thermal resistance analysis of cryogenic frosting and its effect on performance of LNG ambient air vaporizer. Renew. Energy 2020, 149, 917–927. [Google Scholar] [CrossRef]
- Lisowski, F.; Lisowski, E. Influence of Longitudinal Fin Tubes Arrangement in LNG Ambient Air Vaporizers on the Wind Load. Energies 2022, 15, 405. [Google Scholar] [CrossRef]
- CEN. Eurocode 1: Actions on Structures—Part 1–4: General Actions—Wind Actions; EN 1991-1-4; European Committee for Standardization: Brussels, Belgium, 2005. [Google Scholar]
- Matys, P.; Augustyn, M. Experimental determination of aerodynamic coefficients of different types of merry-go-round rotor blades. Tech. Trans. 2011, 3, 95–102. [Google Scholar]
- Wu, G.; Zhang, L.; Yang, K. Development and Validation of Aerodynamic Measurement on a Horizontal Axis Wind Turbine in the Field. Appl. Sci. 2019, 9, 482. [Google Scholar] [CrossRef] [Green Version]
- Zaghi, S.; Muscari, R.; Mascio, A.D. Assessment of blockage effects in wind tunnel testing of wind turbines. J. Wind. Eng. Ind. Aerodyn. 2016, 154, 1–9. [Google Scholar] [CrossRef] [Green Version]
- Augustyn, M. Wind Action on a Mobile Elevating Work Platform (MEWP) in Operational Conditions. Adv. Mater. Res. 2014, 1030–1032, 1375–1378. [Google Scholar] [CrossRef]
- Damjanović, D.; Kozak, D.; Holik, M. Analysis of wind influence to static stability of the eave framework. Teh. Vjesn. 2017, 24, 105–109. [Google Scholar] [CrossRef] [Green Version]
- Flaga, A.; Kłaput, R.; Augustyn, M. Wind tunnel tests of two free-standing lighting protection masts in different arrangements with surroundings roof objects and roof conditions. Eng. Struct. 2016, 124, 539–548. [Google Scholar] [CrossRef]
- Skeide, A.K.; Bardal, L.M.; Oggiano, L.; Hearst, R.J. The significant impact of ribs and small-scale roughness on cylinder drag crisis. J. Wind. Eng. Ind. Aerodyn. 2020, 202, 104192. [Google Scholar] [CrossRef]
- ANSYS. Intro to Governing Equations of Fluid Dynamics; ANSYS Inc.: Canonsburg, PA, USA, 2020; Available online: http://www.ansys.com (accessed on 19 October 2022).
- Launder, B.E.; Spalding, D.B. Lectures in Mathematical Models of Turbulence; Academic Press: London, UK, 1972. [Google Scholar]
- ANSYS Fluent Theory Guide, Release 2021 R2; ANSYS Inc.: Canonsburg, PA, USA, 2021.
- Blevins, R.D. Applied Fluid Dynamics Handbook; Krieger Publishing Company: Malabar, FL, USA, 2003. [Google Scholar]


| Case | Velocity [m/s] | Aref_exp [m2] | Aref_CFD [m2] | Fw_exp [N] | Fw_CFD [N] | cf_exp [–] | cf_CFD [–] | (cf_CFD-cf_exp) [–] | cf_error [%] |
|---|---|---|---|---|---|---|---|---|---|
| c1 | 11.74 | 0.004 | 0.010 | 0.241 | 0.035 | 0.65 | 0.16 | – | – |
| c2 | 9.67 | 0.013 | 0.009 | 1.009 | 0.856 | 1.40 | 1.49 | 0.10 | 7% |
| c3 | 9.63 | 0.013 | 0.010 | 1.000 | 0.824 | 1.39 | 1.45 | 0.06 | 4% |
| c4 | 10.54 | 0.010 | 0.007 | 0.813 | 0.674 | 1.23 | 1.37 | 0.14 | 10% |
| c5 | 10.05 | 0.013 | 0.003 | 0.764 | 0.642 | 0.98 | 1.04 | 0.06 | 6% |
| c6 | 10.03 | 0.012 | 0.010 | 0.762 | 0.656 | 1.05 | 1.14 | 0.10 | 8% |
Publisher’s Note: MDPI stays neutral with regard to jurisdictional claims in published maps and institutional affiliations. |
© 2022 by the authors. Licensee MDPI, Basel, Switzerland. This article is an open access article distributed under the terms and conditions of the Creative Commons Attribution (CC BY) license (https://creativecommons.org/licenses/by/4.0/).
Share and Cite
Lisowski, F.; Lisowski, E. Determination of Aerodynamic Drag Coefficients of Longitudinal Finned Tubes of LNG Ambient Air Vaporizers Using CFD and Experimental Methods. Appl. Sci. 2022, 12, 10865. https://doi.org/10.3390/app122110865
Lisowski F, Lisowski E. Determination of Aerodynamic Drag Coefficients of Longitudinal Finned Tubes of LNG Ambient Air Vaporizers Using CFD and Experimental Methods. Applied Sciences. 2022; 12(21):10865. https://doi.org/10.3390/app122110865
Chicago/Turabian StyleLisowski, Filip, and Edward Lisowski. 2022. "Determination of Aerodynamic Drag Coefficients of Longitudinal Finned Tubes of LNG Ambient Air Vaporizers Using CFD and Experimental Methods" Applied Sciences 12, no. 21: 10865. https://doi.org/10.3390/app122110865