Article

Analysis of the Financial Information Contained in the Texts of Current Reports: A Deep Learning Approach

AI Lab, Science and Technology Park in Opole, Technologiczna 2, 45-839 Opole, Poland
J. Risk Financial Manag. 2021, 14(12), 582; https://doi.org/10.3390/jrfm14120582
Submission received: 8 October 2021 / Revised: 28 November 2021 / Accepted: 1 December 2021 / Published: 3 December 2021
(This article belongs to the Section Financial Technology and Innovation)

Abstract

:
An important role in the fundamental analysis is played by the acquisition and analysis of various types of information about the company. Text documents are an increasingly important source of this information. Their accurate and quick analysis is an increasingly important challenge for financial analysts. Research in the area of financial text analysis is based on sentiment analysis. The deep neural networks and the stocks’ cumulative abnormal return are used in this article to analyze the sentiment of financial texts. The proposed approach, unlike those used so far, does not require manual labeling of data or the creation of dictionaries and is free from the subjective assessment of the researcher. Taking into account the broad context of words and their meaning in financial texts, it also eliminates the problem of ambiguity of words in various contexts. The sentiment of financial texts presented in this paper is directly related to the market reaction to the information contained in these texts. For texts belonging to one of the two classes (positive or negative) with the highest probability, the deep learning model gives predictions with a precision of 62% for the positive class and 55% for the negative class. The event study results show that the sentiment calculated under the proposed method can be successfully used to determine the probable direction of the market reaction to the information contained in current reports with a 1 percent significance level. The results can be used in market efficiency research, investment strategy development or support of investment analysts using fundamental analysis.

1. Introduction

An important role in the fundamental analysis is played by the acquisition and analysis of various types of information about the company. Text documents are an increasingly important source of this information. An example often cited in the literature is records from press conferences with the participation of companies’ management and optional attachments to periodic and current reports (Healy and Palepu 2013). In addition, text data sources that are popular among analysts include: annual and quarterly reports with accompanying press releases, press articles, analyst reports and social media (El-Haj et al. 2016). The list of scientific publications in the field of finance divided into categories based on the analyzed text data sources is presented in Appendix A Table A1. Research papers in this area mainly concern the American market.

1.1. Sentiment Analysis of Financial Texts—Current Approach and Methods

Research in the area of financial text analysis is based on sentiment analysis. Text sentiment is a concept taken from the natural language processing (NLP) literature. It is used to classify texts and reflects the author’s positive or negative orientation concerning some object. It can be defined as a measure of the extent to which the texts are positive or negative. In the case of stock exchange announcements, positive texts are understood as information that has a positive impact on the company’s value. Negative texts are those that contain information that has a negative impact on the company’s value. In some publications, in a similar sense to sentiment, the term “tone” of statement is used (Kearney and Liu 2014).
Two groups of methods are usually used to determine the measures of sentiment in financial texts—methods based on dictionaries and methods based on machine learning (ML). Dictionary methods are most often used by researchers (Table 1). They are often referred to in the literature as ‘bag-of-words’ models. Text documents are treated here as a set of words that are assigned by researchers, on the basis of predefined dictionaries, to various categories (e.g., negative category and positive category). Determining the sentiment of a text based on this method involves the calculation of an integrated indicator, usually based on the number of words belonging to each category. Formula (1) represents an example sentiment indicator.
S E N = W O R D S P O S W O R D S N E G W O R D S A L L
where:
  • S E N —sentiment indicator;
  • W O R D S P O S —number of positive words in the text;
  • W O R D S N E G —number of negative words in the text;
  • W O R D S A L L —sum of the number of positive and negative words (Henry and Leone 2009).
The process of text sentiment analysis using the dictionary method can be divided into the following stages:
  • Selecting the type of financial texts to be studied;
  • Acquisition and preparation of text dataset;
  • Dictionary selection;
  • Design of the sentiment indicator;
  • Determining the sentiment based on the value of the indicator.
Methods using ML models are less popular in the financial literature, but their importance is growing (Li 2010; Aydogdu et al. 2019). Determining the sentiment within this group of methods has the following course:
  • Selecting the type of financial texts to be studied;
  • Preparation of training and test data—obtaining a large amount of text data of a given type and labeling them, i.e., manually assigning the sentiment value;
  • Selection and preparation of the ML model;
  • Training the model, i.e., calculating its parameters;
  • Testing the model on a predefined dataset;
  • Determining sentiment using a trained model.
The sentiment determined by the methods described above can then be applied to further research, such as: studying the effect of sentiment on market value and the volatility of stocks, future income, profits or cash flow, testing the informational value beyond the numerical information accompanying the text, testing the relationship sentiment of text information with the shortcomings of financial statements, a process which is known as event study (ES).

1.1.1. Main Drawbacks of Dictionary-Based and ML Methods

Both the dictionary and ML methods described above have some drawbacks. The dictionary methods omit the meaning of words and their wider and varied context, which is sometimes crucial for understanding the tone of given sentences. This largely limits the proper analysis of text documents. In addition, the dictionary approach encounters the problem of ambiguity of various words, especially within the context related to the issue under study. For example, the word “growth” may have a positive meaning in terms of the company’s profit, but a negative meaning in terms of the number of complaints. As in the case of dictionary methods and in the case of some methods in the area of ML used in financial literature, the mutual contextual connections between words in sentences are not taken into account. Naive Bayesian classifiers of the text are directly based on the “naive” assumption about the independence between the probabilities of the occurrence of particular words in sentences. The use of deep neural networks such as long short—term memory (LSTM) partially eliminates the problems resulting from taking into account the wider context of words in the sentence. However, ML methods require a lot of work to label tens of thousands of text data.
Both groups of methods in determining sentiment are largely based on the subjective opinion of the researcher. In the case of dictionary methods, when constructing dictionaries and assigning words to individual categories, and in the case of ML during labeling training datasets, the researcher or his team, based on their knowledge and experience, determines the degree of positive or negative tone of the text.

1.2. New Approach to Analyse Sentiment from Financial Text Data Based on Deep Learning (DL)

The main purpose of this work is to introduce a method of sentiment analysis of financial texts, which does not have the drawbacks mentioned in Section 1.1.1. This method should have the following features:
  • Elimination of the manual task of developing dictionaries and labeling data;
  • Independence from the subjective assessment of the researcher;
  • Takes into account the broad context of words and their meaning in financial texts.
The implementation of a solution that meets the abovementioned requirements can have a significant impact on many areas related to the analysis of financial texts, both in research and real-world applications. Manual data labeling is time consuming and costly. Automation of this process will be particularly important for practical applications. In our opinion, objectification in the preparation of research data is of key importance for the quality of research in this area. On the other hand, the use of a method that takes into account the broad context of words in a sentence will allow the extraction of information of a more subtle nature from texts than those obtained using the ‘bag-of-words’ type of methods. The contextual approach is more akin to man-made text analysis. Consequently, the output from the model may be more useful in assisting financial analysts, especially when it comes to quickly processing a stream of financial texts.
In this paper an alternative approach to the sentiment analysis of financial texts is proposed that meets the requirements outlined above. It is presented with the example of texts from press releases concerning the financial results of companies listed on American stock exchanges. These texts are linked to their impact on the cumulative abnormal return (CAR). The proposed solution does not require manual labeling and the creation of dictionaries, is free from the subjective assessment of the researcher, takes into account the broad context of words and their meaning in financial texts and eliminates the problem of ambiguity of words in various contexts. It is based on the fact that the sentiment of press releases about financial performance influences the market response as measured by the cumulative abnormal return (CAR). This influence has been proven in many scientific publications (Table 1), so it is assumed that CAR can be used to automatically label text data. In this sense, a positive CAR value means that the text of the related press release has a positive sentiment, and a negative value indicates a negative sentiment. This type of labeling requires significantly less work and is objective. The positive or negative sentiment in this case does not have to be the same as the one that would be subjectively marked by the researcher. A large set of text data, labeled in this way, is then used to train a deep neural networks model—bidirectional encoder representations from transformers (BERT). This model takes into account not only the presence of words in texts, but also their place in sentences and the broad context. The sentiment determination process presented here follows the same course as that indicated above for the other ML models, with the text data not being labeled manually but automatically using a predefined CAR-based measure.
The model was evaluated using measures commonly used in DL, i.e., accuracy and precision. In the case of precision, the focus was on those outputs for which the model indicated the highest probability of belonging to a given class (positive or negative). This approach may be useful especially in real-world applications, where the detection of very positive or very negative texts is more important than the precision of determining the sentiments of the entire population of financial texts. The baseline model was also introduced for comparison with the BERT model. In order to show the potential of the model presented in the article in real-world applications and research, an event study was introduced.
For the texts included in current reports, the proposed BERT model achieved 62.38% precision in predicting sentiment for the POSITIVE class and 55 for NEGATIVE class. The ES results show that the sentiment calculated with the proposed method can be successfully used to determine the probable direction of the market reaction to the information contained in current reports on 1% significance level.

2. Materials and Methods

2.1. Data Sources and Transformation of Data into a Form Suitable for the ML Model

U.S. public companies must publish the information required by law in electronic form through the electronic data gathering, analysis and retrieval system (EDGAR) operated by SEC. The EDGAR system processes approximately 3000 electronic publications per day and makes 3 petabytes of data publicly available per year. Access to the public database of the EDGAR system is unlimited and free of charge. Pursuant to the provisions of the American securities law of 1934 (Securities Exchange Act of 1934 section 13 and 15 (d)), companies are also required, in addition to annual reports (form 10-K) and quarterly reports (form 10-Q), to publish current reports (form 8-K). Current reports are submitted in case of events or circumstances that the shareholders should know about. The form 8-K contain 9 sections with a total of 31 items such as: entry into a material definitive agreement, declaration of bankruptcy or receivership, results of operations and financial condition, unregistered sales of equity securities and departure of directors or certain officers and others. Section 9 contains certain financial statements and lists the exhibits that it has filed as part of the 8-K form. In most cases, companies have 4 days from the occurrence of the event to fulfil their obligation to publish the current report. The classification of the scope of information that should be disclosed in the 8-K filings when it occurs is presented in Table 2.
Often, companies announce their quarterly and annual results at conference calls immediately before or simultaneously with the publication of the report. In such cases, the content presented at the conference call and the summary of the financial reports constitute an appendix marked as ‘EXHIBIT 99’ on the 8-K form. This exhibit may also contain additional information that is not disclosed under other types of exhibits.
The text research data in this publication comes from the ‘EXHIBIT 99’ appendices of the 8-K current reports published by the companies included in the S&P 500 index. All reports were published in the EDGAR system. If a given report had an EXHIBIT 99 attachment, its text content as well as the date and exact time of publication were extracted. Text data was “cleaned”, i.e., they were deprived of irrelevant data, e.g., contact information, redundant spaces, references to the attachments, etc. Moreover, due to the available computing power, the texts were shortened to the initial 256 words. The market data comes from the INTRINIO service and includes adjusted (after taking into account dividends, pay outs and splits) daily stocks prices of the companies covered by the study and the value of the S&P 500 index. Both textual and financial data cover the period from 2 June 2014 to 31 December 2019. For each current report CAR was calculated, defined as the difference between the return on shares minus the return on the S&P 500 index over a 9-day period constituting the so-called “event window”, according to Formula (2). The event window starts 4 days before the report publication date and ends 4 days after that date. When determining the width of the window, the values adopted in other publications, ranging from 2 to 59 days, were taken into account (Table 1). It also takes into account the fact that in most cases companies have 4 days from the occurrence of the event to fulfil the obligation to publish the current 8-K report.
C A R t i = R t i I R t
where:
  • t—event window width of 9 days (period starting 4 days before the publication of the report and ending 4 days after that date);
  • C A R t i —stock i’ cumulative abnormal return at period t;
  • R t i —stock i’ return at period t;
  • I R t —S&P 500 index return at period t.
It is common practice to use a stock index return as the benchmark for calculating CAR. This is the so-called naive model. Other benchmarks may be, for example, calculated by: Sharpe’s single-index model (1963), multiple factor models or the capital asset pricing model (CAPM) (Kliger and Gurevich 2014).
The CAR calculated according to Formula (2) were used to assign the impact of the publication on share prices to two classes marked with the appropriate labels: POSITIVE for CAR ≥ 0 and NEGATIVE for CAR < 0. Finally, the data set consisted of 6435 samples including the text of the appendix ‘EXHIBIT 99’ of the 8-K current report and a class label indicating the category of the share price change. An illustrative fragment of the training set is presented in Table 3.
The dataset was randomly split into two subsets: A training dataset of 5148 samples (80%) and a validation dataset of 1287 samples (20%). The data cover the period from 2 June 2014 to 31 December 2018. A set of test data, which is not involved in the model training process, was also prepared. It includes 1831 samples from 1 January 2019 to 31 December 2019 and will be used for the final verification of the model and event study.
Then, the data was transformed into a form that can be loaded into the model. This process includes, among other things, the “tokenization” of texts, which transforms words into numbers. Finally, the data is converted to files in the TFRecord binary format used by the TensorFlow library created with the Python programming language.

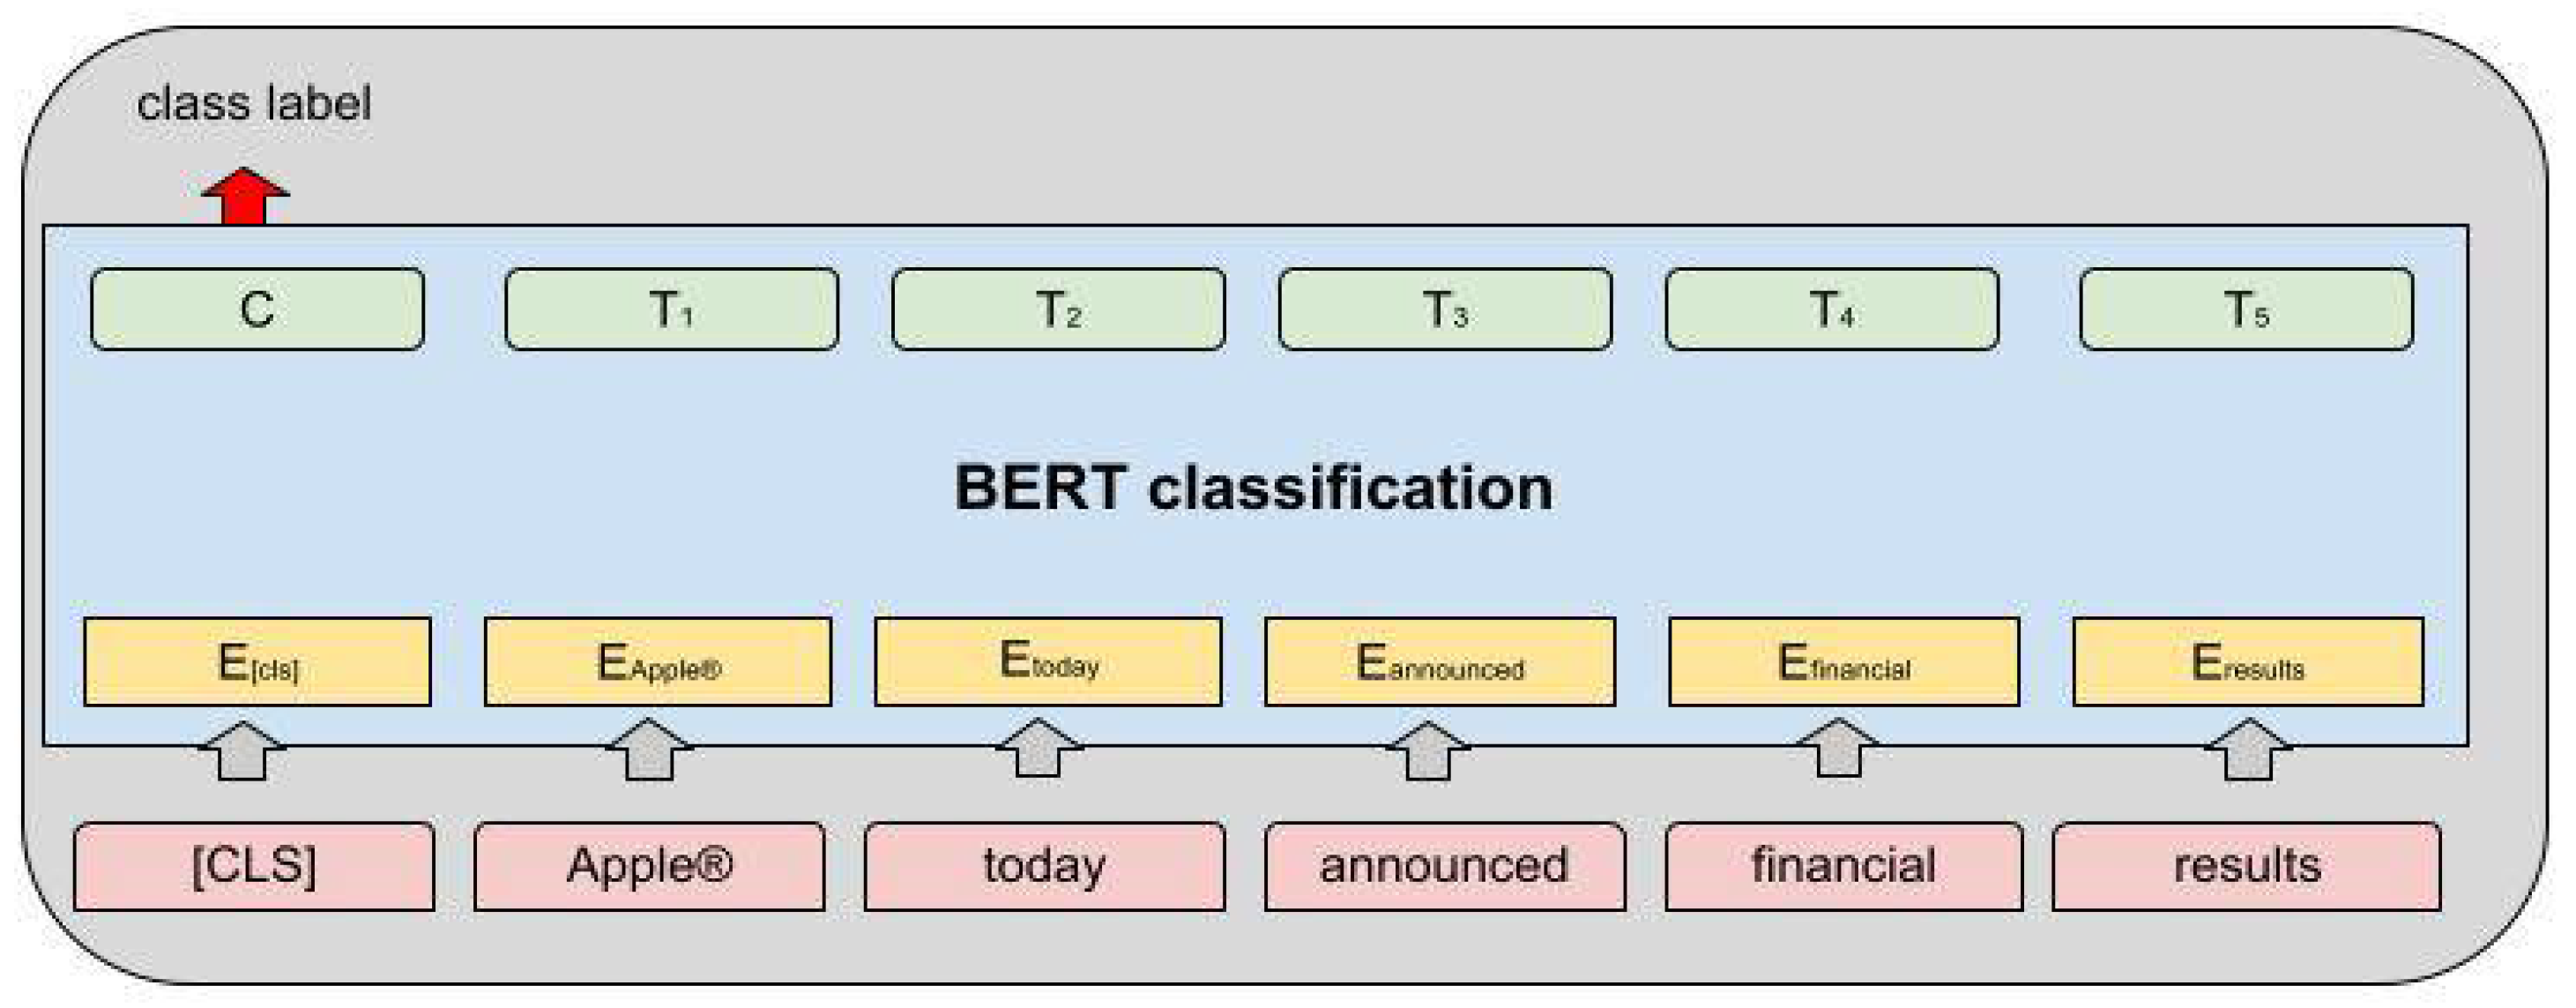
2.2. Basic Features of the BERT Model Used for Sentiment Analysis

BERT (Devlin et al. 2019) is a natural language processing model built of deep neural networks proposed by the Google AI Language team in 2019. It performs exceptionally well in “understanding” natural language compared to other general-purpose NLP models. It is the first unsupervised and bidirectional NLP model. No supervision means there is no need to use labeled data to train it. The model’s bidirectional nature means that the vector representation of a word it generates depends on other words in the sentence, both before and after the given word. The built-in attention mechanism is a very important element of the model. Thanks to this, it takes into account the broad context of the words in the text. Google has released both the model’s source code and pre-trained models. A text data corpus from Wikipedia and BookCorpus was used to train them. The BERT model can be easily adapted to many types of NLP tasks, such as classifying texts or questions and answering. The adaptation process consists of fine-tuning the weights of the model during additional training using the labeled data. At the training stage the model (pre-trained) acquires ‘knowledge’ about the structure and relations within a given natural language and at the fine-tuning stage, it gains a specific domain related to a given task. Models provided by Google can process sentences containing a maximum of 512 words. In this paper, the sentence length is limited to 256 words. The diagram of the model’s operation is presented in Figure 1. The input data in the form of words is marked in pink. Words are converted into 768 dimensional vectors. Then, vectors representing the position of the word in the sentence are added to them (yellow). The outputs (green) are new representations of words. The first vector of the model marked as [CLS] is used to perform classification tasks. The model used in this study has 109,483,778 trainable parameters. A full description of the model can be found in (Devlin et al. 2019).
In the classification task, the output data from the BERT model is a vector of numerical values with a dimension consistent with the number of classes. Then, these values are transformed using the softmax function (also known as the normalized exponential function) into vector with probabilities of belonging to particular classes.
The attention mechanism is a key element that distinguishes the BERT model from other methods commonly used to analyze financial texts. This mechanism can be represented in the form of Formula (3).
a t t e n t i o n ( Q , K , V ) = s o f t m a x ( Q K T d k ) V
where:
  • Q—query matrix;
  • K—key matrix;
  • V—value matrix;
  • d k —queries and keys of dimension.
The intuition behind this equation is as follows: the value of the output vector (V) representing a certain word in a sentence is formed, taking into account the value of other words in the sentence (words standing in front and behind). This makes the new representation of the word embedded in a certain context. Thanks to the contextual approach, the problem of ambiguity of words in a sentence disappears, among other things. Ambiguity occurs when words have different meanings in different sentences depending on the context. For example, the word ‘peer’ has different meanings in the phrase ‘The article was published in a peer-reviewed journal’ than in the sentence ‘I really want to peer inside the bag she is carrying’. The attention mechanism built into the BERT model handles this type of ambiguity very well. This type of contextual ‘understanding’ is not available for the ‘bag-of-words’ methods, which are still the most popular among financial researchers. More advanced DL models such as the LSTM have some contextual ‘understanding’ capabilities, albeit to a limited extent. LSTM only considers the words that precede a given word.
At present, there are also other models with similar architecture as BERT, such as the GPT-3, which is the third version of the OpenAI family of generative pre-trained models. However, it has 175 billion parameters, so its use requires enormous computing power. As a result, it is not the most convenient tool for real-word applications and researchers.
To sum up, the BERT model was chosen because of the following features:
  • It is currently one of the best performing models in natural language processing.
  • Through the attention mechanism, it takes into account the broader context of words in the text.
  • It takes into account the order of words in the text.
  • It can be easily adapted to different categories of NLP tasks.
  • Is less computationally demanding than other state-of-the-art models.

2.3. Baseline Model for Performance Comparison

A four-layer neural network was used as a baseline model for performance comparison. The first layer is an embedding layer, which takes the integer-encoded financial text and looks up an embedding vector for each word. The second layer is the average pooling layer, which returns a fixed-length output vector for each example by averaging the sequence dimension. Next is a fully connected layer with 16 hidden units. The last layer is densely connected with a single-output node. The model has 244,193 trainable parameters. Despite its relative simplicity, the model performs very well in standard text classification problems with an accuracy of 86%.

3. Results

The data prepared as described in Section 2 was used to fine-tune the BERT model. It should be noted that fine-tuning the model is simply a matter of training it further, with the only difference being that labeled data and subject-specific texts are used. Fine-tuning requires a lot of computing power, although less than pre-training. In this work, the basic BERT model (BERT-Base) was used, for which over 109 million weights of the neural network require tuning. The model was adapted to the task of classifying the text into two classes (POSITIVE, NEGATIVE). The input texts in each example include a maximum of 256 words converted to the corresponding numeric form. The model was tuned over six training epochs. In each epoch, the model optimizes its parameters based on all training samples grouped into mini batches of four samples each. For a training set of 5148 samples, each epoch consists of 5148/4 = 1287 steps. At each step, the model calculates a cost function for the current mini group. Then, using the backpropagation algorithm, the gradients of this function are calculated as well as new weights of the neural network. After each epoch, the model is evaluated on a validation dataset. This involves a partially trained model making predictions and comparing them with the labels assigned to the test data. Finally, a measure is calculated for the entire set, on the basis of which the effectiveness of the model can be assessed at a given stage.
Precision, which is calculated by Formula (4), and accuracy, as calculated by Formula (5), were used to evaluate the model—measures commonly used in classification problems.
P = 100 % × ( T P T P + F P )
where:
  • P—precision;
  • TP—the number of true positives;
  • FP—the number of false positives.
A = 100 % × ( T P + T N T o t a l )
where:
  • A—accuracy;
  • TP—the number of true positives;
  • TN—the number of true negatives;
  • Total—the total number of samples.
This measure indicates how often the model’s predictions match the labels.
The minimum value of the cost, calculated on the valuation set, was achieved by the model in the second epoch of training. Then, the amount of cost increases more and more rapidly, which is probably caused by the model overfitting, as shown in Figure 2.
The accuracy of the second epoch, during which the cost is the lowest and the model shows no signs of overfitting, is 52.68%, as shown in Figure 3.
For further calculations, a model with weight values that were achieved after the second training epoch was used. The model calculated the probability of belonging to the POSITIVE or NEGATIVE categories for 1831 samples from test dataset. From this set 101 samples were selected for which the probability of belonging to the POSITIVE class was the highest and 100 samples for which the probability of belonging to the NEGATIVE class was the highest. Then, a measure of precision was calculated for the sets of samples distinguished in this way. The result was 62.38% for the POSITIVE class and 55% for the NEGATIVE class.
The comparison of the performance with the performance of the baseline model is presented in Table 4. The BERT model gives better results measured both by the accuracy and the precision measure.
Sample text that has been considered POSITIVE by the model with high probability:
“apple reports fourth quarter results services revenue reaches all-time high of $12.5 billion eps sets new fourth quarter record of $3.03 cupertino, California—30 October 2019—apple® today announced financial results for its fiscal 2019 fourth quarter ended 28 September 2019. the company posted quarterly revenue of $64 billion, an increase of 2 percent from the year-ago quarter, and quarterly earnings per diluted share of $3.03, up 4 percent. international sales accounted for 60 percent of the quarter’s revenue. “we concluded a groundbreaking fiscal 2019 with our highest q4 revenue ever, fueled by accelerating growth from services, wearables and ipad,” said tim cook, apple’s ceo. “ with customers and reviewers raving about the new generation of iphones, today’s debut of new, noise-cancelling airpods pro, the hotly anticipated arrival of apple tv+ just two days away ….”
Sample text that has been considered NEGATIVE by the model with high probability:
“(nasdaq: aal) today reported its first-quarter 2019 results, including these highlights: “we want to thank our 130,000 team members for the outstanding job they did to take care of our customers, despite the challenges with our fleet during the quarter. their hard work led american to record revenue performance under difficult operating conditions,” said chairman and ceo doug parker. “as we progress toward the busy summer travel period, demand for our product remains strong. however, our near-term earnings forecast has been affected by the grounding of our boeing 737 max fleet, which we have removed from scheduled flying through aug. 19. we presently estimate the grounding of the 737 max will impact our 2019 pre-tax earnings by approximately $350 million. with the recent run-up in oil prices, fuel expenses for the year are also expected to be approximately $650 million higher than we forecast just three months ago ….”
For the same 101 samples for which the probability of belonging to the POSITIVE class was the highest and the 100 samples for which the probability of belonging to the NEGATIVE class was the highest, the event study procedure was applied based on solutions developed in (MacKinlay 1997; Kliger and Gurevich 2014). The naive benchmark was used as a benchmark model for estimating the normal return (NR) assuming that it may be represented by the rate of return of the S&P 500 index. The event window was defined as the period from 31 days before the event to 30 days after the event. The estimation window covers the period from the 31st day after the event to the 90th day after it. With these parameters, the cumulative average abnormal return (CAAR) was estimated for the period from the event to 30 days after it. CAAR is defined as in (Kliger and Gurevich 2014, p. 53). The results are presented in Figure 4 for the events belonging to the POSITIVE class and Figure 5 for the events belonging to the NEGATIVE class. In the case of events belonging to the POSITIVE class, we observed a positive market reaction measured by CAAR, which crosses both thresholds of the 95 and 99 percent confidence level. Similarly, in the case of events belonging to the NEGATIVE class, we observed a positive market reaction measured by CAAR, which also crosses both thresholds of the 95 and 99 percent confidence level.

Discussion

The BERT model used in the study can determine the sentiment of financial texts understood as a measure of its impact on the abnormal return on shares. The model gives 52.68% accuracy of predictions in the case of the validation data set, i.e., 1.68% more than the percentage level of a larger category. For samples defined as POSITIVE or NEGATIVE with the highest probability level, the measure of precision reaches62.38% for the POSITIVE class and 55 for NEGATIVE class. Although the results of classification using the BERT model for more classic NLP tasks are usually higher, it can be concluded that they should not be compared with the issue described in this paper. It should be noted that even a very positive text, as read by a financial analyst, does not necessarily produce a positive market response. Similarly, very negative texts of current reports will not always cause a fall in share prices on the stock exchange. In this case, the model must sometimes look for very subtle meanings in the texts in order to achieve satisfactory results. The sentiment of a financial text proposed here is not based on the researcher’s subjective feelings or the number of words in a sentence that the researcher considers positive or negative. The sentiment in the training data is derived from CAR. This is probably why the model proposed here does not achieve such a high degree of accuracy as in the case of simple classification tasks (e.g., for movie reviews). The ‘human’ financial analyst certainly has similar problems. He can easily consider a given financial text positive or negative. However, his precision in predicting the actual market reaction to the same text is also usually not very high.
In order to show the potential of the model presented in the article in real-world applications, an event study was introduced. The results indicate that the actual market responses associated with the strongly positive texts identified by the model are also significantly positive. The same is true for texts considered negative. They cause significant negative market reactions. In both cases, the significance level is 1 percent. As can be seen in Figure 4, CAAR remains above the 1% significance line for up to 4 days.
As can be observed, the values of the text sentiment measures generated by the model are consistent with the expectations defined in this paper. Financial texts that the model includes in the POSITIVE category are texts that contain information that has a positive impact on the company’s value. Similarly, financial texts that the model classifies as NEGATIVE are texts that contain information that has a negative impact on the company’s value. The examples of texts given in the previous section that are defined as strongly positive or strongly negative would probably be identified in the same way by most professionals using fundamental analysis. The ability of the model to generate sentiment indicators in line with definitional assumptions, combined with lower costs of data preparation, opens the way for its application in many research and practical areas. Among them, we can undoubtedly distinguish market efficiency research, the construction of investment strategies and support of financial analysts.
As can be seen from Appendix A Table A1 in the last few years research on the sentiment of texts concerning listed companies and the market response to these texts covers, to a large extent, the category of secondary text sources such as the Internet, social media and the press. This is undoubtedly related to the dynamic development of these textual information sources and the growing importance of behavioral finance. This work expands the stream of literature focusing on primary sources of financial textual data coming directly from companies and carrying more information relevant to fundamental analysis. A part of previous research in this area was conducted in this paper on the basis of sets of text data from earnings press releases. (Henry 2006a) investigated, among other things, whether the tone of earnings press releases in combination with actual financial results affect the market response measured by CAR. She used a definition of tone identical to the definition of sentiment in Formula (1). This is the classic approach of treating the text as a ‘bag-of-words’ and counting the frequency of occurrence of positive and negative words determined on the basis of dictionaries created subjectively by researchers. The ES procedure was then applied using a linear regression model. As part of this procedure, the impact on CAR was also estimated, in addition to tone, of other variables such as: unexpected earnings, the market value of the firm’s common equity, an indicator variable of earnings that exceed analysts’ forecasts, an indicator of presence or the absence of earnings grater then zero. The event window included cumulative abnormal returns from day t-1 to t + 1, with day 0 as the earnings announcement day. It was estimated that the text tone affects the market reaction to earnings announcements, as shown by the significant positive coefficients on the tone variable. The p-value associated with this coefficient is 0.02, which corresponds to the 98% confidence level.
A slightly different approach was used in (Henry 2006b) The study also determined the level of the market response to verbal components of earnings press releases. However, a large number of additional variables were introduced into the model, such as: variables capturing longer-term company characteristics and variables capturing current earnings information. Variables related to textual content were defined by standard ‘bag-of-words’ methods. Due to the large number of variables, the linear regression model customarily used in ES was abandoned here, and the ML classification and regression trees (CART) model was introduced. Using binary CAR values (i.e., with values of 0 or 1) indicating negative or positive excess returns versus the market, this study examines the impact of the various types of predictor variables on predictive accuracy. The results show that the model with 134 variables, but no variables based on verbal components of earnings press releases texts reached 54.12% accuracy. After introducing variables based on verbal components to the model, the accuracy increased to 59.52%, i.e., by 5.40%.
Contrary to both of the above-mentioned articles, this paper does not use the ‘bag-of-words’ approach, and the sentiment of financial texts is determined completely objectively in the model training process on a large number of research data with no need for manual labeling of these data. This process is detailed in the previous sections. As in the case of (Henry 2006b), the linear regression model was not used, and instead the advanced ML BERT model was utilized. However, when using this model in ES, no other independent variables were used; only plain text data from earnings press releases texts were obtained. It greatly simplifies the process of acquiring research data and the work related to it. Despite using only text data without using other variables, the approach used here gives precision in predicting CAR on a level of 62.38% for the POSITIVE class and 55% for the NEGATIVE class. While these results cannot be directly compared to the accuracy reported in (Henry 2006b), where 169 different variables were used without obtaining more detailed results from this study, it undoubtedly gives some idea of the predictive power of the BERT model approach. Moreover, it is worth noting that the ES presented in this paper confirms the positive relationship between the test sentiment and the market reaction measured by CAR found in (Henry 2006a), while the new approach gives a higher level of confidence for the existence of this relationship, i.e., at the 99% confidence level.

4. Conclusions

The article presents a new approach to the sentiment analysis of financial texts. The presented method eliminates the need for manual data labeling and definition of dictionaries, which reduces both the costs and the labor consumption of its implementation. By relying on raw data, the independence of the results from the subjective assessments of researchers is also ensured. In addition, the applied model takes into account the broad context of words and their meaning in financial texts and eliminates the problem of ambiguity of words in various contexts.
The practical foundations of the proposed method were presented using the example of determining the sentiment of the texts of 8-K current reports published in the EDGAR system. For the texts included in current reports, the proposed BERT model achieved 62.38% precision in predicting sentiment for the POSITIVE class and 55% for the NEGATIVE class. The precision measures were calculated for those samples that were assigned to the given class with the highest probability level. In the case of precision measure, the focus of this work was on those outputs for which the model indicated the highest probability of belonging to a given class (positive or negative). This approach may be especially useful in real-world applications, where the detection of very positive or very negative texts is more important than the precision of determining the sentiments of the entire population of financial texts. For the same samples, the ES procedure was applied. The ES results show that the sentiment calculated under the proposed method can be successfully used to determine the probable direction of the market reaction to the information contained in current reports. The results indicate that the actual market responses associated with the strongly positive texts identified by the model are also significantly positive. The same is true for texts considered to be negative. They cause significant negative market reactions. In both cases, the significance level is 1%.
The model’s ability to generate sentiment indicators, which is in line with the definitional assumptions, opens the way to its implementation in research and real-word applications such as:
  • Event Study;
  • Market efficiency research;
  • Investment strategies;
  • Support for investment analysts using fundamental analysis.
Further work should focus on training the model on textual data from new periods. It is also possible to adapt the model to work with text data that appear in other languages.

Funding

This research received no external funding.

Institutional Review Board Statement

Not applicable.

Informed Consent Statement

Not applicable.

Data Availability Statement

The text research data comes from the ‘EXHIBIT 99’ appendices of the 8-K current reports published by the companies included in the S&P 500 index. All reports were published in the EDGAR system. The cleaned text dataset is available on demand at: [email protected].

Conflicts of Interest

The author declares no conflict of interest.

Appendix A

Table A1. The table shows the types of text sources analyzed in selected research works. U.S. Securities and Exchange Commission (SEC) symbols corresponding to the reports from which the data are derived are given in parentheses. Adapted from (Kearney and Liu 2014) and supplemented with the latest publications.
The Type of Text DataResearch Literature
Primary sourcesAnnual reports (K-10)(Li 2006)
(Loughran and McDonald 2011)
(Jegadeesh and Wu 2013)
Management Discussion and Analysis—MD&A included in annual and quarterly reports (10-Q and 10-K)(Feldman et al. 2008)
(Davis and Tama-Sweet 2012)
Information about initial public offerings (S-1)(Loughran and McDonald 2013)
IPO prospectuses(Jegadeesh and Wu 2013)
(Ferris et al. 2013)
Earnings press releases(Henry 2006a, 2006b)
(Henry and Leone 2009)
(Doran et al. 2012)
(Davis and Tama-Sweet 2012)
(Demers and Vega 2011)
Earnings conference calls(Davis and Tama-Sweet 2012)
(Larcker and Zakolyukina 2012)
(Price et al. 2012)
(Borochin et al. 2017)
(Davis et al. 2015)
Restatements of financial reports(Durnev and Mangen 2011)
Analyst reports(Huang et al. 2014)
Others based on variety of primary sources(Rogers et al. 2011)
Information on changes in the balance of ownership (13D)(Aydogdu et al. 2019)
Information on changes in auditors of companies(Holowczak et al. 2019)
Secondary sourcesMediaPress and news services, such as Wall Street Journal, Dow Jones News Service, The New York Times, The Financial Times, The Times, The Guardian, Mirror, Thomson Reuters(Cowles 1933)
(Tetlock 2007)
(Tetlock et al. 2008)
(Engelberg 2008)
(Sinha 2016)
(García 2013)
(Carretta et al. 2013)
(Engelberg et al. 2012)
(Ferguson et al. 2015)
(Buehlmaier 2015)
(Liu and McConnell 2013)
Stock message boards(Antweiler and Frank 2004)
(Das and Chen 2007)
Internet and social mediaTwitter(Bollen et al. 2011)
(Bartov et al. 2018)
(Sun et al. 2016)

References

  1. Antweiler, Werner, and Murray Z. Frank. 2004. Is All That Talk Just Noise? The Information Content of Internet Stock Message Boards. The Journal of Finance 59: 1259–94. [Google Scholar] [CrossRef]
  2. Aydogdu, Murat, Hakan Saraoglu, and David Louton. 2019. Using long short-term memory neural networks to analyze SEC 13D filings: A recipe for human and machine interaction. Intelligent Systems in Accounting, Finance and Management 26: 153–63. [Google Scholar] [CrossRef]
  3. Bartov, Eli, Lucile Faurel, and Partha S. Mohanram. 2018. Can Twitter Help Predict Firm-Level Earnings and Stock Returns? The Accounting Review 93: 25–57. [Google Scholar] [CrossRef] [Green Version]
  4. Bollen, Johan, Huina Mao, and Xiaojun Zeng. 2011. Twitter mood predicts the stock market. Journal of Computational Science 2: 1–8. [Google Scholar] [CrossRef] [Green Version]
  5. Borochin, Paul, Jim Cicon, Jared DeLisle, and S. McKay Price. 2017. The Effects of Conference Call Tones on Market Perceptions of Value Uncertainty. Available online: https://doi.org/10.2139/ssrn.2579907 (accessed on 18 December 2017).
  6. Buehlmaier, Matthias M. M. 2015. The Role of Media in Takeovers: Theory and Evidence. Available online: https://ssrn.com/abstract=167316 (accessed on 26 February 2015).
  7. Carretta, Alessandro, Vincenzo Farina, Elvira Anna Graziano, and Marco Reale. 2013. Does Investor Attention Influence Stock Market Activity? The Case of Spin-Off Deals. In Asset Pricing, Real Estate and Public Finance over the Crisis. Edited by Alessandro Carretta and Gianluca Mattarocci. London: Palgrave Macmillan, pp. 7–24. [Google Scholar] [CrossRef] [Green Version]
  8. Cowles, Alfred, 3rd. 1933. Can Stock Market Forecasters Forecast? Journal of the Econometric Society 1: 309–24. [Google Scholar] [CrossRef] [Green Version]
  9. Das, Sanjiv R., and Mike Y. Chen. 2007. Yahoo! for Amazon: Sentiment Extraction from Small Talk on the Web. Management Science 53: 1375–88. [Google Scholar] [CrossRef] [Green Version]
  10. Davis, Angela K., and Isho Tama-Sweet. 2012. Managers’ Use of Language Across Alternative Disclosure Outlets: Earnings Press Releases versus MD&A*: Language in Earnings Press Releases vs. MD&A. Contemporary Accounting Research 29: 804–37. [Google Scholar] [CrossRef]
  11. Davis, Angela K., Jeremy M. Piger, and Lisa M. Sedor. 2011. Beyond the Numbers: Measuring the Information Content of Earnings Press Release Language. AAA 2008 Financial Accounting and Reporting Section (FARS) Paper. Available online: https://onlinelibrary.wiley.com/doi/abs/10.1111/j.1911-3846.2011.01130.x (accessed on 1 October 2021).
  12. Davis, Angela K., Weili Ge, Dawn Matsumoto, and Jenny Li Zhang. 2015. The effect of manager-specific optimism on the tone of earnings conference calls. Review of Accounting Studies 20: 639–73. [Google Scholar] [CrossRef]
  13. Demers, Elizabeth, and Clara Vega. 2011. Linguistic Tone in Earnings Announcements: News or Noise? FRB International Finance Discussion Paper. Available online: https://www.researchgate.net/publication/228258461_Linguistic_Tone_in_Earnings_Announcements_News_or_Noise (accessed on 1 October 2021).
  14. Devlin, Jacob, Ming-Wei Chang, Kenton Lee, and Kristina Toutanova. 2019. BERT: Pre-training of Deep Bidirectional Transformers for Language Understanding. arXiv arXiv:1810.04805. [Google Scholar]
  15. Doran, James S., David R. Peterson, and S. McKay Price. 2012. Earnings Conference Call Content and Stock Price: The Case of REITs. The Journal of Real Estate Finance and Economics 45: 402–34. [Google Scholar] [CrossRef]
  16. Durnev, Art, and Claudine Mangen. 2011. The Real Effects of Disclosure Tone: Evidence from Restatements. Available online: https://dx.doi.org/10.2139/ssrn.1650003 (accessed on 12 September 2011).
  17. El-Haj, Mahmoud, Paul Edward Rayson, Steven Eric Young, Martin Walker, Andrew Moore, Vasiliki Athanasakou, and Thomas Schleicher. 2016. Learning Tone and Attribution for Financial Text Mining. Paper presented at Tenth International Conference on Language Resources and Evaluation (LREC’16), Portorož, Slovenia, May 23–28; pp. 1820–25. [Google Scholar]
  18. Engelberg, Joseph. 2008. Costly Information Processing: Evidence from Earnings Announcements. AFA 2009 San Francisco Meetings Paper. Available online: https://papers.ssrn.com/sol3/papers.cfm?abstract_id=1107998 (accessed on 1 October 2021).
  19. Engelberg, Joseph E., Adam V. Reed, and Matthew C. Ringgenberg. 2012. How are shorts informed? Journal of Financial Economics 105: 260–78. [Google Scholar] [CrossRef]
  20. Feldman, Ronen, Suresh Govindaraj, Joshua Livnat, and Benjamin Segal. 2008. The Incremental Information Content of Tone Change in Management Discussion and Analysis. NYU Working Paper No. 2451/27580. Available online: https://papers.ssrn.com/sol3/papers.cfm?abstract_id=1280743 (accessed on 1 October 2021).
  21. Ferguson, Nicky J., Dennis Philip, Herbert Y. T. Lam, and Jie Michael Guo. 2015. Media Content and Stock Returns: The Predictive Power of Press. Multinational Finance Journal 19: 1–31. [Google Scholar] [CrossRef] [Green Version]
  22. Ferris, Stephen P., Qing Hao, and Min-Yu Liao. 2013. The Effect of Issuer Conservatism on IPO Pricing and Performance. Review of Finance 17: 993–1027. [Google Scholar] [CrossRef]
  23. García, Diego. 2013. Sentiment during Recessions: Sentiment during Recessions. The Journal of Finance 68: 1267–300. [Google Scholar] [CrossRef]
  24. Healy, Paul M., and Krishna G. Palepu. 2013. Business Analysis & Valuation: Using Financial Statements, 5th ed. Mason: South-Western, Cencage Learning, pp. 12–14. [Google Scholar]
  25. Henry, Elaine. 2006a. Are Investors Influenced by How Earnings Press Releases Are Written? Available online: https://journals.sagepub.com/doi/abs/10.1177/0021943608319388 (accessed on 1 October 2021).
  26. Henry, Elaine. 2006b. Market Reaction to Verbal Components of Earnings Press Releases: Event Study Using a Predictive Algorithm. Journal of Emerging Technologies in Accounting 3: 1–19. [Google Scholar] [CrossRef]
  27. Henry, Elaine, and Andrew J. Leone. 2009. Measuring Qualitative Information in Capital Markets Research. Available online: https://dx.doi.org/10.2139/ssrn.1470807 (accessed on 9 September 2009).
  28. Holowczak, Richard, David Louton, and Hakan Saraoglu. 2019. Testing market response to auditor change filings: A comparison of machine learning classifiers. The Journal of Finance and Data Science 5: 48–59. [Google Scholar] [CrossRef]
  29. Huang, Allen H., Amy Y. Zang, and Rong Zheng. 2014. Evidence on the Information Content of Text in Analyst Reports. The Accounting Review 89: 2151–80. [Google Scholar] [CrossRef] [Green Version]
  30. Jegadeesh, Narasimhan, and Di Wu. 2013. Word power: A new approach for content analysis. Journal of Financial Economics 110: 712–29. [Google Scholar] [CrossRef] [Green Version]
  31. Kearney, Colm, and Sha Liu. 2014. Textual sentiment in finance: A survey of methods and models. International Review of Financial Analysis 33: 171–85. [Google Scholar] [CrossRef] [Green Version]
  32. Kliger, Doron, and Gregory Gurevich. 2014. Event Studies for Financial Research: A Comprehensive Guide. Basingstoke: Palgrave Macmillan. [Google Scholar]
  33. Larcker, David F., and Anastasia A. Zakolyukina. 2012. Detecting Deceptive Discussions in Conference Calls: Detecting deceptive discussions in conference calls. Journal of Accounting Research 50: 495–540. [Google Scholar] [CrossRef]
  34. Li, Feng. 2006. Do Stock Market Investors Understand the Risk Sentiment of Corporate Annual Reports? Available online: https://dx.doi.org/10.2139/ssrn.898181 (accessed on 21 April 2006).
  35. Li, Feng. 2010. The Information Content of Forward-Looking Statements in Corporate Filings-A Naïve Bayesian Machine Learning Approach: The information content of corporate filings. Journal of Accounting Research 48: 1049–102. [Google Scholar] [CrossRef]
  36. Liu, Baixiao, and John J. McConnell. 2013. The role of the media in corporate governance: Do the media influence managers’ capital allocation decisions? Journal of Financial Economics 110: 1–17. [Google Scholar] [CrossRef]
  37. Loughran, Tim, and Bill McDonald. 2011. When Is a Liability Not a Liability? Textual Analysis, Dictionaries, and 10-Ks. The Journal of Finance 66: 35–65. [Google Scholar] [CrossRef]
  38. Loughran, Tim, and Bill McDonald. 2013. IPO first-day returns, offer price revisions, volatility, and form S-1 language. Journal of Financial Economics 109: 307–26. [Google Scholar] [CrossRef]
  39. MacKinlay, A. Craig. 1997. Event Studies in Economics and Finance. Journal of Economic Literature 35: 13–39. [Google Scholar]
  40. Price, S. McKay, James S. Doran, David R. Peterson, and Barbara A. Bliss. 2012. Earnings conference calls and stock returns: The incremental informativeness of textual tone. Journal of Banking & Finance 36: 992–1011. [Google Scholar] [CrossRef]
  41. Rogers, Jonathan L., Andrew Van Buskirk, and Sarah L. C. Zechman. 2011. Disclosure Tone and Shareholder Litigation. The Accounting Review 86: 2155–83. [Google Scholar] [CrossRef]
  42. Sinha, Nitish Ranjan. 2016. Underreaction to News in the US Stock Market. Quarterly Journal of Finance 6: 1650005. [Google Scholar] [CrossRef]
  43. Sun, Andrew, Michael Lachanski, and Frank J. Fabozzi. 2016. Trade the tweet: Social media text mining and sparse matrix factorization for stock market prediction. International Review of Financial Analysis 48: 272–81. [Google Scholar] [CrossRef]
  44. Tetlock, Paul C. 2007. Giving Content to Investor Sentiment: The Role of Media in the Stock Market. The Journal of Finance 62: 1139–68. [Google Scholar] [CrossRef]
  45. Tetlock, Paul C., Maytal Saar-Tsechansky, and Sofus Macskassy. 2008. More Than Words: Quantifying Language to Measure Firms’ Fundamentals. The Journal of Finance 63: 1437–67. [Google Scholar] [CrossRef]
Figure 1. Diagram showing the basic functional elements of the BERT model.
Jrfm 14 00582 g001
Figure 2. The figure shows the cost (ordinate axis) calculated on the valuation data in subsequent training epochs (horizontal axis). It reaches its minimum in the second training epoch. Then, it increases due to model overfitting.
Jrfm 14 00582 g002
Figure 3. The figure shows the value of accuracy (vertical axis) in subsequent training periods (horizontal axis). For the second training epoch it is 0.526806533, i.e., 52.68% rounded.
Jrfm 14 00582 g003
Figure 4. Estimated CAARs of POSITIVE class for each of the time periods from event day to 30 days after the event (green color), along with their 95 and 99 percent confidence thresholds, which are presented in dark and light gray, respectively.
Jrfm 14 00582 g004
Figure 5. Estimated CAARs of NEGATIVE class for each of the time periods from event day to 30 days after the event (red color), along with their 95 and 99 percent confidence thresholds, which are presented in dark and light gray, respectively.
Jrfm 14 00582 g005
Table 1. The table presents the leading scientific articles dealing with the market response to the texts of earnings press releases and earnings conference calls. In addition to the publications and sources of text data, the period covered by the study, the method of text content analysis and the model used to study the relationship between the content of the messages and the market response measured by the CAR are also given. The last two columns contain data about the width of the event window and a summary of the results.
Scientific PublicationStudy PeriodSource of Text DataContent Analysis MethodsModelsEvent Window WidthMarket Response
(Henry 2006b)1998–2002Earnings press releasesDictionary based
(Diction 5.0)
Linear regression, event study3 daysThe tone of press releases influences the market response as measured by the CAR
(Henry and Leone 2009)2004–2006Earnings press releasesDictionary based
(Henry DICTION, GI/Harvard)
Linear regression, event study3 daysThe tone of press releases influences the market response as measured by the CAR, with stronger negative tone influence.
(Doran et al. 2012)2004–2007Earnings conference callsDictionary based
(Henry DICTION, GI, Henry)
Linear regression, event study2 days,
9 days,
21 days
The tone of conference calls has an impact on the market response measured by the CAR—significant in the 2-day range
(Davis et al. 2011)1998–2003Earnings press releasesDictionary based
(DICTION)
Linear regression, event study3 daysThe language of press releases influences the market response as measured by the CAR
(Demers and Vega 2011)1998–2006Earnings press releasesDictionary based
(DICTION, GI/Harvard, LM)
Linear regression, event study3 daysThe optimism expressed by management in the press releases has an informative content that is valued by the market CAR
(Price et al. 2012)2004–2007Earnings conference callsDictionary based
(GI/Harvard Henry)
Linear regression, event study3 days,
59 days
The language of conference calls influences the market response as measured by the CAR
Table 2. Categories of events, the occurrence of which should result in the publication of relevant information in the current report 8-K.
Categories of EventsScope of Information
Registrant’s business and operationsEntry and termination of material definitive agreement, bankruptcy or receivership, reporting of shutdowns and patterns of violations in mines.
Financial InformationAcquisition or disposition of assets, results of operations and financial condition, creation and change of a balance sheet or off-balance sheet liability, costs associated with exit or disposal activities, material impairments.
Securities and trading marketsIssues concerning delisting for any class of the registrant’s common equity, unregistered sales of equity securities, modification to rights of security holders.
Matters related to accountants and financial statementsChanges in company’s certifying accountant, non-reliance on previously issued financial statements or a related audit report or completed interim review.
Corporate governance and managementChanges in control of registrant, changes in management stuff, amendments to articles of incorporation or bylaws, change in fiscal year, temporary suspension of trading under registrant’s employee benefit plans, amendments to the registrant’s code of ethics, change in shell company status, submission of matters to a vote of security holders, shareholder director nominations.
Asset-backed securitiesInformational and computational material, change of servicer or trustee, change in credit or other external support, failure in securities distribution.
Fair disclosure regulationDisclosure of any information that has been shared with other certain individuals or entities.
Other EventsAny events, with respect to which information is not otherwise called for by the 8-K form, that the registrant deems of importance to security holders.
Financial statements and exhibitsPro forma financial information and exhibits, financial statements of businesses or funds acquired, pro forma financial information, shell company transactions, other exhibits.
Table 3. Illustrative fragment of the training set. The first column contains the text extracted from the appendix ‘EXHIBIT 99’ of the 8-K current report. The second column contains the labels of the sentiment classes calculated for the text. The first text concerns Akamai Technologies, Inc., an American provider of cloud services and the second concerns company from the transport sector, C.H. Robinson Worldwide, Inc.
TextClass Label
“(nasdaq: akam), the world’s largest and most trusted cloud delivery platform, today reported financial results for the fourth quarter and full-year ended 31 December 2018. “we were very pleased with our strong finish to the year. both revenue and earnings exceeded our expectations due to the very rapid growth of our cloud security business, robust seasonal traffic and our continued focus on operational excellence,” said dr. tom leighton, ceo of akamai. “as a result, we achieved our fifth consecutive quarter of non-gaap operating margin improvement, and we are well on our way to achieving our 30% margin goal in 2020 …”POSITIVE (1)
“(nasdaq: chrw) today reported financial results for the quarter ended 30 September 2019. “the third quarter provided challenges in both our north american surface transportation and global forwarding segments. our net revenues, operating income, and eps results finished below our long-term expectations. we anticipated an aggressive industry pricing environment coming into the second half of this year driven by excess capacity and softening demand and knew we faced difficult comparisons versus our strong double-digit net revenue growth in the second half of last year. our results were negatively impacted by truckload margin compression in north america,” said bob biesterfeld, chief executive officer …”NEGATIVE (0)
Table 4. Comparison of the results for the BERT model and the baseline model. The ‘Precision POSITIVE’ and ‘Precision NEGATIVE’ columns contain the precision measures for the samples with the highest probability of belonging to a given class, as calculated by the model.
ModelValidation
Accuracy
Precision
POSITIVE
Precision
NEGATIVE
BERT52.68%62.38%55.00%
Baseline44.97%59.00%48.00%
Publisher’s Note: MDPI stays neutral with regard to jurisdictional claims in published maps and institutional affiliations.

