
Insuring Hollywood: A Movie Returns Index and the American Stock Market

Abstract
:1. Introduction: Insurance and the Motion Picture Industry
Goals and Organization of This Study
2. Data Set Description
3. Movie Returns Index
3.1. The Basic Economics of Hollywood—Part I
3.2. Index Construction
4. Option Pricing
4.1. Competition, Closures, and the Movie Theater
4.2. Dodd-Frank Goes to the Movies
4.3. Developing Call and Put Options
5. Movie Index and the Stock Market
5.1. The Basic Economics of Hollywood—Part II
5.2. Analysis of Index–Stock Market Dependence
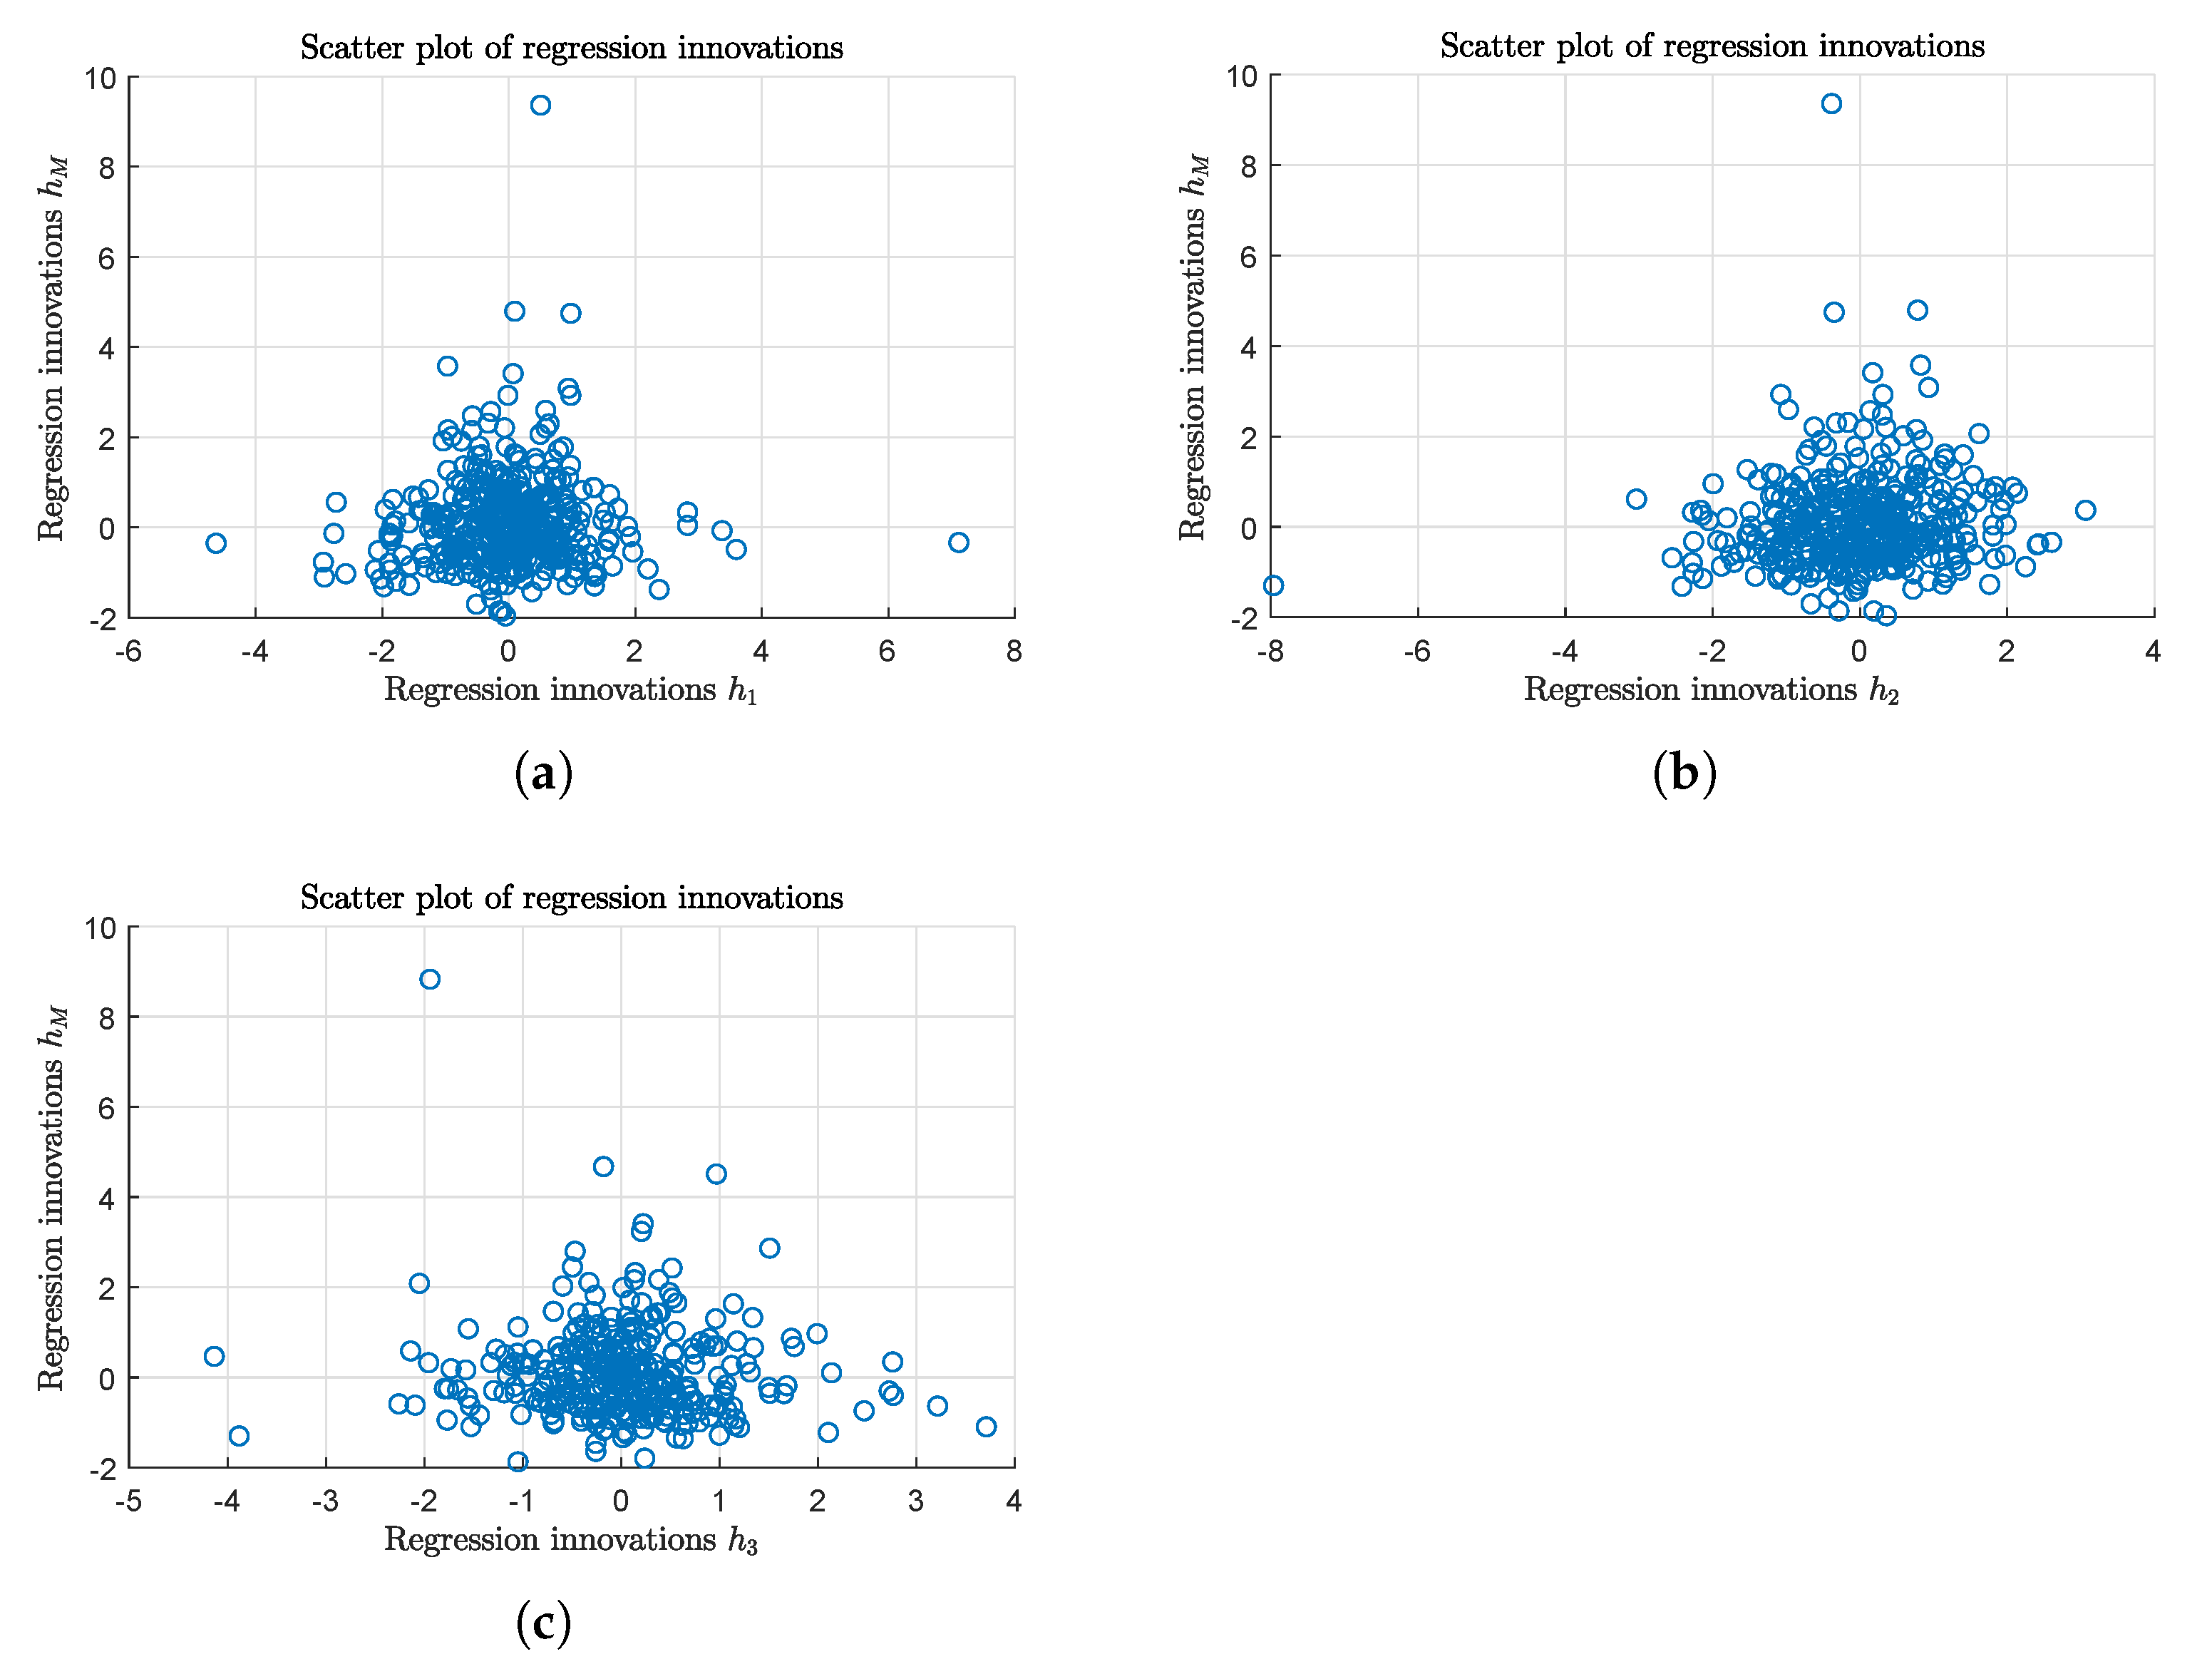
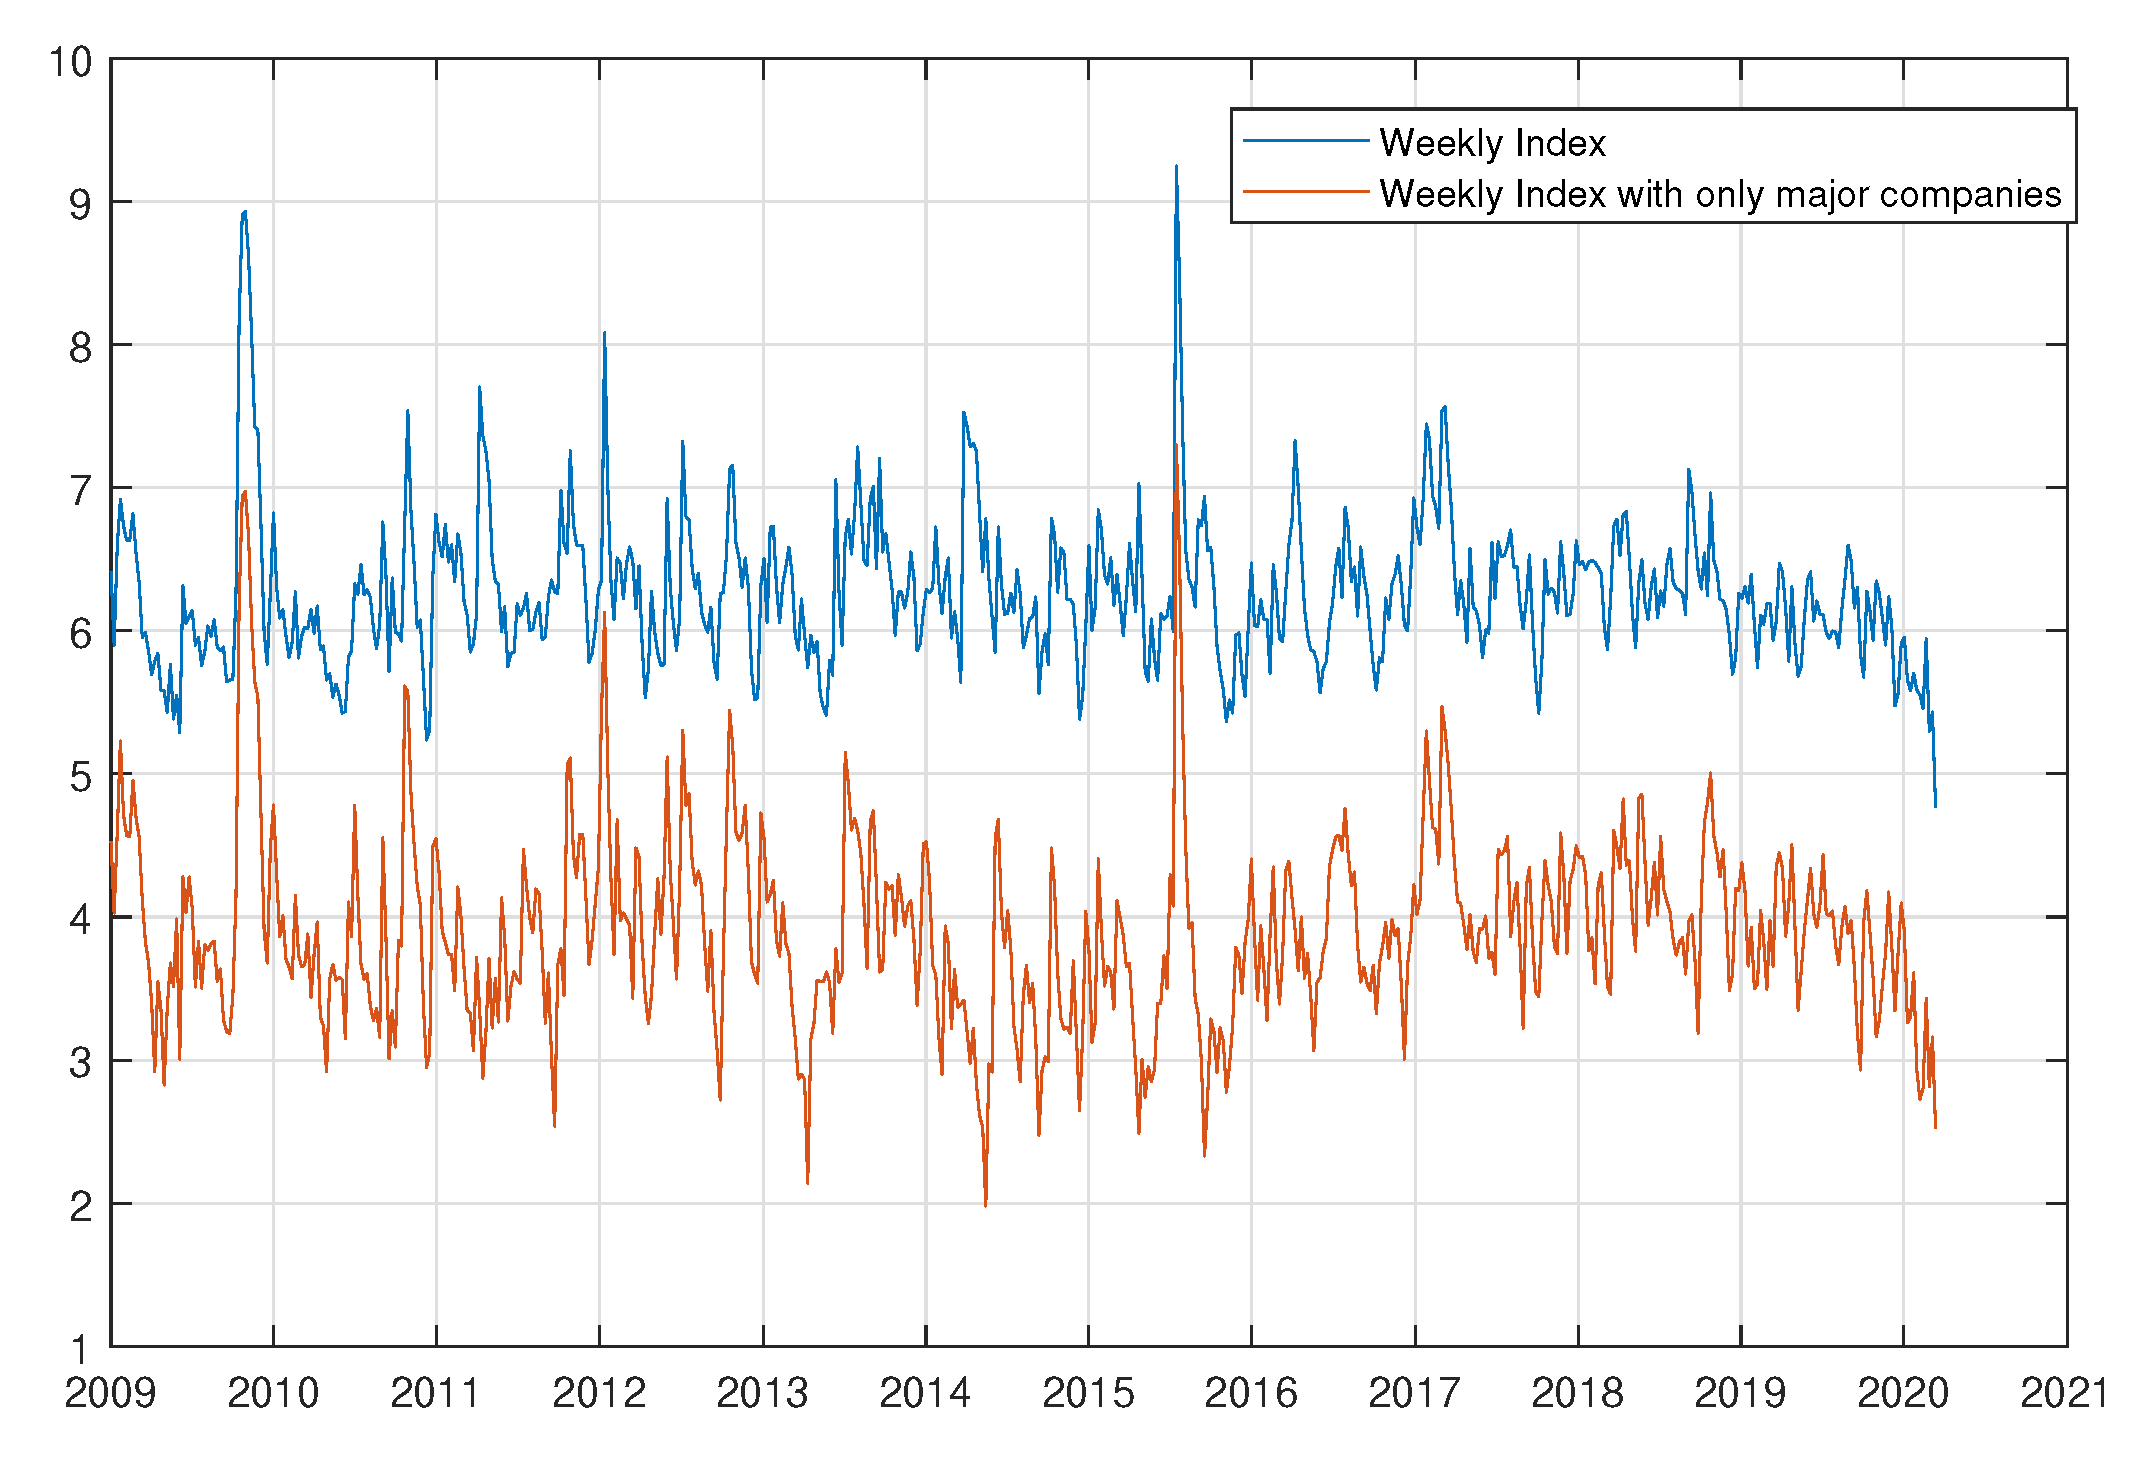
- We consider the stock index composed only by the two major U.S. companies which own movie theaters. In this case the statistic of the regression on the CRSP index is lower than the value found before, suggesting a lower dependency of this index with general market conditions; however, we can observe that the ratiois greater than the previous case. This could be a signal of a stronger left-lower tail dependency.
- We alter the weight in the stock index formed by production/distribution companies : the weight assigned to a particular company is the proportion of the total weekly cost held by that company over the total cost for for the entire industry for that same week. We call the resulting stock index. In this case we lost the dependency of the stock index with the overall U.S. financial market with a very low value of and a statistic close to zero. However, the dependence structure between the two innovations series and appear to be more complex: correlation and concordance measure reveal a negative sign, suggesting a countermonotone relationship, whereas both lower-left and upper-right dependence measures appear to be positive.
6. Conclusions
Author Contributions
Funding
Institutional Review Board Statement
Informed Consent Statement
Data Availability Statement
Conflicts of Interest
Appendix A. Tables

| Variable | Mean | Median | Std | Skewness | Kurtosis | ||
|---|---|---|---|---|---|---|---|
| C | 1.958 | 7.192 | |||||
| Y | 3.434 | 19.588 | |||||
| 1.265 | 0.052 | 7.362 | 24.757 | 742.478 | −0.970 | 15.595 | |
| L | −0.025 | 0.051 | 1.48184 | −1.56301 | 9.39145 | −4.22111 | 2.4781 |
| 77 | 73 | 40.0 | 0.732 | 4.294 | 9.409 | 173.821 | |
| 34 | 34 | 4.6 | 0.120 | 2.875 | 25.331 | 43.506 | |
| 0.238 | 3.775 | ||||||
| 1.083 | 4.237 | ||||||
| 4.125 | 4.080 | 0.810 | 0.461 | 3.420 | 2.725 | 5.950 | |
| 0.165 | 0.399 | 3.900 | −0.334 | 0.393 |
| Variable | Distribution | AIC | llh | |||||
|---|---|---|---|---|---|---|---|---|
| L | t | −2.382 | 0.402 | 0.647 | −0.402 | 2.162 | 4030.353 | −2009.176 |
| NIG | −0.500 | 0.860 | 0.616 | −0.374 | 1.327 | 4029.683 | −2010.841 | |
| VG | 1.596 | 1.456 | 0.716 | −0.446 | 0 | 4049.633 | −2020.816 | |
| t | −1.795 | 0.265 | −0.265 | 0.265 | 1.265 | 1975.550 | −983.7748 | |
| NIG | −0.500 | 0.917 | −0.265 | 0.270 | 0.814 | 1973.332 | −982.6660 | |
| VG | 1.370 | 1.791 | −0.310 | 0.334 | 0 | 1980.610 | −986.3052 |
| Conditional Mean | ||||||
|---|---|---|---|---|---|---|
| Value | −1.522366 | 0.351508 | 0.211057 | −1.679167 | 0.103901 | −1.878299 |
| p-Value | 0.010639 | 0.01374 | 0 | |||
| Conditional Variance | ||||||
| Value | 0.29719 | 0.17737 | ||||
| p-Value | 0.00030031 | |||||
| Model Measures | AIC. | BIC | MSE | MSPE | ||
| −1.43. | −1.7 | 0.0047 | 0.0116 |
| Variable | Mean | Std | Skewness | Kurtosis | ||
|---|---|---|---|---|---|---|
| Equally weighted Stock Index | 0.003 | 0.024 | −1.383 | 6.600 | −1.055 | 0.051 |
| Equally weighted Stock Index | 0.001 | 0.036 | −1.745 | 7.390 | −1.081 | 0.072 |
| Equally weighted Stock Index | 0.004 | 0.099 | 0.037 | 5.750 | −1.223 | 0.239 |
| Equally weighted CRSP Index | 0.002 | 0.018 | −1.296 | 4.752 | −1.039 | 0.039 |
| Weekly Movie Index | −1.0001 | 0.0613 | 1.680 | 10.426 | −1.100 | 0.164 |
| Stock index innovations | −1.014 | 1.014 | 0.614 | 10.105 | −1.260 | 2.280 |
| Stock index innovations | −1.0220 | 1.031 | −1.113 | 11.145 | −1.3960 | 2.0240 |
| Stock index innovations | 0.0060 | 0.906 | −1.036 | 6.413 | −1.104 | 2.1830 |
| Movie index innovations | 0.116 | 1.058 | 2.506 | 18.445 | −1.395 | 3.078 |
| Regression | c | p-Value F-Statistic | ||
|---|---|---|---|---|
| 0.0112 | 0.8785 | 0 | 0.4170 | |
| −1.0011 | 0.8683 | 0 | 0.1856 | |
| 0.0012 | 1.1400 | 0 | 0.0398 |
| Bivariate Sample | Linear Correlation | Kendall’s tau | Spearman’s rho |
|---|---|---|---|
| 0.0397 | 0.0112 | 0.0190 | |
| 0.0994 | 0.0728 | 0.1088 | |
| −1.0500 | −1.0290 | −1.0463 |
| Conditional Sample | ||||||
|---|---|---|---|---|---|---|
| −1.7810 | −1.9754 | −1.0235 | 1.9135 | 0.9797 | 0.9827 | |
| −1.1149 | −1.1418 | −1.3146 | 1.3555 | 0.4230 | 0.7211 | |
| −1.5432 | −1.4171 | −1.9092 | 1.5619 | 1.6186 | 1.6118 | |
| −1.1149 | −1.2971 | −1.3161 | 1.9135 | 2.0621 | 2.0505 | |
| −1.5267 | −1.2208 | −1.2208 | 1.4212 | 1.7476 | 1.7476 | |
| −1.1149 | −1.2995 | −1.2995 | 1.9135 | 2.8661 | 2.8661 |
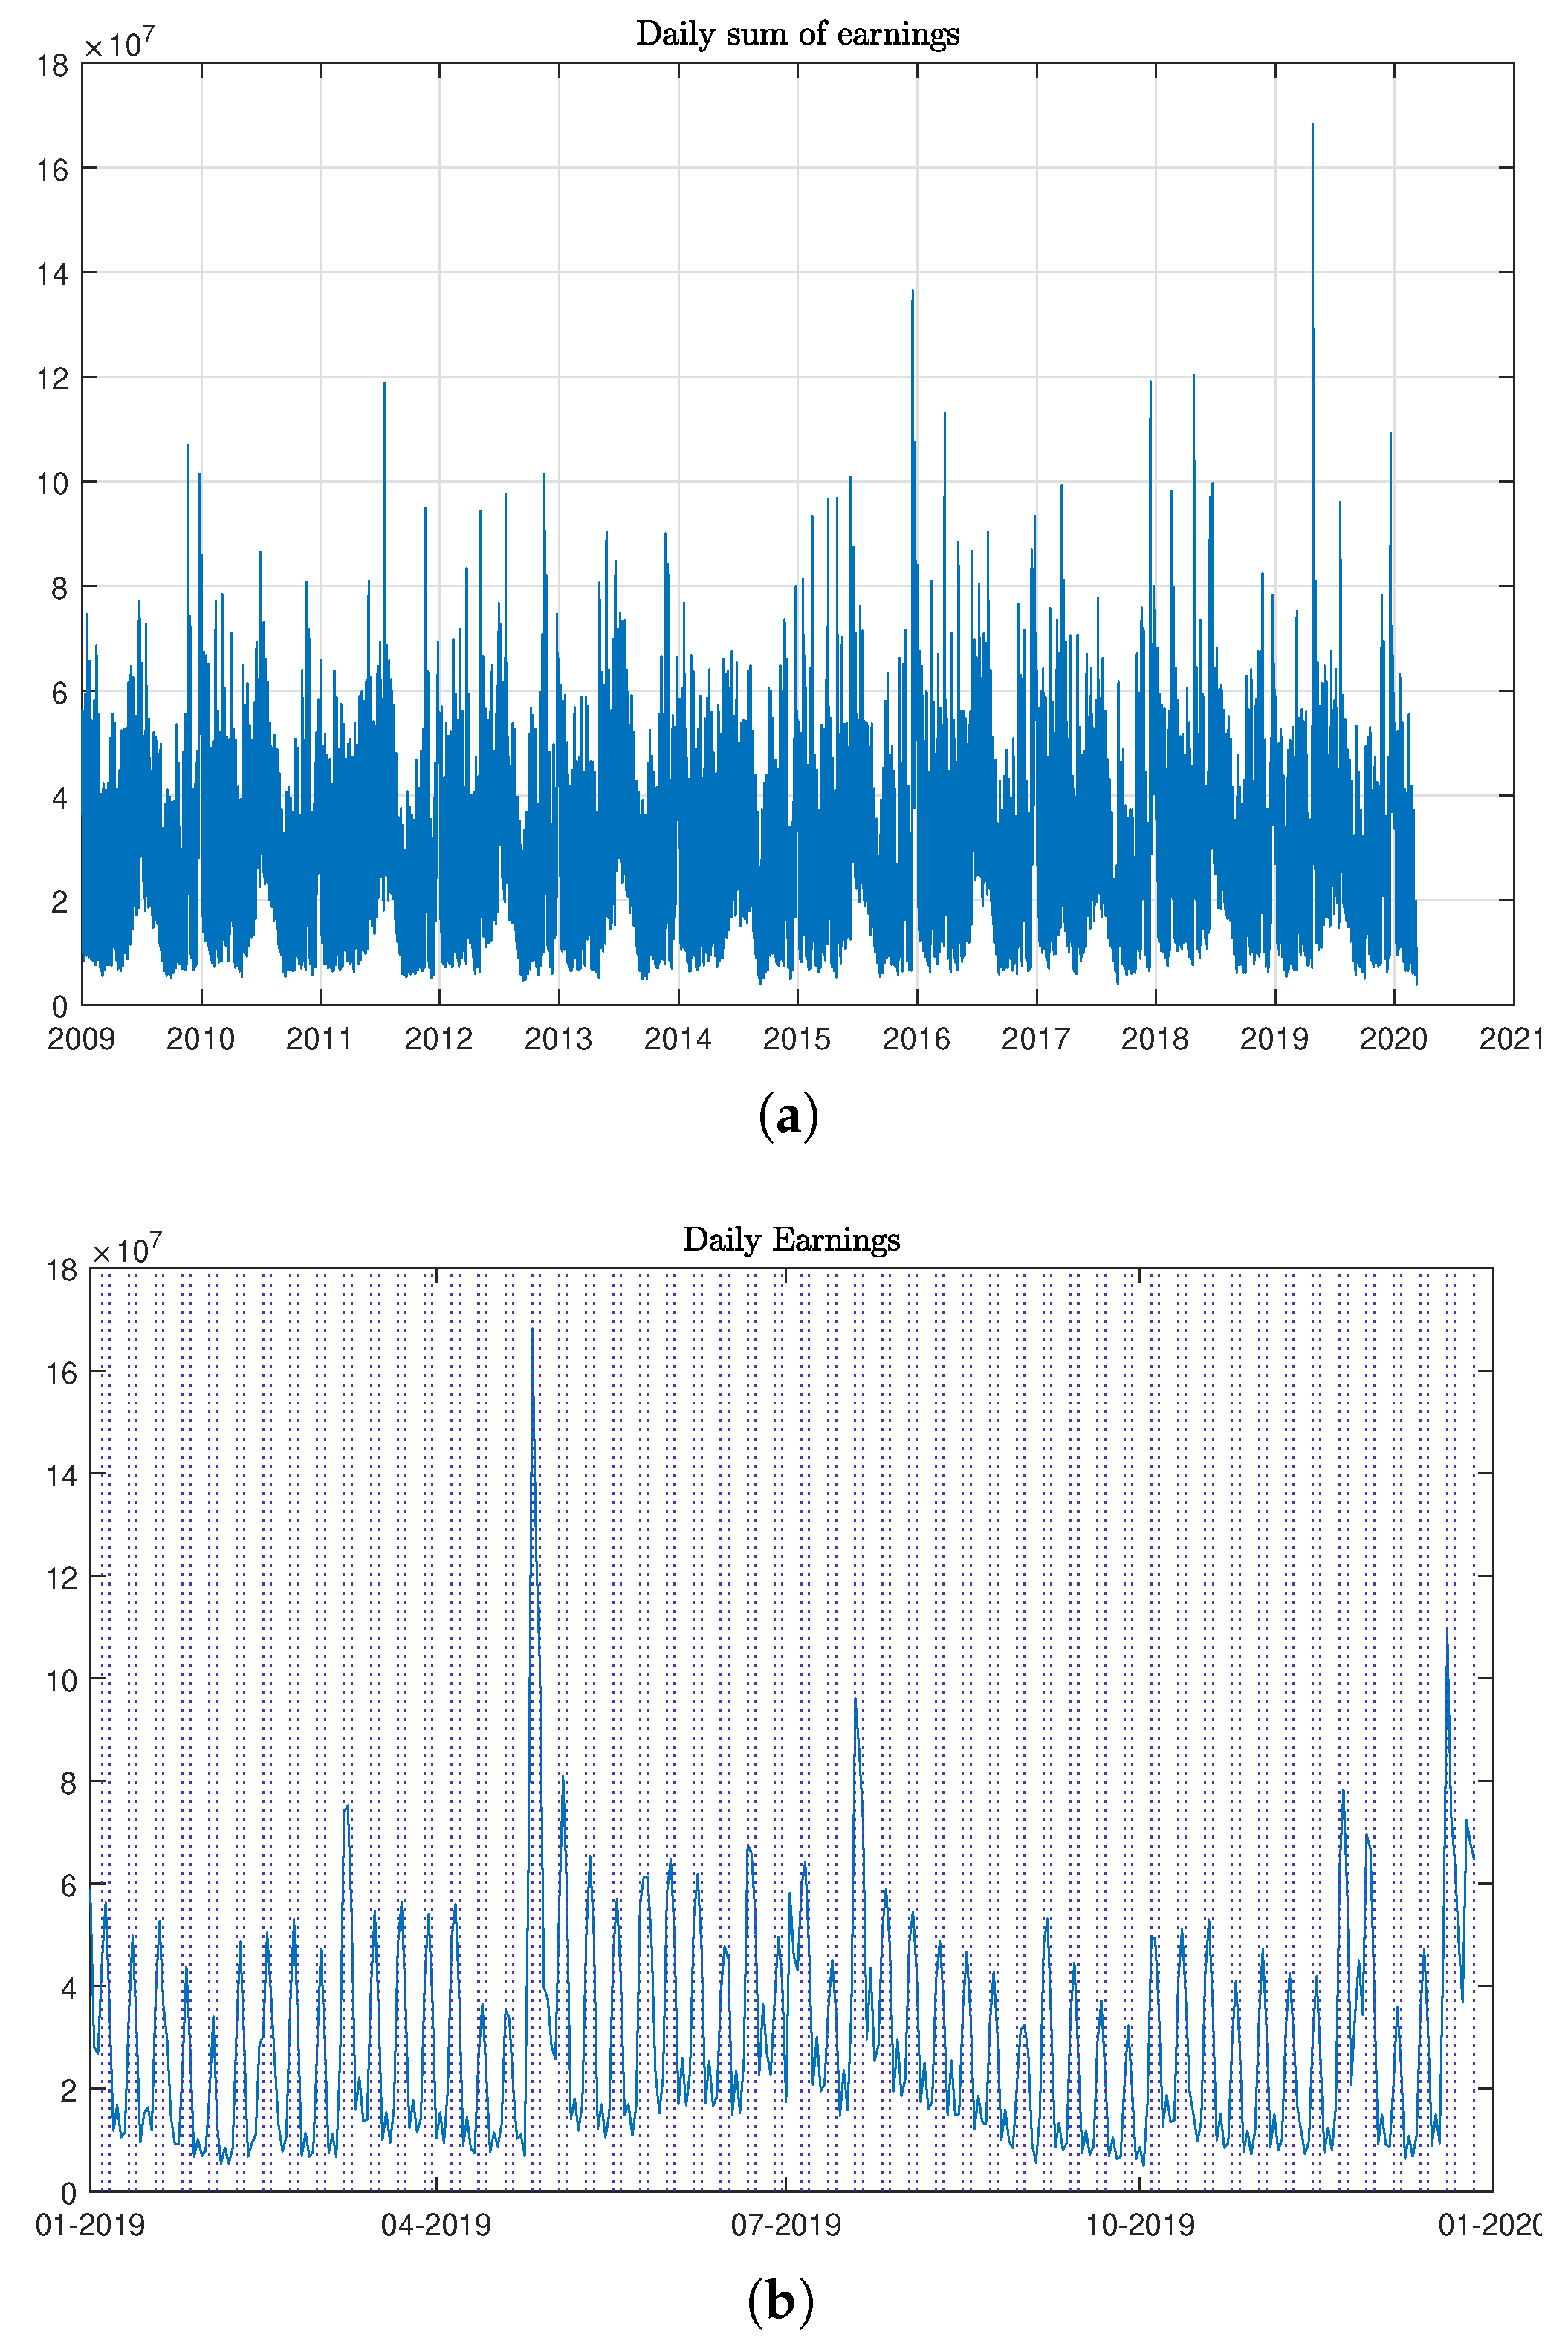
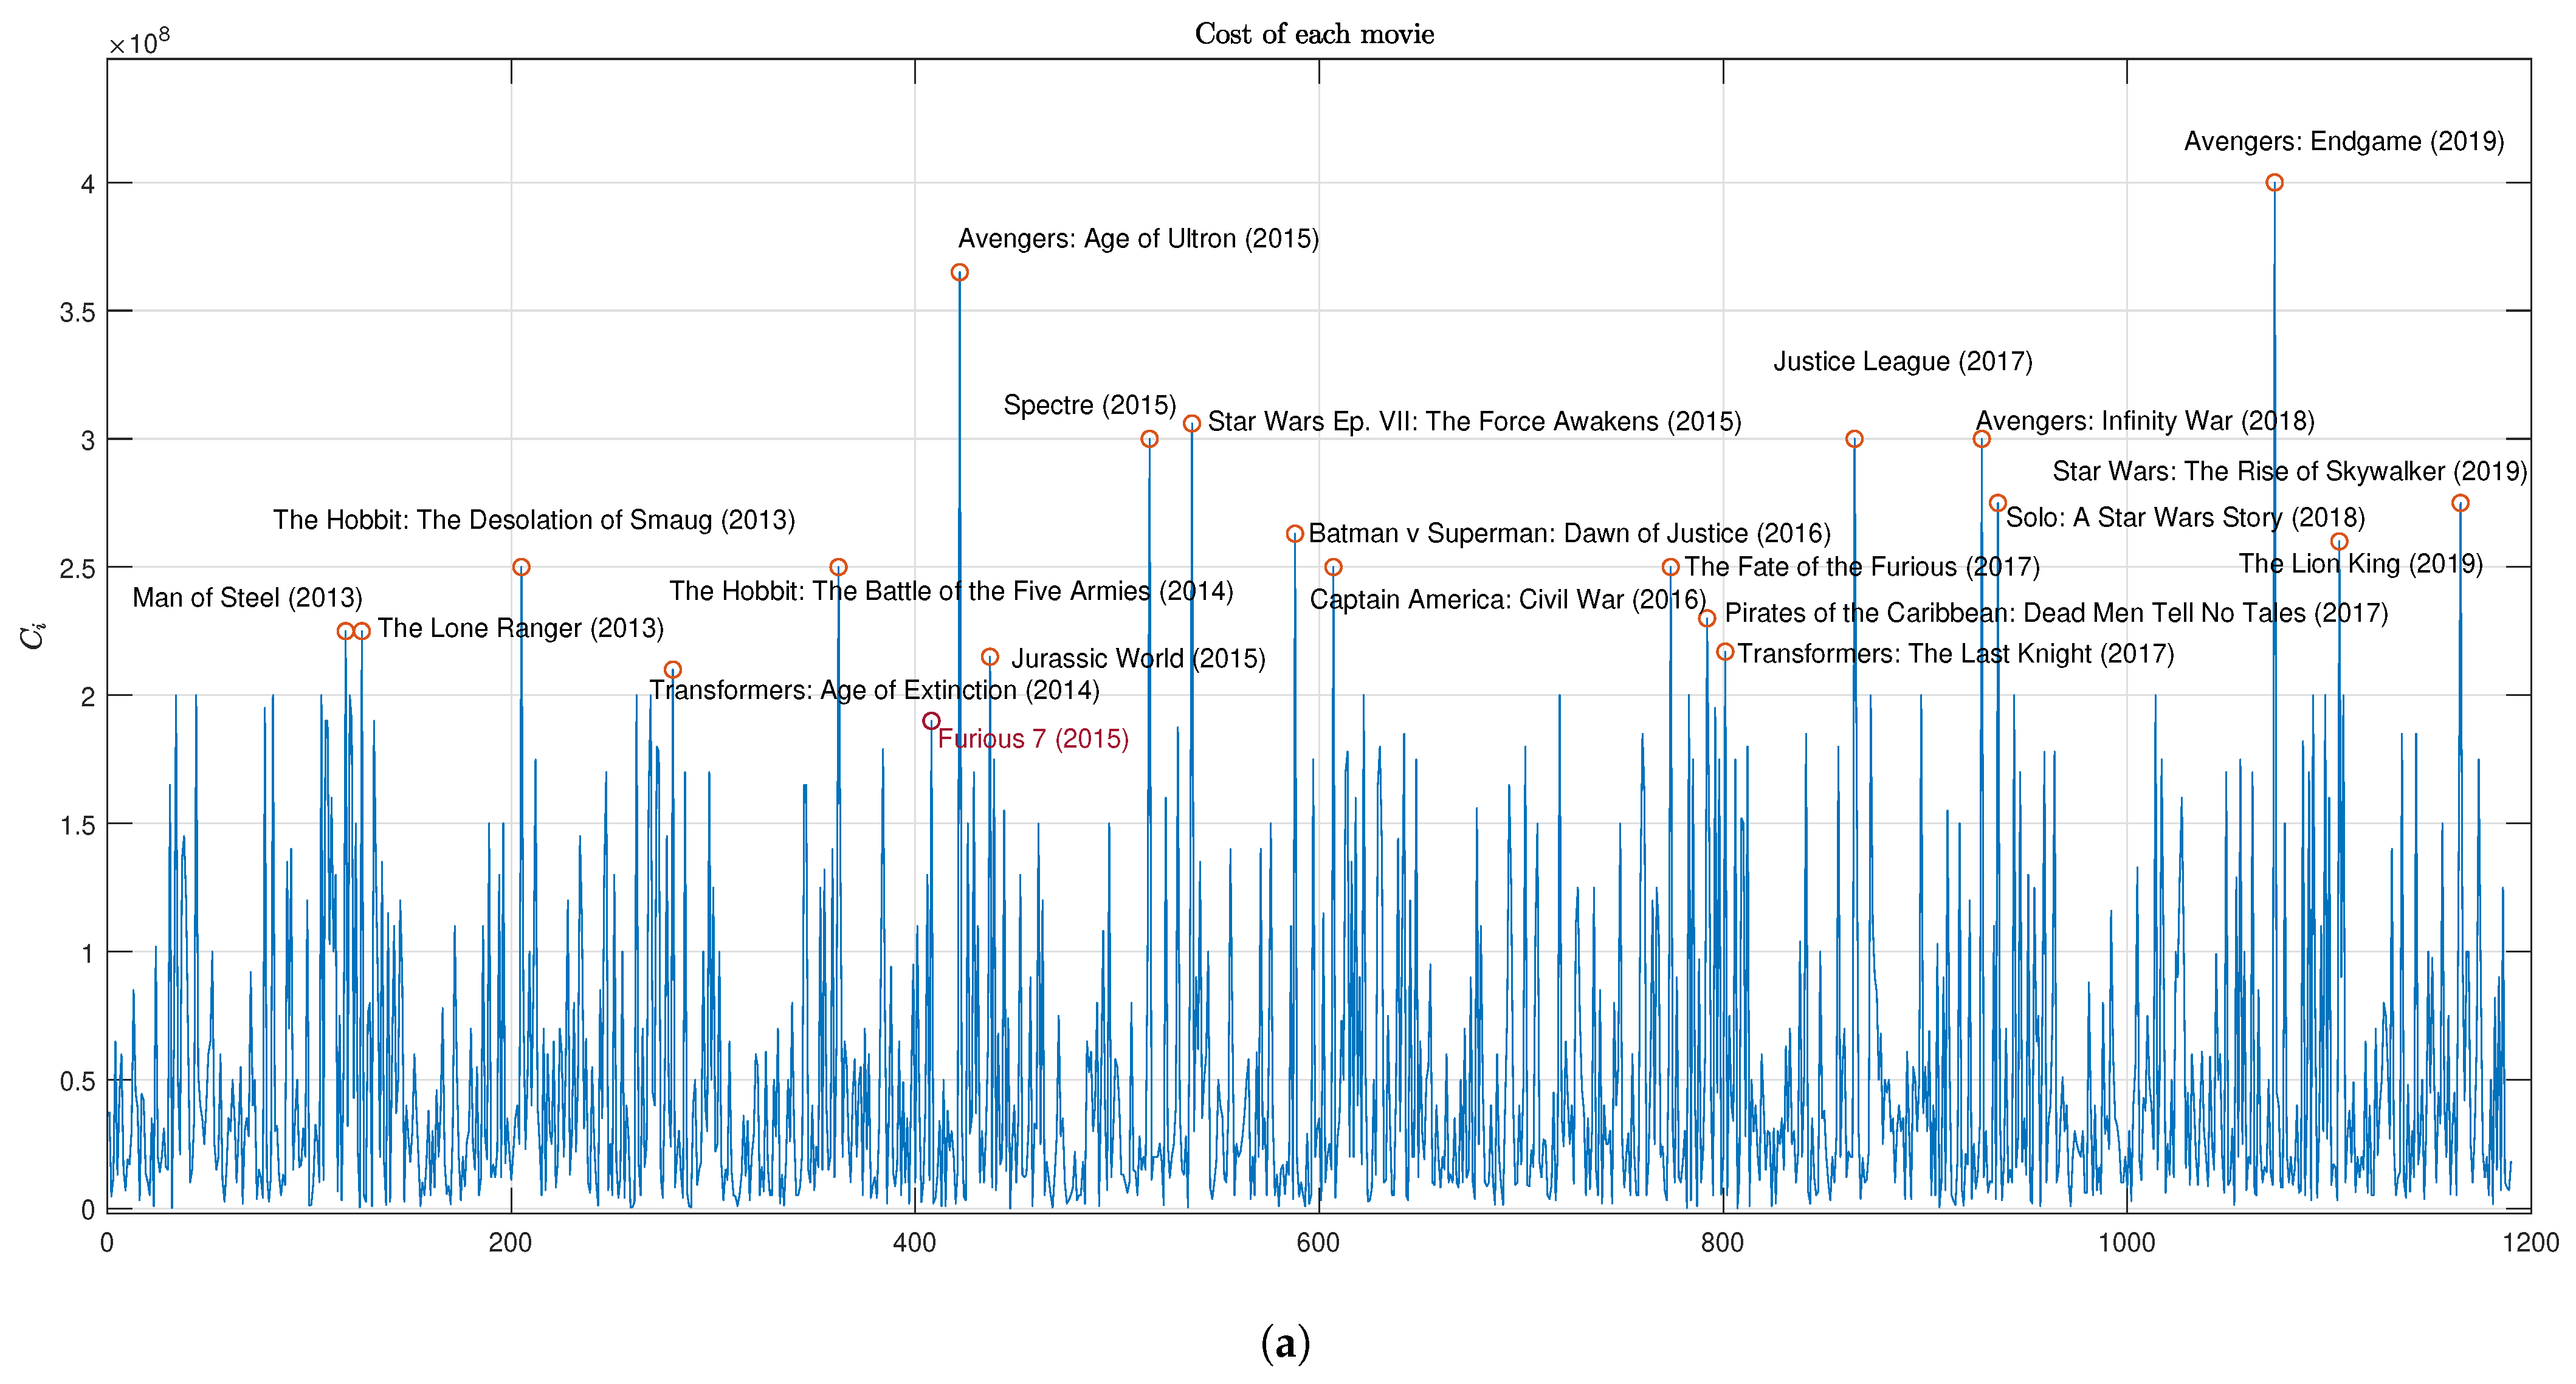
| 1. | For a graphic representation of budgets, see Figure 1, panel (a). Furious 7 is data point 408 on the x-axis and it has been added to the films named there for easy identification. |
| 2. | Portfolio diversification is another oft-used tactic, particularly here in terms of the number of films involved in the investment. This was one of the practices also employed (unsuccessfully) by Flashpoint to attract investors. Such “slate financing”—investing through a hedge fund, private equity firm, or similar financial structure in a slate of movies rather than a single film—was popular for a period around the beginning of the millennium. Between 2005 and 2008, for example, hedge funds and private equity firms invested an estimated USD 12 billion in studio film slates Landry and Greenwald (2018). Ultimately, however, poor performance across those slates caused problems with insurers who adjusted their policies to make such investments more difficult or at least less enticing. |
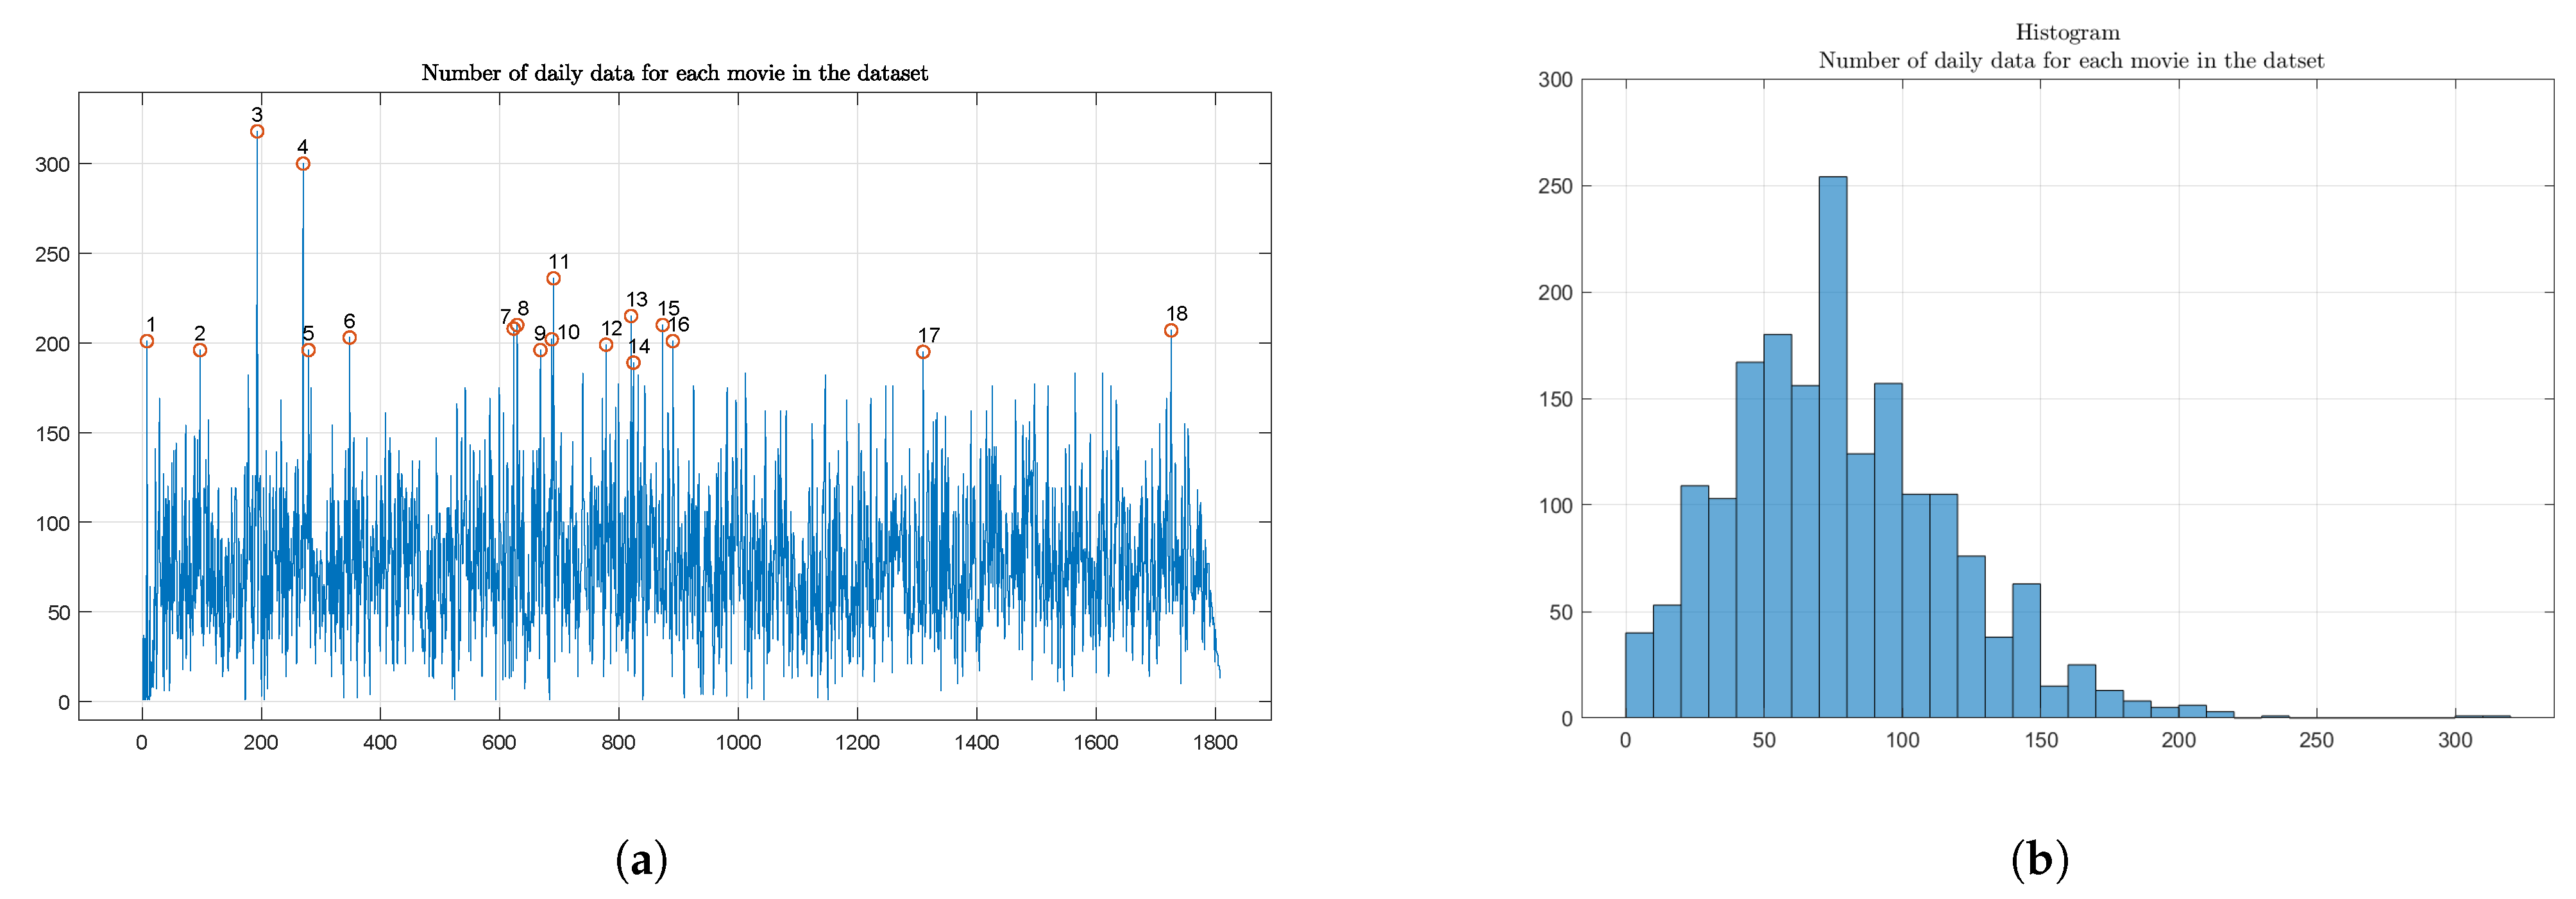
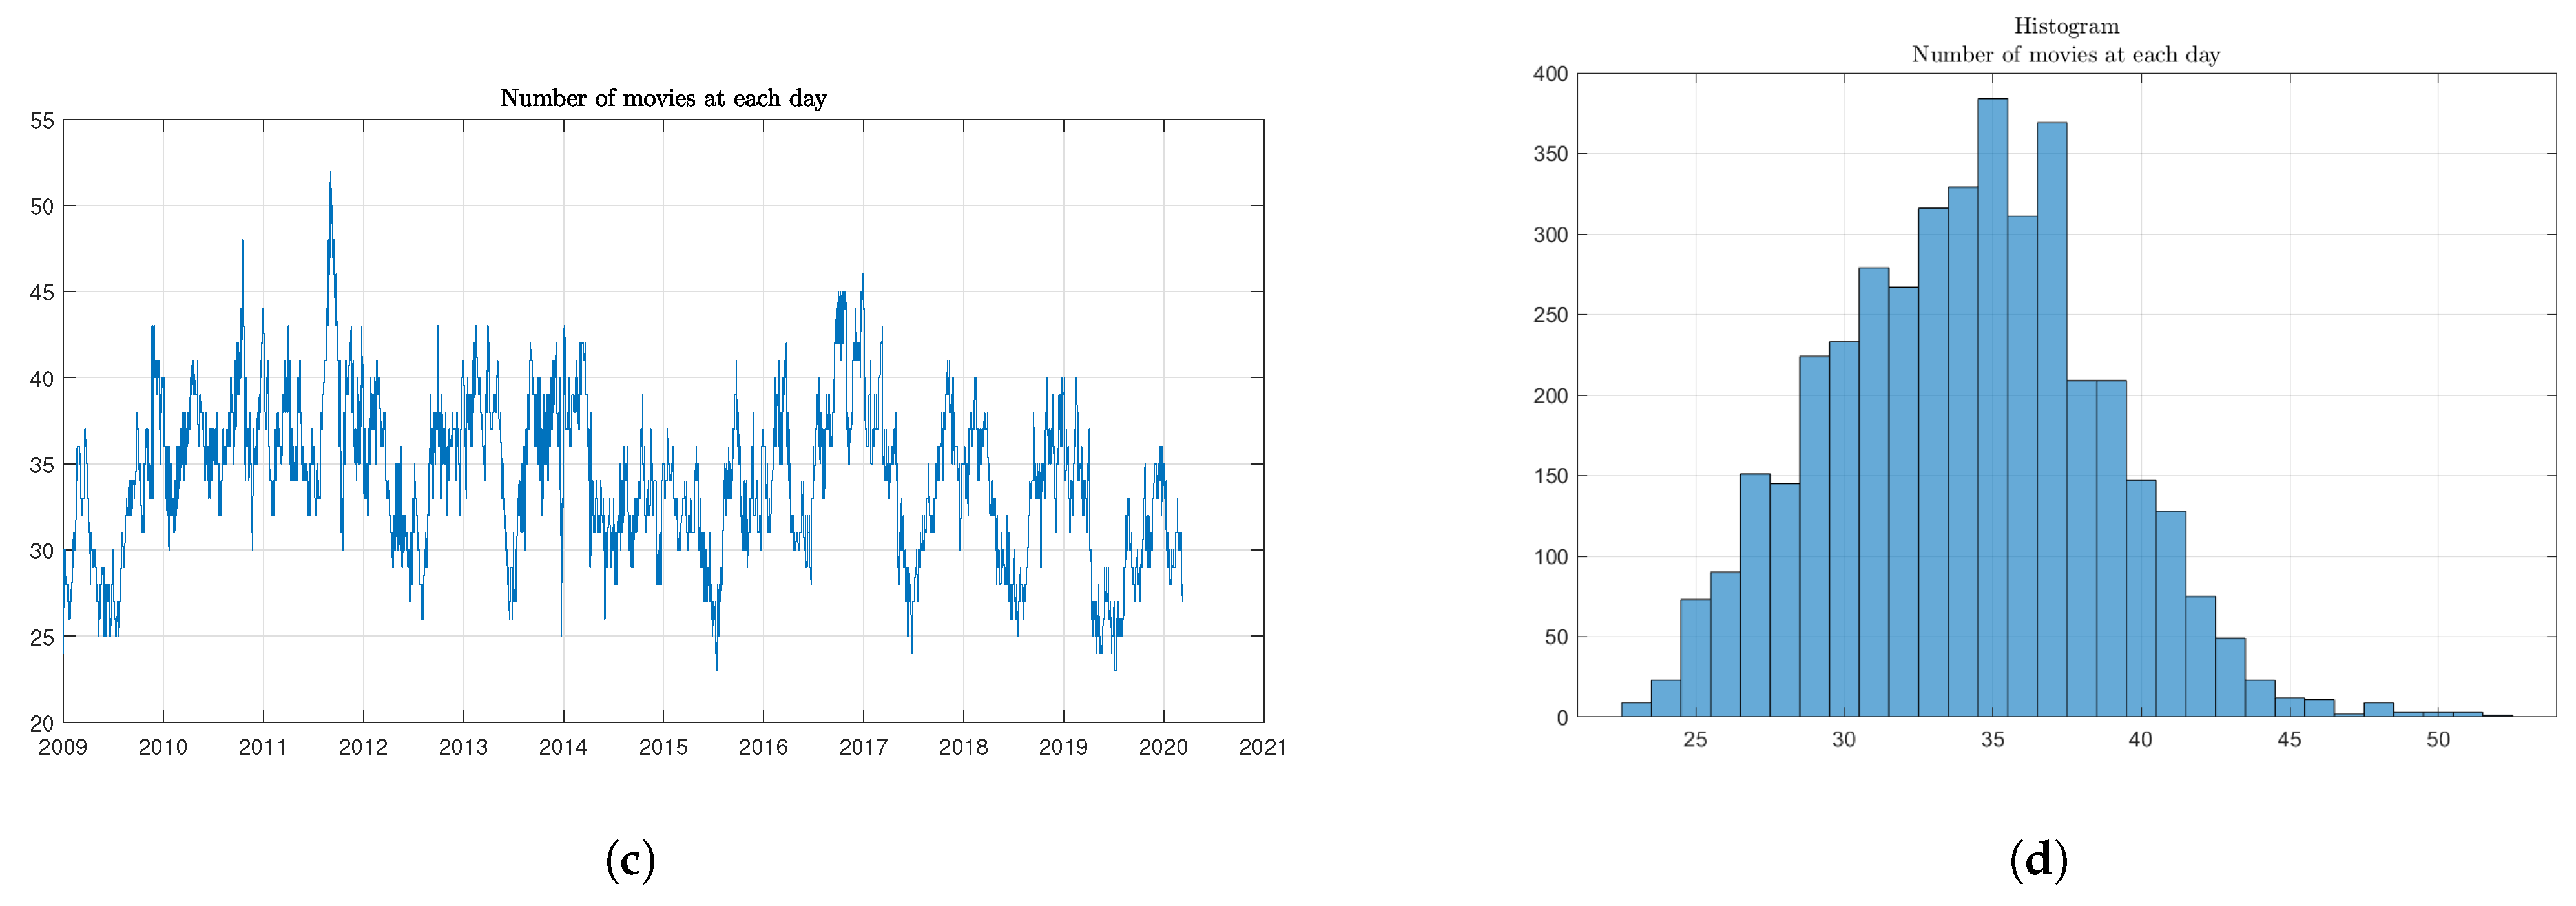
| 3. | The choice of the period was motivated by the quality of data: we noticed a structural change in the number of daily data before 1 January 2009. |
| 4. | The production cost , or “negative cost” in the parlance of the film industry, does not include expenditures related to distribution or marketing. |
| 5. | We refer here to the definition of CVaR given in Rockafellar and Uryasev (2000). |
| 6. | In a more rigorous approach we would multiply the ratio by the cost of money between and t. |
| 7. | Even with media conglomerate partners, escalating budgets—average production costs in 1985 were USD 17 M, in 2013 USD 93 M—encouraged and sometimes forced film companies to trade “a share of potential profits in successful films for less overall risk” by seeking “outside off-balance-sheet financing through investor partnerships and rights deals with foreign distributors” Landry and Greenwald (2018). |
| 8. | Goldman’s full quote is: “NOBODY KNOWS ANYTHING – Not one person in the entire motion picture field knows for a certainty what’s going to work. Every time out it’s a guess—and, if you’re lucky, an educated one.” Film industry economic scholars have studied the conditions of such uncertainty across several published articles; De Vany, in fact, states it thus: “Past success does not predict future success because a movie’s box-office possibilities are Lévy-distributed. Forecasts of expected revenues are meaningless because the possibilities do not converge on a mean; they diverge over the entire outcome space with an infinite variance” De Vany (2004). See also: De Vany and Walls (2004), Walls (2005). |
| 9. | In the case of films produced by major studios such as Paramount, the producer and distributor are generally the same company. |
| 10. | This is in contrast with indexes constructed on moving averages or other functions that combine market data from different dates. |
| 11. | Our data ends here as this was the last date that the majority of theaters in the U.S. were open before the widespread closures due to concerns related to COVID-19. |
| 12. | Specifically, we have checked all possible combinations of autoregressive and moving average coefficients up to three lags, and all combinations of lags in for seasonal coefficients. |
| 13. | The main challenge to this has come from Warner Bros. (whose parent company AT&T also owns the upstart streaming service HBO Max), which declared that all of their 2021 theatrical releases will also release to that streamer on the same date, zeroing out the so-called “window” between theatrical release and that traditional ancillary market in an effort to attract customers to the parent’s new subscription service. More recently, they have announced their intent to return to the traditional model in 2022 but shorten the window to 45 days from the pre-COVID norm of 90. |
| 14. | Classical Hollywood was made up of eight major studios—the “Big 5” and “Little 3”: Paramount, 20th-Century Fox, Warner Bros., MGM, and RKO were all fully vertically integrated; Columbia and Universal were partially integrated and United Artists was primarily a distribution company. The initial conglomerates that purchased film studios were generally not media conglomerates. |
| 15. | For a useful infographic on the make-up and relative capitalization of these media conglomerates, see recode’s “Media Landscape” Molla and Kafka (2021). |
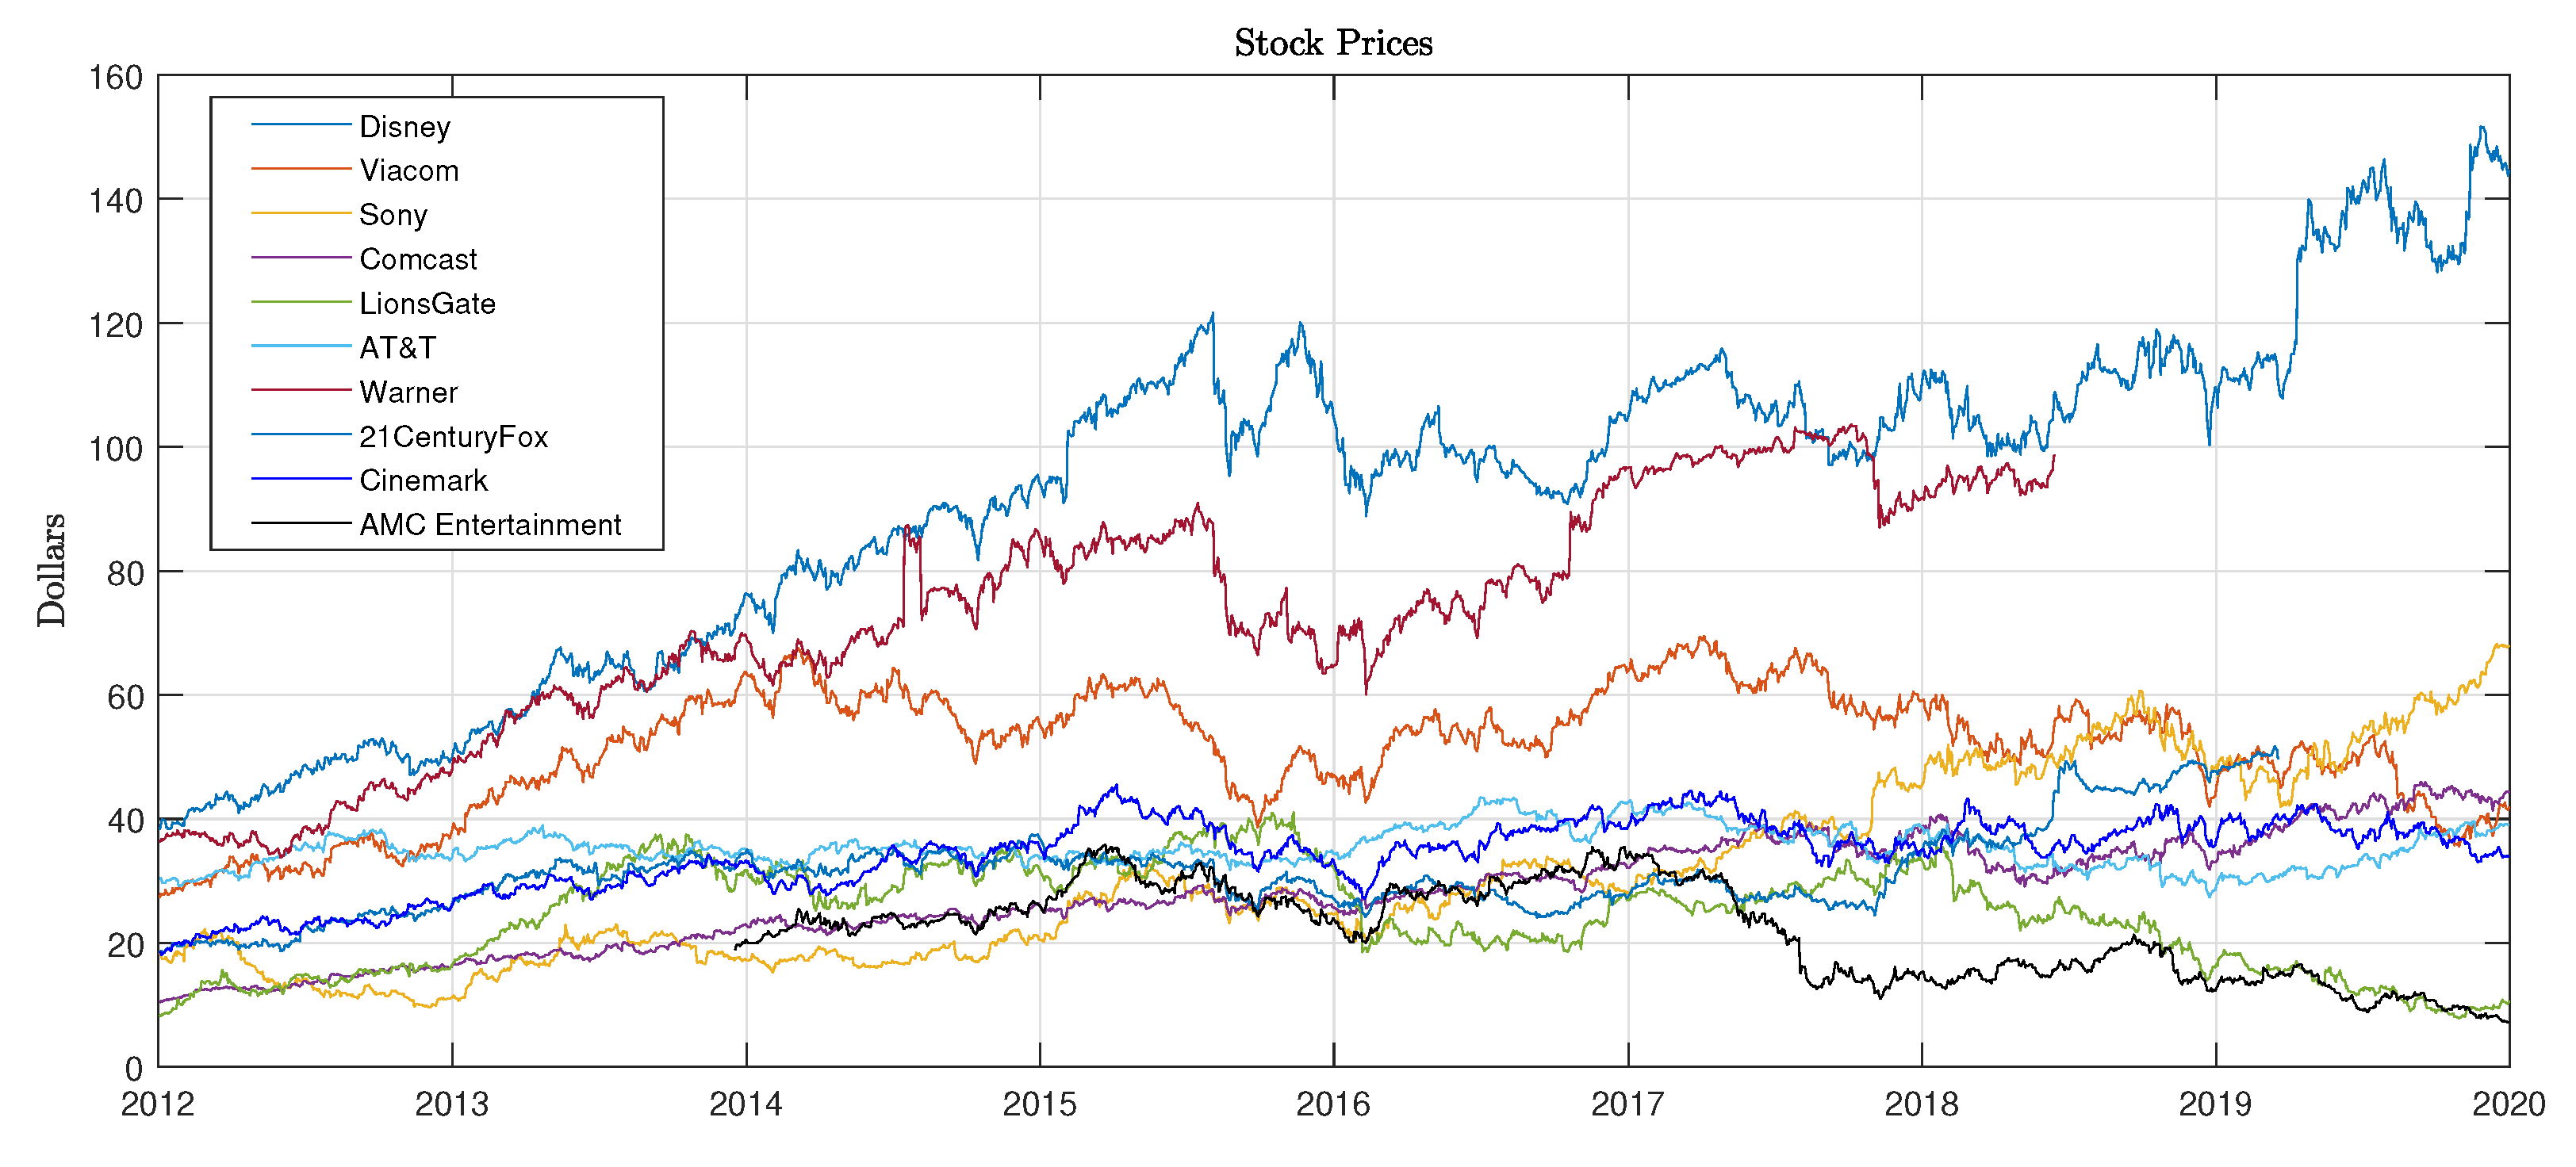
| 16. | AT&T joined the market on 12 June 2018, with the acquisition of the Warner corporation. Disney’s acquisition of Twenty-First Century Fox occurred on 20 March 2019, though Fox’s broadcasting and cable sectors were not part of that merger. VIA changed to VIAC and moved from NYSE to NASDAQ on 5 December 2019, as a result of the merger of CBS Corporation and Viacom. |
| 17. | MGM (Metro-Goldwyn-Mayer Pictures) is still a private company and not publicly traded; the MGM casino and resort company has been separate from the film production company since 1980. |
| 18. | The choice of autoregression lags has been done based on information criteria BIC and AIC. |
| 19. | See Mainik and Schaanning (2014) for a detailed analysis of the two measures. |
| 20. | See, for instance, Mainik and Schaanning (2014). |
| 21. | Similar results have been obtained by considering the capitalization-weighted version of the stock index , where in this case we used the value-weighted CRSP index as regressor. We have also checked for dependencies at different lags by coupling the two series at different dates: in this case we again find no signals of dependency. |
References
- 111th Congress of the United States. 2010. Dodd-Frank Wall Street Reform and Consumer Protection Act of 2010. Washington, DC: Government Publishing Office, pp. 1376–2223. [Google Scholar]
- Anderson, Paul G. 2011. Back to the future[s]: A critical look at the film futures ban. Cardozo Arts & Entertainment Law Journal 29: 179–214. [Google Scholar]
- Angeli, Michael. 1991. Film; My Name Is Bond. Completion Bond. New York Times, August 11. [Google Scholar]
- Avellaneda, Marco, Robert Buff, Craig Friedman, Nicolas Grandechamp, Lukasz Kruck, and Joshua Newman. 2001. Weighted Monte Carlo: A new technique for calibrating asset-pricing models. International Journal of Theoretical and Applied Finance 4: 91–119. [Google Scholar] [CrossRef]
- Barndorff-Nielsen, Ole E. 1977. Exponentially decreasing distributions for the logarithm of particle size. Proceedings of The Royal Society A: Mathematical, Physical and Engineering Sciences 353: 401–19. [Google Scholar]
- Barndorff-Nielsen, Ole E. 1997a. Normal inverse Gaussian distributions and stochastic volatility modelling. Scandinavian Journal of Statistics 24: 1–13. [Google Scholar] [CrossRef]
- Barndorff-Nielsen, Ole E. 1997b. Processes of normal inverse Gaussian type. Finance and Stochastics 2: 41–68. [Google Scholar] [CrossRef]
- Bordwell, David, Janet Staiger, and Kristin Thompson. 1985. The Classical Hollywood Cinema: Film Style & Mode of Production to 1960. New York: Columbia University Press. [Google Scholar]
- Boyle, Charles. 2001. Hollywood and the insurance industry. Insurance Journal. September 17. Available online: https://www.insurancejournal.com/magazines/mag-features/2001/09/17/18502.htm (accessed on 19 April 2021).
- Burns, Michael. 2010. Letter to House Committee on Agriculture. Available online: https://www.cftc.gov/sites/default/files/stellent/groups/public/@otherif/documents/ifdocs/mburnshousecomitteeag041610.pdf (accessed on 19 April 2021).
- Caves, Richard. 2000. Creative Industries: Contracts between Art and Commerce. Cambridge: Harvard University Press. [Google Scholar]
- De Vany, Arthur. 2004. Hollywood Economics: How Extreme Uncertainty Shapes the Film Industry. London: Routledge. [Google Scholar]
- De Vany, Arthur, and W. David Walls. 2002. Does hollywood make too many R-rated movies? risk, stochastic dominance, and the illusion of expectation. Journal of Business 75: 425–51. [Google Scholar] [CrossRef]
- De Vany, Arthur, and W. David Walls. 2004. Motion picture profit, the stable Paretian hypothesis, and the curse of the superstar. Journal of Economic Dynamics and Control 28: 1035–57. [Google Scholar] [CrossRef]
- Dekom, Peter J. 2017. Movies, money and madness. In The Movie Business Book, 4th ed. Edited by Jason E. Squire. London: Routledge, pp. 99–115. [Google Scholar]
- Delbaen, Freddy, and Walter Schachermayer. 1994. A general version of the fundamental theorem of asset pricing. Mathematische Annalen 300: 463–520. [Google Scholar] [CrossRef]
- Eberlein, Ernst, and Ulrich Keller. 1995. Hyperbolic distributions in finance. Bernoulli 1: 281–99. [Google Scholar] [CrossRef]
- Elberse, Anita. 2007. The power of stars: Do star actors drive the success of movies? Journal of Marketing 71: 102–20. [Google Scholar] [CrossRef]
- Filson, Darren, David Switzer, and Portia Besocke. 2005. At the movies: The economics of exhibition contracts. Economic Inquiry 43: 354–69. [Google Scholar] [CrossRef]
- Girardi, Giulio, and A. Tolga Ergun. 2013. Systemic risk measurement: Multivariate garch estimation of coVaR. Journal of Banking & Finance 37: 3169–80. [Google Scholar]
- Graser, Marc. 2010. Basic instincts: Pic futures reward biz savvy. Variety 418: 25. [Google Scholar]
- Hall, Sheldon, and Steve Neale. 2010. Epics, Spectacles, and Blockbusters: A Hollywood History. Detroit: Wayne State University Press. [Google Scholar]
- Huang, Wei-Qiang, and Stanislav P. Uryasev. 2018. The CoCVaR approach: Systemic risk contribution measurement. Journal of Risk 20: 4. [Google Scholar] [CrossRef] [Green Version]
- Hylleberg, Svend, Robert Engle, Clive Granger, and Byung Sam Yoo. 1990. Seasonal integration and cointegration. Journal of Econometrics 44: 215–38. [Google Scholar] [CrossRef]
- King, Geoff. 2002. New Hollywood Cinema: An Introduction. London: I.B. Tauris Publishers. [Google Scholar]
- Kwiatkowski, Denis, Peter Phillips, Peter Schmidt, and Yongcheol Shin. 1992. Testing the null hypothesis of stationarity against the alternative of a unit root: How sure are we that economic time series have a unit root? Journal of Econometrics 54: 159–78. [Google Scholar] [CrossRef]
- Landry, Paula, and Stephen R. Greenwald. 2018. The Business of Film: A Practical Introduction. Boca Raton: CRC Press. [Google Scholar]
- Madan, Dilip B., and Eugene Seneta. 1990. The variance gamma (v.g.) model for share market returns. Journal of Business 63: 511–24. [Google Scholar] [CrossRef]
- Mainik, Georg, and Eric Schaanning. 2014. On dependence consistency of covar and some other systemic risk measures. Statistics & Risk Modeling 31: 49–77. [Google Scholar]
- Masters, Kim. 2014. ’Fast & Furious 7’ Insurance Claim Could Reach Record-Breaking $50 Million. Hollywood Reporter, May 21. [Google Scholar]
- Meehan, Eileen R. 2008. Ancillary markets—Television: From challenge to safe haven. In The Contemporary Hollywood Film Industry. Edited by Peter McDonald and Janet Wasko. Oxford: Blackwell Publishing, pp. 106–19. [Google Scholar]
- Molla, Rani, and Peter Kafka. 2021. Here’s Who Owns Everything in Big Media Today. Vox, January 11. [Google Scholar]
- Phillips, Richard. 2004. The global export of risk: Finance and the film business. Competition & Change 8: 105–36. [Google Scholar]
- PwC. 2019. PriceWaterhouseCoopers 2019–2023 Global Entertainment and Media Outlook. London: PwC. [Google Scholar]
- Ravid, S. Abraham. 1999. Information, blockbusters, and stars: A study of the film industry. Journal of Business 72: 463–92. [Google Scholar] [CrossRef] [Green Version]
- Raviv, Shaun. 2018. Box Office Bomb: The Short Life of Popcorn Prediction Markets. The Ringer, November 15. [Google Scholar]
- Rockafellar, R. Tyrrell, and Stanislav Uryasev. 2000. Optimization of conditional value-at-risk. Journal of risk 2: 21–42. [Google Scholar] [CrossRef] [Green Version]
- Schatz, Tom. 2008. The studio system and conglomerate Hollywood. In The Contemporary Hollywood Film Industry. Edited by Peter McDonald and Janet Wasko. Oxford: Blackwell Publishing, pp. 3–42. [Google Scholar]
- Sedgwick, John. 2002. Product differentiation at the movies: Hollywood, 1946 to 1965. Journal of Economic History 62: 676–705. [Google Scholar] [CrossRef]
- Simonton, Dean Keith. 2009. Cinematic success criteria and their predictors: The art and business of the film industry. Psychology & Marketing 26: 400–20. [Google Scholar]
- TheNumbers. 2020. Movie Theatrical Daily Box Office Chart Archive. Beverly Hills: TheNumbers. [Google Scholar]
- Vogel, Harold L. 2014. Entertainment Industry Economics: A Guide for Financial Analysis, 9th ed. Cambridge: Cambridge University Press. [Google Scholar]
- Walls, W. David. 2005. Modeling movie success when ‘nobody knows anything’: Conditional stable-distribution analysis of film returns. Journal of Cultural Economics 29: 177–90. [Google Scholar] [CrossRef]
- Wyatt, Justin. 2015. High Concept: Movies and Marketing in Hollywood. Austin: University of Texas Press. [Google Scholar]


Publisher’s Note: MDPI stays neutral with regard to jurisdictional claims in published maps and institutional affiliations. |
© 2021 by the authors. Licensee MDPI, Basel, Switzerland. This article is an open access article distributed under the terms and conditions of the Creative Commons Attribution (CC BY) license (https://creativecommons.org/licenses/by/4.0/).
Share and Cite
Lauria, D.; Phillips, W.D. Insuring Hollywood: A Movie Returns Index and the American Stock Market. J. Risk Financial Manag. 2021, 14, 189. https://doi.org/10.3390/jrfm14050189
Lauria D, Phillips WD. Insuring Hollywood: A Movie Returns Index and the American Stock Market. Journal of Risk and Financial Management. 2021; 14(5):189. https://doi.org/10.3390/jrfm14050189
Chicago/Turabian StyleLauria, Davide, and Wyatt D. Phillips. 2021. "Insuring Hollywood: A Movie Returns Index and the American Stock Market" Journal of Risk and Financial Management 14, no. 5: 189. https://doi.org/10.3390/jrfm14050189
APA StyleLauria, D., & Phillips, W. D. (2021). Insuring Hollywood: A Movie Returns Index and the American Stock Market. Journal of Risk and Financial Management, 14(5), 189. https://doi.org/10.3390/jrfm14050189