
Persistence in the Realized Betas: Some Evidence from the Stock Market


Abstract
1. Introduction
2. Literature Review
2.1. Time-Varying Betas
2.2. Long Memory in Asset Pricing
3. Methodology
4. Data Description
5. Discussion of the Empirical Results
6. Conclusions
Author Contributions
Funding
Institutional Review Board Statement
Informed Consent Statement
Data Availability Statement
Acknowledgments
Conflicts of Interest
| 1 | http://pages.stern.nyu.edu/~adamodar/New_Home_Page/datafile/variable.htm (accessed on 4 February 2022). |
References
- Abbritti, Mirko, Luis A. Gil-Alana, Yuliya Lovcha, and Antonio Moreno. 2016. Term structure persistence. Journal of Financial Econometrics 14: 331–52. [Google Scholar] [CrossRef]
- Andersen, Torben G., and Tim Bollerslev. 1997. Heterogeneous Information Arrivals and Return Volatility Dynamics: Uncovering the Long-Run in High Frequency Returns. Journal of Finance 52: 975–1005. [Google Scholar]
- Andersen, Torben G., Tim Bollerslev, Francis X. Diebold, and Jin Wu. 2005. A framework for exploring macroeconomic determinants of systematic risk. American Economic Review 95: 398–404. [Google Scholar] [CrossRef]
- Andersen, Torben G., Tim Bollerslev, Francis X. Diebold, and Jin Wu. 2006. Realized beta: Persistence and predictability. In Advances in Econometrics: Econometric Analysis of Economic and Financial Time Series. Edited by Thomas B. Fomby. In Honor of Rob F. Engle and Clive W. J. Granger. Greenwich: JAI Press, pp. 1–40. [Google Scholar]
- Andersen, Torben G., Tim Bollerslev, Francis X. Diebold, and Paul Labys. 2003. Modeling and Forecasting Realized Volatility. Econometrica-Evanston 71: 579–626. [Google Scholar] [CrossRef]
- Ang, Andrew, and Dennis Kristensen. 2011. Testing Conditional Factor Models. NBER Working Paper No. w17561. Available online: https://ssrn.com/abstract=1954488 (accessed on 31 March 2024).
- Ang, Andrew, and Joseph Chen. 2007. CAPM over the long run: 1926–2001. Journal of Empirical Finance 14: 1–40. [Google Scholar] [CrossRef]
- Bai, Hang, Kewei Hou, Howard Kung, Erica X. N. Li, and Lu Zhang. 2019. The CAPM strikes back? An equilibrium model with disasters. Journal of Financial Economics 131: 269–98. [Google Scholar] [CrossRef]
- Baillie, Richard T. 1996. Long memory processes and fractional integration in econometrics. Journal of Econometrics 73: 5–59. [Google Scholar] [CrossRef]
- Baillie, Richard T., Tim Bollerslev, and Hans Ole Mikkelsen. 1996. Fractionally Integrated Generalized Autoregressive Conditional Heteroskedasticity. Journal of Econometrics 74: 3–30. [Google Scholar] [CrossRef]
- Bali, Turan G., Robert F. Engle, and Yi Tang. 2017. Dynamic conditional beta is alive and well in the cross section of daily stock returns. Management Science 63: 3760–79. [Google Scholar] [CrossRef]
- Balvers, Ronald, Yangru Wu, and Erik Gilliland. 2000. Mean reversion across national stock markets and parametric contrarian investment strategies. Journal of Finance 55: 745–72. [Google Scholar] [CrossRef]
- Bollerslev, Tim, and Hans Ole Mikkelsen. 1996. Modeling and Pricing Long Memory in Stock Market Volatility. Journal of Econometrics 73: 151–84. [Google Scholar] [CrossRef]
- Bollerslev, Tim, and Hans Ole Mikkelsen. 1999. Long-Term Equity Anticipation Securities and Stock Market Volatility Dynamics. Journal of Econometrics 92: 75–99. [Google Scholar] [CrossRef]
- Bollerslev, Tim, Daniela Osterrieder, Natalia Sizova, and George Tauchen. 2013. Risk and return: Long-run relations, fractional cointegration, and return predictability. Journal of Financial Economics 108: 409–24. [Google Scholar] [CrossRef]
- Bollerslev, Tim, George Tauchen, and Hao Zhou. 2009. Expected Stock Returns and Variance Risk Premia. The Review of Financial Studies 22: 4463–92. [Google Scholar] [CrossRef]
- Bollerslev, Tim, Julia Litvinova, and George Tauchen. 2006. Leverage and volatility feedback effects in high-frequency data. Journal of Financial Econometrics 4: 353–84. [Google Scholar] [CrossRef]
- Bollerslev, Tim, Michael Gibson, and Hao Zhou. 2011. Dynamic estimation of volatility risk premia and investor risk aversion from option-implied and realized volatilities. Journal of Econometrics 160: 235–45. [Google Scholar] [CrossRef]
- Bollerslev, Tim, Natalia Sizova, and George Tauchen. 2012. Volatility in equilibrium: Asymmetries and dynamic dependencies. Review of Finance 16: 31–80. [Google Scholar] [CrossRef]
- Bollerslev, Tim, Robert F. Engle, and Jeffrey M. Wooldridge. 1988. A Capital Asset Pricing Model with Time-Varying Covariances. Journal of Political Economy 96: 116–31. [Google Scholar] [CrossRef]
- Bollerslev, Tim, Sophia Zhengzi Li, and Viktor Todorov. 2016. Roughing Up Beta: Continuous Versus Discontinuous Betas and the Cross Section of Expected Stock Returns. Journal of Financial Economics 120: 464–90. [Google Scholar] [CrossRef]
- Boubaker, Heni, and Nadia Sghaier. 2013. Portfolio optimization in the presence of dependent financial returns with long memory: A copula based approach. Journal of Banking & Finance 37: 361–77. [Google Scholar] [CrossRef]
- Buss, Adrian, and Grigory Vilkov. 2012. Measuring Equity Risk with Option-Implied Correlations. Review of Financial Studies 25: 3113–40. [Google Scholar] [CrossRef]
- Campbell, John Y., Andrew W. Lo, A. Craig MacKinlay, and Robert F. Whitelaw. 1997. The Econometrics of Financial Markets. Princeton: Princeton University Press. [Google Scholar]
- Cenesizoglu, Tolga, and Jonathan J. Reeves. 2018. CAPM, components of beta and the cross section of expected returns. Journal of Empirical Finance 49: 223–46. [Google Scholar] [CrossRef]
- Cenesizoglu, Tolga, Qianqiu Liu, Jonathan J. Reeves, and Haifeng Wu. 2016. Monthly beta forecasting with low, medium and high frequency stock returns. Journal of Forecasting 35: 528–41. [Google Scholar] [CrossRef]
- Cochran, Steven J., and Robert H. DeFina. 1995. Mean Reversion in Stock Prices: Tests Using Duration Models. Managerial Finance 21: 3–24. [Google Scholar] [CrossRef]
- Dahlhaus, Rainer. 1989. Efficient parameter estimation for self-similar processes. Annals of Statistics 17: 1749–66. [Google Scholar] [CrossRef]
- Ding, Zhuanxin, Clive W. J. Granger, and Robert F. Engle. 1993. A Long Memory Property of Stock Market Returns and a New Model. Journal of Empirical Finance 1: 83–106. [Google Scholar] [CrossRef]
- Dybvig, Philip H., and Stephen A. Ross. 1985a. Differential Information and Performance Measurement Using a Security Market Line. The Journal of Finance 40: 383–99. [Google Scholar] [CrossRef]
- Dybvig, Philip H., and Stephen A. Ross. 1985b. The Analytics of Performance Measurement Using a Security Market Line. The Journal of Finance 40: 401–16. [Google Scholar] [CrossRef]
- Engle, Robert F. 2016. Dynamic Conditional Beta. Journal of Financial Econometrics 14: 643–67. [Google Scholar] [CrossRef]
- Engle, Robert F., and Jose Gonzalo Rangel. 2010. High and Low Frequency Correlations in Global Equity Markets. Working Paper. New York: Stern School of Business, New York University. [Google Scholar]
- Fama, Eugene F., and James D. MacBeth. 1973. Risk, Return, and Equilibrium: Empirical Tests. Journal of Political Economy 81: 607–36. [Google Scholar] [CrossRef]
- Fama, Eugene F., and Kenneth R. French. 1992. The Cross Section of Expected Stock Returns. Journal of Finance 47: 427–65. [Google Scholar]
- Fama, Eugene F., and Kenneth R. French. 1993. Common Risk Factors in the Returns on Stocks and Bonds. Journal of Financial Economics 33: 3–56. [Google Scholar] [CrossRef]
- Fama, Eugene F., and Kenneth R. French. 2015. A five-factor asset pricing model. Journal of Financial Economics 116: 1–22. [Google Scholar] [CrossRef]
- Fernandez, Pablo. 2015. CAPM: An Absurd Model. Business Valuation Review 34: 4–23. [Google Scholar] [CrossRef]
- Fernandez, Pablo. 2019. CAPM: An Absurd Model. Reviewed in 2019. First published 2014. Available online: https://ssrn.com/abstract=2505597 (accessed on 31 March 2024).
- Ferson, Wayne E., and Campbell R. Harvey. 1991. The Variation of Economic Risk Premiums. Journal of Political Economy 99: 385–415. [Google Scholar] [CrossRef]
- Ferson, Wayne E., Shmuel Kandel, and Robert F. Stambaugh. 1987. Tests of Asset Pricing with Time-Varying Expected Risk Premiums and Market Betas. The Journal of Finance 42: 201–20. [Google Scholar] [CrossRef]
- Frazzini, Andrea, and Lasse Heje Pedersen. 2014. Betting against beta. Journal of Financial Economics 111: 1–25. [Google Scholar] [CrossRef]
- Garleanu, Nicolae, and Lasse Heje Pedersen. 2011. Margin-based asset pricing and deviations from the law of one price. The Review of Financial Studies 24: 1980–2022. [Google Scholar] [CrossRef]
- Gil-Alana, Luis A., and Antonio Moreno. 2012. Uncovering the US term premium. Journal of Banking and Finance 36: 1181–93. [Google Scholar] [CrossRef]
- Gil-Alana, Luis A., and Peter M. Robinson. 1997. Testing of unit roots and other nonstationary hypothesis in macroeconomic time series. Journal of Econometrics 80: 241–68. [Google Scholar] [CrossRef]
- Granger, Clive W. J. 1980. Long memory relationships and the aggregation of dynamic models. Journal of Econometrics 14: 227–38. [Google Scholar] [CrossRef]
- Granger, Clive W. J. 1981. Some properties of time series data and their use in econometric model specification. Journal of Econometrics 16: 121–30. [Google Scholar] [CrossRef]
- Granger, Clive W. J., and Roselyne Joyeux. 1980. An introduction to long memory time series and fractional differencing. Journal of Time Series Analysis 1: 15–29. [Google Scholar] [CrossRef]
- Hansen, Peter Reinhard, Asger Lunde, and Valeri Voev. 2014. Realized Beta GARCH: A Multivariate GARCH Model with Realized Measures of Volatility. Journal of Applied Econometrics 29: 774–99. [Google Scholar] [CrossRef]
- Hollstein, Fabian, and Marcel Prokopczuk. 2016. Estimating Beta. Journal of Financial and Quantitative Analysis 51: 1437–66. [Google Scholar] [CrossRef]
- Hollstein, Fabian, Marcel Prokopczuk, and Chardin Wese Simen. 2019. The Conditional CAPM Revisited: Evidence from High-Frequency Betas. Management Science. Forthcoming. Available online: https://ssrn.com/abstract=3334524 (accessed on 31 March 2024).
- Hosking, J. R. M. 1981. Fractional differencing. Biometrika 68: 165–76. [Google Scholar] [CrossRef]
- Jagannathan, Ravi, and Zhenyu Wang. 1996. The Conditional CAPM and the Cross Section of Expected Returns. Journal of Finance 51: 3–53. [Google Scholar]
- Jayasinghe, Prabhath, Albert K. Tsui, and Zhaoyong Zhang. 2014. New estimates of time-varying currency betas: A trivariate BEKK approach. Economic Modelling 42: 128–39. [Google Scholar] [CrossRef]
- Lintner, John. 1965. The Valuation of Risk Assets and the Selection of Risky Investments in Stock Portfolios and Capital Budgets. Review of Economics and Statistics 47: 13–37. [Google Scholar] [CrossRef]
- Lu, Zhongjin, and Scott Murray. 2017. Bear Beta. Journal of Financial Economics 131: 736–90. [Google Scholar] [CrossRef]
- Mandelbrot, Benoit B., and John W. Van Ness. 1968. Fractional Brownian motions, fractional noises and applications. SIAM Review 10: 422–37. [Google Scholar] [CrossRef]
- Mayoral, Laura. 2006. Further evidence on the statistical properties of real GNP. Oxford Bulletin of Economics and Statistics 68: 901–20. [Google Scholar] [CrossRef]
- Morana, Claudio. 2009. Realized Betas and the Cross-Section of Expected Returns. Applied Financial Economics 19: 1371–81. [Google Scholar] [CrossRef]
- Mossin, Jan. 1966. Equilibrium in a Capital Asset Market. Econometrica 34: 768–83. [Google Scholar] [CrossRef]
- Papageorgiou, Nicolas, Jonathan J. Reeves, and Xuan Xie. 2016. Betas and the myth of market neutrality. International Journal of Forecasting 32: 548–58. [Google Scholar] [CrossRef]
- Patton, Andrew J., and Michela Verardo. 2012. Does Beta Move with News? Firm-Specific Information Flows and Learning about Profitability. Review of Financial Studies. Forthcoming. Available online: https://ssrn.com/abstract=1361813 (accessed on 31 March 2024).
- Pyun, Sungjune. 2019. Variance risk in aggregate stock returns and time-varying return predictability. Journal of Financial Economics 132: 150–74. [Google Scholar] [CrossRef]
- Rangel, José Gonzalo, and Robert F. Engle. 2012. The factor-spline-GARCH model for high and low frequency correlations. Journal of Business and Economic Statistics 30: 109–24. [Google Scholar] [CrossRef]
- Robinson, Peter M. 1991. Testing for Strong Serial Correlation and Dynamic Conditional Heteroskedasticity in Multiple Regression. Journal of Econometrics 47: 67–84. [Google Scholar] [CrossRef]
- Robinson, Peter M. 1994. Efficient tests of nonstationary hypotheses. Journal of the American Statistical Association 89: 1420–37. [Google Scholar] [CrossRef]
- Robinson, Peter M. 1995. Log-Periodogram Regression of Time Series with Long-Range Dependence. Annals of Statistics 23: 1048–72. [Google Scholar] [CrossRef]
- Sharma, V. Prateek. 2016. Forecasting stock market volatility using Realized GARCH model: International evidence. The Quarterly Review of Economics and Finance 59: 222–30. [Google Scholar] [CrossRef]
- Sharpe, William F. 1964. Capital asset prices: A theory of market equilibrium under conditions of risk. The Journal of Finance 19: 425–42. [Google Scholar] [CrossRef]
- Todorov, Viktor, and Tim Bollerslev. 2007. Jumps and Betas: A New Framework for Disentangling and Estimating Systematic Risks. CREATES Research Paper No. 2007-15. Available online: https://ssrn.com/abstract=1150066 (accessed on 31 March 2024).
- Treynor, Jack. 1961. Toward a Theory of Market Value Risk Assets. In Asset Pricing and Portfolio Performance. London: Risk Books, pp. 15–22. [Google Scholar]
- Wang, Kevin Q. 2003. Asset pricing with conditioning information: A new test. Journal of Finance 58: 161–196. [Google Scholar] [CrossRef]


| Daily | Weekly | Monthly | Quarterly | Annually | |
|---|---|---|---|---|---|
| Number of textbooks | 7 | 6 | 51 | 1 | 15 |
| Average number of observations used | 489 | 156 | 76 | 16 | 8 |
| Most common number of observations used | 765 | 26 | 60 | 16 | 10 |
| Monthly | Weekly | Daily | |||||||
|---|---|---|---|---|---|---|---|---|---|
| Apple | 5y | 3y | 1y | 5y | 3y | 1y | 5y | 3y | 1y |
| Stdev | 0.306 | 0.449 | 0.843 | 0.093 | 0.206 | 0.370 | 0.128 | 0.183 | 0.290 |
| Average | 1.178 | 1.180 | 1.234 | 1.014 | 1.030 | 1.028 | 1.039 | 1.069 | 1.099 |
| Stdev/average | 0.259 | 0.380 | 0.683 | 0.092 | 0.200 | 0.360 | 0.123 | 0.172 | 0.264 |
| Microsoft | |||||||||
| Stdev | 0.108 | 0.253 | 0.596 | 0.093 | 0.121 | 0.216 | 0.083 | 0.115 | 0.163 |
| Average | 0.984 | 0.947 | 0.911 | 0.957 | 0.964 | 0.952 | 1.070 | 1.070 | 1.066 |
| Stdev/average | 0.109 | 0.267 | 0.655 | 0.097 | 0.125 | 0.227 | 0.077 | 0.107 | 0.153 |
| Homedepot | |||||||||
| Stdev | 0.173 | 0.197 | 0.429 | 0.117 | 0.123 | 0.182 | 0.097 | 0.110 | 0.169 |
| Average | 0.996 | 1.013 | 1.068 | 1.144 | 1.129 | 1.139 | 1.050 | 1.052 | 1.062 |
| Stdev/average | 0.174 | 0.194 | 0.401 | 0.102 | 0.109 | 0.160 | 0.093 | 0.104 | 0.159 |
| Intel | |||||||||
| Stdev | 0.387 | 0.440 | 0.638 | 0.157 | 0.194 | 0.269 | 0.190 | 0.204 | 0.251 |
| Average | 1.232 | 1.256 | 1.277 | 1.173 | 1.195 | 1.207 | 1.198 | 1.219 | 1.247 |
| Stdev/average | 0.314 | 0.351 | 0.499 | 0.134 | 0.162 | 0.223 | 0.158 | 0.168 | 0.202 |
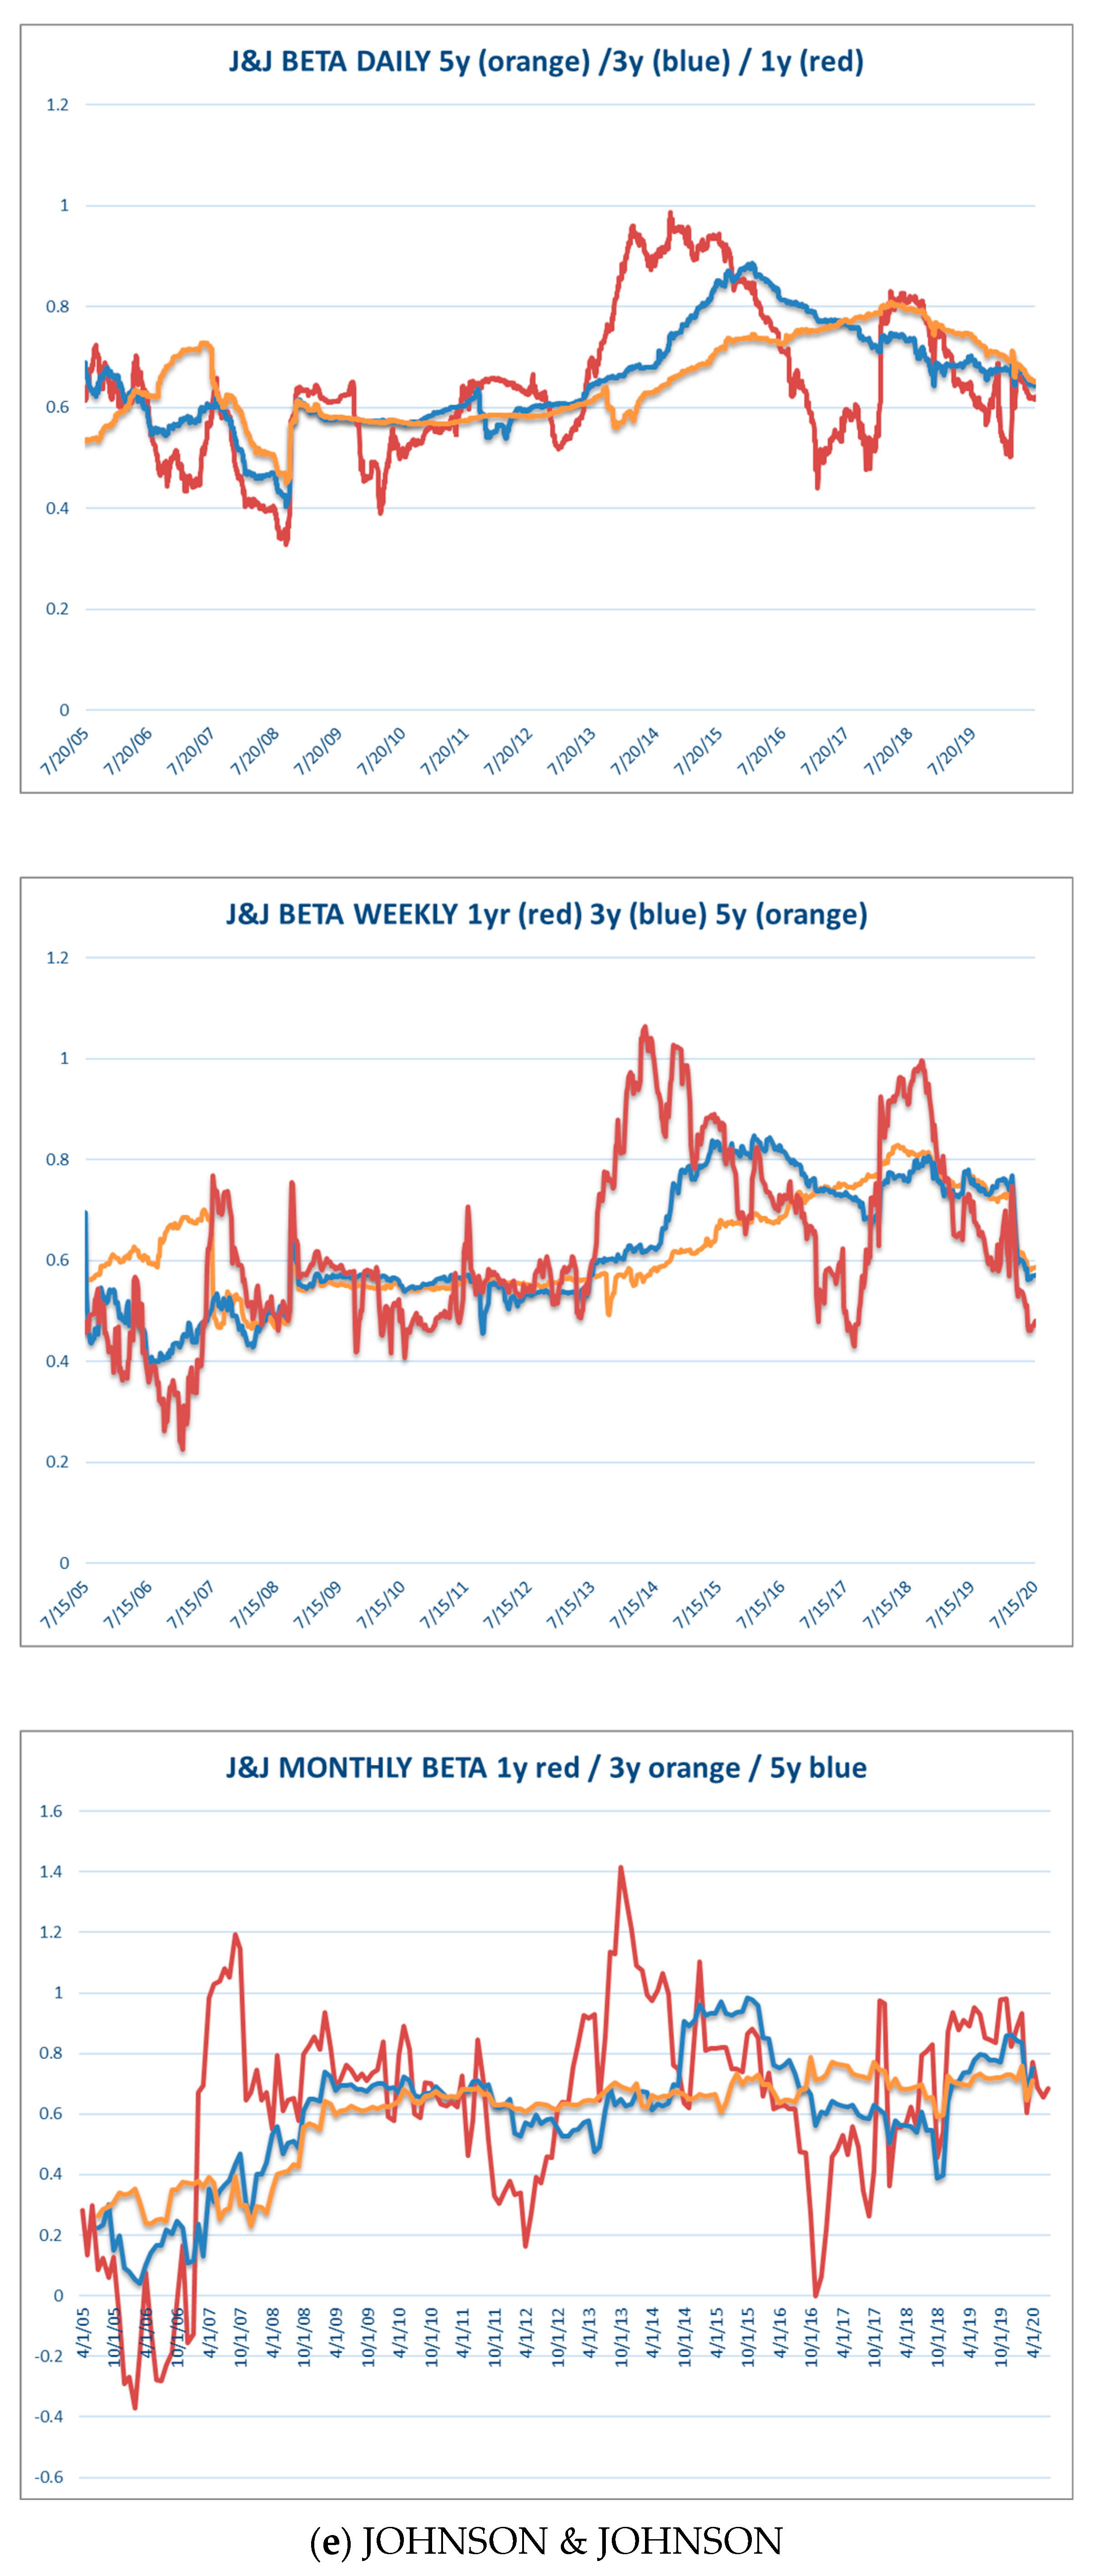
| Johnson & Johnson | |||||||||
| Stdev | 0.150 | 0.215 | 0.334 | 0.093 | 0.120 | 0.181 | 0.084 | 0.097 | 0.162 |
| Average | 0.595 | 0.568 | 0.575 | 0.623 | 0.626 | 0.619 | 0.649 | 0.653 | 0.625 |
| Stdev/average | 0.252 | 0.378 | 0.581 | 0.150 | 0.191 | 0.292 | 0.129 | 0.149 | 0.260 |
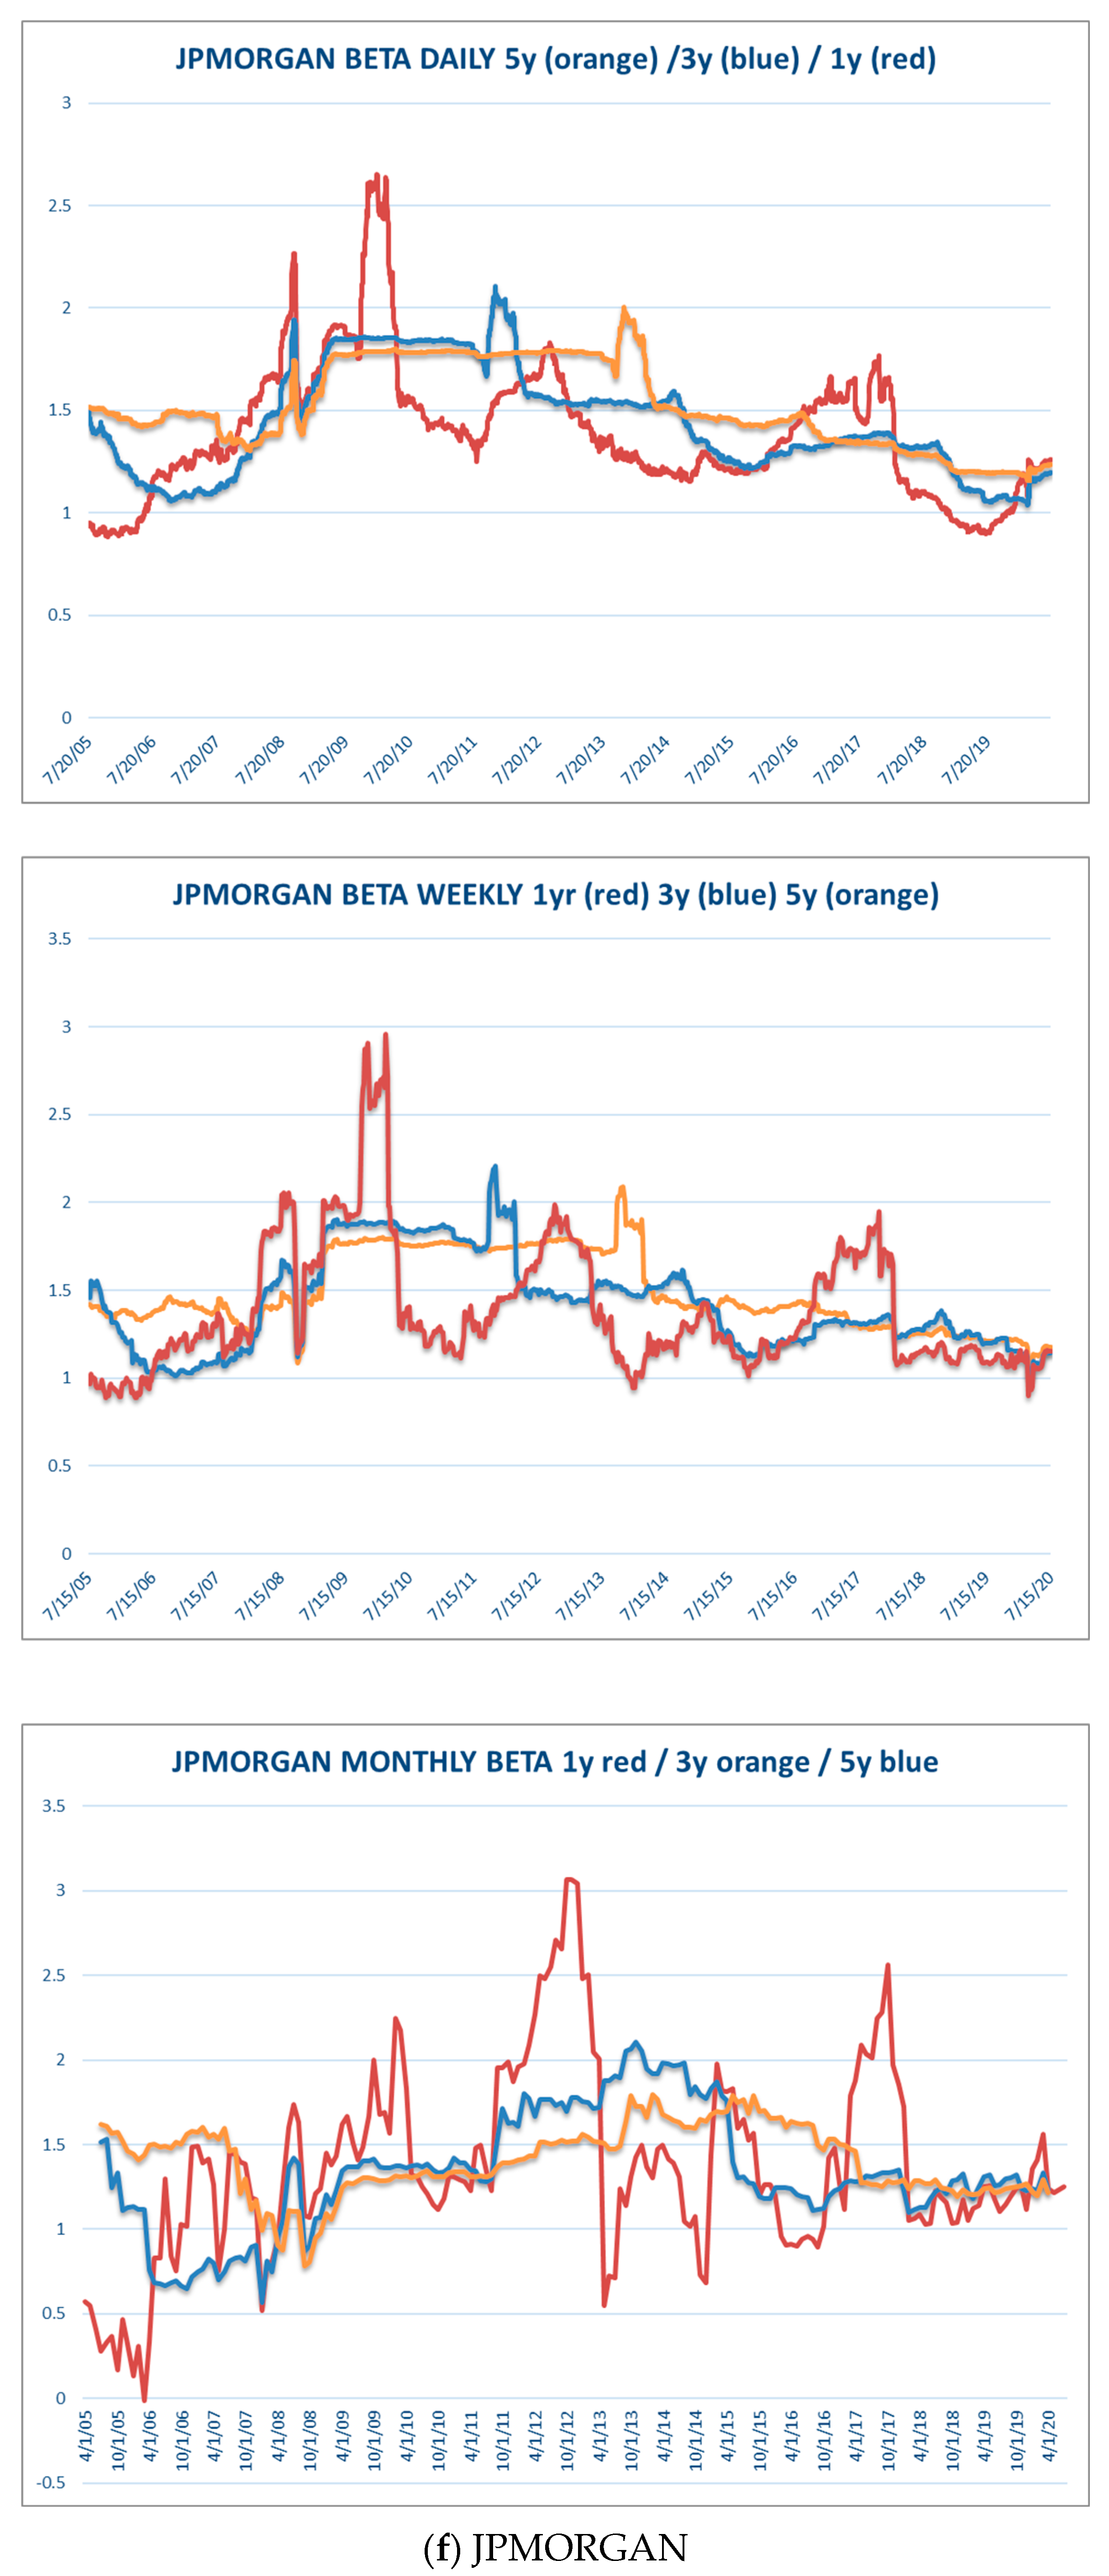
| JPMorgan | |||||||||
| Stdev | 0.206 | 0.344 | 0.539 | 0.219 | 0.256 | 0.351 | 0.210 | 0.249 | 0.308 |
| Average | 1.402 | 1.371 | 1.364 | 1.487 | 1.427 | 1.375 | 1.523 | 1.453 | 1.391 |
| Stdev/average | 0.147 | 0.251 | 0.395 | 0.147 | 0.179 | 0.255 | 0.138 | 0.171 | 0.221 |
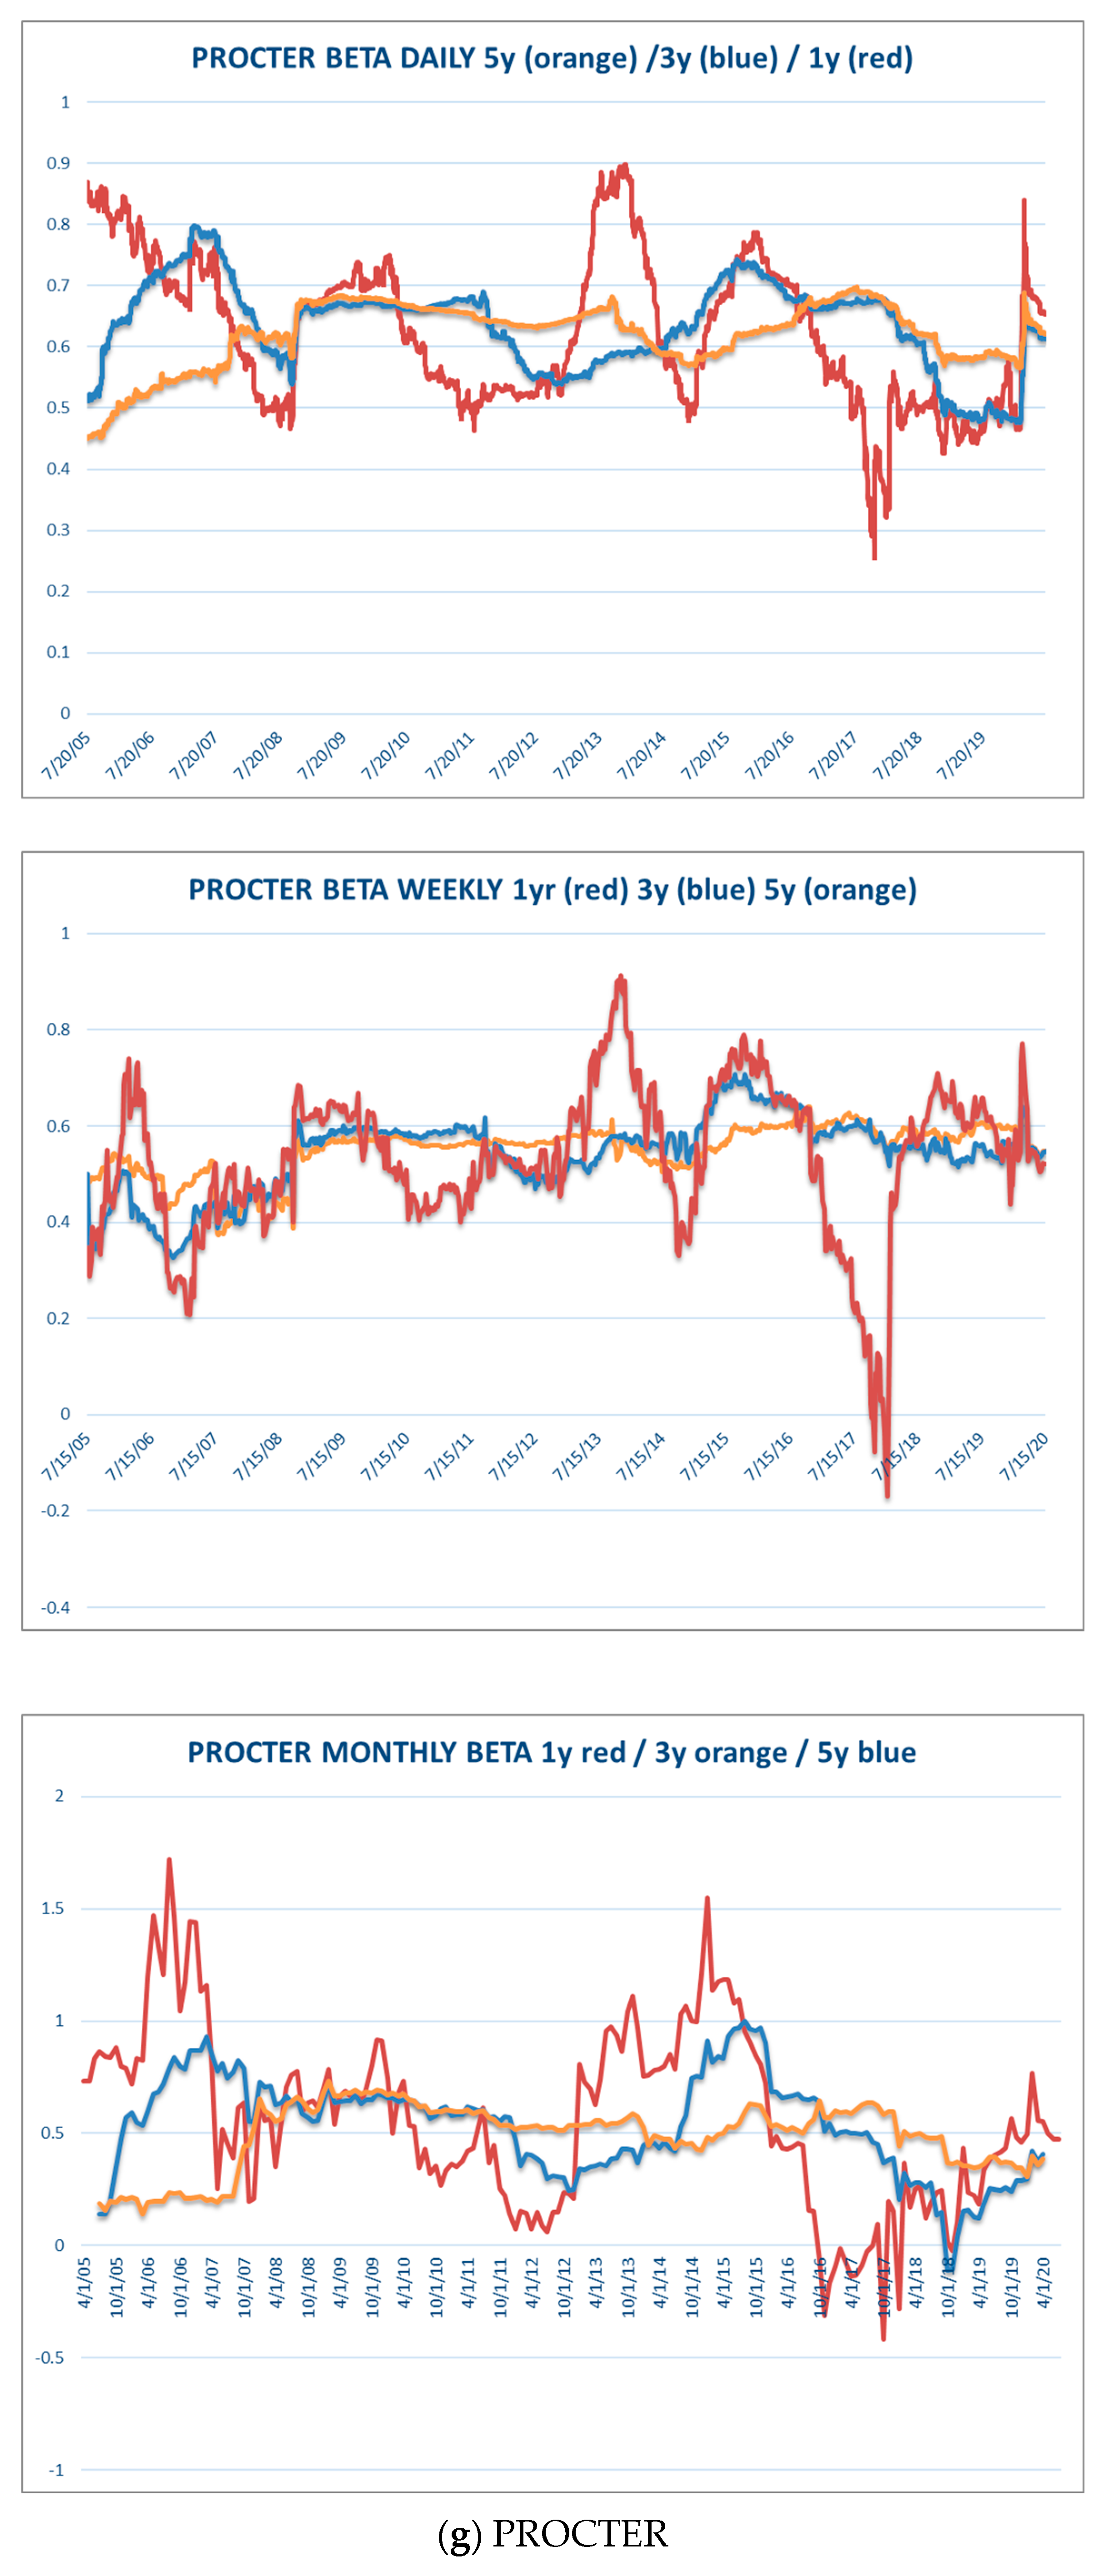
| Procter & Gamble | |||||||||
| Stdev | 0.148 | 0.248 | 0.397 | 0.053 | 0.076 | 0.154 | 0.052 | 0.086 | 0.134 |
| Average | 0.489 | 0.483 | 0.508 | 0.551 | 0.539 | 0.515 | 0.620 | 0.617 | 0.601 |
| Stdev/average | 0.302 | 0.513 | 0.781 | 0.097 | 0.141 | 0.298 | 0.084 | 0.139 | 0.222 |
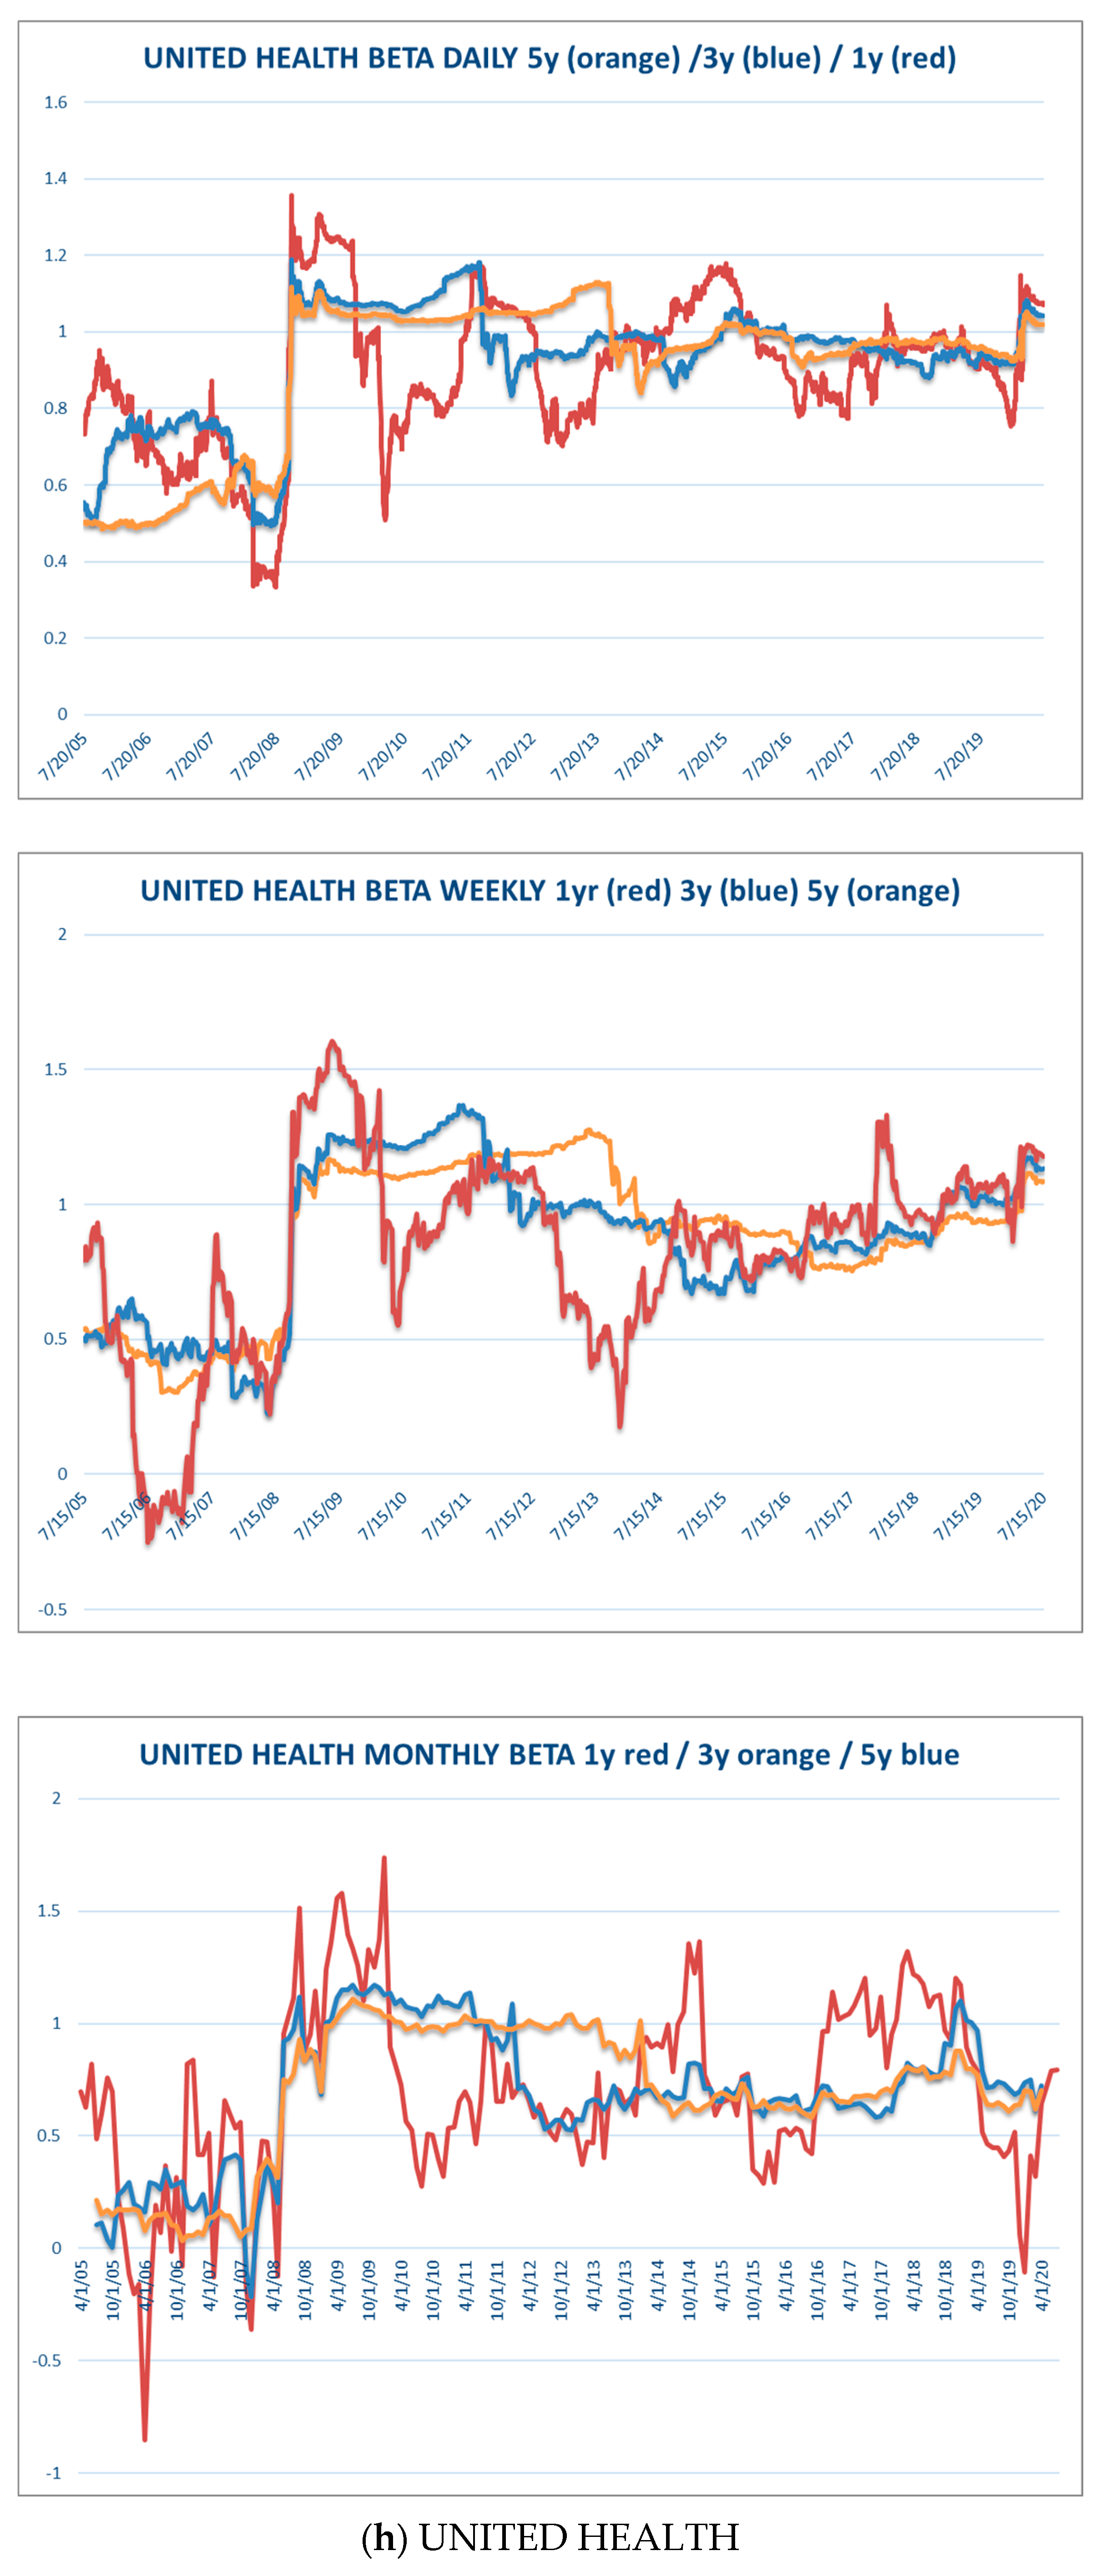
| United Health | |||||||||
| Stdev | 0.303 | 0.332 | 0.426 | 0.268 | 0.298 | 0.365 | 0.192 | 0.203 | 0.234 |
| Average | 0.692 | 0.623 | 0.601 | 0.890 | 0.829 | 0.776 | 0.909 | 0.875 | 0.825 |
| Stdev/average | 0.437 | 0.534 | 0.709 | 0.301 | 0.360 | 0.471 | 0.211 | 0.232 | 0.284 |
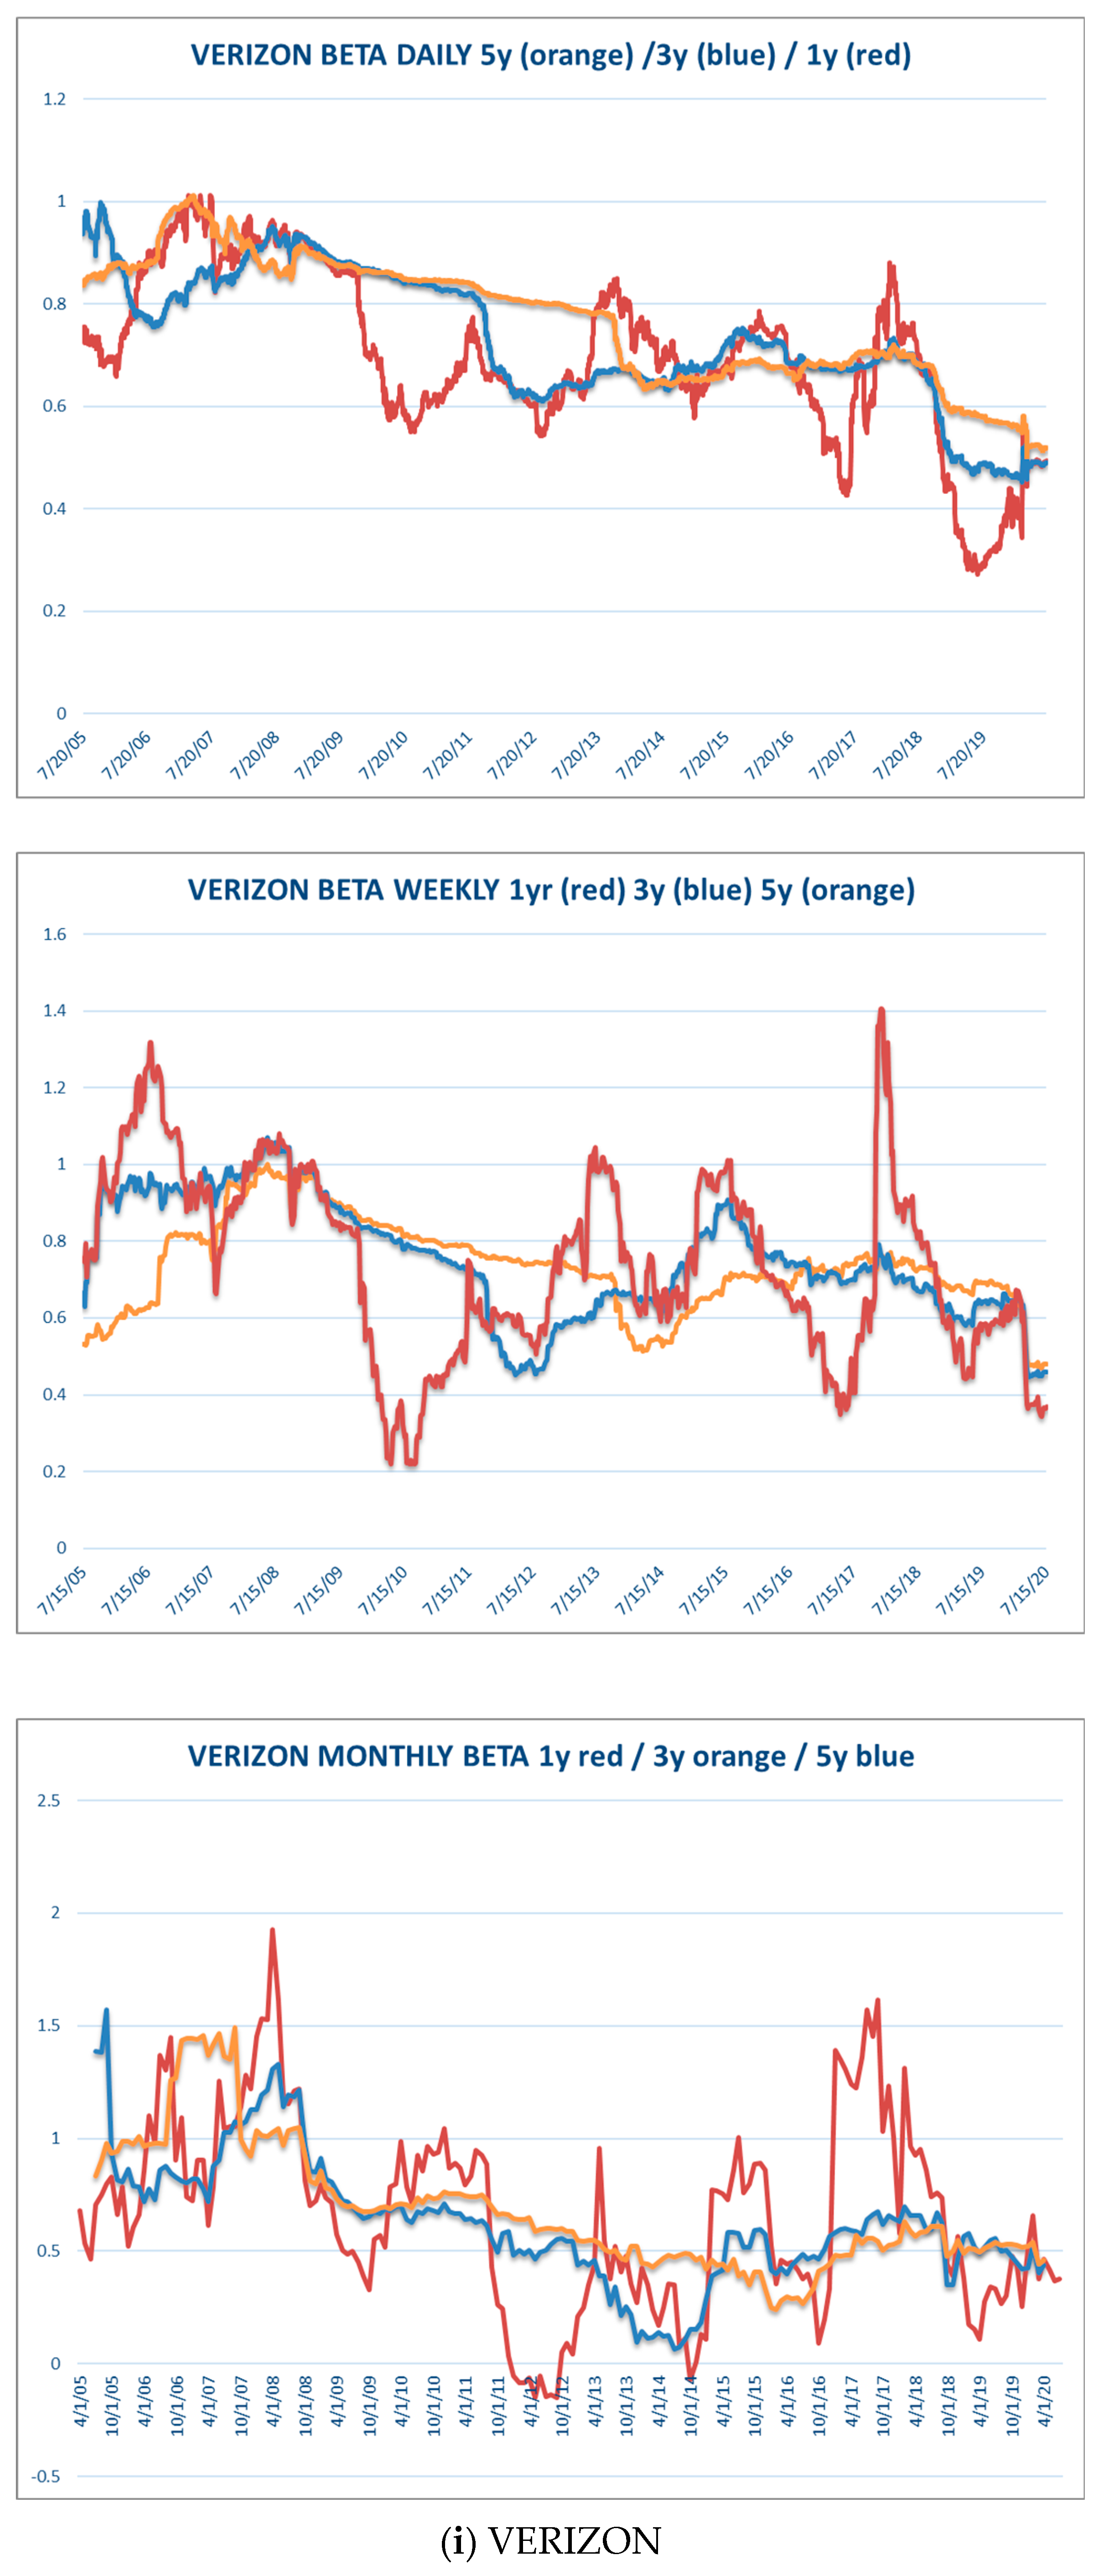
| Verizon | |||||||||
| Stdev | 0.279 | 0.326 | 0.505 | 0.116 | 0.153 | 0.241 | 0.120 | 0.140 | 0.178 |
| Average | 0.678 | 0.689 | 0.710 | 0.737 | 0.741 | 0.724 | 0.769 | 0.757 | 0.725 |
| Stdev/average | 0.411 | 0.474 | 0.710 | 0.158 | 0.206 | 0.333 | 0.156 | 0.185 | 0.246 |
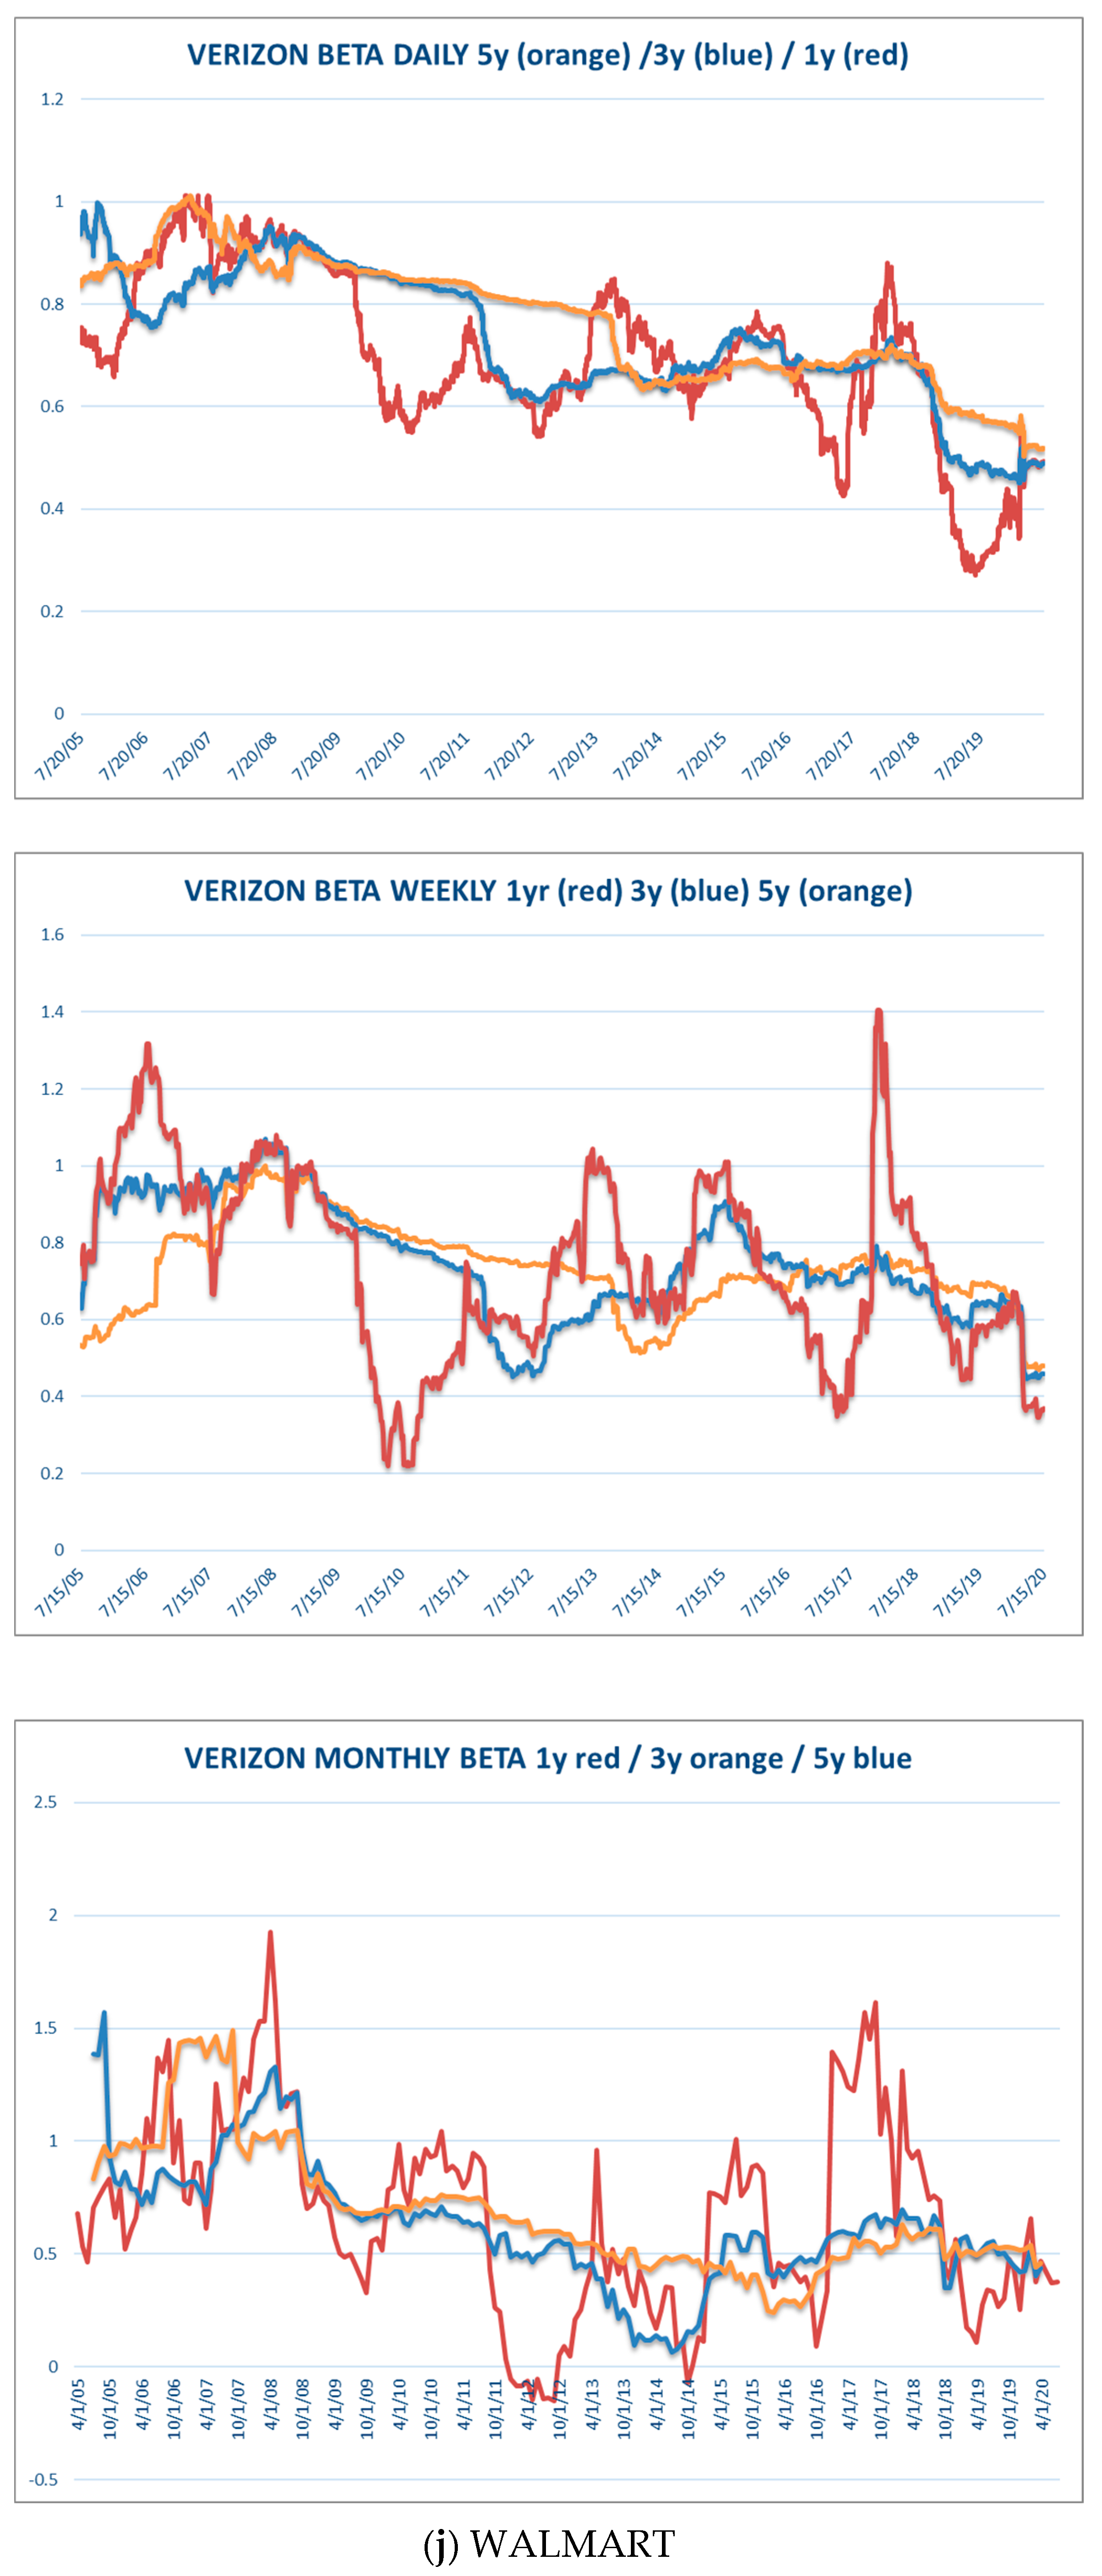
| Walmart | |||||||||
| Stdev | 0.133 | 0.208 | 0.549 | 0.115 | 0.138 | 0.196 | 0.122 | 0.138 | 0.180 |
| Average | 0.400 | 0.401 | 0.448 | 0.646 | 0.661 | 0.675 | 0.669 | 0.689 | 0.695 |
| Stdev/average | 0.332 | 0.519 | 1.225 | 0.179 | 0.209 | 0.290 | 0.183 | 0.200 | 0.258 |
| Average (all) | |||||||||
| Stdev | 0.219 | 0.301 | 0.526 | 0.133 | 0.168 | 0.252 | 0.128 | 0.153 | 0.207 |
| Average | 0.865 | 0.853 | 0.870 | 0.922 | 0.914 | 0.901 | 0.950 | 0.945 | 0.934 |
| Stdev/average | 0.274 | 0.386 | 0.664 | 0.146 | 0.188 | 0.291 | 0.135 | 0.163 | 0.227 |
| No Terms | Constant | Constant + Time Trend | |
|---|---|---|---|
| APPLE INC. | |||
| DAILY. 1 YEAR | 1.01 (0.99, 1.03) | 1.03 (1.01, 1.05) | 1.03 (1.01, 1.05) |
| DAILY. 3 YEAR | 1.00 (0.98, 1.04) | 1.06 (1.04, 1.08) | 1.06 (1.04, 1.08) |
| DAILY. 5 YEAR | 1.00 (0.97, 1.03) | 1.07 (1.04, 1.09) | 1.07 (1.04, 1.09) |
| WEEKLY. 1 YEAR | 0.96 (0.91, 1.01) | 0.96 (0.92, 1.01) | 0.96 (0.92, 1.01) |
| WEEKLY. 3 YEAR | 0.94 (0.90, 0.99) | 0.90 (0.87, 0.94) | 0.90 (0.87, 0.94) |
| WEEKLY. 5 YEAR | 0.96 (0.91, 1.01) | 0.88 (0.83, 0.93) | 0.88 (0.83, 0.93) |
| MONTHLY. 1 YEAR | 0.86 (0.76, 0.98) | 0.84 (0.74, 0.97) | 0.84 (0.74, 0.97) |
| MONTHLY. 3 YEAR | 0.91 (0.83, 1.02) | 0.90 (0.82, 1.02) | 0.90 (0.82, 1.02) |
| MONTHLY. 5 YEAR | 0.92 (0.84, 1.03) | 0.91 (0.83, 1.02) | 0.91 (0.83, 1.02) |
| HOMEDEPOT | |||
| DAILY. 1 YEAR | 1.02 (0.98, 1.03) | 1.04 (1.01, 1.07) | 1.04 (1.01, 1.07) |
| DAILY. 3 YEAR | 1.00 (0.98, 1.03) | 1.02 (1.00, 1.05) | 1.02 (1.00, 1.05) |
| DAILY. 5 YEAR | 1.00 (0.97, 1.03) | 1.03 (1.01, 1.06) | 1.03 (1.01, 1.06) |
| WEEKLY. 1 YEAR | 0.96 (0.91, 1.01) | 0.93 (0.88, 0.98) | 0.93 (0.88, 0.98) |
| WEEKLY. 3 YEAR | 0.99 (0.94, 1.05) | 0.96 (0.91, 1.03) | 0.96 (0.91, 1.03) |
| WEEKLY. 5 YEAR | 0.99 (0.94, 1.05) | 0.97 (0.91, 1.03) | 0.97 (0.91, 1.03) |
| MONTHLY. 1 YEAR | 1.02 (0.98, 1.03) | 0.82 (0.75, 0.92) | 0.82 (0.75, 0.92) |
| MONTHLY. 3 YEAR | 0.89 (0.78, 1.03) | 0.85 (0.73, 0.99) | 0.85 (0.73, 0.99) |
| MONTHLY. 5 YEAR | 0.96 (0.87, 1.08) | 0.75 (0.67, 0.87) | 0.75 (0.67, 0.87) |
| INTEL | |||
| DAILY. 1 YEAR | 1.00 (0.98, 1.03) | 1.02 (1.00, 1.05) | 1.02 (1.00, 1.05) |
| DAILY. 3 YEAR | 1.00 (0.97, 1.03) | 1.08 (1.05, 1.11) | 1.08 (1.05, 1.10) |
| DAILY. 5 YEAR | 1.00 (0.98, 1.03) | 1.13 (1.10, 1.16) | 1.13 (1.10, 1.16) |
| WEEKLY. 1 YEAR | 0.97 (0.92, 1.02) | 0.94 (0.89, 1.00) | 0.94 (0.89, 1.00) |
| WEEKLY. 3 YEAR | 0.99 (0.94, 1.04) | 0.98 (0.94, 1.04) | 0.98 (0.94, 1.04) |
| WEEKLY. 5 YEAR | 0.99 (0.94, 1.05) | 1.02 (0.96, 1.08) | 1.02 (0.96, 1.08) |
| MONTHLY. 1 YEAR | 0.87 (0.78, 1.01) | 0.78 (0.67, 0.93) | 0.78 (0.65, 0.93) |
| MONTHLY. 3 YEAR | 0.94 (0.85, 1.05) | 0.73 (0.64, 0.87) | 0.76 (0.67, 0.88) |
| MONTHLY. 5 YEAR | 0.94 (0.85, 1.07) | 0.80 (0.71, 0.93) | 0.83 (0.75, 0.94) |
| JOHNSON & JOHNSON | |||
| DAILY. 1 YEAR | 1.03 (1.01, 1.05) | 1.03 (1.01, 1.05) | 1.03 (1.01, 1.05) |
| DAILY. 3 YEAR | 1.01 (0.99, 1.03) | 1.05 (1.03, 1.07) | 1.05 (1.03, 1.07) |
| DAILY. 5 YEAR | 1.01 (0.98, 1.03) | 1.06 (1.04, 1.08) | 1.06 (1.04, 1.08) |
| WEEKLY. 1 YEAR | 1.05 (1.00, 1.11) | 1.05 (1.00, 1.11) | 1.05 (1.00, 1.11) |
| WEEKLY. 3 YEAR | 1.05 (0.99, 1.11) | 1.21 (1.14, 1.28) | 1.21 (1.14, 1.28) |
| WEEKLY. 5 YEAR | 1.03 (0.97, 1.09) | 1.23 (1.16, 1.32) | 1.23 (1.16, 1.32) |
| MONTHLY. 1 YEAR | 0.81 (0.71, 0.94) | 0.81 (0.71, 0.94) | 0.81 (0.71, 0.94) |
| MONTHLY. 3 YEAR | 0.89 (0.80, 1.00) | 0.88 (0.79, 0.99) | 0.88 (0.79, 0.99) |
| MONTHLY. 5 YEAR | 0.85 (0.74, 0.97) | 0.79 (0.70, 0.90) | 0.80 (0.72, 0.91) |
| JPMORGAN | |||
| DAILY. 1 YEAR | 1.03 (1.00, 1.05) | 1.11 (1.09, 1.13) | 1.11 (1.09, 1.13) |
| DAILY. 3 YEAR | 1.01 (0.99, 1.04) | 1.12 (1.10, 1.14) | 1.12 (1.10, 1.14) |
| DAILY. 5 YEAR | 1.01 (0.98, 1.03) | 1.12 (1.10, 1.14) | 1.12 (1.10, 1.14) |
| WEEKLY. 1 YEAR | 1.04 (0.99, 1.10) | 1.08 (1.03, 1.15) | 1.08 (1.03, 1.15) |
| WEEKLY. 3 YEAR | 1.03 (0.98, 1.08) | 1.13 (1.08, 1.20) | 1.13 (1.08, 1.20) |
| WEEKLY. 5 YEAR | 1.02 (0.97, 1.08) | 1.15 (1.08, 1.22) | 1.15 (1.08, 1.22) |
| MONTHLY. 1 YEAR | 0.89 (0.79, 1.01) | 0.92 (0.81, 1.05) | 0.92 (0.81, 1.05) |
| MONTHLY. 3 YEAR | 0.96 (0.87, 1.08) | 0.99 (0.90, 1.10) | 0.99 (0.91, 1.10) |
| MONTHLY. 5 YEAR | 0.94 (0.85, 1.07) | 0.90 (0.83, 1.00) | 0.90 (0.83, 1.00) |
| MICROSOFT | |||
| DAILY. 1 YEAR | 1.00 (0.98, 1.03) | 1.02 (1.00, 1.04) | 1.02 (1.00, 1.04) |
| DAILY. 3 YEAR | 1.00 (0.97, 1.02) | 1.01 (0.99, 1.04) | 1.01 (0.99, 1.04) |
| DAILY. 5 YEAR | 1.00 (0.97, 1.02) | 1.02 (1.00, 1.04) | 1.02 (1.00, 1.04) |
| WEEKLY. 1 YEAR | 0.98 (0.94, 1.03) | 0.98 (0.94, 1.03) | 0.98 (0.94, 1.03) |
| WEEKLY. 3 YEAR | 0.98 (0.94, 1.04) | 0.98 (0.94, 1.04) | 0.98 (0.94, 1.04) |
| WEEKLY. 5 YEAR | 0.98 (0.93, 1.04) | 1.05 (1.00, 1.10) | 1.05 (1.00, 1.10) |
| MONTHLY. 1 YEAR | 1.00 (0.88, 1.13) | 1.03 (0.92, 1.16) | 1.03 (0.92, 1.16) |
| MONTHLY. 3 YEAR | 0.99 (0.89, 1.12) | 1.03 (0.94, 1.14) | 1.03 (0.94, 1.14) |
| MONTHLY. 5 YEAR | 0.94 (0.82, 1.09) | 0.93 (0.82, 1.07) | 0.93 (0.83, 1.07) |
| VERIZON | |||
| DAILY. 1 YEAR | 1.03 (1.01, 1.05) | 1.06 (1.03, 1.09) | 1.06 (1.03, 1.09) |
| DAILY. 3 YEAR | 1.01 (0.98, 1.03) | 1.02 (1.00, 1.04) | 1.02 (1.00, 1.04) |
| DAILY. 5 YEAR | 1.00 (0.98, 1.03) | 0.99 (0.97, 1.01) | 0.99 (0.97, 1.01) |
| WEEKLY. 1 YEAR | 1.03 (0.99, 1.08) | 1.04 (0.99, 1.09) | 1.04 (0.99, 1.09) |
| WEEKLY. 3 YEAR | 1.02 (0.97, 1.07) | 1.04 (0.99, 1.09) | 1.04 (0.99, 1.09) |
| WEEKLY. 5 YEAR | 1.02 (0.97, 1.07) | 1.05 (1.01, 1.10) | 1.05 (1.01, 1.10) |
| MONTHLY. 1 YEAR | 0.90 (0.81, 1.01) | 0.90 (0.81, 1.01) | 0.90 (0.81, 1.01) |
| MONTHLY. 3 YEAR | 1.00 (0.92, 1.11) | 0.96 (0.87, 1.07) | 0.96 (0.87, 1.07) |
| MONTHLY. 5 YEAR | 1.00 (0.92, 1.12) | 0.93 (0.85, 1.04) | 0.93 (0.84, 1.04) |
| WALMART | |||
| DAILY. 1 YEAR | 1.00 (0.98, 1.03) | 1.02 (0.99, 1.05) | 1.02 (0.99, 1.05) |
| DAILY. 3 YEAR | 1.01 (0.97, 1.03) | 1.02 (1.00, 1.05) | 1.02 (1.00, 1.05) |
| DAILY. 5 YEAR | 1.00 (0.97, 1.03) | 1.03 (1.01, 1.06) | 1.03 (1.01, 1.06) |
| WEEKLY. 1 YEAR | 1.01 (0.95, 1.05) | 1.01 (0.95, 1.06) | 1.00 (0.95, 1.06) |
| WEEKLY. 3 YEAR | 1.00 (0.96, 1.07) | 1.07 (1.02, 1.13) | 1.07 (1.02, 1.13) |
| WEEKLY. 5 YEAR | 1.01 (0.96, 1.07) | 1.12 (1.07, 1.19) | 1.12 (1.07, 1.19) |
| MONTHLY. 1 YEAR | 0.99 (0.89, 1.12) | 0.99 (0.88, 1.11) | 0.99 (0.88, 1.11) |
| MONTHLY. 3 YEAR | 0.96 (0.86, 1.08) | 0.92 (0.83, 1.04) | 0.92 (0.83, 1.04) |
| MONTHLY. 5 YEAR | 1.01 (0.92, 1.13) | 0.96 (0.87, 1.07) | 0.96 (0.87, 1.07) |
| UNITED HEALTH | |||
| DAILY. 1 YEAR | 1.01 (1.03, 1.06) | 1.03 (1.05, 1.07) | 1.03 (1.05, 1.07) |
| DAILY. 3 YEAR | 1.04 (1.02, 1.07) | 1.08 (1.05, 1.10) | 1.08 (1.05, 1.10) |
| DAILY. 5 YEAR | 1.03 (1.01, 1.06) | 1.09 (1.07, 1.12) | 1.09 (1.07, 1.12) |
| WEEKLY. 1 YEAR | 1.01 (0.96, 1.06) | 1.02 (0.97, 1.07) | 1.02 (0.97, 1.07) |
| WEEKLY. 3 YEAR | 1.08 (1.03, 1.14) | 1.12 (1.07, 1.18) | 1.12 (1.07, 1.18) |
| WEEKLY. 5 YEAR | 1.06 (1.01, 1.12) | 1.13 (1.08, 1.20) | 1.13 (1.08, 1.20) |
| MONTHLY. 1 YEAR | 0.71 (0.62, 0.84) | 0.71 (0.61, 0.83) | 0.71 (0.61, 0.83) |
| MONTHLY. 3 YEAR | 0.86 (0.77, 0.97) | 0.87 (0.78, 0.98) | 0.87 (0.78, 0.98) |
| MONTHLY. 5 YEAR | 0.93 (0.86, 1.01) | 0.94 (0.87, 1.02) | 0.94 (0.87, 1.02) |
| PROCTER | |||
| DAILY. 1 YEAR | 1.04 (1.01, 1.06) | 1.04 (1.02, 1.06) | 1.04 (1.02, 1.06) |
| DAILY. 3 YEAR | 1.01 (0.99, 1.04) | 1.05 (1.03, 1.08) | 1.05 (1.03, 1.08) |
| DAILY. 5 YEAR | 1.00 (0.98, 1.03) | 1.05 (1.02, 1.07) | 1.05 (1.02, 1.07) |
| WEEKLY. 1 YEAR | 0.99 (0.94, 1.05) | 0.99 (0.94, 1.05) | 0.99 (0.94, 1.05) |
| WEEKLY. 3 YEAR | 0.98 (0.94, 1.04) | 0.94 (0.89, 0.99) | 0.94 (0.89, 0.99) |
| WEEKLY. 5 YEAR | 0.99 (0.94, 1.05) | 0.96 (0.90, 1.02) | 0.96 (0.90, 1.02) |
| MONTHLY. 1 YEAR | 0.81 (0.73, 0.90) | 0.80 (0.73, 0.90) | 0.80 (0.73, 0.90) |
| MONTHLY. 3 YEAR | 1.02 (0.94, 1.12) | 1.02 (0.94, 1.13) | 1.02 (0.94, 1.13) |
| MONTHLY. 5 YEAR | 0.99 (0.91, 1.09) | 0.99 (0.91, 1.10) | 0.99 (0.92, 1.10) |
| APPLE INC. | |||
|---|---|---|---|
| Series | d | Constant (t-Value) | Time Trend (t-Value) |
| DAILY. 1 YEAR | 1.03 (1.01, 1.05) | 1.6077 (108.68) | --- |
| DAILY. 3 YEAR | 1.06 (1.04, 1.08) | 1.1725 (219.08) | --- |
| DAILY. 5 YEAR | 1.07 (1.04, 1.09) | 1.2341 (346.27) | --- |
| WEEKLY. 1 YEAR | 0.96 (0.92, 1.01) | 1.2450 (17.41) | --- |
| WEEKLY. 3 YEAR | 0.90 (0.87, 0.94) | 0.9460 (33.72) | --- |
| WEEKLY. 5 YEAR | 0.88 (0.83, 0.93) | 1.0351 (52.88) | --- |
| MONTHLY. 1 YEAR | 0.84 (0.74, 0.97) | 0.9699 (2.63) | --- |
| MONTHLY. 3 YEAR | 0.90 (0.82, 1.02) | 1.2838 (9.74) | --- |
| MONTHLY. 5 YEAR | 0.91 (0.83, 1.02) | 1.3565 (16.92) | --- |
| HOMEDEPOT | |||
| DAILY. 1 YEAR | 1.04 (1.01, 1.07) | 1.7660 (192.13) | --- |
| DAILY. 3 YEAR | 1.02 (1.00, 1.05) | 1.3610 (365.57) | --- |
| DAILY. 5 YEAR | 1.03 (1.01, 1.06) | 1.3395 (484.54) | --- |
| WEEKLY. 1 YEAR | 0.93 (0.88, 0.98) | 1.8297 (39.84) | --- |
| WEEKLY. 3 YEAR | 0.96 (0.91, 1.03) | 1.3601 (71.35) | --- |
| WEEKLY. 5 YEAR | 0.97 (0.91, 1.03) | 1.3468 (95.50) | --- |
| MONTHLY. 1 YEAR | 0.85 (0.73, 0.99) | 1.2262 (23.46) | --- |
| MONTHLY. 3 YEAR | 0.75 (0.67, 0.87) | 1.5201 (6.50) | --- |
| MONTHLY. 5 YEAR | 0.82 (0.75, 0.92) | 1.2262 (23.46) | --- |
| INTEL | |||
| DAILY. 1 YEAR | 1.02 (1.00, 1.05) | 1.7379 (153.35) | --- |
| DAILY. 3 YEAR | 1.08 (1.05, 1.11) | 1.7014 (395.14) | --- |
| DAILY. 5 YEAR | 1.13 (1.10, 1.16) | 1.6635 (549.21) | --- |
| WEEKLY. 1 YEAR | 0.94 (0.89, 1.00) | 1.4212 (25.26) | --- |
| WEEKLY. 3 YEAR | 0.98 (0.94, 1.04) | 1.4904 (69.62) | --- |
| WEEKLY. 5 YEAR | 1.02 (0.96, 1.08) | 1.4810 (98.42) | --- |
| MONTHLY. 1 YEAR | 0.78 (0.67, 0.93) | 1.9179 (7.21) | --- |
| MONTHLY. 3 YEAR | 0.76 (0.67, 0.88) | 2.2423 (26.87) | −0.0077 (−3.90) |
| MONTHLY. 5 YEAR | 0.80 (0.71, 0.93) | 2.1440 (35.01) | --- |
| JOHNSON & JOHNSON | |||
| DAILY. 1 YEAR | 1.03 (1.01, 1.05) | 0.1824 (23.79) | --- |
| DAILY. 3 YEAR | 1.05 (1.03, 1.07) | 0.5251 (172.07) | --- |
| DAILY. 5 YEAR | 1.06 (1.04, 1.08) | 0.5316 (234.23) | --- |
| WEEKLY. 1 YEAR | 1.05 (1.00, 1.11) | 0.3276 (10.56) | --- |
| WEEKLY. 3 YEAR | 1.21 (1.14, 1.28) | 0.5870 (51.09) | --- |
| WEEKLY. 5 YEAR | 1.23 (1.16, 1.32) | 0.5590 (67.11) | --- |
| MONTHLY. 1 YEAR | 0.81 (0.71, 0.94) | 0.3028 (1.97) | --- |
| MONTHLY. 3 YEAR | 0.88 (0.79, 0.99) | 0.2723 (5.00) | --- |
| MONTHLY. 5 YEAR | 0.80 (0.72, 0.91) | 0.2694 (8.44) | 0.0025 (2.57) |
| JPMORGAN | |||
| DAILY. 1 YEAR | 1.11 (1.09, 1.13) | 1.7388 (133.52) | --- |
| DAILY. 3 YEAR | 1.12 (1.10, 1.14) | 1.5851 (239.56) | --- |
| DAILY. 5 YEAR | 1.12 (1.10, 1.14) | 1.5182 (287.83) | --- |
| WEEKLY. 1 YEAR | 1.08 (1.03, 1.15) | 1.6091 (26.63) | --- |
| WEEKLY. 3 YEAR | 1.13 (1.08, 1.20) | 1.4782 (25.16) | --- |
| WEEKLY. 5 YEAR | 1.15 (1.08, 1.22) | 1.4901 (53.59) | --- |
| MONTHLY. 1 YEAR | 0.92 (0.81, 1.05) | 1.7416 (7.13) | --- |
| MONTHLY. 3 YEAR | 0.99 (0.90, 1.10) | 1.8103 (20.28) | --- |
| MONTHLY. 5 YEAR | 0.90 (0.83, 1.00) | 1.4200 (64.74) | --- |
| MICROSOFT | |||
| DAILY. 1 YEAR | 1.02 (1.00, 1.04) | 1.3670 (152.43) | --- |
| DAILY. 3 YEAR | 1.01 (0.99, 1.04) | 1.2866 (356–95) | --- |
| DAILY. 5 YEAR | 1.02 (1.00, 1.04) | 1.2453 (478.18) | --- |
| WEEKLY. 1 YEAR | 0.98 (0.94, 1.03) | 0.7315 (16.31) | --- |
| WEEKLY. 3 YEAR | 0.98 (0.94, 1.04) | 0.9853 (62.74) | --- |
| WEEKLY. 5 YEAR | 1.05 (1.00, 1.10) | 0.9787 (91.63) | --- |
| MONTHLY. 1 YEAR | 1.03 (0.92, 1.16) | 1.6761 (6.77) | --- |
| MONTHLY. 3 YEAR | 1.03 (0.94, 1.14) | 1.2954 (16.51) | --- |
| MONTHLY. 5 YEAR | 0.93 (0.82, 1.07) | 1.1091 (22.95) | --- |
| VERIZON | |||
| DAILY. 1 YEAR | 1.06 (1.03, 1.09) | 0.6732 (83.90) | --- |
| DAILY. 3 YEAR | 1.02 (1.00, 1.04) | 0.8549 (268.43) | --- |
| DAILY. 5 YEAR | 0.99 (0.97, 1.01) | 0.8368 (356.58) | −0.00008 (−2.38) |
| WEEKLY. 1 YEAR | 1.04 (0.99, 1.09) | 0.3860 (9.79) | --- |
| WEEKLY. 3 YEAR | 1.04 (0.99, 1.09) | 0.4852 (33.43) | --- |
| WEEKLY. 5 YEAR | 1.05 (1.01, 1.10) | 0.5321 (51.19) | --- |
| MONTHLY. 1 YEAR | 0.90 (0.81, 1.01) | --- | --- |
| MONTHLY. 3 YEAR | 0.96 (0.87, 1.07) | 0.8531 (10.84) | --- |
| MONTHLY. 5 YEAR | 0.93 (0.85, 1.04) | 0.8421 (14.60) | --- |
| WALMART | |||
| DAILY. 1 YEAR | 1.02 (0.99, 1.05) | 1.0386 (116.79) | --- |
| DAILY. 3 YEAR | 1.02 (1.00, 1.05) | 0.9207 (268.68) | --- |
| DAILY. 5 YEAR | 1.03 (1.01, 1.06) | 0.9026 (370.02) | −0.00019 (−1.98) |
| WEEKLY. 1 YEAR | 1.01 (0.95, 1.06) | 0.7702 (19.72) | --- |
| WEEKLY. 3 YEAR | 1.07 (1.02, 1.13) | 0.8185 (54.33) | --- |
| WEEKLY. 5 YEAR | 1.12 (1.07, 1.19) | 0.7927 (78.57) | --- |
| MONTHLY. 1 YEAR | 0.99 (0.89, 1.12) | --- | --- |
| MONTHLY. 3 YEAR | 0.92 (0.83, 1.04) | 0.4108 (5.39) | --- |
| MONTHLY. 5 YEAR | 0.96 (0.87, 1.07) | 0.3719 (7.98) | --- |
| UNITED HEALTH | |||
| DAILY. 1 YEAR | 1.05 (1.03, 1.07) | 0.5975 (46.12) | --- |
| DAILY. 3 YEAR | 1.08 (1.05, 1.10) | 0.4647 (67.82) | --- |
| DAILY. 5 YEAR | 1.09 (1.07, 1.12) | 0.5028 (92.59) | --- |
| WEEKLY. 1 YEAR | 1.02 (0.97, 1.07) | 0.8156 (15.19) | --- |
| WEEKLY. 3 YEAR | 1.12 (1.07, 1.18) | 0.4929 (21.42) | --- |
| WEEKLY. 5 YEAR | 1.13 (1.08, 1.20) | 0.5399 (311.51) | --- |
| MONTHLY. 1 YEAR | 0.71 (0.62, 0.84) | --- | --- |
| MONTHLY. 3 YEAR | 0.87 (0.78, 0.98) | 0.1953 (2.0.8) | --- |
| MONTHLY. 5 YEAR | 0.94 (0.87, 1.02) | 0.2112 (3.53) | --- |
| PROCTER | |||
| DAILY. 1 YEAR | 1.04 (1.02, 1.06) | 0.2120 (28.05) | --- |
| DAILY. 3 YEAR | 1.05 (1.03, 1.08) | 0.4088 (140.18) | --- |
| DAILY. 5 YEAR | 1.05 (1.02, 1.07) | 0.4494 (216.88) | --- |
| WEEKLY. 1 YEAR | 0.99 (0.94, 1.05) | 0.4353 (12.41) | --- |
| WEEKLY. 3 YEAR | 0.94 (0.89, 0.99) | 0.5084 (39.93) | --- |
| WEEKLY. 5 YEAR | 0.96 (0.90, 1.02) | 0.4800 (50.68) | --- |
| MONTHLY. 1 YEAR | 0.81 (0.73, 0.90) | --- | --- |
| MONTHLY. 3 YEAR | 1.02 (0.94, 1.13) | 0.1168 (1.99) | --- |
| MONTHLY. 5 YEAR | 0.99 (0.91, 1.10) | 0.1893 (5.68) | --- |
| Monthly | Weekly | Daily | ||||||||
|---|---|---|---|---|---|---|---|---|---|---|
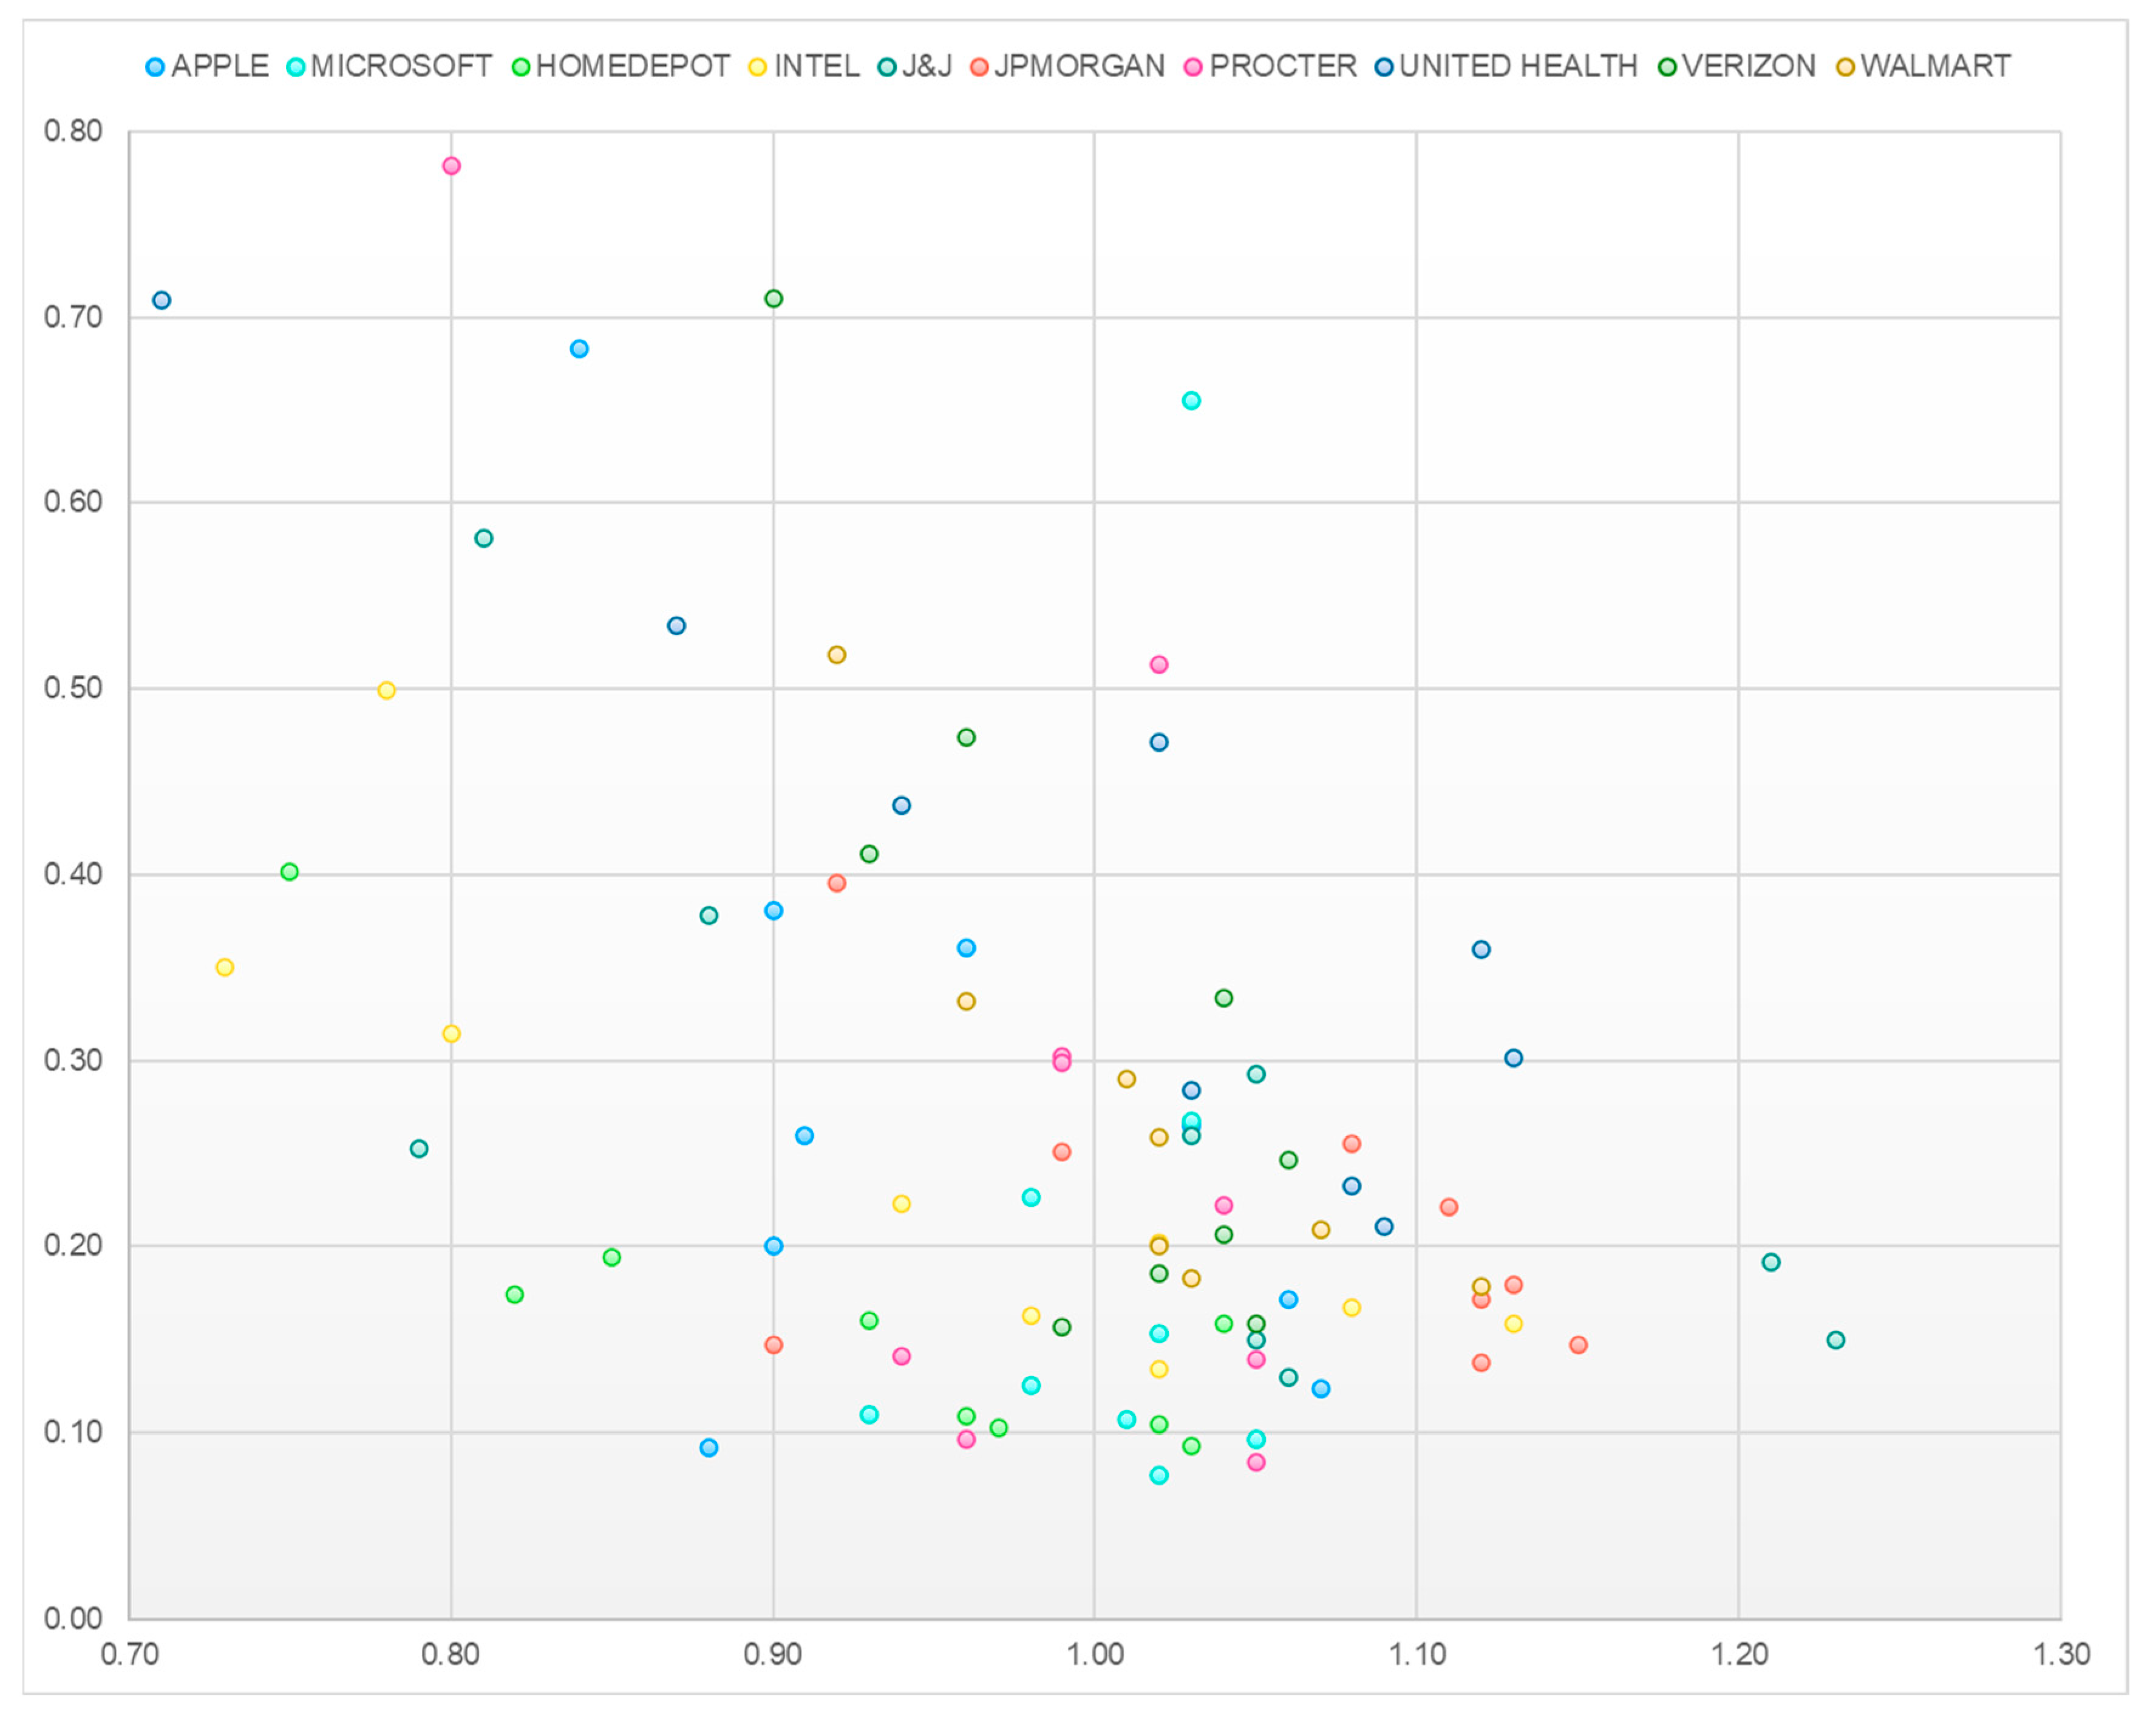
| APPLE | 5Y | 3Y | 1Y | 5Y | 3Y | 1Y | 5Y | 3Y | 1Y | Average |
| d | 0.910 | 0.900 | 0.840 | 0.880 | 0.900 | 0.960 | 1.070 | 1.060 | 1.030 | 0.950 |
| Stdev/average | 0.259 | 0.380 | 0.683 | 0.092 | 0.200 | 0.360 | 0.123 | 0.172 | 0.264 | 0.282 |
| MICROSOFT | ||||||||||
| d | 0.930 | 1.030 | 1.030 | 1.050 | 0.980 | 0.980 | 1.020 | 1.010 | 1.020 | 1.006 |
| Stdev/average | 0.109 | 0.267 | 0.655 | 0.097 | 0.125 | 0.227 | 0.077 | 0.107 | 0.153 | 0.202 |
| HOMEDEPOT | ||||||||||
| d | 0.820 | 0.850 | 0.750 | 0.970 | 0.960 | 0.930 | 1.030 | 1.020 | 1.040 | 0.930 |
| Stdev/average | 0.174 | 0.194 | 0.401 | 0.102 | 0.109 | 0.160 | 0.093 | 0.104 | 0.159 | 0.166 |
| INTEL | ||||||||||
| d | 0.800 | 0.730 | 0.780 | 1.020 | 0.980 | 0.940 | 1.130 | 1.080 | 1.020 | 0.942 |
| Stdev/average | 0.314 | 0.351 | 0.499 | 0.134 | 0.162 | 0.223 | 0.158 | 0.168 | 0.202 | 0.246 |
| JOHNSON & JOHNSON | ||||||||||
| d | 0.790 | 0.880 | 0.810 | 1.230 | 1.210 | 1.050 | 1.060 | 1.050 | 1.030 | 1.012 |
| Stdev/average | 0.252 | 0.378 | 0.581 | 0.150 | 0.191 | 0.292 | 0.129 | 0.149 | 0.260 | 0.265 |
| JPMORGAN | ||||||||||
| d | 0.900 | 0.990 | 0.920 | 1.150 | 1.130 | 1.080 | 1.120 | 1.120 | 1.110 | 1.058 |
| Stdev/average | 0.147 | 0.251 | 0.395 | 0.147 | 0.179 | 0.255 | 0.138 | 0.171 | 0.221 | 0.212 |
| PROCTER & GAMBLE | ||||||||||
| d | 0.990 | 1.020 | 0.800 | 0.960 | 0.940 | 0.990 | 1.050 | 1.050 | 1.040 | 0.982 |
| Stdev/average | 0.302 | 0.513 | 0.781 | 0.097 | 0.141 | 0.298 | 0.084 | 0.139 | 0.222 | 0.286 |
| UNITED HEALTH | ||||||||||
| d | 0.940 | 0.870 | 0.710 | 1.130 | 1.120 | 1.020 | 1.090 | 1.080 | 1.030 | 0.999 |
| Stdev/average | 0.437 | 0.534 | 0.709 | 0.301 | 0.360 | 0.471 | 0.211 | 0.232 | 0.284 | 0.393 |
| VERIZON | ||||||||||
| d | 0.930 | 0.960 | 0.900 | 1.050 | 1.040 | 1.040 | 0.990 | 1.020 | 1.060 | 0.999 |
| Stdev/average | 0.411 | 0.474 | 0.710 | 0.158 | 0.206 | 0.333 | 0.156 | 0.185 | 0.246 | 0.320 |
| WALMART | ||||||||||
| d | 0.960 | 0.920 | 0.990 | 1.120 | 1.070 | 1.010 | 1.030 | 1.020 | 1.020 | 1.016 |
| Stdev/average | 0.332 | 0.519 | 1.225 | 0.179 | 0.209 | 0.290 | 0.183 | 0.200 | 0.258 | 0.377 |
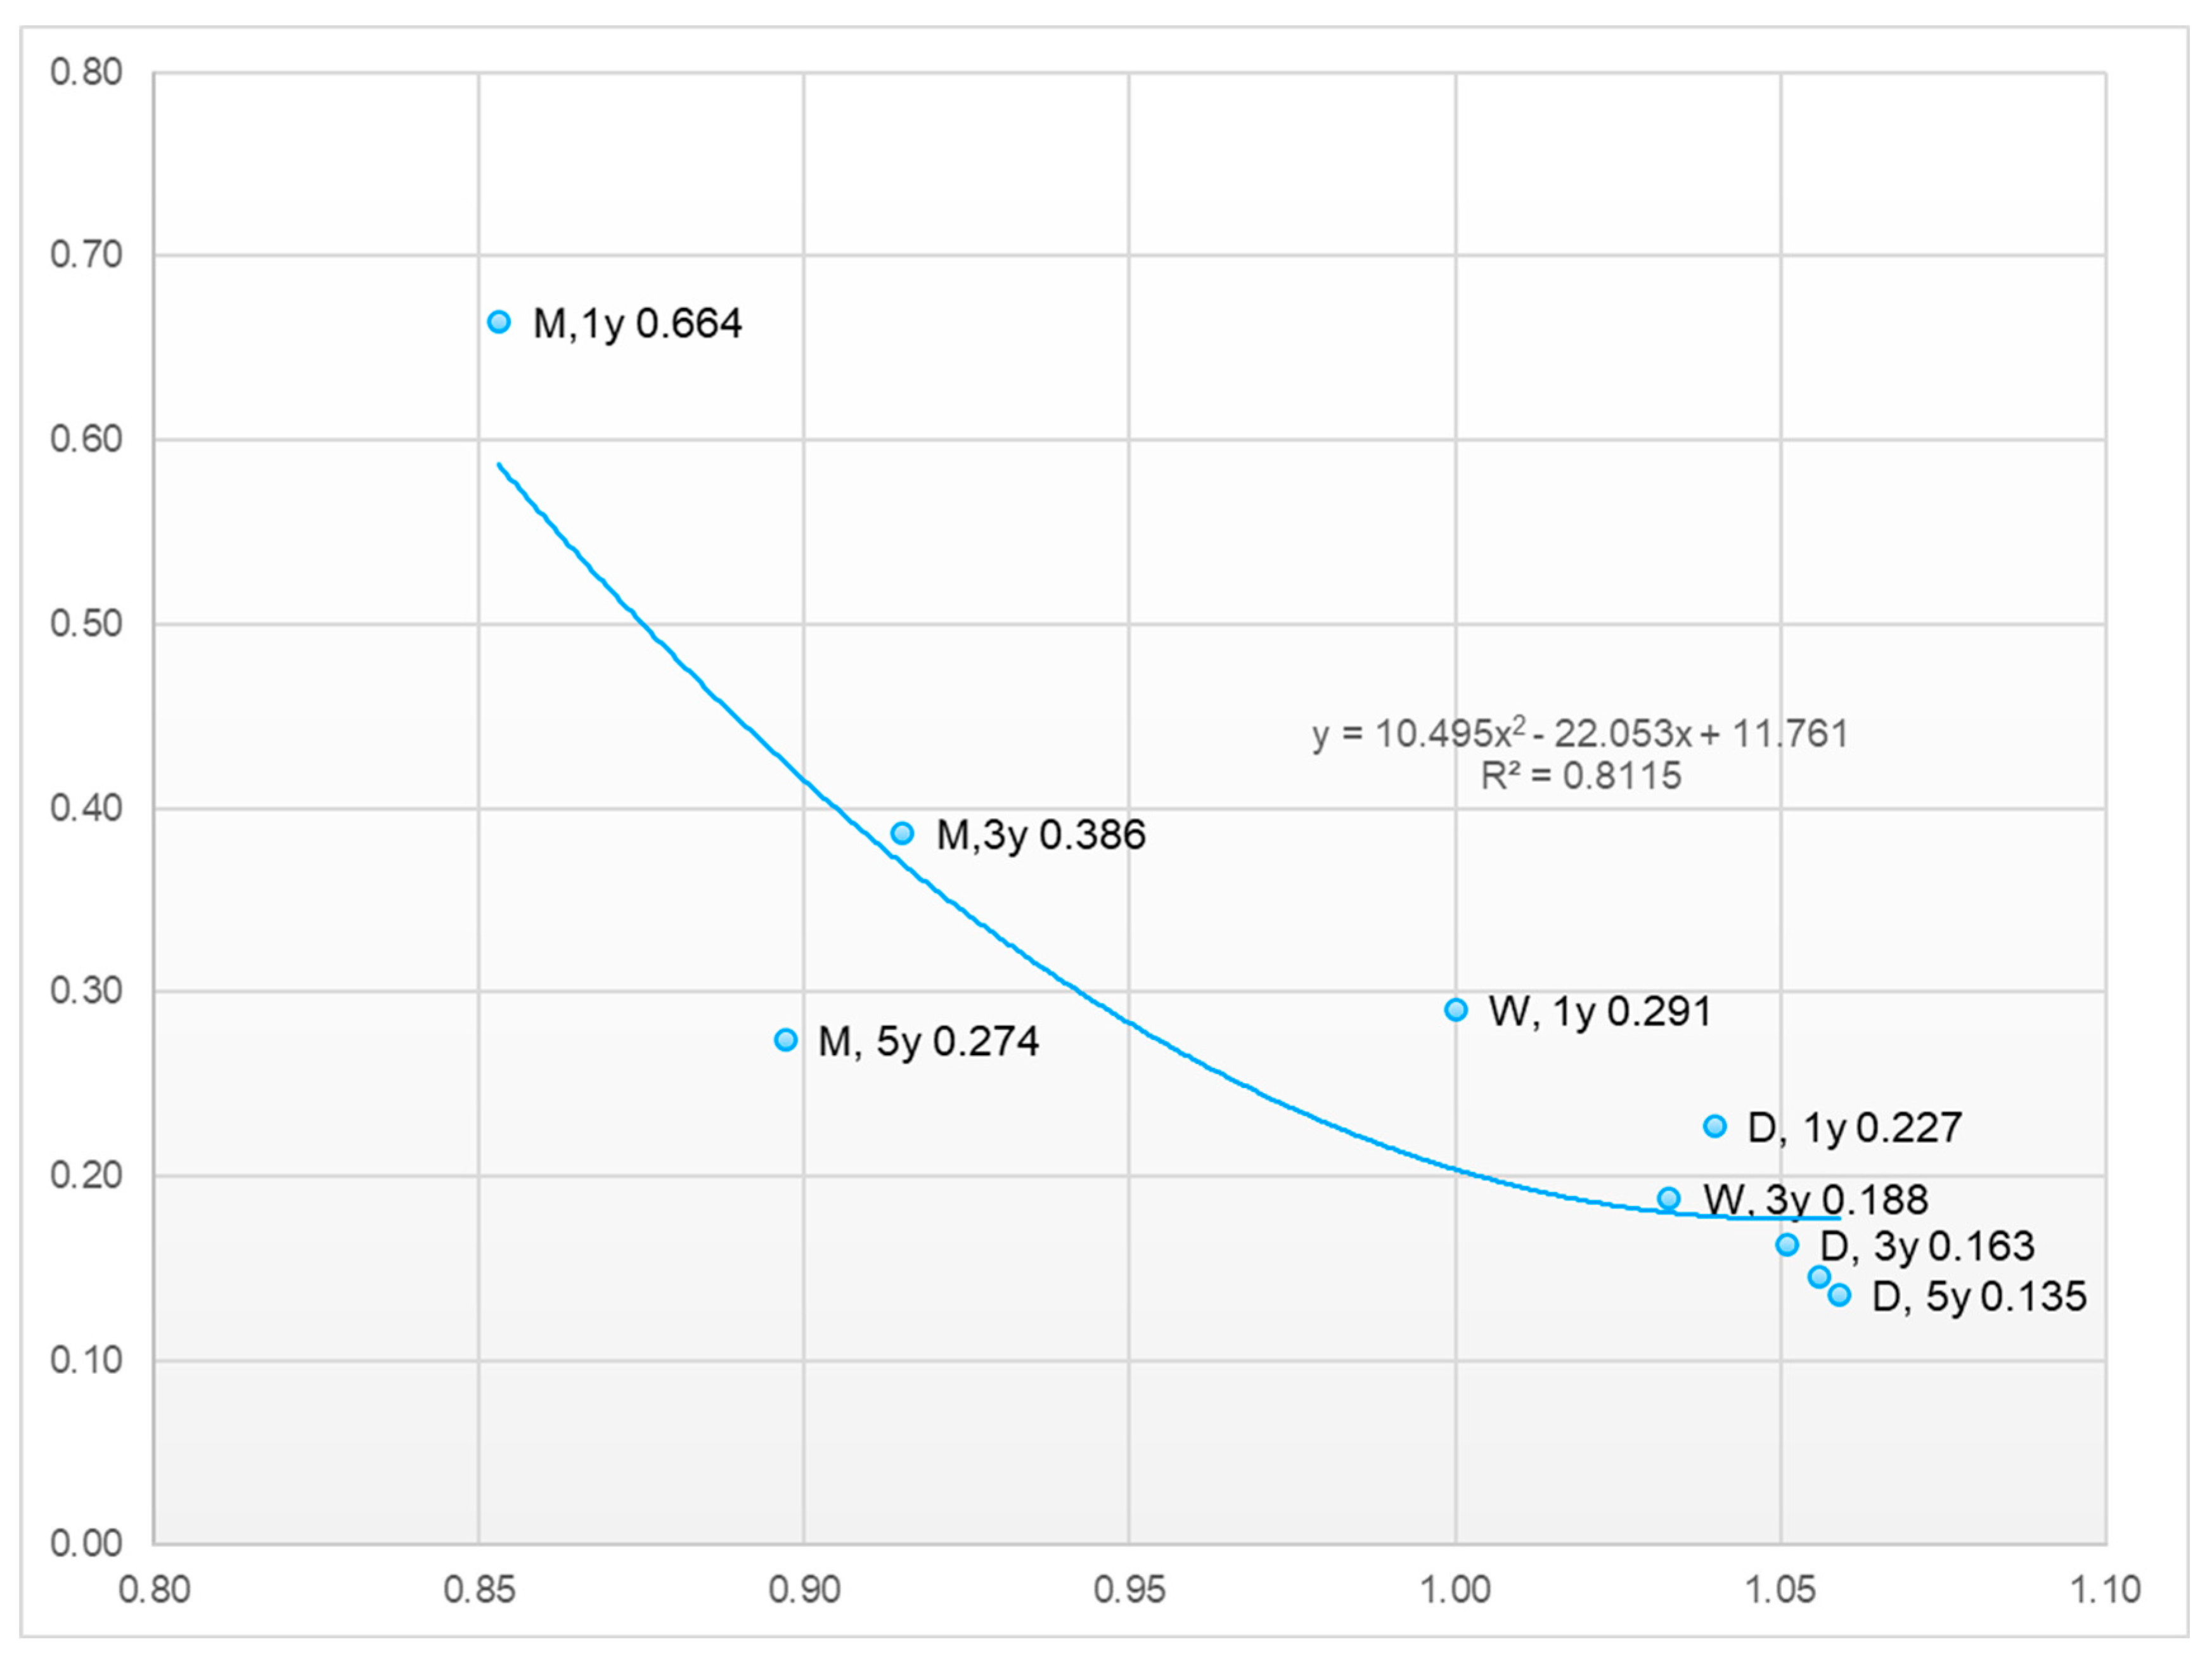
| d analysis | ||||||||||
| MAX | 0.990 | 1.030 | 1.030 | 1.230 | 1.210 | 1.080 | 1.130 | 1.120 | 1.110 | |
| MIN | 0.790 | 0.730 | 0.710 | 0.880 | 0.900 | 0.930 | 0.990 | 1.010 | 1.020 | |
| Average | 0.897 | 0.915 | 0.853 | 1.056 | 1.033 | 1.000 | 1.059 | 1.051 | 1.040 | 0.989 |
| Stdev/average | ||||||||||
| MAX | 0.437 | 0.534 | 1.225 | 0.301 | 0.360 | 0.471 | 0.211 | 0.232 | 0.284 | |
| MIN | 0.109 | 0.194 | 0.395 | 0.092 | 0.109 | 0.160 | 0.077 | 0.104 | 0.153 | |
| Average | 0.274 | 0.386 | 0.664 | 0.146 | 0.188 | 0.291 | 0.135 | 0.163 | 0.227 | 0.275 |
Disclaimer/Publisher’s Note: The statements, opinions and data contained in all publications are solely those of the individual author(s) and contributor(s) and not of MDPI and/or the editor(s). MDPI and/or the editor(s) disclaim responsibility for any injury to people or property resulting from any ideas, methods, instructions or products referred to in the content. |
© 2024 by the authors. Licensee MDPI, Basel, Switzerland. This article is an open access article distributed under the terms and conditions of the Creative Commons Attribution (CC BY) license (https://creativecommons.org/licenses/by/4.0/).
Share and Cite
Caporale, G.M.; Gil-Alana, L.A.; Martin-Valmayor, M. Persistence in the Realized Betas: Some Evidence from the Stock Market. J. Risk Financial Manag. 2024, 17, 149. https://doi.org/10.3390/jrfm17040149
Caporale GM, Gil-Alana LA, Martin-Valmayor M. Persistence in the Realized Betas: Some Evidence from the Stock Market. Journal of Risk and Financial Management. 2024; 17(4):149. https://doi.org/10.3390/jrfm17040149
Chicago/Turabian StyleCaporale, Guglielmo Maria, Luis A. Gil-Alana, and Miguel Martin-Valmayor. 2024. "Persistence in the Realized Betas: Some Evidence from the Stock Market" Journal of Risk and Financial Management 17, no. 4: 149. https://doi.org/10.3390/jrfm17040149
APA StyleCaporale, G. M., Gil-Alana, L. A., & Martin-Valmayor, M. (2024). Persistence in the Realized Betas: Some Evidence from the Stock Market. Journal of Risk and Financial Management, 17(4), 149. https://doi.org/10.3390/jrfm17040149