Article

Separating Equilibria with Search and Selection Effort: Evidence from the Auto Insurance Market

1
Center for the Business and Economics of Health (CBEH), School of Economics, The University of Queensland, St Lucia, Brisbane 4067, Australia
2
Department of Economics, University of Zurich, Rämistr. 71, 8006 Zurich, Switzerland
*
Author to whom correspondence should be addressed.
J. Risk Financial Manag. 2024, 17(4), 154; https://doi.org/10.3390/jrfm17040154
Submission received: 3 November 2023 / Revised: 26 March 2024 / Accepted: 30 March 2024 / Published: 11 April 2024
(This article belongs to the Special Issue Featured Papers in Mathematics and Finance)

Abstract

:
The objective of this paper is to assess the behavior of policyholders and insurance companies in the presence of adverse selection by accounting for costly search and selection efforts, respectively. Insurers seek to stave off high-risk types, while consumers are hypothesized to maximize coverage at a given premium. Reaction functions are derived for the two players giving rise to Nash equilibria in efforts space, which are separating almost certainly regardless of the share of low risks in the market. Empirical evidence from the Australian market for automobile insurance is analyzed using Structural Equation Modeling. Convergence has been achieved with both the developmental and test samples. Both consumer search and insurer selection are found to be positively correlated with risk type, providing a good measure of empirical support for the theoretical model.

1. Introduction

Ever since the seminal article by Rothschild and Stiglitz (1976), hereafter abbreviated as RS, both economists and policy-makers have been concerned about the effects of asymmetric information on insurance markets. Since an equilibrium pooling of high- and low-risk types cannot be sustained according to RS, an insurance company (IC henceforth) enrolling both types can be challenged by a competitor who launches a policy with limited coverage but a low premium that attracts only low-risk types. The incumbent IC may respond by launching separating contracts, one offering full coverage at a high premium (which appeals to the high-risk types), and the other offering limited coverage at a low premium (which appeals to the low-risk types only). Yet these separating contracts can still be challenged by an (unsustainable) pooling contract, provided the share of low-risk types is high enough, which potentially raises the specter of the nonexistence of equilibrium in insurance markets (Mimra and Wambach 2014).
However, to the best knowledge of the authors, the literature building on RS has accepted the implicit assumptions that the challenging IC does not incur any risk selection expense while low-risk types find the policy suiting them without undertaking costly effort. Both assumptions are far from reality. On the part of the ICs, risk selection involves the creation, marketing, and monitoring of policies—all costly activities. As to consumers, while the Internet abounds with sites designed to make their search easier [Choice (2024) and Consumer Reports (2019)], a survey suggests that many of them have difficulty finding a policy suited to their needs (Liferay 2019).
The objective of this contribution is to answer the following research question: could a separating equilibrium as described by RS be shown to exist, theoretically and empirically, in a market for insurance where policyholders and ICs engage in costly search and risk selection, respectively? Against this background, this contribution introduces the first costly search effort on the part of consumers and the risk selection effort on the part of ICs. In a competitive market, ICs set their selection effort, which is found to increase with consumers’ search effort. Second, consumers choose the policy granting them maximum coverage for the given premium, with high-risk types exerting more search effort than low-risk ones. In the Nash equilibria, they end up paying a higher premium while obtaining a higher degree of coverage. In contradistinction to RS, the existence of separating equilibria is almost certain and does not depend on the share of low risks in the market. Also, taking into account efforts is shown to generate new testable predictions. In particular, high-risk types undertake high search effort matched by high selection effort; conversely, in the case of low-risk types, low search effort combines with low selection effort. Third, this theoretical finding is tested using a rather comprehensive dataset on Australian auto insurance. Since both types of effort are not directly observable, Structural Equation Modeling (SEM) is applied, which permits distinguishing multiple indicators with their measurement errors from type-specific efforts as the latent variables making up the structural core. The hypothesized relationships between IC selection effort and risk type, on the one hand, and consumer search effort, on the other, receive a good measure of confirmation.
The remainder of this paper is structured as follows: Section 2 of the Literature Review provides a review of both the theoretical and empirical literature relating to the RS model. In Section 3 Materials and Methods, the interaction between an IC optimizing its risk selection effort and a consumer searching for a suitable policy (i.e., one offering a maximum amount of coverage for a given premium) is modeled. The resulting Nash equilibria are first characterized in efforts space and then projected into conventional RS wealth levels space. In Section 4 Empirical Analysis, a dataset containing indicators of both consumer search and IC selection efforts in the Australian auto insurance market is used to test these predictions using SEM. Section 5 offers a summary and concluding remarks.

2. Literature Review

2.1. Theoretical Literature

In 1976, RS presented a static model of a market for insurance, which relaxed the assumption of homogeneous loss probabilities and perfect information. High- and low-risk consumers exist and possess private information regarding their risk type. RS hypothesized the possibility of a separating equilibrium where high- and low-risk types accept different premium-coverage contracts. Their concept of non-linear pricing without cross-subsidization challenged earlier models of insurance markets with linear pricing, making policyholders pay the same average price for insurance and resulting in cross-subsidization [(Arrow 1970; Pauly 1974)].
Much of the analysis that followed has used game theory to more precisely define the nature of the interaction between insurance companies and customers (Rothschild and Stiglitz 1997). Immediately after the publication of RS, several theoretical papers sought to demonstrate the existence of an equilibrium in insurance markets by including IC behavior in their models.1
Wilson (1977) stated that while no equilibrium may exist if the incumbent IC has static expectations of challenger ICs, a pooling equilibrium may exist if expectations can be revised. Spence (1978) extended Wilson’s (1977) analysis to include a menu of contracts and derived an equilibrium with separating, cross-subsidizing contracts. Jaynes (1978) relaxed the assumption that contracts are exclusive and ICs do not share information. Firms that share information offer a pooling contract, while those that abstain underwrite contracts for high-risk policyholders. Riley (1979) posited that if a challenger can respond with a new contract, a separating equilibrium is possible. Engers and Fernandez (1987) generalized Riley’s (1979) reactive equilibrium by considering the possibility of adding multiple new contracts.
Hellwig (1987) recast the RS model in the mold of a two-stage game where, in the first stage, uninformed ICs offer contracts and, in the second stage, informed consumers choice of contracts. Realism is added to the model by including a third stage, where ICs can reject consumers’ applications, in contrast to Wilson (1977), who proposed that loss-making contracts are not necessarily withdrawn to create a sustainable pooling equilibrium. He noted quite generally that the exact formulation of the game may change predictions substantially. Asheim and Nilssen (1996) varied the conditions of the game by allowing ICs to renegotiate contracts with their policyholders, such that the revised contract is universally offered to all policyholders, while Netzer and Scheuer (2014) allow the IC to exit from the market altogether. Both models predict a separating equilibrium.
A recent focus of the RS literature [Ales and Maziero (2014), Attar et al. (2011, 2014, 2016, and 2020)] has been to explore the implications for equilibrium under adverse selection when insurers do not know whether or not to sell their contracts exclusively. In this situation, the predicted outcomes are (i) no coverage of low-risk types or (ii) an absence of equilibrium, although Attar et al. (2011) have argued that some pooling and hence coverage of low-risk types could also exist.
Research that was initially published as a working paper by Stiglitz et al. (2017) and subsequently revisited by Kosenko et al. (2023) models a market for insurance that incorporates information revelation strategies by consumers and insurers. Kosenko et al. (2023) introduce bilateral endogenous information disclosure about insurance purchases. They assume non-exclusivity in that consumers buy from multiple sellers while insurers offer contracts to consumers not observed by competitors. Each consumer and insurer can make strategic decisions about what information to disclose to whom. The authors find that there always exists an equilibrium outcome, which entails partial pooling. According to Kosenko et al. (2023), their contribution differs from those of Jaynes (1978), Jaynes (2011), and Hellwig (1987) because it considers information revelation by consumers as well as between insurers.
As will be described in greater detail below, this paper also models the interaction between insurer and policyholder. However, it does not assume that the two players passively process information that has been strategically revealed to them. Rather, they actively seek out, at non-zero cost, their preferred policy and undertake a selection effort. It is only through the two players’ interaction in the Nash equilibrium that the risk types are revealed.

2.2. Empirical Literature

Kosenko et al. (2023) conclude their paper by identifying a need for empirical research. We hope that our results provide an impetus for further policy and empirical applications, with insights into why certain markets take the form they do and how one might improve the design of markets with asymmetric information (Kosenko et al., 2023, p. 146).
Mimra and Wambach (2014) had already noted the paucity of empirical evidence. Curiously, although there is by now substantial empirical literature investigating whether adverse selection is prevalent and important in insurance markets2, the question of whether the allocation in these markets is of the RS-type or the Miyazaki-Wilson-Spence (MWS) type has so far been neglected. (Mimra and Wambach 2014, p. 15).
Indeed, the authors of this contribution could find only two research papers that explicitly tested for evidence of a separating equilibrium in an insurance market. The first, written by Dionne and Doherty (1994), importantly introduced experience rating into the RS model. The authors modeled the effect of semi-commitment with renegotiation (defined as insurance with an option to renew with pre-specified conditions) and contrasted its implications with single-period and no-commitment models. Under competitive conditions, an IC offers a pooling policy with partial coverage in the first period and an experience-rated, separating set of policies in the second period. They tested their theoretical predictions using aggregated Californian automobile insurance data. They report that some automobile insurers use commitment to attract low-risk policyholders, while others attract high-risk policyholders, which is presented as evidence of a separating equilibrium.
The second paper, by Puelz and Snow (1994), used claims data from an automobile crash insurer in Georgia to test for evidence of a separating equilibrium. They claimed their analysis supports the hypothesis of adverse selection with a separating equilibrium. Despite criticism that the test for adverse selection did not control for ex ante moral hazard (Chiappori 1999; Chiappori and Salanié 2000; Dionne et al. 2001), their paper still offers a credible test of the proposition contained in the RS paradigm.
A third identified paper published by Dionne et al. (2013) does not report an explicit test for separating equilibrium. However, arguably their evidence regarding ex ante moral hazards in the French market for automobile insurance using longitudinal data suggests the emergence of a separating equilibrium. The authors distinguish between a liability-only (responsabilite civile) and a comprehensive optional (assurance tous risques) contract, both experience-rated. Their analysis based on parameters characteristic of the French market shows that the probability of a high-risk type having a comprehensive policy exceeds that of a low-risk type, with the difference in probabilities increasing rather than diminishing over time. This suggests that separating contracts emerges over time through learning by both consumers and insurers.
While remaining close to the RS paradigm for facilitating comparison, this contribution differs from the received literature in three ways. First, it introduces costly searches on the part of consumers and costly selection efforts on the part of ICs. Second, it derives Nash equilibria in efforts space along with several new testable predictions. Finally, it benefits from a large array of indicators of Australian consumers’ search effort and ICs’ selection effort for testing a core prediction.

3. Materials and Methods

The interaction between an IC optimizing its risk selection effort and a consumer searching for a suitable policy (i.e., one offering a maximum amount of coverage for a given premium) is modeled. The resulting Nash equilibria are first characterized in effort space and then projected into conventional RS wealth level space.

3.1. A Game-Theoretic Model with Consumer Search Effort and IC Selection Effort
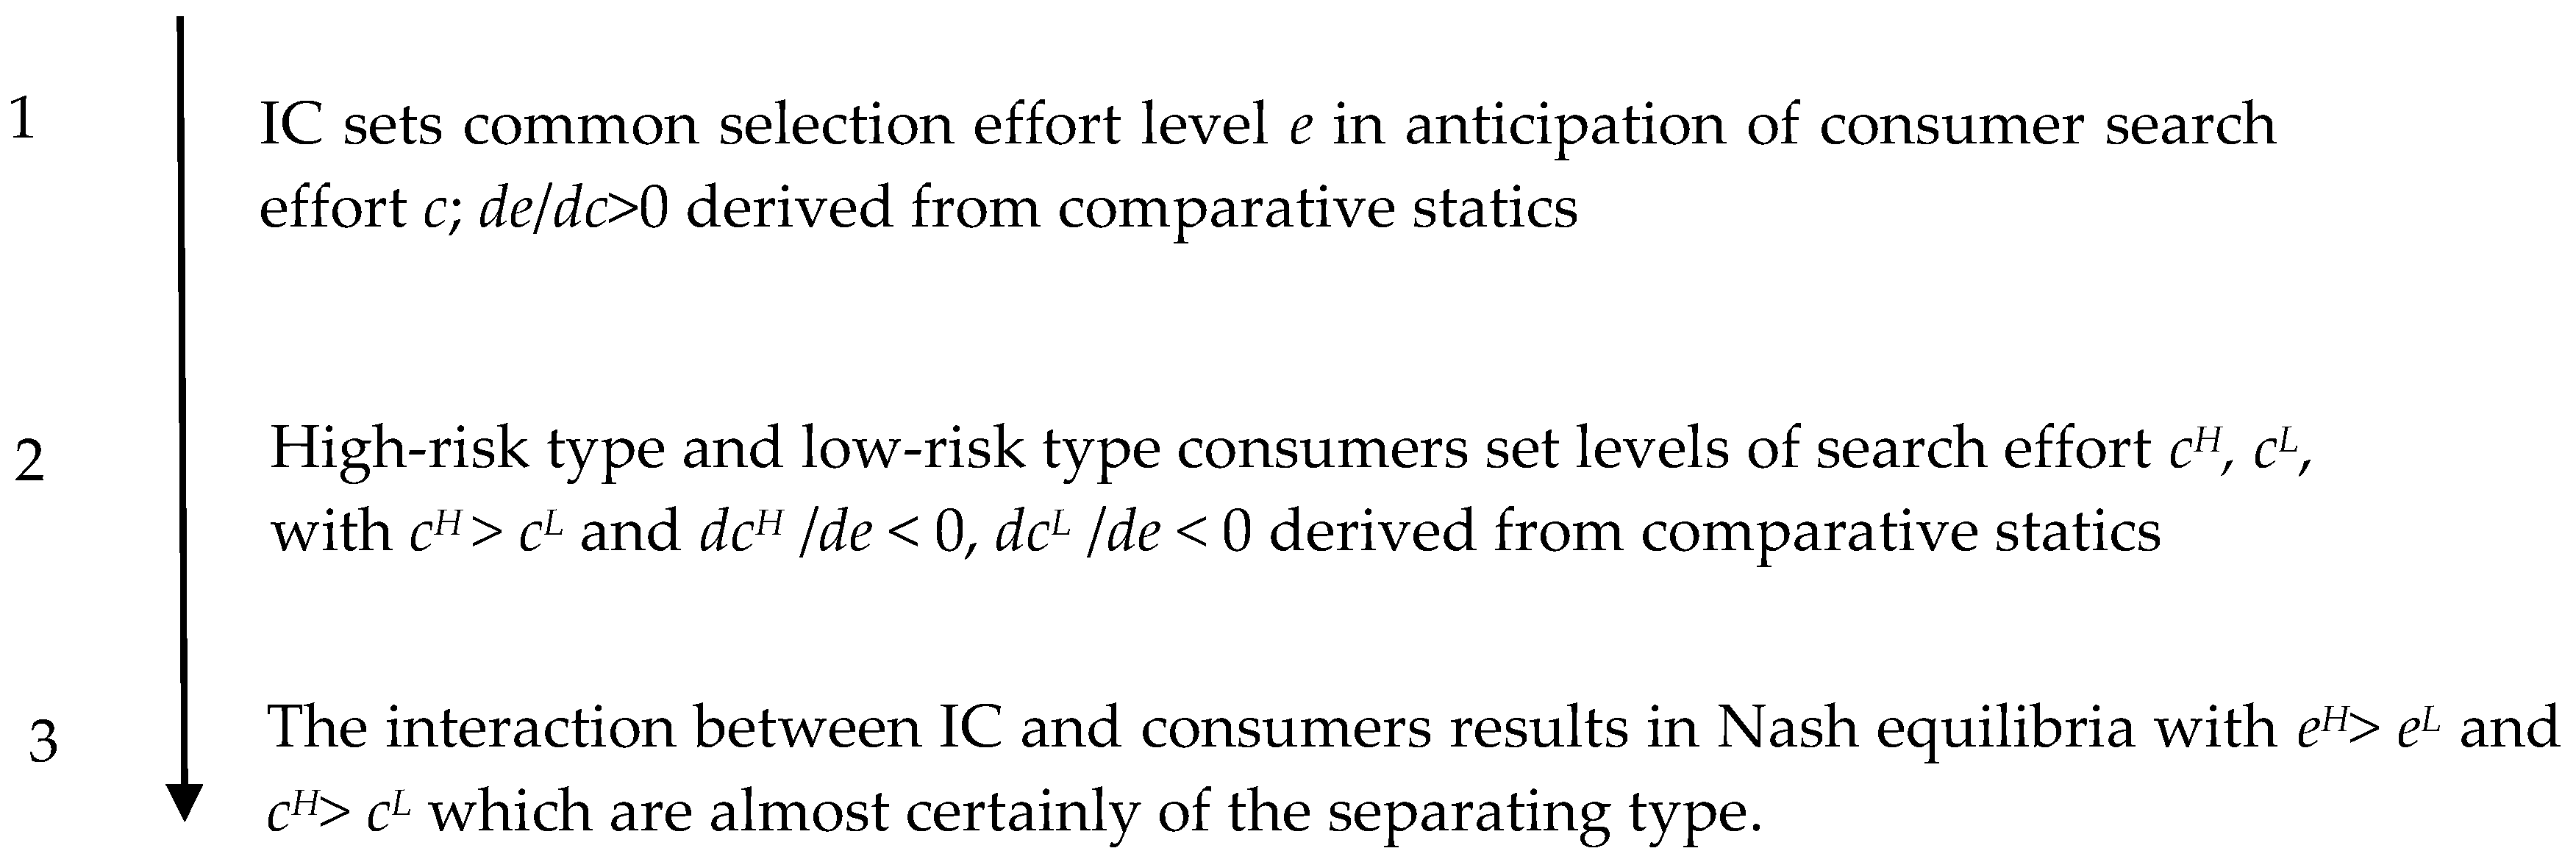
Both the extant theoretical and empirical literature neglect an important fact: both high-risk (cH) and low-risk (cL) consumers engage in costly search efforts (c) to find insurance policies that best suit them. In turn, ICs engage in a costly selection effort (e) designed to attract low-risk and avoid high-risk consumers without being able to distinguish between them initially.
In this section, a simple game-theoretic model is developed to determine Nash equilibria for high- and low-risk types in effort space. Note that both types of effort are implicit in the RS model (otherwise, there would never be a challenger of the incumbent IC, and high-risk types would not infiltrate the contract designed for the low-risk ones). In the present model, search effort and risk selection effort are the decision variables controlled by the respective players. Figure 1 shows the stages of the game.
  • Stage 1: Insurers
Insurers are viewed as expected profit maximizers,
E Π e = π e P H e E I H c H + 1 π e P L e E I L c L e ,
with E Π denoting expected profit, π ( e ) , the probability of enrolling a high-risk type depending on risk selection effort e (at unit cost of one for simplicity) with π / e < 0 and π 2 / e 2 > 0 indicating decreasing marginal effectiveness. The notation emphasizes the fact that when launching a contract, the IC cannot identify risk types and has to set the selection effort at a single value e . Premiums P H e   P L e are market-determined (see stage 3) but must cover both the expected value of claims E I H =   ρ ¯ I H c H and E I L = ρ ¯ I L c L , respectively based on the known population average of loss probability ρ ¯ as well as the cost of selection effort. The first-order condition for an interior optimum reads,
d E Π d e = π / e P H E I H c H P L E I L c L 1 = 0 .
This shows that selection effort has a positive marginal return if the expected margin on the high-risk types P H E I H c H is smaller than that on the low-risk types P L E I L c L . The difference between the two margins is especially marked if P L E I L c L < 0 , as is often the case under community rating [which has been argued to induce risk selection in health insurance by Pauly et al. (2007)].
Through the marginal effectiveness of consumers’ search efforts, the IC’s reaction function in principle depends on the risk type it is confronted with [see Equation (A3) of Appendix A.1]. However, since the IC cannot distinguish between risk types prior to the determination of the Nash equilibria (which depend on the consumers’ reaction functions), only one IC reaction function is shown in Figure 2, with
d e d c > 0 .
  • Stage 2: Consumers
Consumers are seen as expected utility maximizers who undertake search efforts to secure a maximum amount of coverage at the going premium:3
E U c H H = ρ H υ H W 0 + I H c H , e H L P H e + 1 ρ H υ H W 0 P H e c H ;  
E U c L = ρ L υ L W 0 + I L c L , e L L P L e + 1 ρ L υ L W 0 P L e c L .  
Here, E U H E U L denotes the expected utility of a high- (low-) risk type, υ H υ L , VNM (Von Neumann and Morgenstern) risk utility functions with υ H > 0 ( υ L > 0 ) and υ H < 0 υ L < 0 , W 0 , exogenous initial wealth, I H c H , e [ I L c L , e ] the degree of coverage, which depends on search effort with I H 0 , = 0 , I L 0 , = 0 , I H / c H > 0 , I L / c L > 0 , and ρ H ( ρ L , ρ l < ρ H ) the loss probabilities4. For simplicity, search effort by consumers is assumed to have a unit cost of one.
However, insurance coverage also depends on the IC’s selection effort e . Arguably, selection effort lowers the effectiveness of consumer search, implying 2 I H / c H e < 0 , I L / c L e < 0 . The reason is that it burdens consumers with transaction costs, e.g., extra documentation. Recall that selection effort initially has a common value because the IC cannot distinguish between risk types (however, values of e differ in the Nash equilibria due to differing consumer responses).
The first-order conditions for an interior optimum5 are given by
d E U d c H H = ρ H υ H W 0 + I H c H , e L P H e I H / c H 1 = 0 ;  
d E U d c L L = ρ L υ L W 0 + I L c L , e L P L e I L / c L 1 = 0 .
Note that unless the derivatives of I(∙) functions differ substantially (for which there is no apparent reason), the high-risk types are predicted to undertake more effort than the low-risk ones. First, ρ H > ρ L ; second, given risk aversion and identical initial wealth, this implies υ H W > υ L W ; third, this difference is not neutralized because the high-risk type’s amount of coverage is matched by a higher premium (see Stage 3 below). Thus, the marginal benefit of search is higher for the high-risk types than the low-risk ones, while its marginal cost is the same by assumption, inducing more search effort.
The derivation of the consumers’ reaction functions is relegated to Appendix A.2 [see Equations (A4) and (A5)]; their slopes are
d c d e H < 0 , d c d e L < 0 ,   with   d c d e H > d c d e L
In Figure 2, the reaction functions are drawn as straight lines (with d c H / d e running flatter since cH and cL are depicted on the horizontal axis) since nothing can be said about their curvature, which depends on the third derivatives of the functions I H c H , e and I L c L , e , respectively. However, the reaction function of the high-risk type is farther out in the relevant domain because the respective probabilities are multiplied with first-order derivatives in Equations (5a) and (5b), which must dominate the second-order ones lest they change sign from positive to negative, contradicting assumptions.
  • Stage 3: Nash equilibria in efforts and wealth levels space
Given the reaction functions, the resulting Nash equilibria can now be characterized; in effort space and are represented by E H and E L in Figure 2. It shows that, from the interaction with consumers, the IC can now distinguish between the two risk types. Even if it is unable to replace the common value of loss probability ρ ¯ by ρ H and ρ L , respectively, it will charge premiums P H and P L < P H to recover its costly risk election efforts e H (with e L < e H ), presumably in the guise of a proportional loading. Evidently, a separating equilibrium in the market is almost certain to exist. Nonexistence would require consumers to exert almost no search effort regardless of the IC’s selection effort (indicated by the two dashed lines that do not intersect with the IC’s reaction function), contrary to evidence, especially in the context of renewals of auto insurance policies (Mathews 2022).
Conversely, the likelihood of a pooling equilibrium occurring (Ep) is also very low. The two consumer types would have to exert exactly the same amount of effort in response to the selection effort by the IC. Moreover, pooling equilibria beyond E p can be excluded because they contradict first-order conditions (4a) and (4b), calling for high-risk types to exert more effort than low ones. Finally, the separating equilibrium is sustainable because it does not depend on the share of low-risk types in the population and cannot be challenged by a competing contract, in contradistinction with the conventional RS framework.

3.2. Theoretical Findings

3.2.1. Results in Efforts Space

Figure 2 shows a separating equilibrium modeled in effort space. High-risk consumers are predicted to exert high search effort, which is matched by high selection effort on the part of the IC, while low-risk ones exert little search effort combined with low selection effort.
A Testable Prediction. The interaction of risk-selecting insurers with consumers searching for maximum coverage given the premium is predicted to result in a separating Nash equilibrium (which is almost certain to exist) that is characterized by high selection effort combined with high consumer search effort in the case of high-risk types (EH) and low selection effort combined with low search effort in the case of low-risk ones (EL).
Other theoretical insights implied by Figure 2, which are not available in the conventional RS approach, include:
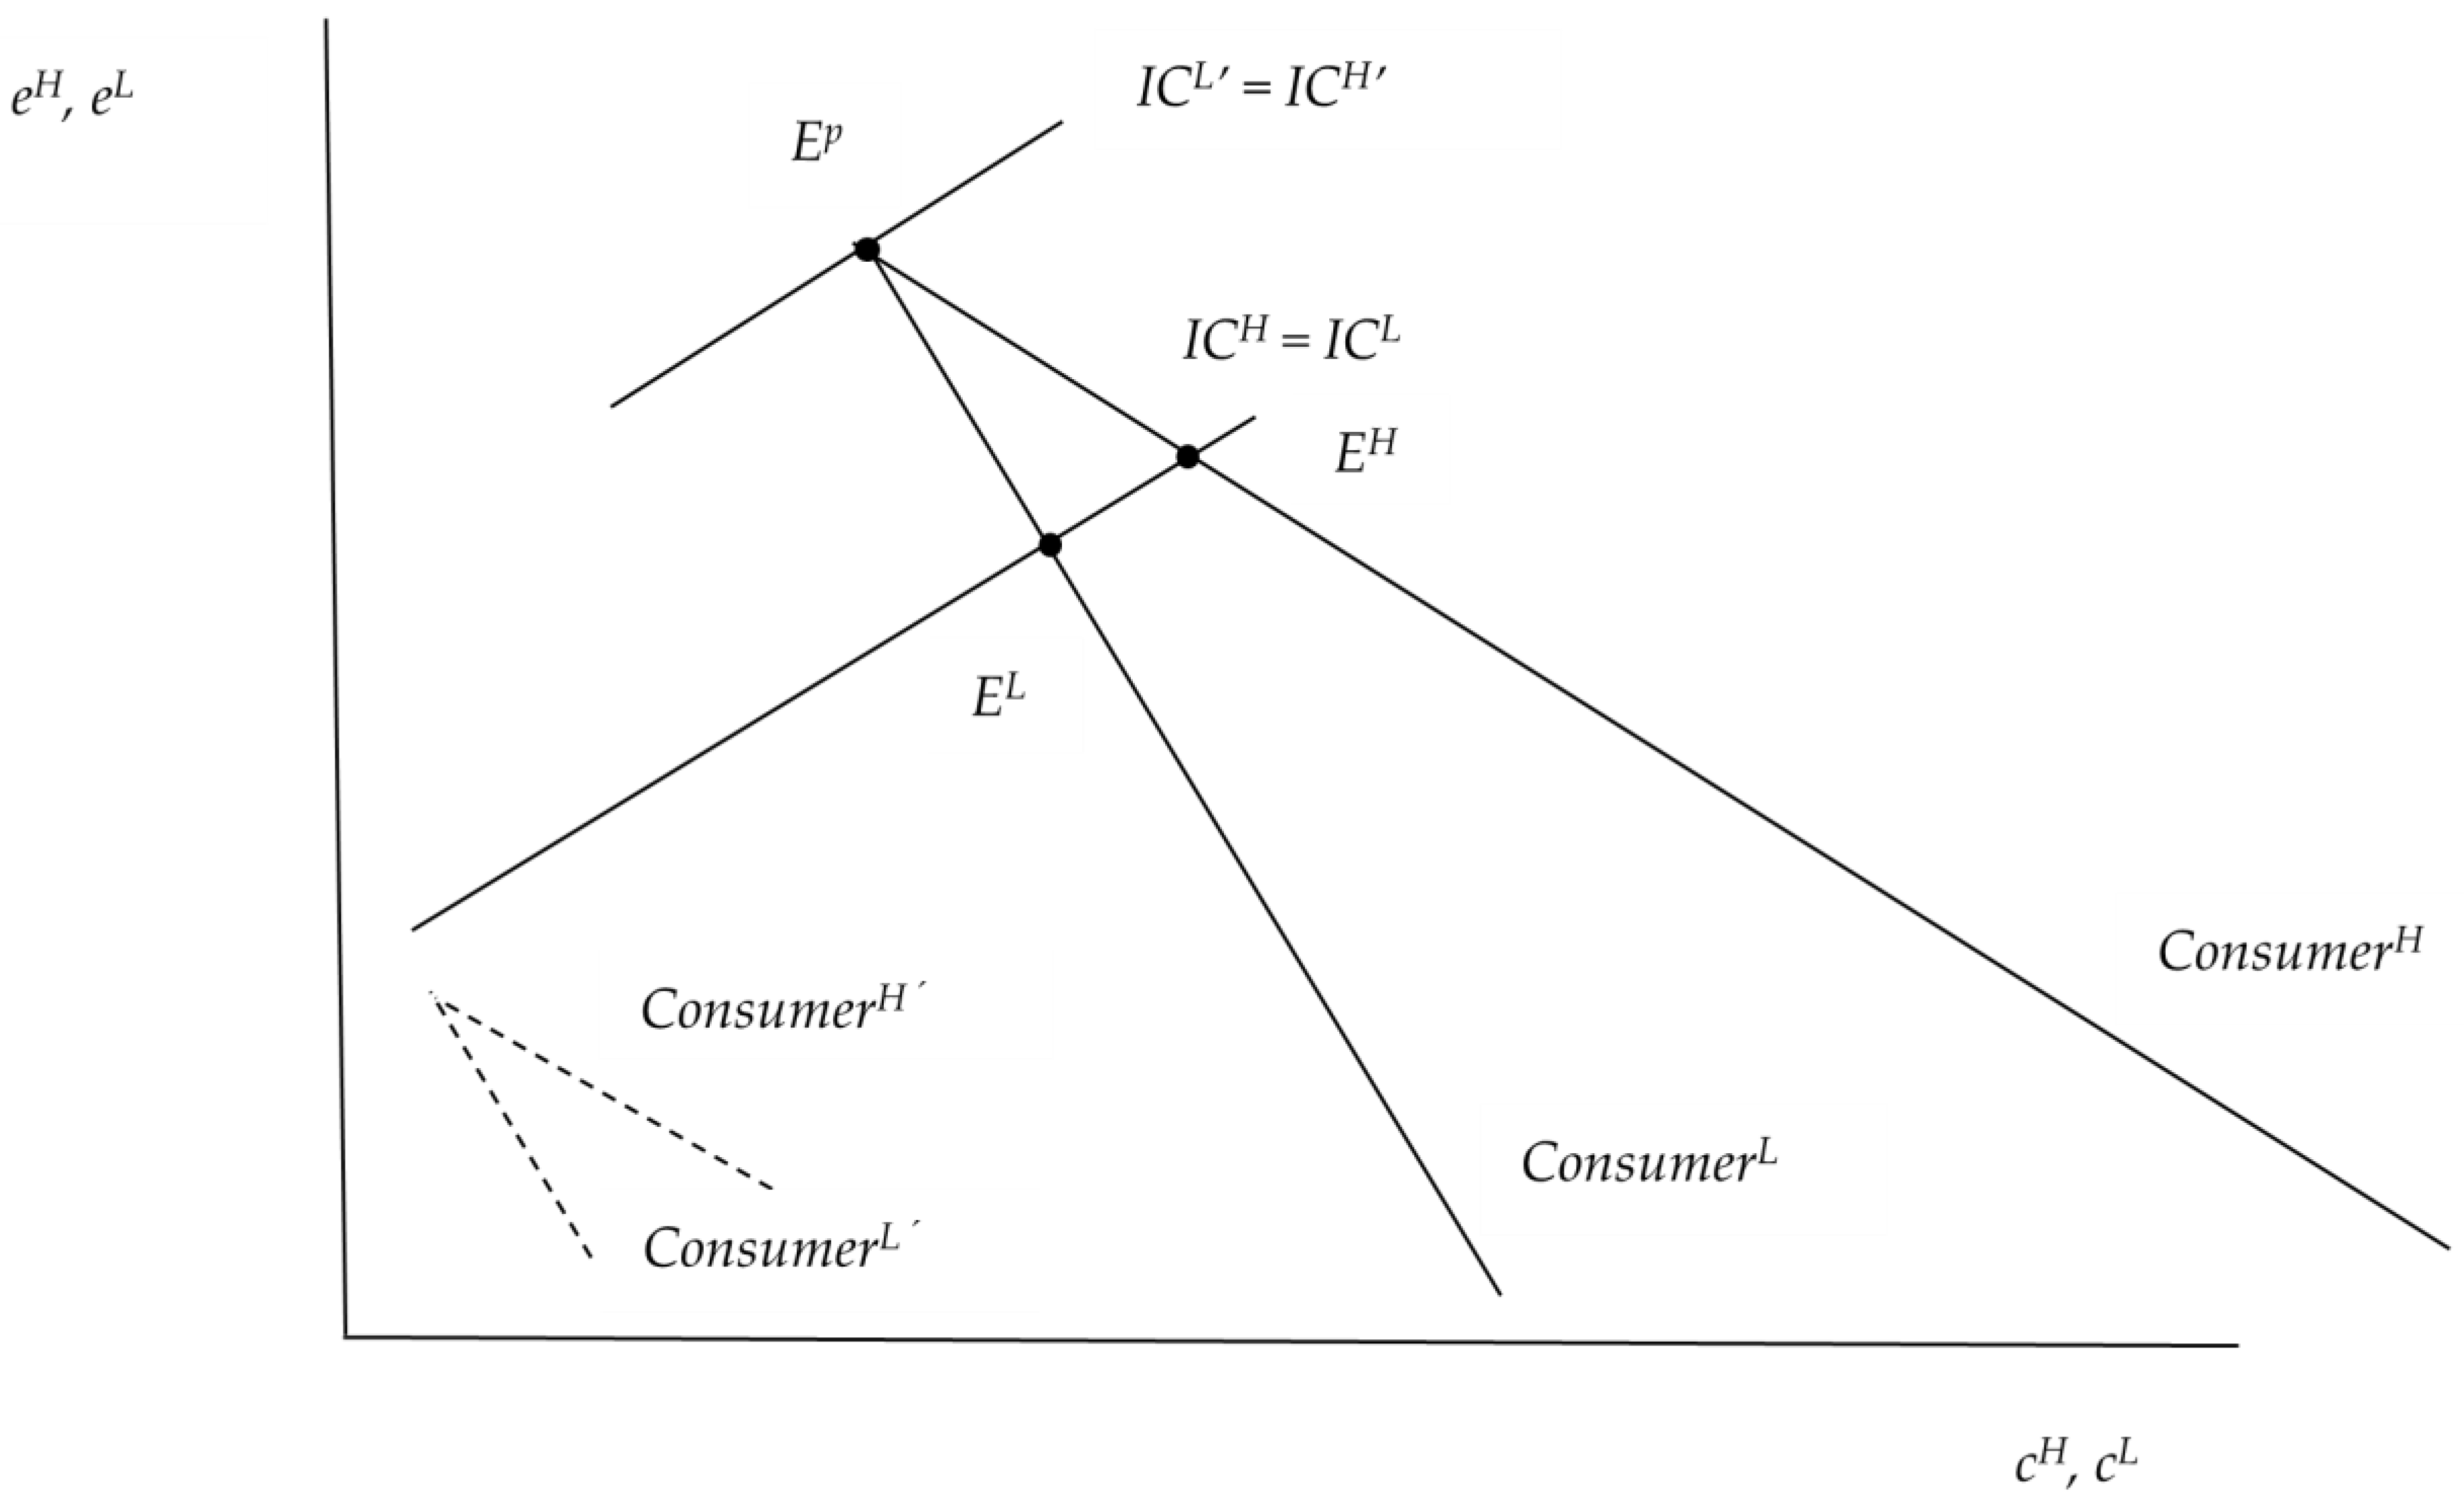
  • On the IC’s side, information, e.g., concerning miles driven per year, quality of roads typically traveled, and crime incidence in the area of residence, may make the IC’s risk selection effort more effective in the case of auto insurance. This increases π / e in absolute value, causing the slope of the IC’s reaction function to increase according to Equations (A3) of Appendix A.1. The result is a greater difference between e H and e L (facilitating the separation of equilibria) combined with a smaller difference between c H and c L (see Figure 2).
  • The same effects are predicted ceteris paribus if consumers’ search effort becomes more effective, e.g., due to the Internet, media such as Consumer Reports, and public regulation designed to enhance transparency. In Equations (A4) and (A5) of Appendix A.2, the terms E I H / c H > 0 and E I L / c L > 0 increase, and with them, IC’s reaction function in Figure 2 becomes more responsive to consumers’ search efforts.
  • The ceteris paribus clause above cannot be neglected because the consumers’ reaction functions would be affected as well. In Equations (A4) and (A5), the terms 2 I H / c H e < 0 and 2 I L / c L e < 0 go towards zero, indicating that the IC’s risk selection effort does not counterbalance consumers’ search effort to the same extent when they are better informed. In Figure 2, the reaction function labeled ConsumerH in particular becomes more responsive to IC’s selection effort since the term 2 I H / c H e is multiplied by ρ H > ρ L , causing the differences between e H and e L as well as c H and c L to increase.
  • Differences in risk aversion [indicated by R A H = υ H / υ H > 0 and R A L = υ L / υ L > 0 in Equations (A4) and (A5)] have an impact on consumers’ reaction functions. For instance, let R A H increase relative to R A L ; a possible reason is that high-risk types happen to coincide with higher age, which is associated with increased risk aversion (Halek and Elisenhauer 2001). This has the effect of making the high risk’s response to IC selection effort more marked, resulting in a flatter ConsumerH line of Figure 2 and hence a larger difference between e H and e L as well as c H and c L .

3.2.2. Results in Wealth Space

In view of the deeply entrenched RS approach, it was important to explore whether and how the prediction from effort space (see Figure 2) carries over to the two-state wealth space (W1, W2) described in the conventional RS model (see Figure 3). The projection in Figure 3 reveals several differences from the RS model:
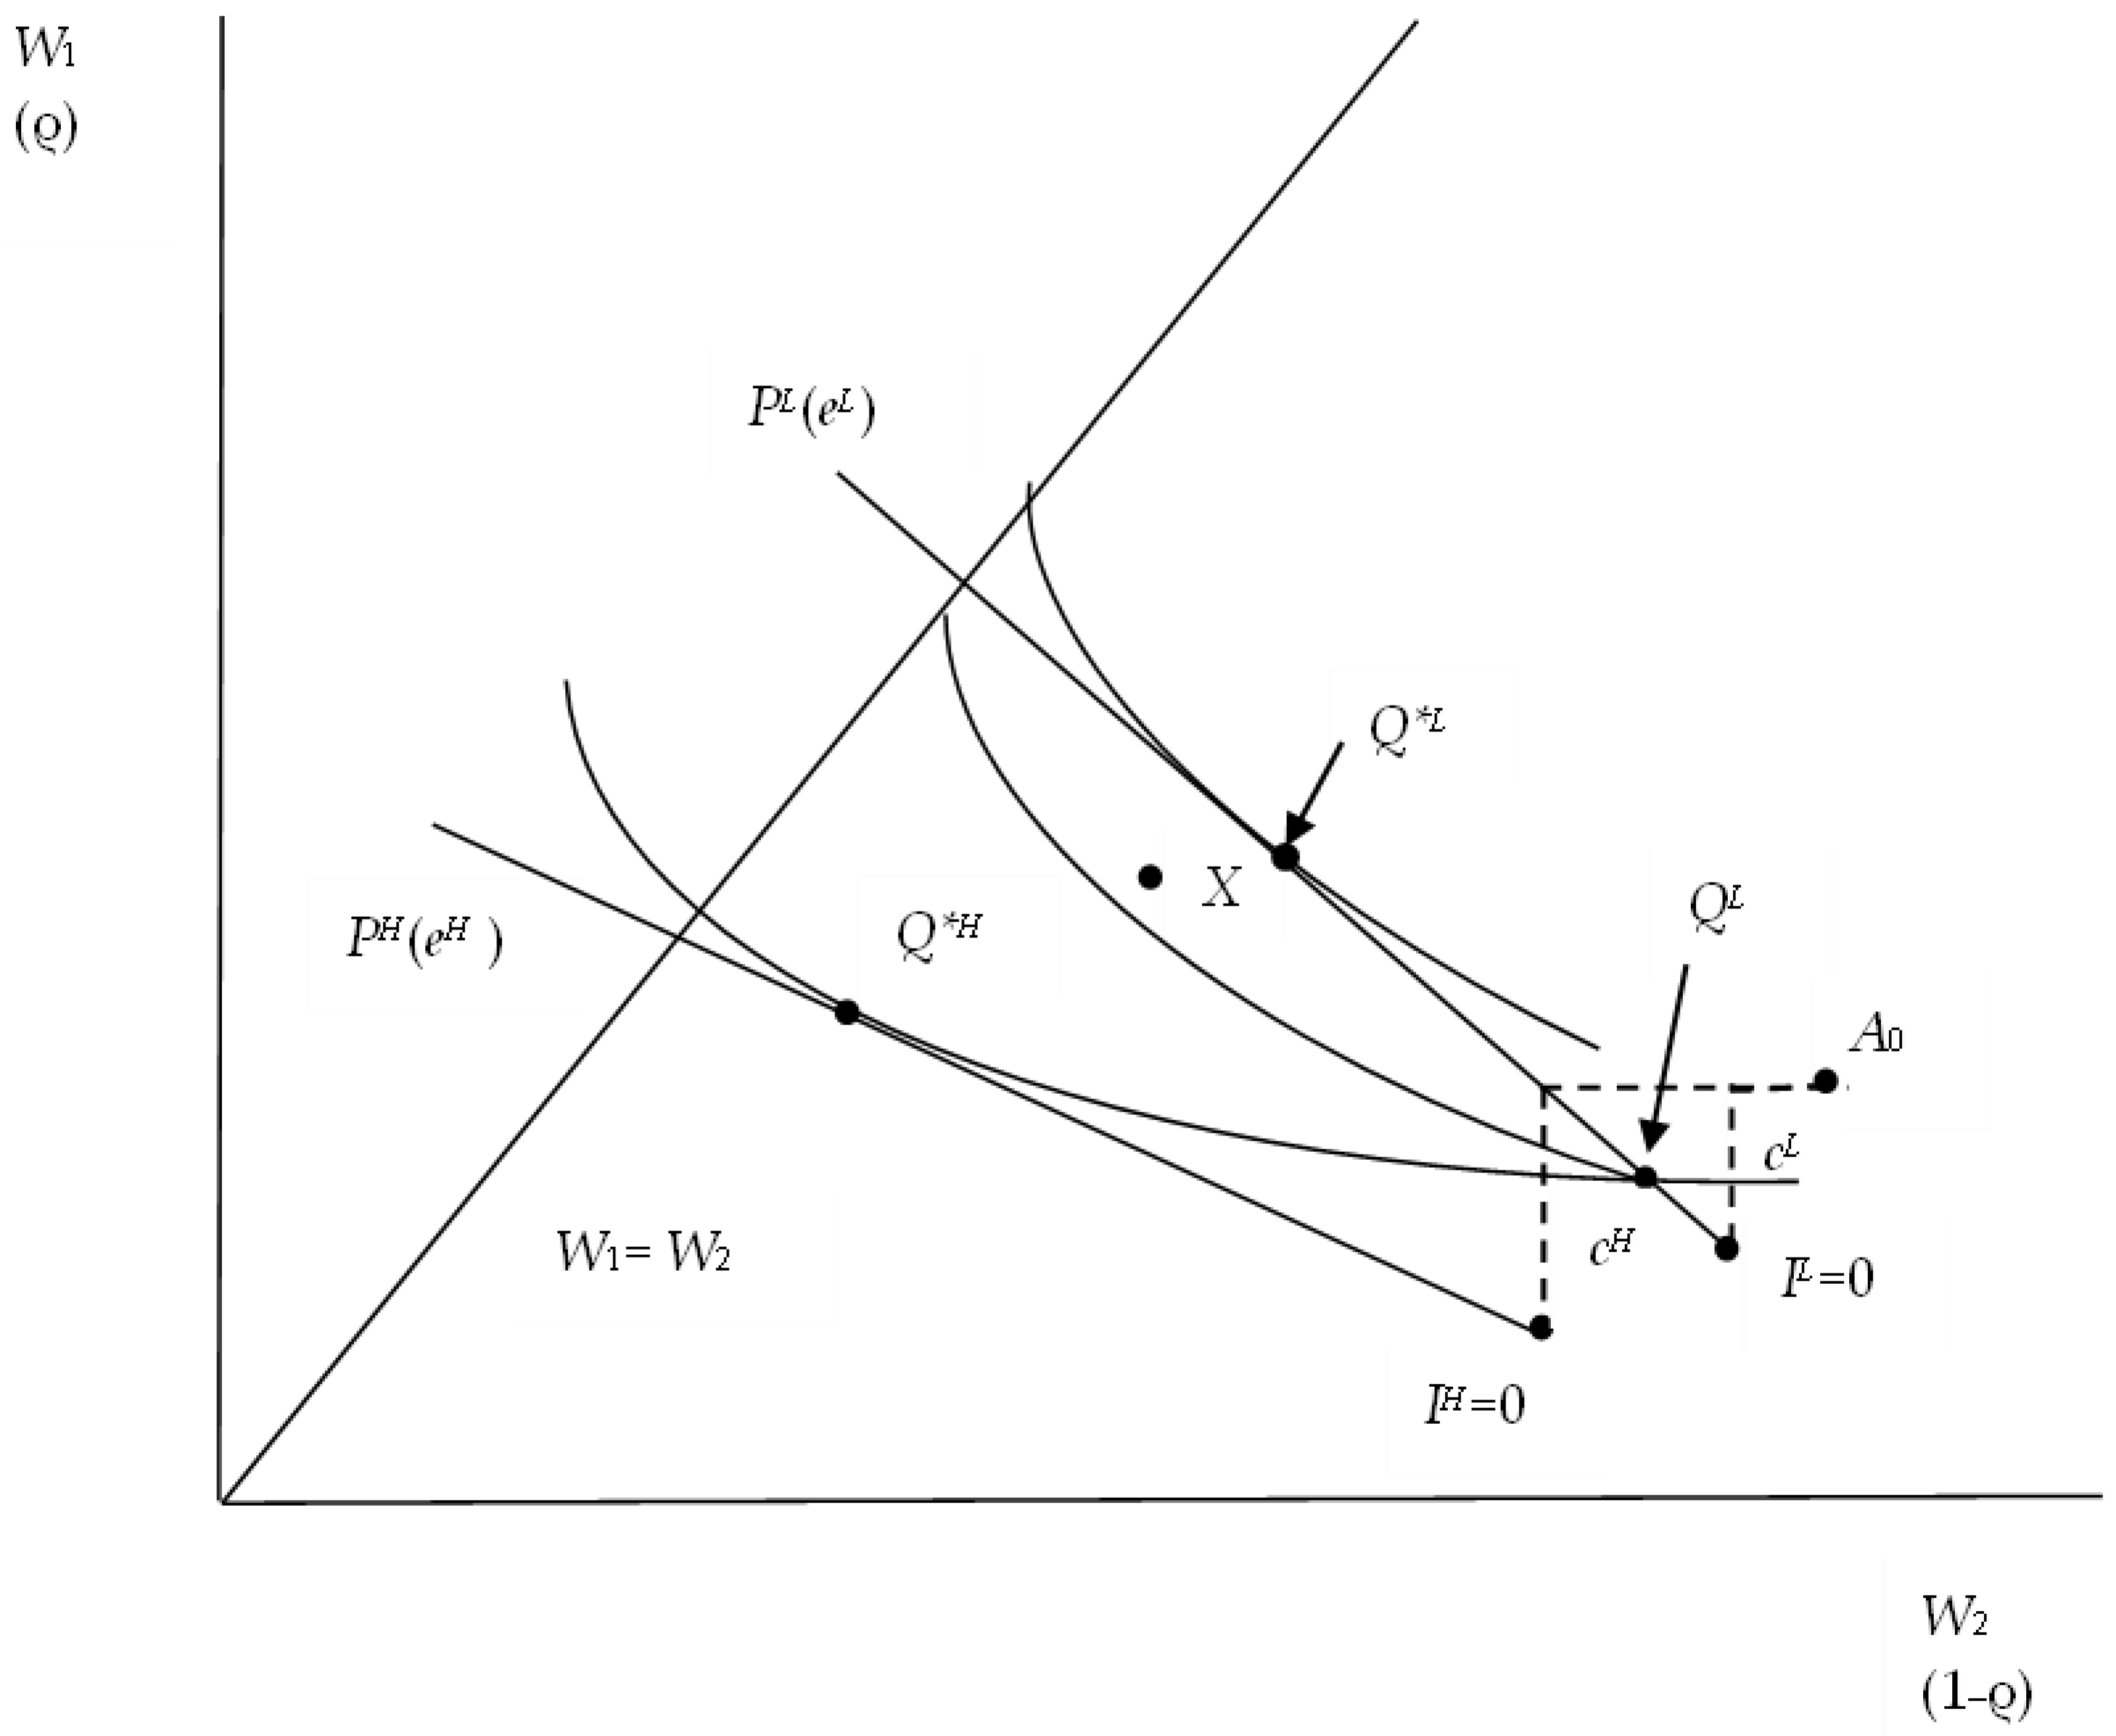
  • Since the IC makes a risk selection effort, the cost, which typically gives rise to a proportional loading, a (marginally) fair premium is excluded from the onset. Therefore, at C*L, high-risk types necessarily opt for partial coverage.
  • Even though the IC is not able to infer the true loss probabilities, forcing it to continue using the average value ρ ¯ , the insurance line labelled PH(eH) has a lower slope than PL(eL), reflecting the IC’s higher amount of risk selection effort in its interaction with a high-risk type in stage 3.
  • Because high-risk types are predicted to invest relatively more effort in seeking out the contract that maximizes coverage for a given premium, they bear a higher initial transaction cost, cH, which shifts the origin of their insurance line from A0 to IH = 0. Thus, the probability of I H = 0 constituting the optimum is far greater than in the RS approach. This provides an explanation for the observation that it is the widely discussed inability of high-risk types to obtain insurance coverage that constitutes a policy issue rather than the rationing of low-risk types’ coverage at Q L because of the need to maintain a separating equilibrium.
  • The location of the optimum C*H in Figure 3 depends on the parameters appearing in Equation (A4), viz. υ H , R A H , E I H / c H , and importantly on the IC’s amount of selection effort e and hence π / e in Equation (2).
  • In the RS modeling, the pooling contract X (see Figure 3) can undermine a separating equilibrium provided the share of low-risk types in the population is sufficiently high (the pooling insurance line must run close to that labeled PL(eL).Yet when consumer search and insurer selection efforts are considered, a pooling equilibrium can be excluded almost with certainty, which implies that the separating equilibrium cannot be undermined. (see Ep in Figure 2 again).
Since the findings derived from the efforts space (see Figure 2 again) carry over to the wealth-levels space of Figure 3, the comparison of the present analysis with the conventional RS model can be summed up as follows: The interaction of consumers searching for maximum coverage given the premium and the risk-selecting insurer is more likely to result in a separating Nash equilibrium but also to involve no insurance coverage for high-risk types than in the RS framework. Moreover, contrary to RS, it cannot be undermined by a pooling contract, regardless of the share of low-risk types in the population.

4. Empirical Analysis

Data from the Australian market for automobile insurance (as described in Section 4.1) will be used to empirically test (as specified in Section 4.2 and Section 4.3) the central prediction from Figure 2 (effort space). That is, high-risk consumers are predicted to exert high search effort, which is matched by high selection effort on the part of the IC, while low-risk ones exert little search effort combined with low selection effort. Unfortunately, the additional predictions that follow from Figure 3 (wealth space) are not tested empirically because (i) the consumers’ degrees of risk aversion are not reported or known, and (ii) the data are cross-sectional and changes in behavior across time are largely unreported.

4.1. Data

Automobile insurance data are suited to testing the theoretical model because the risk rating of policyholders is less regulated than in other lines of insurance (e.g., health). This renders the ICs’ selection effort potentially more readily observable [at least through a set of indicators (see below)]. It has been stated that
“[e]mpirical models of insurance markets would greatly enhance our ability to understand policy-relevant questions. Yet they are still quite rare. …While much progress has been made in recent years in our understanding of insurance demand in particular, the most crying need is for market-wide data”.
The analysis of a dataset representative of the Australian market may therefore be of interest. Data are drawn from two sources: (i) a household survey of vehicle owners collected by the market research firm IMRAS Consulting (henceforth referred to as the IMRAS dataset) and (ii) insurance surveys published by the consumer advocacy group Choice.

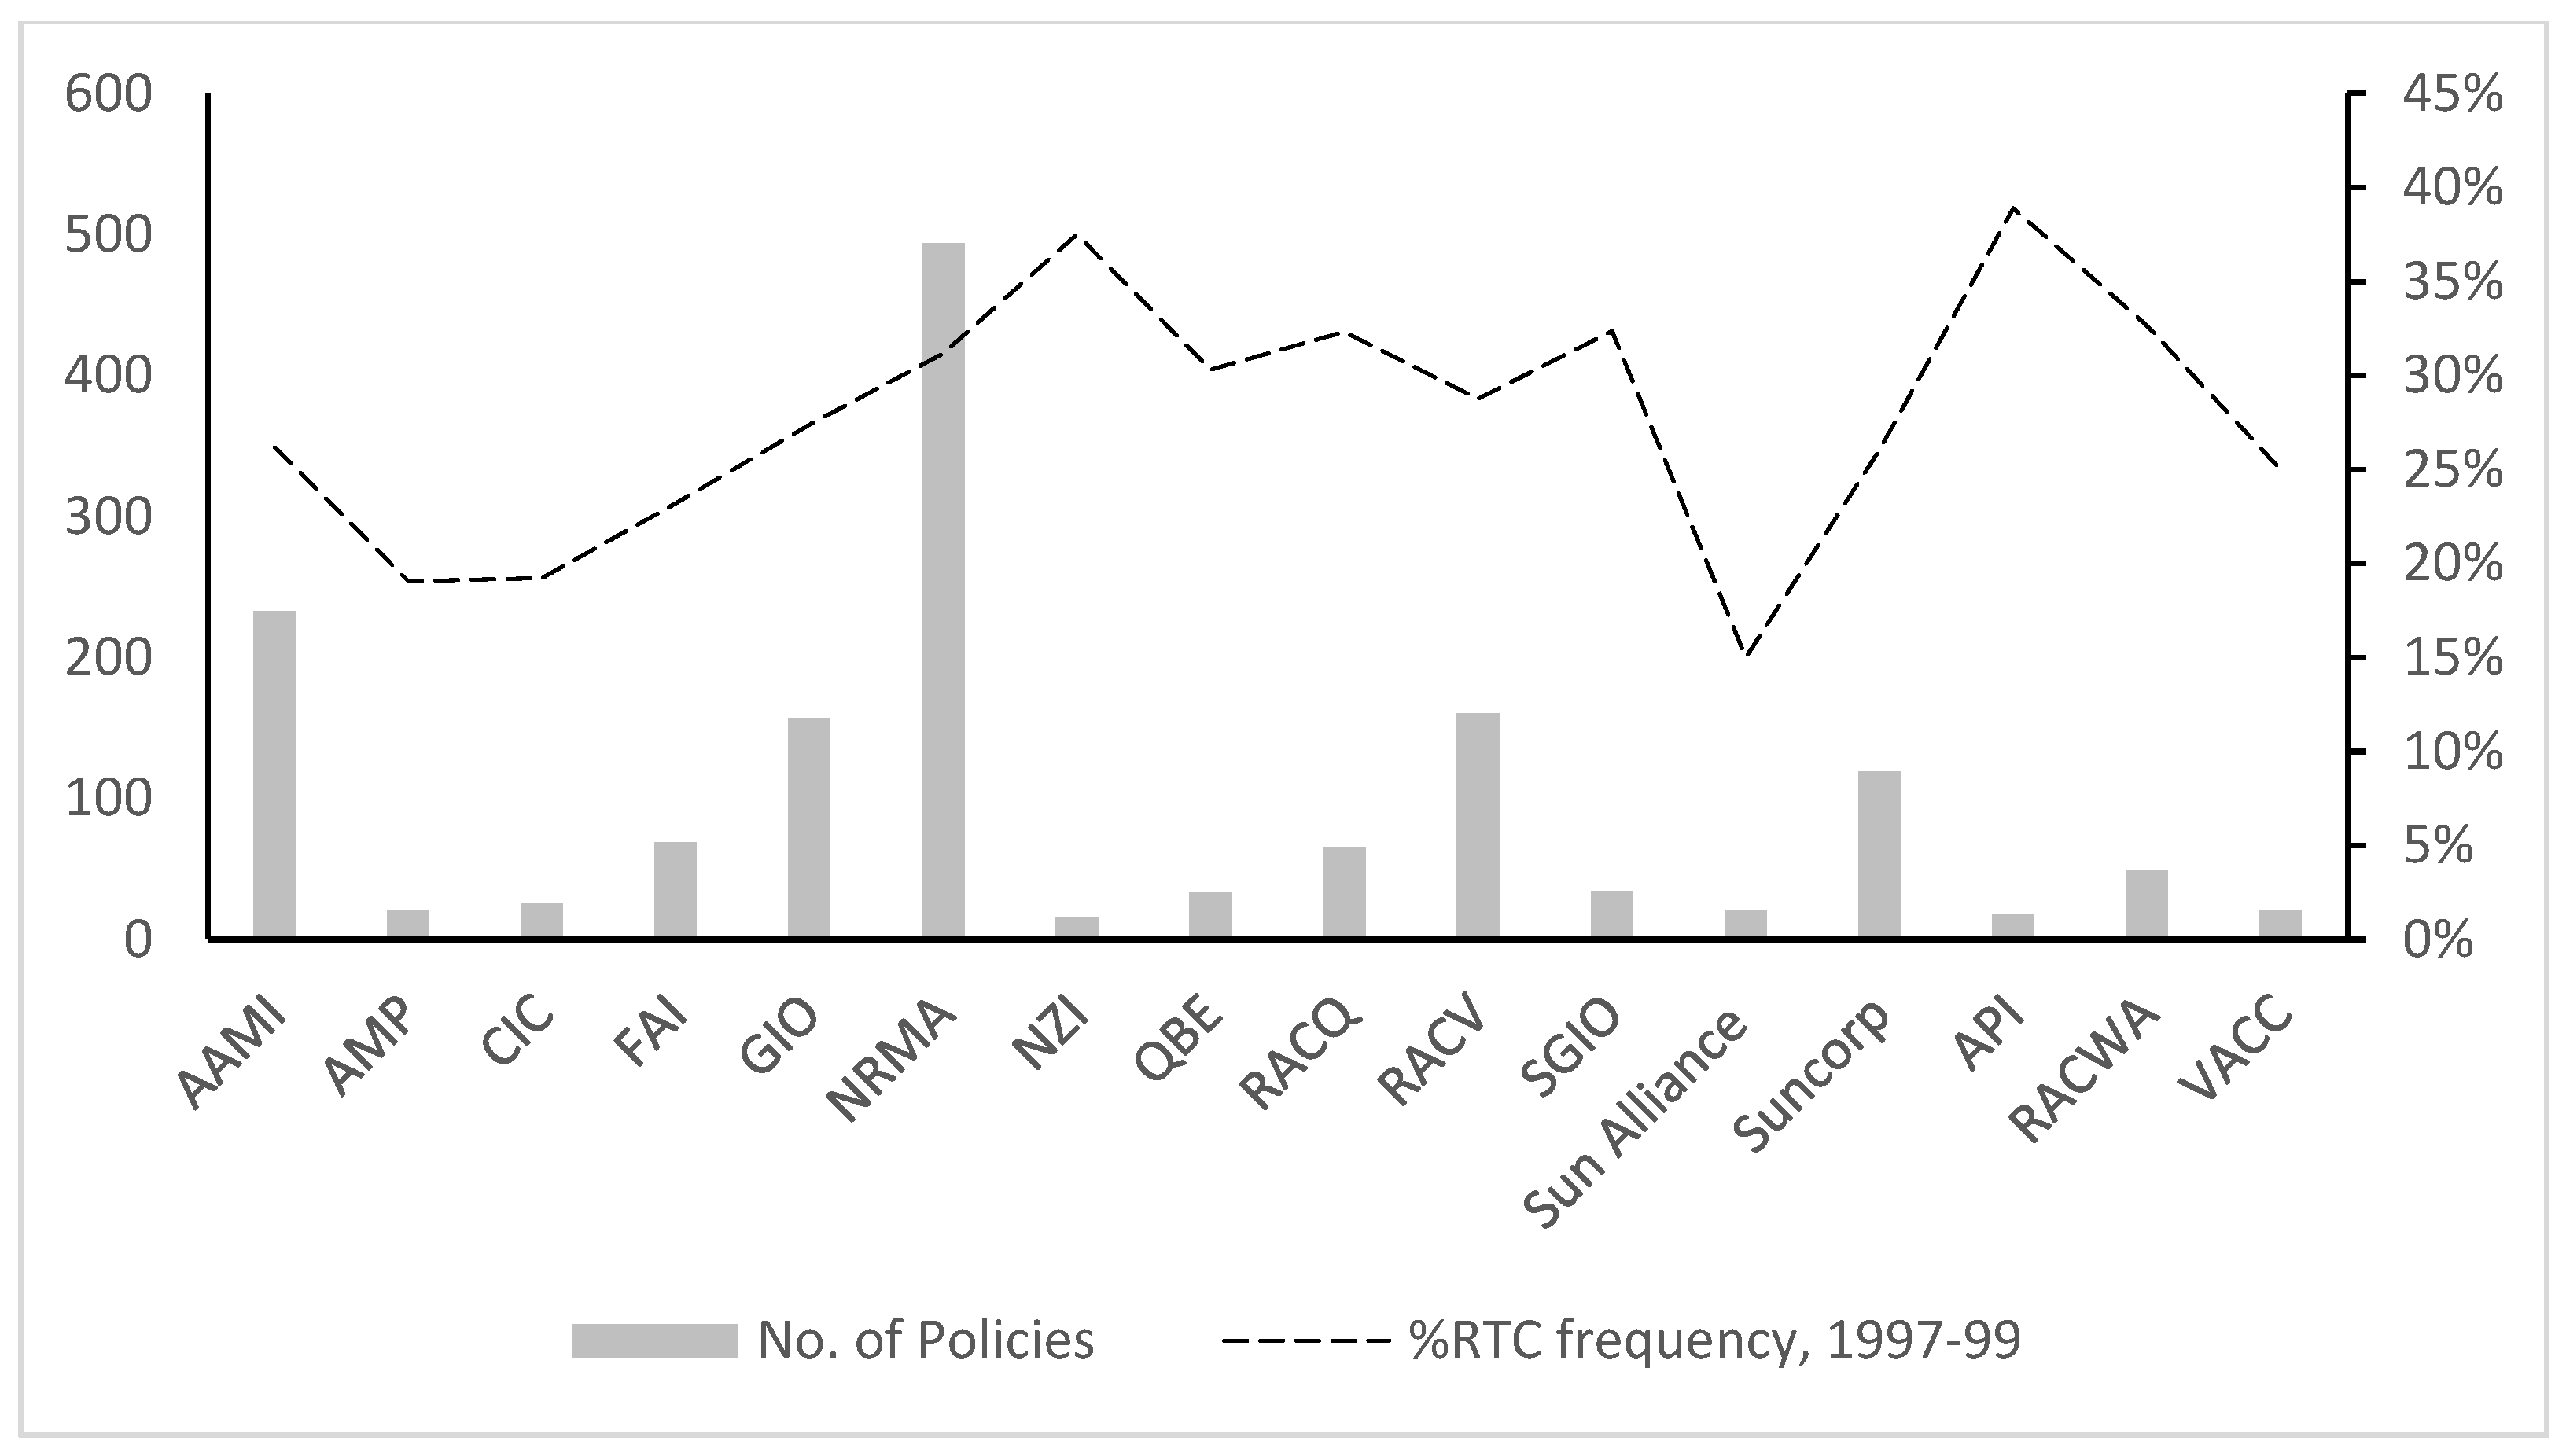
4.1.1. Insurance Policies

In Australia, every vehicle must carry compulsory third-party (CTP) insurance to partially cover the cost of treating third-party injuries. Comprehensive insurance, which indemnifies the policyholder against the costs of damage to their own or another party’s vehicle, is optional. Approximately 80% of vehicles in the survey were comprehensively insured. The IMRAS survey reported the name[s] of the respondent’s CTP and comprehensive automobile insurer. The premium and amount of comprehensive coverage purchased are reported; however, the excess (i.e., deductible) is not reported. Policyholders were also asked to report their no-claim bonus (NCB), which typically ranges from 0% to 60% depending on the NCB scheme and claim history.

4.1.2. Insurers

The IMRAS dataset contains no information about the composition of individual insurance policies or the underwriting strategies of ICs. However, the journal Choice regularly compares many goods and services, including comprehensive insurance, to inform the purchasing decisions of its readership. Measures of insurer behavior were obtained through three reports. The first, a special report Car Insurance, published in 1997, compared premiums for three insurance vignettes (a high-risk scenario, a medium-risk scenario, and a low-risk scenario) within two regions (a high-risk region and a low-risk region) across six states. Some areas are risk-rated more highly than others because the risks of theft and accidents vary, as does the cost of repairs. Generally, urban areas are rated as high-risk, and regional areas are rated as low-risk. The second report (Australian Consumer Association (ACA) 1997) compared premiums using a 5-star scale ranging from cheapest to most expensive (see Table A1 in Appendix B for details).
The third source is the report, Your Car Insurance Toolkit (Australian Consumer Association (ACA) 1999). It differentiates comprehensive insurance policies on the basis of three policy characteristics: (i) adjustment to the NCB following a claim; (ii) the option to protect the NCB following a claim; and (iii) the option of reducing the excess (see Table A2 in Appendix B for details).
These data were matched to respondents in the IMRAS dataset using the name of the comprehensive insurer. The result is a rich dataset providing information on 4005 vehicle owners but covering the year 1999 only. In addition to the market leaders (NRMA, AMI, RACV, and Suncorp), many smaller insurers are also in the dataset. Figure 4 reports the number of policies underwitted by each IC as well as the proportion of policyholders who reported a road traffic crash (RTC) from 1997 to 1999. This proportion is seen to vary substantially, providing a first indication that Australian ICs may differ in their selection efforts.

4.1.3. Consumers

During a six-week period commencing in October 1999, market research was commissioned by IMRAS Consulting to analyze community attitudes toward the Australian smash (collision) repair market. Computer-assisted telephone interviews (CATI) were used to contact 37,833 rural and metropolitan households in four Australian states (New South Wales, Victoria, Queensland, and Western Australia). The response rate of 16.9 percent enabled data to be collected on 4006 households who provided policyholder characteristics (age, gender, and postcode), vehicle type (make, model, and vehicle age), and RTC history from 1994 to 1999. Although the data are now over twenty years old, they have an important advantage. The CATIs were conducted prior to the widespread use of mobile phones, which offer opportunities for recipients to screen calls. Arguably, this improves data quality.6

4.1.4. Evidence of Adverse Selection

Evidence of adverse selection is a necessary but not sufficient condition for the existence of a separating equilibrium (Puelz and Snow 1994). In 2017, Rowell et al. published an empirical analysis of the IMRAS dataset that tested for ex ante moral hazard in the Australian automobile insurance market. The authors adapted a recursive model proposed by Dionne et al. (2013), which used a lagged measure of RTCs as opposed to claims to control for adverse selection. The rationale was that RTCs that did not result in a claim constitute insured motorists’ private information about their risk type that is not available to the insurer. The statistically significant coefficient on lagged RTCs reported by Rowell et al. (2017) provides prima facie evidence of adverse selection in this market.

4.2. Model Specification

Since neither ICs’ risk selection effort nor consumers’ search effort is directly observable, they are treated as latent variables reflected by a set of indicators. The term “indicator” implies that (1) it need not vary in 1:1 proportion with the latent variable it represents, and (ii) it may contain measurement error with respect to the latent variable. Work with multiple indicators was pioneered by Jöreskog and Goldberger (1975); their approach has become known as “Structural equation modeling” (SEM) (Fan et al. 2016). SEM enables the analysis of relationships between one or more independent variables (continuous or discrete) and one or more dependent variables (continuous or discrete). Both the independent and dependent variables can also be measured directly, as in conventional regression analysis (Ullmann and Bentler 2004). In the present context, the advantage of SEM is that it allows for testing for the postulated causal relationship between ICs’ risk selection effort and consumers’ search effort using correlations between observed indicator variables (Kline 2016).
According to the Testable Prediction of Section 3.2.1, the interaction between consumers and ICs results in a Nash equilibrium, which is characterized by high consumer search and IC selection effort for high-risk types and low consumer search and IC selection effort for low-risk types. The dataset described above (see Table 1 for variable definitions) features several indicators of latent quantities. Equation (7) defines the structural core, which is composed of three latent variables: consumer search effort (CSE), insurer selection effort (ISE), and increasing risk type (RT+).
I S E = α 1 R T + + φ 1 ; C S E = α 2 R T + + φ 2 ,   with   V a r R T + = 1 , E φ 1 = 0 ,   E φ 2 = 0 , V a r ( φ 1 ) = σ 1 2 , V a r ( φ 2 ) = σ 2 2 , E ( φ 1 , φ 2 ) = σ 12 .
Since the distinction between high- and low-risk types in Section 3 would be difficult to implement, RT+ is continuous rather than dichotomous7. In the path diagram of Figure 5 below, α 1 and α 2 are symbolized by arrows linking RT+ and ISE and CSE, respectively. According to the Testable Prediction (Section 3.2.1), both coefficients are positive, ceteris paribus.
The measurement equations linking the indicators to the latent variables are given by Equations (8)–(10). Equation (8) specifies the indicators pertaining to ICs’ risk selection effort ISE (for their explanation, see Section 4.3.1). Their so-called loadings ( κ 4 , κ 5 , 1 ) are all positive, with the first normalized to one to ensure identification. Their measurement errors have zero expected value and constant variance throughout, and they are assumed to be uncorrelated among themselves as well as with measurement errors pertaining to the indicators of ISE as well as R T + ,
( N o _ P r o t e c t _ N C B ,   N o _ R e d u c e _ E x c e s s ,   P r e m i u m _ H i g h r i s k s ) = ( κ 4 , κ 5 , 1 ) I S E + ( ε 4 , ε 5 , ε 6 ) ,   with E ε j = 0 , V a r ( ε j ) = θ j 2 ,   E ( ε j , ε i j ) = 0 , E ( ε j , δ k ) = 0 ;   i = 1 , 2 , 3 ;   j = 1 , , 3 ;   k = 1 , , 4 .  
Analogous specifications hold for the indicators of CSE in Equation (9) (explained in Section 4.3.2) as well as higher consumer risk R T + in Equation (10) (explained in Section 4.3.3). They are standard in SEM, along with the assumption that the indicators vary in a linear fashion with the latent variable, except for measurement error. This restriction can be justified by noting that if the three dummy variables (Premium_Search, Insurer_Search, Knows_NCB) in Equation (9) all take on the value of zero, it would be strange to argue that CSE nevertheless is positive.
( P r e m i u m _ S e a r c h ,   I n s u r e r _ S e a r c h ,   K n o w s _ N C B ) = ( 1 , κ 2 , κ 3 ) C S E + ( ε 1 , ε 2 , ε 3 ) ,   with E ε i = 0 , V a r ( ε i ) = ς i 2 ,   E ( ε i , ε j i ) = 0 , E ( ε i , δ k ) = 0 ;   i = 1 , 2 , 3 ;   j = 1 , , 3 ;   k = 1 , , 4 ;  
( R T C s ,   M e t r o ,   P a r t s _ D a m a g e d ,   Y o u n g _ D r i v e r ) = ( 1 , λ 2 , λ 3 , λ 4 ) R T + + ( δ 1 , δ 2 , δ 3 , δ 4 ) ,   with E δ k = 0 , V a r ( δ k ) = χ k 2 ,   E ( δ k l , δ l ) = 0 , E ( δ k ε i ) = 0 ;   E ( δ k ε j ) = 0 ;   k = 1 , , 4 ;   i = 1 , 2 , 3 ;   j = 4 , 5 , 6 .  
Most of the available indicators are binary, so they depart from the normality assumption used in Maximum Likelihood (ML) estimation. Nevertheless, the ML function converged after a few iterations. To prevent overfitting and potentially committing a Type I error, the data are divided into two parts. The first (n = 2000) is used for model development, while the second (n = 2006) is reserved for an out-of-sample test. Statistics for the full dataset are reported in Table 1 (they do not differ to a noticeable degree between the two subsets).

4.3. Indicator Variables

4.3.1. Indicators of Insurer Selection Effort (ISE)

Premium-Highrisks has five levels, indicating the premium for the highest risk category relative to the lowest charged by an IC. A high value arguably reflects the IC’s risk selection effort. Being quasi-continuous, this indicator qualifies as the benchmark indicator with its loading set to one.
No_Protect_NCB is a dummy variable that takes the value of one if the IC does not offer the option of protecting the no-claims bonus in the event of an accident, thus preserving the effect of the bonus to attract favorable risks.
No_Reduce_Excess is a dummy variable that takes the value of one if the IC does not offer the option of reducing the deductible, thus preserving its effect of attracting favorable risks in exchange for a low premium.

4.3.2. Indicators of Consumer Search Effort (CSE)

Premium_Search is the amount of coverage relative to the premium paid. According to the model in Section 3.1, a high value of this ratio reflects a high CSE. Being reported in quintiles, this indicator comes close to a continuous variable, so it qualifies as the benchmark indicator of CSE with its loading constrained to 1.
Insurer_Search is a dummy variable that takes the value of one if the consumer purchased comprehensive coverage from a different IC than for mandatory coverage. This entails a certain amount of searching.
Knows_NCB is a dummy variable that takes the value of one if the policyholder knows the amount of his/her no-claims bonus. This is likely to reflect the search for optimal coverage.

4.3.3. Indicators of High-Risk Type (RT+)

This variable is important because both Predictions 1 and 2 regarding ISE and CSE are conditional upon risk type. However, contrary to the theoretical argument, which distinguishes two types only for simplicity, RT+ is continuous, with variance normalized to one. Four indicators of high-risk type were identified in the data, three of which (driver age, location, and RTC history) are frequently found in empirical analyses of asymmetric information in automobile insurance to reflect the insurer’s information set, as e.g., in Chiappori and Salanié (2000) or Dionne et al. (2013).
RTCs count the number of accidents reported by the policyholder from 1994 to 1999. Being quasi-continuous (0, 1, and ≥2), it serves as the benchmark indicator.
Parts_Damaged counts the number of parts damaged; it arguably also reflects higher risk on the part of the driver.
Metro is a dummy variable that takes the value of one if the policyholder lives in a metropolitan area. It reflects the IC’s experience that accidents happen with a higher frequency there.
Young_Driver is a dummy variable that takes the value of one if the policyholder is 25 years old or younger. It also reflects the IC’s loss experience.
A simple rule of thumb proposed by Kenny (2020) states that there should be at least two indicators per latent variable. This condition is satisfied by the proposed model.

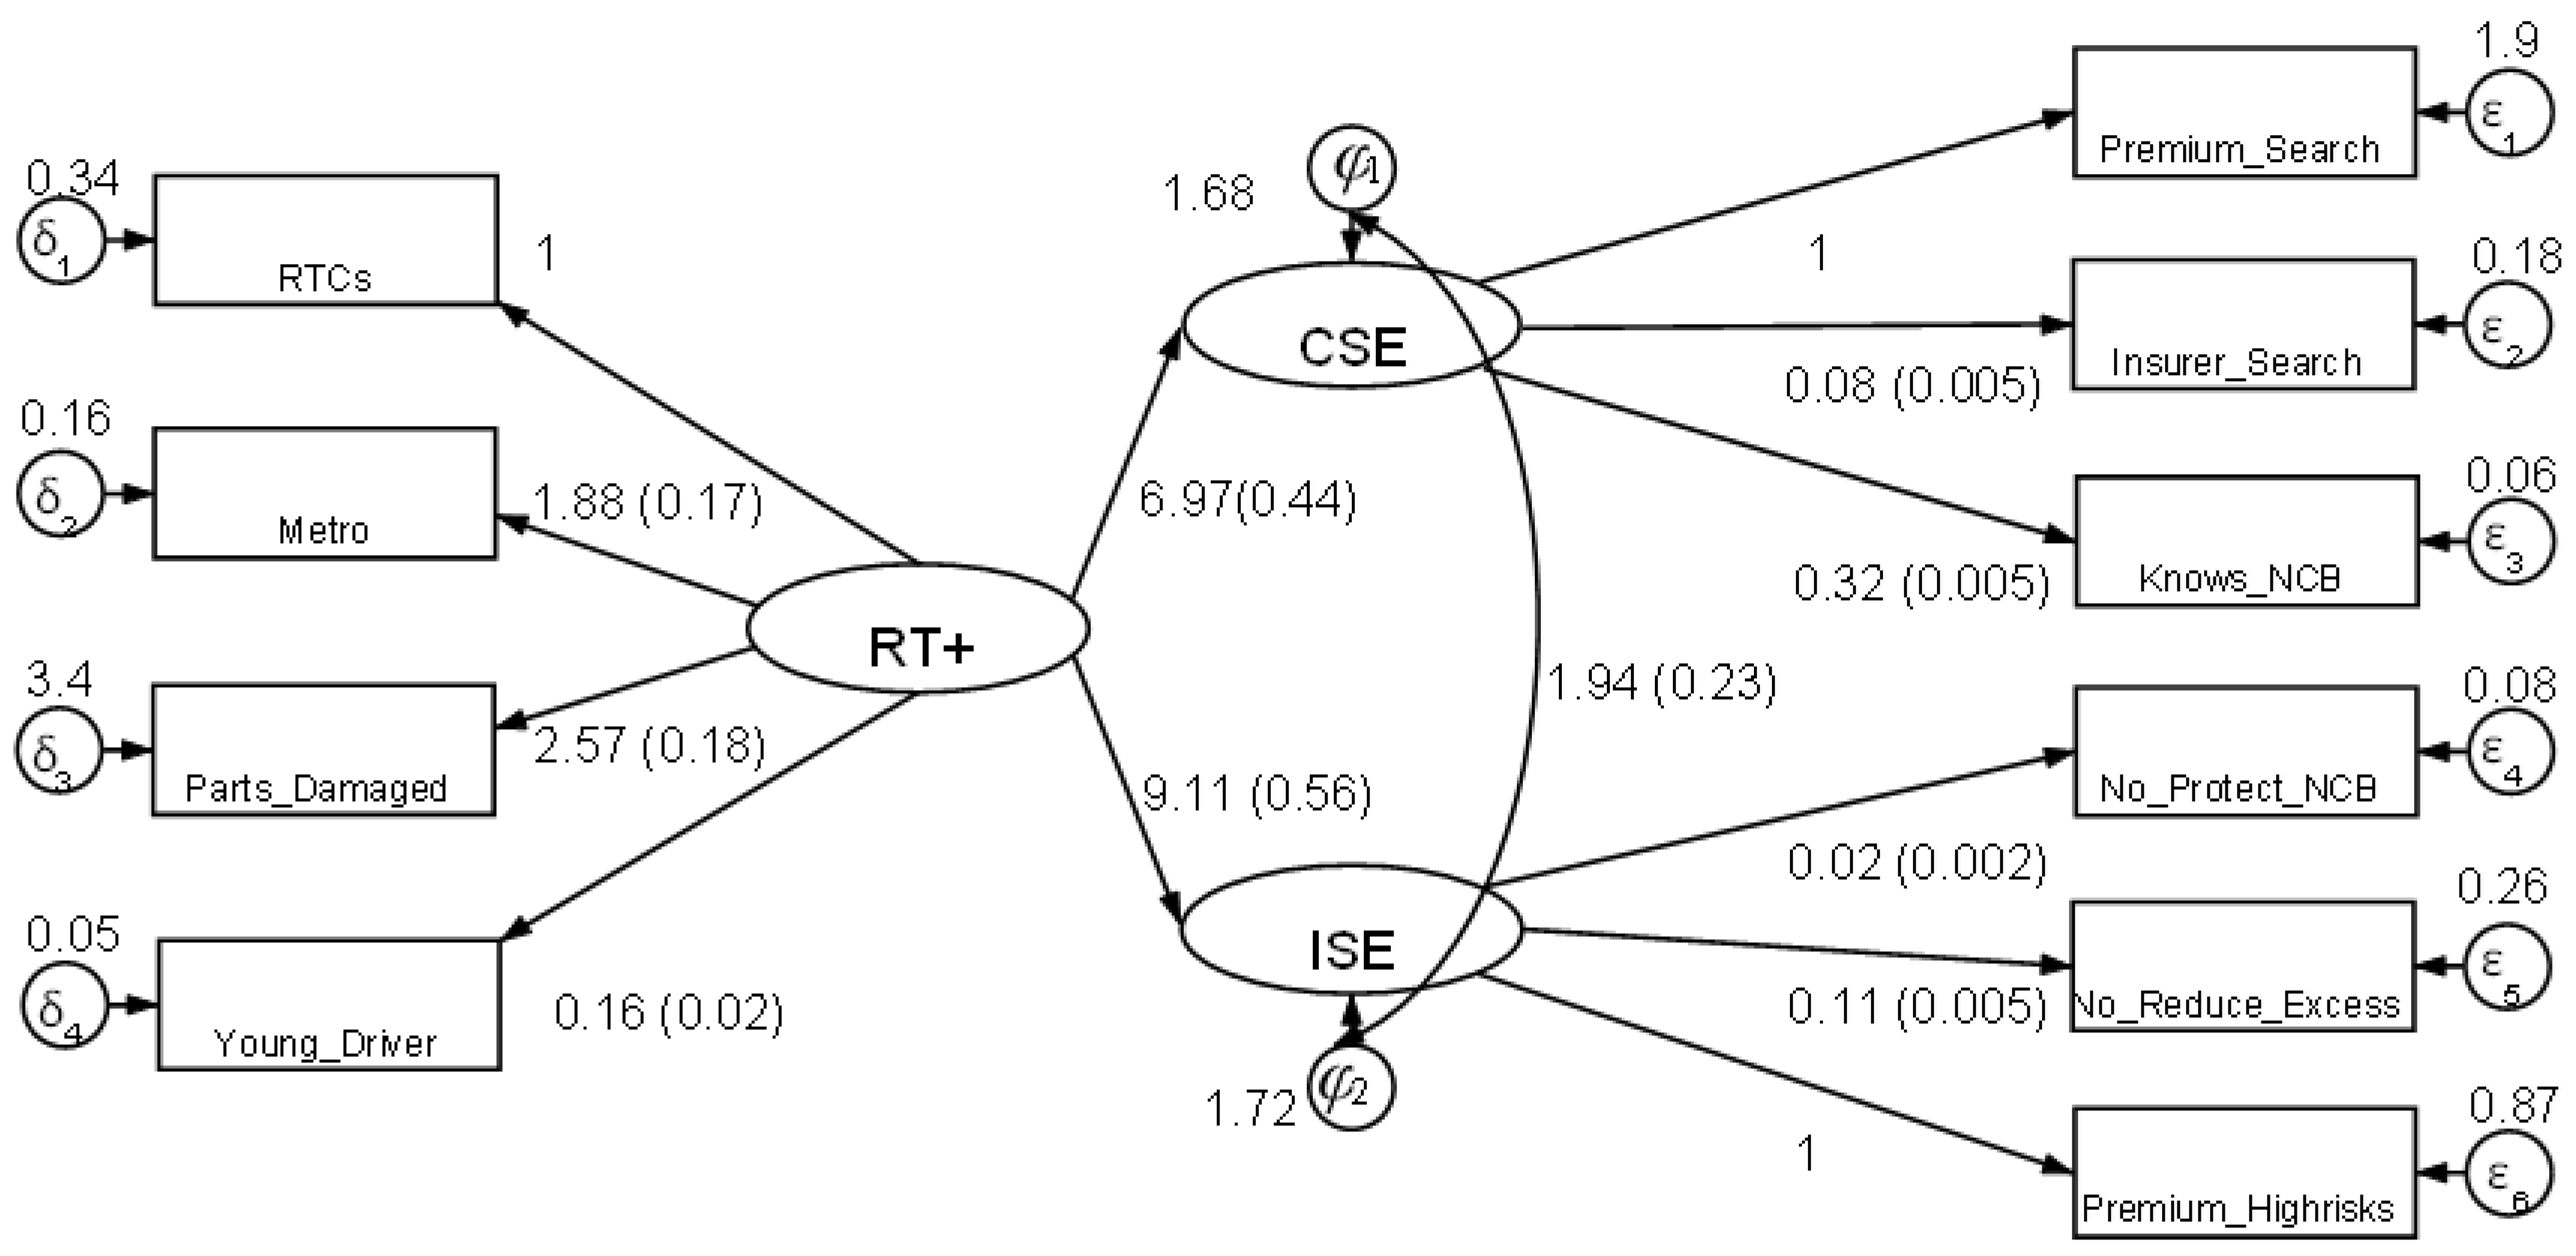
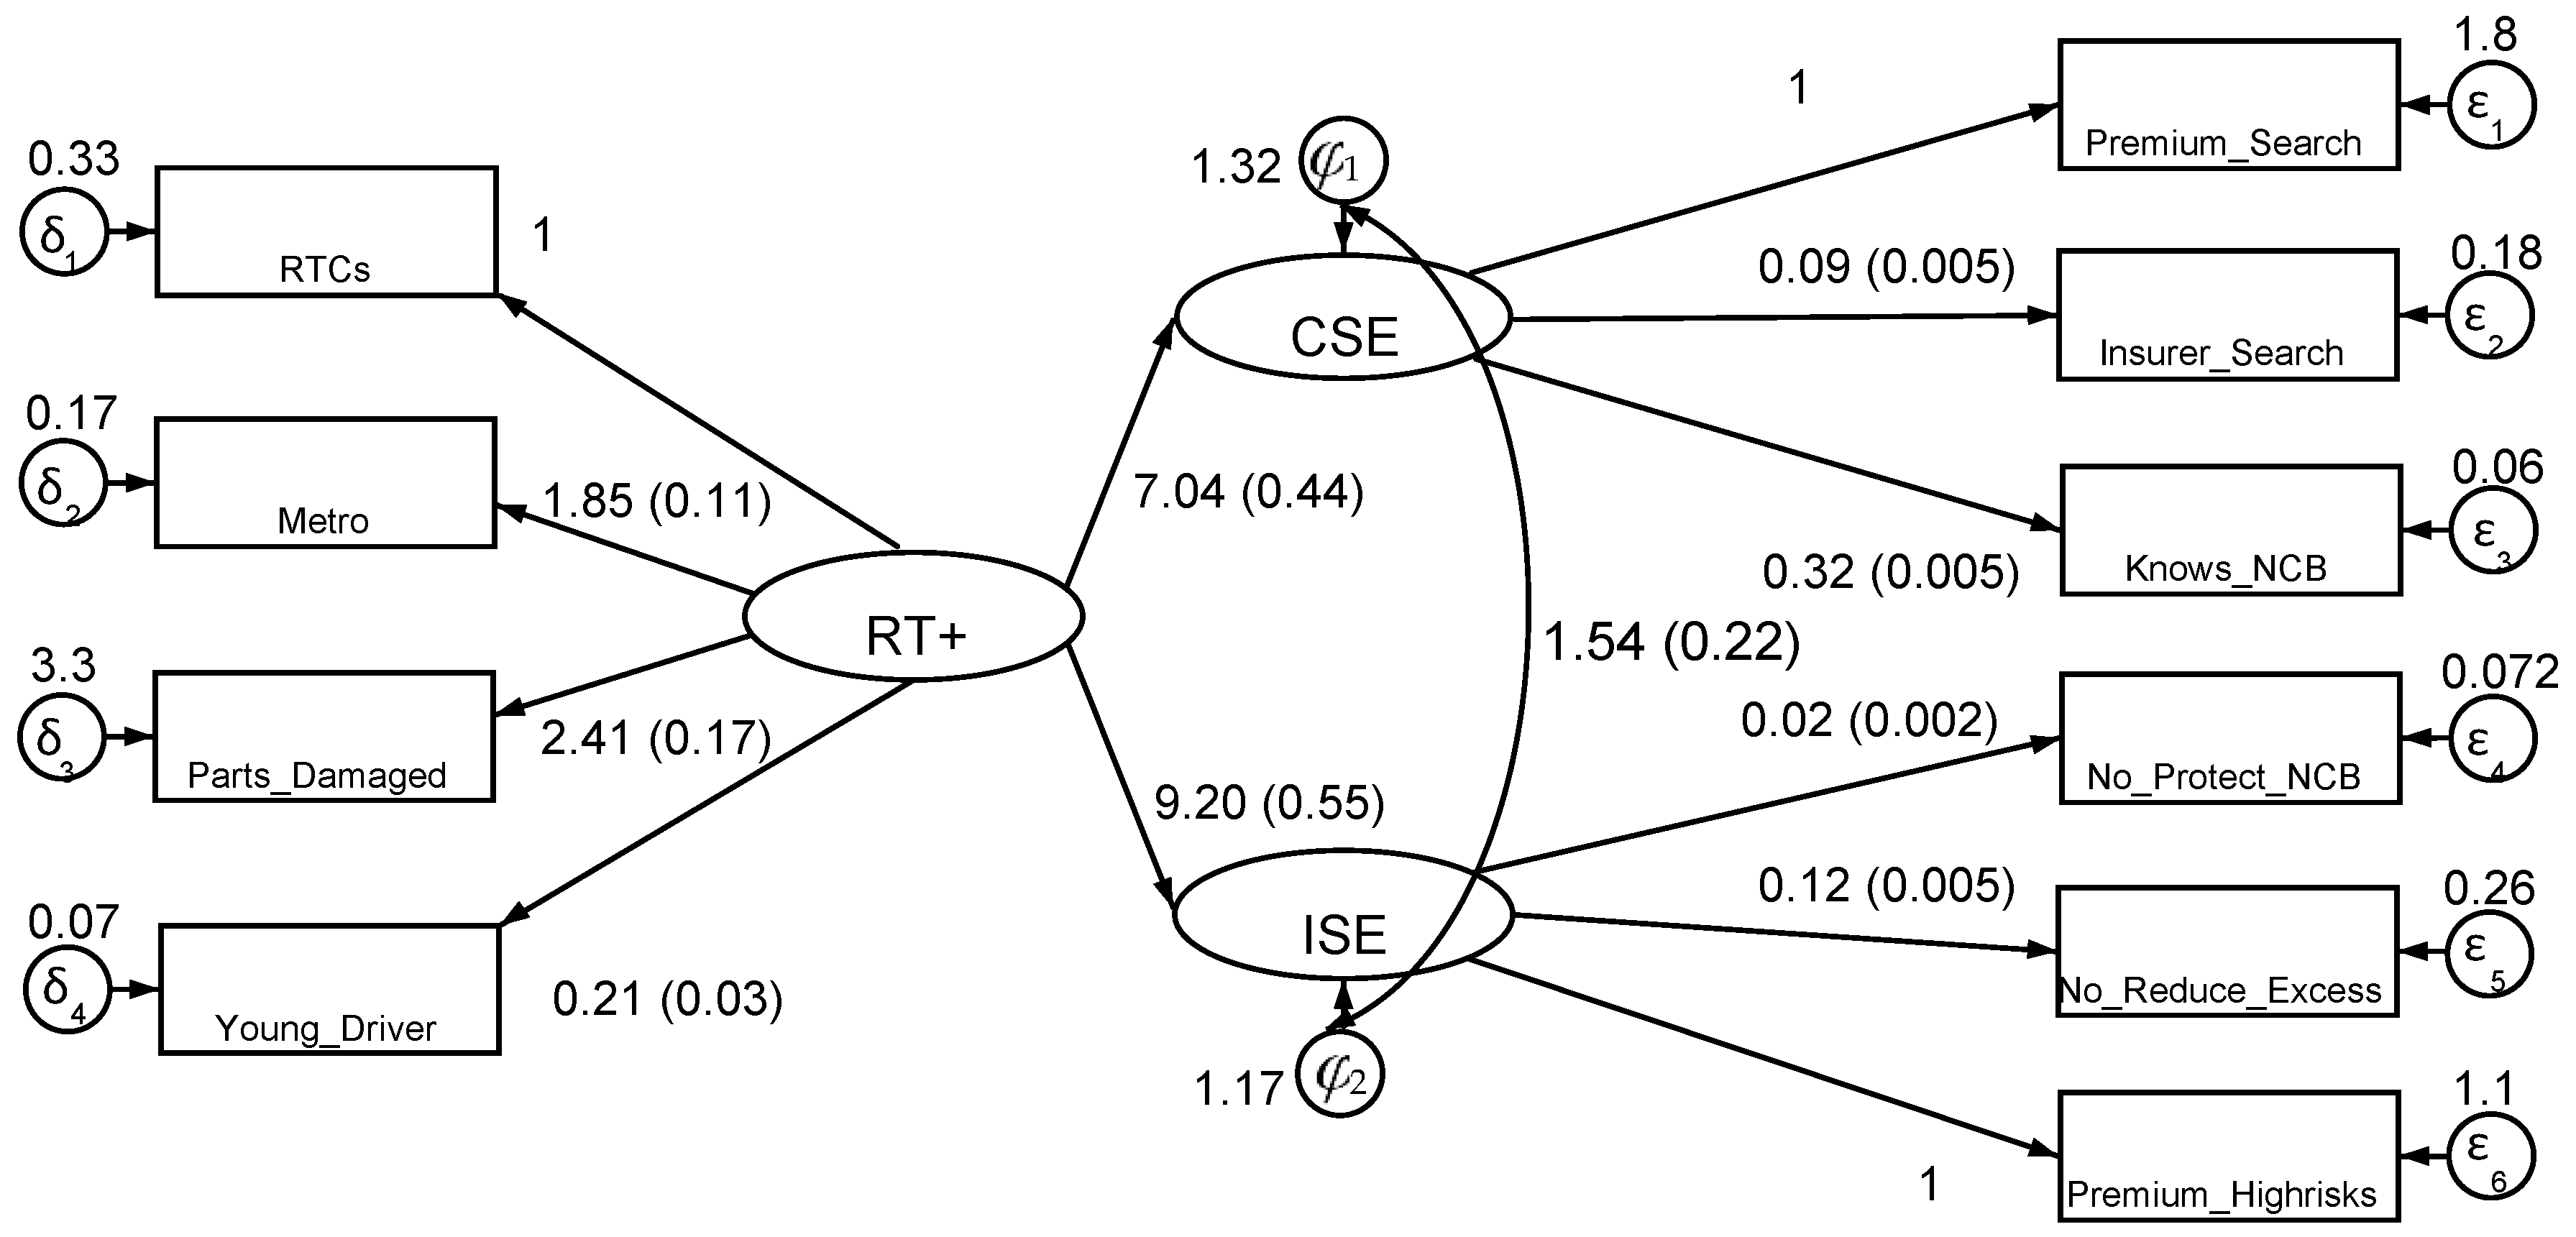
4.4. Empirical Results

The specified SEM is over-identified and therefore can be estimated using Stata’s maximum likelihood function. Standard errors are assumed to be uniform across ICs and member states, taking advantage of the fact that markets for comprehensive automobile insurance are broadly homogenous across Australia (Compare the Market 2020). The correlation matrix reports a substantial number of weak but statistically significant correlations between the indicators (see Table A3). Nevertheless, convergence was achieved with both the developmental and the test samples.
The estimates derived from the developmental sample are reported in Figure 5. Starting with the theoretical core, one notes that both CSE and ISE increase significantly with RT+. This vindicates the crucial the Testable Prediction (Section 3.2.1), which states that CSE and ISE are high for high-risk types and low for low-risk types. As to the measurement part, all three indicators of ISE (No_Protect_NCB, No_Reduce_Excess, Premium_Highrisks) have loadings that are significantly positive; however, the measurement error contained in the benchmark indicator Premium_Highrisks is the highest, contrary to expectations. The three indicators of CSE (Premium_Search, Insurer_Search, Knows_NCB) also have a significant positive relationship with the latent variable, as expected. However, Premium_Search, which arguably should be the closest reflection of CSE and whose loading is therefore constrained to one, displays the highest measurement error. As to the indicators of RT+, higher risk is reflected by the four indicators (Prior_RTC, Parts_Damaged, Metro, Young_Driver), with the benchmark one (Prior_RTC, number of road traffic crashes) exhibiting a measurement error that is in line with the others. Interestingly, Young_Driver, which is used routinely by ICs, turns out to be a rather weak indicator with a loading well below one; in return, its measurement error variance is very small, at least in the context of the present model.
In view of the substantial correlation coefficient between the structural error terms φ 2 and φ 1 8, there may be important determinants of ISE and CSE, respectively, that are left unaccounted for. Still, a robustness check involving different choices of the benchmark indicator does not affect the estimated relationship between RT+, ISE, and CSE in a material way. However, goodness of fit is poor. The comparative fit index (CFI) is zero, and the root mean square error of approximation (RMSEA) is 0.336. Furthermore, the χ2 statistic clearly suggests rejection of the null hypothesis that the estimated model fits the data. Yet according to Kenny (2020), the χ2 statistic is almost always significant for n > 400.
Turning to the test dataset (n = 2006), one may notice that the estimates presented in Figure 6 are very similar to those of Figure 5. In particular, the model core looks robust. In both estimates, the coefficients pertaining to the relationship between RT+ and ISE and RT+ and CSE are approximately 9 and 7, respectively.
The estimated relationship between a policyholder’s risk status and consumer search effort as well as insurer selection effort confirms the Testable Prediction (Section 3.2.1). Using indicators derived from Australian auto insurance data and applying structural equation modeling, higher risk status is indeed found to be associated with increased consumer search as well as increased insurer selection effort.

5. Conclusions

5.1. The Theoretical Contribution

To the best of the authors’ knowledge, the literature building on the RS model has accepted the implicit assumptions that the challenging IC does not incur any risk selection expense, while low-risk policyholders can identify preferred insurance policies without undertaking costly effort. The theoretical model developed in this paper relaxes both of these unrealistic assumptions. Although intuitively promising, the model is subject to several limitations. First, consumers are modeled as expected utility maximizers, which may serve as long as one is willing to concede that their decision-making may be beset by error (Hey 2002). Second, a one-period model of insurer behavior likely fails to fully depict the complexity of monitoring and structuring the insured population. In particular, when discarding a consumer categorized as a high-risk type, the IC has no guarantee to find a low-risk replacement, contrary to the simplified model. Finally, the existence of a separating equilibrium is taken as granted, although according to the theoretical model, there is a very low probability that it fails to exist. Despite these limitations, pursuing the extension of the RS model put forward here may be worthwhile, paving the way to a more in-depth exploration of the RS paradigm than has hitherto been undertaken.

5.2. The Empirical Contribution

The use of structural equation modeling (SEM) for estimation is well suited to the present context. Both consumer search effort and insurer selection effort arguably constitute latent variables that are reflected by indicators, which, however, need not vary in 1:1 proportion with them and are subject to measurement errors. Rather than trying one indicator after another, as is typical in regression analysis, the SEM approach is full-information in that it permits exploiting all available indicators simultaneously. The Testable Prediction (Section 3.2.1), states that higher risk status is associated with an increase in both consumer search and insurer risk selection efforts, is supported by the evidence.
However, a limitation is that the existence of a separating equilibrium, while highly credible in view of the theoretical analysis, is not tested for. Moreover, the data analyzed is now almost 25 years old. One obvious change that has occurred since is the growth of the internet. This could have reduced policyholders’ search costs but also insurers’ risk selection costs. To the extent that these changes have increased the effectiveness of consumer search and/or the effectiveness of insurers’ selection efforts, the estimates presented here are biased downward. Hence, contemporary markets for automobile insurance may well be characterized by an even more marked separation of risks than found here, and no direct conclusions for current public policy should be drawn.
For all its potential shortcomings, this work illustrates the value of using market-level data that captures the behaviors of policyholders and insurance firms rather than relying on claim data obtained from a single insurer. Yet future empirical research would benefit from measurements that are more closely related to the latent variables of this study. Consumer surveys reporting time spent in search of the chosen insurance policy would be valuable, as would be industry surveys reporting more detail on insurers’ selection strategies. Finally, more refined indicators of risk status might allow us to directly determine the two risk types distinguished in the theoretical analysis.

Author Contributions

Conceptualization, D.R. and P.Z.; methodology, P.Z.; software, SEM with Stata; validation, D.R. and P.Z.; formal analysis, D.R. and P.Z.; investigation, D.R. and P.Z.; resources, D.R.; data curation, D.R.; writing—original draft preparation, D.R. and P.Z.; writing—review and editing, D.R. and P.Z.; visualization, D.R. and P.Z.; supervision, P.Z. All authors have read and agreed to the published version of the manuscript.

Funding

This research received no external funding.

Data Availability Statement

The data used to analyze policyholder behavior are proprietary, while the data used to analyze insurer behavior are publicly available. We are willing to make data and code available to bonafide researchers upon request.

Acknowledgments

This paper was written while the second author was a visiting scholar to the University of Queensland (Australia). This research has previously been presented at the Australian Conference of Economists, Sydney, 2017, the International Congress on Insurance: Mathematics and Economics, Sydney, 2018, and at the International Association of Applied Econometrics, London UK, 2022. It has formed the basis of a conference paper “Separating equilibria in insurance markets: A new theoretical perspective” presented to 44th Seminar of the European Group of Risk and Insurance Economists (EGRIE), London, 2017, and we thank Wanda Mimra (IESEG School of Management, Paris), for her thoughtful comments. The paper has also benefited from suggestions and criticisms by Jörg Schiller (University of Hohenheim, Stuttgart) as well as four anonymous reviewers of this Journal, which resulted in a substantial improvement in exposition.

Conflicts of Interest

The authors declare that they have no relevant or material financial interests that relate to the research described in this paper.

Appendix A.

This Appendix is devoted to the derivation of the reaction functions displayed in Figure 2 of the text.

Appendix A.1. The Insurer’s Reaction Function

Let the optimum condition (2) of the text be disturbed by an increase in consumers’ search effort d c > 0 . Note that it is sufficient to derive only one reaction function because the IC cannot distinguish between risk types; this becomes only possible due to the consumers’ type-specific reaction functions resulting in different Nash equilibria. This gives rise to the comparative static equation (applying the implicit function theorem),
2 E Π e 2 d e + 2 E Π e c d c = 0 ,
which can be solved to obtain
d e d c = 2 E Π / e c 2 E Π / e 2
From Equation (2), the solutions to the comparative-static equation are given by
    d e d c 2 E Π e c = π / e E I c > 0 .
The IC reaction function is exhibited in Figure 2. It is drawn linear for simplicity because on the one hand π / e decreases with e , implying a decreasing positive slope; on the other hand, 2 I / c 2 > 0 is a possibility, which per se would imply an increasing positive slope.

Appendix A.2. Consumers’ Reaction Functions

Here, the exogenous shock is d e > 0 , an increase in the IC’s risk selection effort. In analogy to Equation (A1), one obtains from Equations (4a) and (4b) of the text,
d c d e H 2 E U H c e = ρ H υ H I H c H + υ H 2 I H c H e = ρ H υ H υ H υ H I H c H + 2 I H c H e <   0 ;  
d c d e L 2 E U L c e = ρ L υ L I L c L + υ L 2 I L c L e = ρ L υ L υ L υ L I L c L + 2 I L c L e < 0 .
It can be realistically assumed that the marginal effectiveness of consumer search is lowered by the IC’s selection effort, implying 2 I H / c H e < 0 , 2 I L / c L e < 0 . In addition, the low-risk type’s coefficient of absolute risk aversion, R A L = υ L / υ L > 0 is unlikely to be smaller than that of the high-risk type R A H = υ H / υ H ; therefore, one has d c H / d e < d c L / d e since ρ H > ρ L . Regardless of risk type, consumers are predicted to decrease search effort because they are burdened with additional transaction cost (e.g., the IC may require more forms regarding risk status), with the response of the high-risk type less marked than that of the low-risk type.

Appendix B.

Table A1. Insurer selection effort: Pricing of high, medium and low-risk Scenarios.
Insurers: New South WalesHigh-Risk ScenarioMedium-Risk ScenarioLow-Risk Scenario
High-Risk AreaLow-Risk AreaHigh-Risk AreaLow-Risk AreaHigh-Risk AreaLow-Risk Area
AAMI234523
ANSVAR332333
Australian Alliance ..2345
Commercial Union 353534
Direcdial433232
FAI car223222
Mercantile Mutual 425352
NRMA223332
NZI Comprehensive 333323
NZI Top Cover 333434
QBE534343
Suncorp222232
SWANN Agreed value 442223
TII34.2.3
Zurich Personal Assistance 224333
Insurers: QueenslandHigh-Risk ScenarioMedium-Risk ScenarioLow-RiskScenario
High-Risk AreaLow-Risk AreaHigh-Risk AreaLow-Risk AreaHigh-Risk AreaLow-Risk Area
AAMI345533
ANSVAR222233
Australian Alliance ..2222
Commercial Union 454455
Direcdial432232
FAI car223222
Mercantile Mutual 233323
NRMA223322
NZI Comprehensive 333333
NZI Top Cover 334455
QBE554434
RACQ222233
Suncorp223333
SWANN Agreed value 442243
TII332222
TIO......
Zurich Personal Assistance 224343
Insurers: VictoriaHigh-Risk ScenarioMedium-Risk ScenarioLow-Risk Scenario
High-Risk AreaLow-Risk AreaHigh-Risk AreaLow-Risk AreaHigh-Risk AreaLow-Risk Area
AAMI442232
ANSVAR222223
Australian Alliance ....22
Commercial Union 334443
Direcdial433232
FAI car224332
HBF......
Mercantile Mutual 223322
NRMA224433
NZI Comprehensive 334332
NZI Top Cover 335544
QBE343323
RACV Fair Deal 232344
RAC (WA) Motorguard......
SIGO......
SWANN Agreed value 554455
TII342324
Western QBE......
Zurich Personal Assistance 224423
Insurers: Western AustraliaHigh-Risk ScenarioMedium-Risk ScenarioLow-Risk Scenario
High-Risk AreaLow-Risk AreaHigh-Risk AreaLow-Risk AreaHigh-Risk AreaLow-Risk Area
AAMI......
ANSVAR333333
Australian Alliance ..2344
Commercial Union 455555
Direcdial432222
FAI car223322
HBF222333
Mercantile Mutual 233423
NRMA......
NZI Comprehensive 334433
NZI Top Cover 435555
QBE......
RACV Fair Deal ......
RAC (WA) Motorguard333343
SIGO222222
SWANN Agreed value 552233
TII432232
Western QBE222222
Zurich Personal Assistance 224332
Note: Policies were rated for affordability from 1 star (most expensive) thru to 5 stars (cheapest). Source: Australian Consumer Association (ACA) (1997).
Table A2. Insurer selection effort: Policy exclusions.
Insurance CompanyStates AvailableReduction of NCBProtection of NCBReduce Excess
Australian Alliance All but NT111
Australian PensionsAll but NT111
RACTTas.211
NRMAACT, NSW, Vic.211
CGUAll but NT211
FAIAll but NT21Not in Qld.
RACQ-GIOQld.112
TIIAll but NT211
AAMIAll but WA112
EIG-ANSVARAll211
RAA-GIOSA111
COTAAll11Not in Qld.
HBFWA211
Suncorp-MetwayQld.121
SWANNAll212
Mutual Community SA211
Western QBEAll but NT2 or 1 if < USD 100011
DirectdialAll but NT212
HBAVic.Depends on NCB 11
GIO Vic.211
SGICSA211
AMPAll211
TIONT211
RACV (E.)Vic.212
RAC Motor guardWA211
TGIOTas.211
GIOACT, NSW211
GIO NT222
SGIOWA311
GIOWA211
AMP car insurance Options All211
GIO Rode Cover Basic Vic.212
=1 level.1 = Yes1 = Yes
=2 levels2 = No2 = No
=3 levels
Table A3. Correlation matrix, full sample (n = 4006).
CSEISERisk Type
(1) (2)(3) (4)(5)(6)(7)(8) (9)(10)
(1) Premium_Search1.000
CSE(2) Insurer_Search0.030 *1.000
(3) Knows_NCB0.043 *−0.0151.000
(4) Premium_Highrisks−0.038 *0.0200.034 *1.000
ISE(5) No_Protect_NCB0.082 *−0.040 *−0.049 *0.137 *1.000
(6) No_Reduce_Excess0.035 *0.048 *−0.056 *−0.351 *−0.229 *1.000
(7) RTCs−0.021−0.0220.0090.026−0.006−0.0241.000
Risk Type(8) Parts_Damaged−0.0280.0040.0090.0170.012−0.0280.487 *1.000
(9) Metro−0.136 *−0.111*0.002−0.039 *−0.154 *0.044 *0.080 *0.082 *1.000
(10) Young_Driver−0.134 *−0.004−0.129 *0.0030.051 *0.0250.060 *0.045 *0.030 *1.000
Notes: * denotes p-value < 0.1.
Table A4. Structural equation model (full dataset).
Coeff.Std. Err.zP > |z|[95% CI]
Structural Model
CSE
HIGH_RT7.0010.28624.49<0.016.4447.565
ISE
HIGH_RT9.1590.36025.45<0.018.4539.864
Measurement Model
Insurer_Search
CSE0.0830.00324.94<0.010.0790.090
constant0constrained
Premium_Search
CSE1constrained
constant0constrained
Knows_NCB
CSE0.3190.00482.72<0.010.3120.327
constant0constrained
No_Protect_NCB
ISE0.0210.00212.29<0.010.0170.024
_cons0constrained
No_Reduce_Excess
ISE0.1150.00336.52<0.010.1090.122
constant0.000constrained
Premium_Highrisks
ISE1constrained12.2<0.0140.61256.161
constant0constrained
RTCs
HIGH_RT1constrained
constant0constrained
Metro
HIGH_RT1.8660.07325.5<0.011.7222.009
constant0constrained
Parts_Damaged
HIGH_RT2.4940.14117.72<0.012.212.77
constant0constrained
Young_Driver
HIGH_RT0.1830.01611.13<0.010.1510.215
constant0constrained
var(e.Insurer_Search)0.1780.006 0.1670.189
var(e.Premium_Search)1.8590.065 1.7351.991
var(e.Knows_NCB)0.0630.004 0.0560.070
var(e.No_Protect_NCB)0.0760.002 0.0710.081
var(e.No_Reduce_Ecess)0.2580.008 0.2420.274
var(e.Premium_Highrisks)1.0010.107 0.8111.235
var(e.Prior_RTC)0.1290.004 0.1210.137
var(e.Metro)0.1670.012 0.1460.192
var(e.Parts_Damaged)3.4720.111 3.2613.698
var(e.Young_Driver)0.0590.002 0.0550.063
var(e.CSE)0.0100.001 0.0070.013
var(e.ISE)0.0010.000 0.0000.001
var(HIGH_RT)0.0290.003 0.0240.036
cov(e.CSE,e.ISE)0.0027230.00043656.2400.0018680.003579

Notes

1
Mimra and Wambach (2014) provide an excellent summary of the literature that has reviewed by Rothschild and Stiglitz (1976).
2
For example, in markets for health insurance empirical research has reported that ICs are able to control adverse selection (Pauly et al. 2007; Marton et al. 2015). However, Cutler and Reber (1998) found that comprehensive health insurance coverage sponsored by Harvard University had to be withdrawn from the market; they interpreted this as evidence of a “death spiral” Frech III and Smith (2015) do find evidence suggesting a “death spiral”; however, the spiral moves so slowly as to give ICs plenty of time to withdraw loss-making contracts.
3
Whereas search theory deals with optimal stopping rules in the presence of imperfect information and its implications especially in labor markets [see e.g., Shi (2008)], the focus here lies on the outcome of search in terms of a favorable premium-coverage ratio.
4
The notation is in accordance with Stage 2 of the game (see Figure 1), where consumers are still confronted with one level of IC risk selection effort.
5
Conceivably, the marginal benefit of search effort could fall short of its marginal cost of one right away, resulting in no purchase of insurance.
6
For a more detailed description of the IMRAS data set, interested readers are directed to the papers “Two tests for ex ante moral hazard in a market for automobile insurance” (Rowell et al. 2017) and “Empirical tests for ex post moral hazard in a market for automobile insurance” (Rowell et al. 2022).
7
Making risk type dichotomous would call for latent class modeling, which however would put a heavy extra burden on SEM both in terms of identification and estimation (see e.g., Clark (2022)).
8
In Stata, the estimate of β = 1.94 relates to a regression of ISE on CSE. Using the formula, ρ x , y = σ x , y / σ x σ y = σ x , y / σ x 2 σ x / σ y = β σ x / σ y and noting that E ^ σ I S E = 9.11 E ^ σ R T + = 9.11 because σ R T + is normalized to one, the estimated value of ρ x , y becomes 1.94/9.11 = 0.28.

References

  1. Ales, Laurence, and Pricilia Maziero. 2014. Adverse Selection and Non-Exclusive Contracts. Working Paper. Pittsburgh: Carnegie Mellon University, Temper School of Business. [Google Scholar]
  2. Arrow, Kenneth. 1970. Political and economic evaluation of social effects and externalities. In The Analysis of Public Output. Edited by Julius Margolis. Cambridge, MA: NBER, pp. 1–30. [Google Scholar]
  3. Asheim, Geir B., and Tore Nilssen. 1996. Non-discriminating renegotiation in a competitive insurance market. European Economic Review 40: 1717–1736. [Google Scholar] [CrossRef]
  4. Attar, Andrea, Thomas Mariotti, and François Salanié. 2011. Nonexclusive Competition in the Market for Lemons. Econometrica 79: 1869–1918. [Google Scholar] [CrossRef]
  5. Attar, Andrea, Thomas Mariotti, and François Salanié. 2014. Nonexclusive competition under adverse selection. Theoretical Economics 9: 1–40. [Google Scholar] [CrossRef]
  6. Attar, Andrea, Thomas Mariotti, and François Salanié. 2016. Multiple Contracting in Insurance Markets. TSE Working Paper n. 14-532. Toulouse: Toulouse School of Economics. [Google Scholar]
  7. Attar, Andrea, Thomas Mariotti, and François Salanié. 2020. The Social Costs of Side Trading. The Economic Journal 130: 1608–1622. [Google Scholar] [CrossRef]
  8. Australian Consumer Association (ACA). 1997. Car insurance. CHOICE Magazine, July. 6–13. [Google Scholar]
  9. Australian Consumer Association (ACA). 1999. Your car insurance toolkit. CHOICE magazine, August. 18–29. [Google Scholar]
  10. Chiappori, Pierre-André. 1999. Asymmetric information in automobile insurance: An overview. In Automobile Insurance: Road Safety, New Drivers, Risks, Insurance Fraud and Regulation. Boston/Dordrecht/London: Kluwer Academic Publishers, pp. 1–11. [Google Scholar]
  11. Chiappori, Pierre-André, and Bernard Salanié. 2000. Testing for asymmetric information in insurance markets. Journal of Political Economy 108: 56–78. [Google Scholar] [CrossRef]
  12. Choice. 2024. CHOICE. Available online: https://www.choice.com.au/ (accessed on 15 January 2024).
  13. Clark, M. 2022. Structural Equation Modeling; Mixture Models. Available online: https://m-clark.github.io/sem/mixture-models.html (accessed on 20 March 2024).
  14. Compare the Market. 2020. Car insurance in Australia. Available online: https://www.comparethemarket.com.au/car-insurance/Australia/ (accessed on 20 March 2024).
  15. Consumer Reports. 2019. Homeowners Insurance. Available online: https://www.consumerreports.org/cro/homeowners-insurance.htm (accessed on 20 March 2024).
  16. Cutler, David M., and Sarah J. Reber. 1998. Paying for Health Insurance: The Trade-Off between Competition and Adverse Selection. The Quarterly Journal of Economics 113: 433–466. [Google Scholar] [CrossRef]
  17. Dionne, Georges, and Neil A. Doherty. 1994. Adverse Selection, Commitment, and Renegotiation: Extension to and Evidence from Insurance Markets. Journal of Political Economy 102: 209–235. [Google Scholar] [CrossRef]
  18. Dionne, Georges, Gouriéroux Christian, and Charles Vanasse. 2001. Testing for Evidence of Adverse Selection in the Automobile Insurance Market: A Comment. Journal of Political Economy 109: 444–453. [Google Scholar] [CrossRef]
  19. Dionne, Georges, Pierre-Carl Michaud, and Maki Dahchour. 2013. Separating moral hazard from adverse selection and learning in automobile insurance: Longitudinal evidence from france. Journal of the European Economic Association 11: 897–917. [Google Scholar] [CrossRef]
  20. Engers, Maxim, and Luis Fernandez. 1987. Market Equilibrium with Hidden Knowledge and Self-Selection. Econometrica 55: 425. [Google Scholar] [CrossRef]
  21. Fan, Yi, Jiquan Chen, Gabriela Shirkey, Ranjeet John, Susie R. Wu, Hogeun Park, and Changliang Shao. 2016. Applications of structural equation modeling (SEM) in ecological studies: An updated review. Ecological Processes 5: 1–12. [Google Scholar] [CrossRef]
  22. Frech III, H. E., and Michael P. Smith. 2015. Anatomy of a Slow-Motion Health Insurance Death Spiral. North American Actuarial Journal 19: 60–72. [Google Scholar] [CrossRef]
  23. Halek, Martin, and Joseph G. Elisenhauer. 2001. Demography of Risk Aversion. The Journal of Risk and Insurance 68: 1–24. [Google Scholar] [CrossRef]
  24. Hellwig, Martin. 1987. Some recent developments in the theory of competition in markets with adverse selection. European Economic Review 31: 319–325. [Google Scholar] [CrossRef]
  25. Hey, John D. 2002. Experimental Economics and the Theory of Decision Making Under Risk and Uncertainty. The Geneva Risk and Insurance Review 27: 5–21. [Google Scholar] [CrossRef]
  26. Jaynes, Gerald David. 1978. Equilibria in monopolistically competitive insurance markets. Journal of Economic Theory 19: 394–422. [Google Scholar] [CrossRef]
  27. Jaynes, Gerald D. 2011. Equilibrium and Strategic Communication in the Adverse Selection Insurance Model. Economics Department Working Paper No. 91. New Haven: Yale University. Available online: https://papers.ssrn.com/sol3/papers.cfm?abstract_id=1865367 (accessed on 20 March 2024).
  28. Jöreskog, Karl G., and Arthur S. Goldberger. 1975. Estimation of a model with multiple indicators and multiple causes of a single latent variable. Journal of the American Statistical Association 70: 631–9. [Google Scholar]
  29. Kenny, David A. 2020. Measuring Model Fit. Available online: http://davidakenny.net/cm/fit.htm (accessed on 20 March 2024).
  30. Kline, Rex B. 2016. Principles and Practice of Structural Equation Modeling, 4th ed. New York: New York Guilford Press. [Google Scholar]
  31. Kosenko, Andrew, Joseph Stiglitz, and Jungyoll Yun. 2023. Bilateral information disclosure in adverse selection markets with nonexclusive competition. Journal of Economic Behavior & Organization 205: 144–168. [Google Scholar] [CrossRef]
  32. Liferay. 2019. 20 Must-know stats for Insurers in 2022. Available online: https://www.liferay.com/blog/customer-experience/20-must-know-stats-for-insurers-in-2022 (accessed on 20 March 2024).
  33. Marton, James, Patricia G. Ketsche, Angela Snyder, E. Kathleen Adams, and Mei Zhou. 2015. Estimating Premium Sensitivity for Children;s Public Health Insurance Coverage: Selection but No Death Spiral. Health Services Research 50: 579–98. [Google Scholar] [CrossRef]
  34. Mathews, Martyn. 2022. Insurance Quote Manipulation Flagged as Research Reveals Half of U.K. Consumers Think It’s Fine to Fib. Available online: https://risk.lexisnexis.co.uk/about-us/press-room/press-release/20220511-quote-intelligence (accessed on 20 March 2024).
  35. Mimra, Wanda, and Achim Wambach. 2014. New Developments in the Theory of Adverse Selection in Competitive Insurance. The Geneva Risk and Insurance Review 39: 136–152. [Google Scholar] [CrossRef]
  36. Netzer, Nick, and Florian Scheuer. 2014. A game theoretic foundation of competitive equilibria with adverse selection. International Economic Review 55: 399–422. [Google Scholar] [CrossRef]
  37. Pauly, Mark V. 1974. Overinsurance and Public Provision of Insurance: The Roles of Moral Hazard and Adverse Selection. The Quarterly Journal of Economics 88: 44–62. [Google Scholar] [CrossRef]
  38. Pauly, Mark V., Olivia S. Mitchell, and Yuhui Zeng. 2007. Death Spiral or Euthanasia? The Demise of Generous Group Health Insurance Coverage. INQUIRY: The Journal of Health Care Organization, Provision, and Financing 44: 412–27. [Google Scholar] [CrossRef] [PubMed]
  39. Puelz, Robert, and Arthur Snow. 1994. Evidence on Adverse Selection: Equilibrium Signaling and Cross-Subsidization in the Insurance Market. Journal of Political Economy 102: 236–257. [Google Scholar] [CrossRef]
  40. Riley, John G. 1979. Informational equilibrium. Econometrica 47: 331–59. [Google Scholar] [CrossRef]
  41. Rothschild, Michael, and Joseph Stiglitz. 1976. Equilibrium in Competitive Insurance Markets: An Essay on the Economics of Imperfect Information. The Quarterly Journal of Economics 90: 629. [Google Scholar] [CrossRef]
  42. Rothschild, Michael, and Joseph E. Stiglitz. 1997. Competition and insurance twenty years later. The Geneva Papers on Risk and Insurance-Theory 22: 73–79. [Google Scholar] [CrossRef]
  43. Rowell, David, Son Nghiem, and Luke B Connelly. 2017. Two Tests for Ex Ante Moral Hazard in a Market for Automobile Insurance. Journal of Risk and Insurance 84: 1103–26. [Google Scholar] [CrossRef]
  44. Rowell, David, Son Nghiem, and Luke B Connelly. 2022. Empirical Tests for Ex Post Moral Hazard in a market for Automobile Insurance. Annals of Actuarial Science 16: 243–260. [Google Scholar] [CrossRef]
  45. Salanié, Bernard. 2017. Equilibrium in Insurance Markets: An Empiricist’s View. The Geneva Risk and Insurance Review 42: 1–14. [Google Scholar] [CrossRef]
  46. Shi, Fei. 2008. Endogenous Timing with Demand Uncertainty. Working paper No. 30. Thurgau Institute of Economics and Department of Economics, University of Konstanz. Konstanz. Available online: http://nbn-resolving.de/urn:nbn:de:bsz:352-opus-59885 (accessed on 20 March 2024).
  47. Spence, Michael. 1978. Product differentiation and performance in insurance markets. Journal of Public Economics 10: 427–47. [Google Scholar] [CrossRef]
  48. Stiglitz, Joseph, Jungyoll Yun, and Andrew Kosenko. 2017. Equilibrium in a Competitive Insurance Market under Adverse Selection with Endogenous Information. Working Paper No. w23556. National Bureau of Economic Research. Cambridge, Massachusetts. Available online: http://www.nber.org/papers/w23556 (accessed on 20 March 2024).
  49. Ullmann, Jodie B., and Peter M. Bentler. 2004. Structural Equation Modeling. In Handbook of Data Analysis. Edited by M. Hardy and A. Bryman. London: Sage Publications, pp. 431–58. [Google Scholar]
  50. Wilson, Charles. 1977. A model of insurance markets with incomplete information. Journal of Economic Theory 16: 167–207. [Google Scholar] [CrossRef]
Figure 1. Stages of the game.
Jrfm 17 00154 g001
Figure 2. Reaction functions and Nash equilibria in efforts space.
Jrfm 17 00154 g002
Figure 3. Projecting Nash equilibria into (W1, W2)-levels space.
Jrfm 17 00154 g003
Figure 4. Market for automobile insurance in Australia, 1997–1999. Note: Insurers with < 15 policies in the IMRAS dataset are excluded from the graph.
Jrfm 17 00154 g004
Figure 5. Structural equation model (developmental dataset, 1999, n = 2000). Note: LR test of model vs. saturated:   χ 2 (42) = 4936.82, Probability > χ 2 < 0.01, (n = 1033).
Jrfm 17 00154 g005
Figure 6. Structural equation model (test dataset, 1999, n = 2006). Note: LR test of model vs. saturated:   χ 2 (42) = 4681.91, Probability > χ 2 < 0.01, (n = 1024).
Jrfm 17 00154 g006
Table 1. Variable descriptions, summary statistics, and rationale for hypothesized correlations (full sample).
VariableMean eS.D.SkewRationale for Predicted Correlation with Latent Variable
Consumer Search Effort (CSE)
Premium_Search (coverage/premium ratio reported as quintiles)2.981.140.02The coverage/premium ratio is positively correlated with CSE. Consumers are hypothesized to seek maximum coverage for a given premium.
Insurer_Search (=1 if CTP and Comprehensive insurers are not equal, =0 if otherwise)0.270.441.05Buying CTP and comprehensive insurance from the same firm is indicative of a low CSE; buying comprehensive insurance from an alternative firm is indicative of higher CSE. a
Knows_NCB (=1 if the consumer knows NCB, =0 otherwise) 0.890.31−2.53A policyholder knowing their NCB is indicative of a higher CSE.
Insurer Selection Effort (ISE)
Premium_Highrisks (Premiums for high-risk policyholders in high-risk areas: 1 to 5 max.) c3.680.70−2.10Higher premiums for the highest-risk policies are indicative of a higher ISE
No_Protect_NCB (=1 if NCB protection is not offered, =0 otherwise)0.080.303.12Prohibiting NCB protection is indicative of high ISE. b
No_Reduce_Excess (=1 if the consumer cannot reduce excess)0.400.490.50Prohibiting excess reduction is indicative of high ISE.
Both CSE and ISE
Rejected_C (=1 if the consumer changed the IC after the incident, =0 otherwise)
High-Risk-Type (RT+)0.050.210.04In principle, the change is interpreted as reflecting an action by the IC because consumers rarely wish to change insurers after an incident, but as an exception, this may occur.
RTCs (number of accidents reported; 0, 1 or ≥2)0.310.601.72Reporting many RTCs (1994–1999) is indicative of a high risk-type
Parts_Damaged (count of car parts damaged)0.071.724.63Number of damaged car parts is positively correlated with a high-risk type
Metro (=1 if someone lives in a metropolitan region, =0 if otherwise) 0.620.48−0.53Due to the increased cost of repairs and the probability of theft, metropolitan regions are correlated with higher risk type. d
Young_Driver (=1 if aged < 25 years, =0 if otherwise)0.090.292.87Young drivers are associated with more RTCs, hence the high-risk type
Notes: a CTP insurance is compulsory, but comprehensive insurance is optional. Many insurers offer both types of policies. b Insurers can design their own NCB scheme, and hence the rules and rates vary between them. c See Table A1, Col. 2, for data. d See Australian Consumer Association (ACA) (1997) pp. 6–13 for further discussion. e The mean of a dichotomous variable indicates the share of cases where the characteristic in question is observed (=1).
Disclaimer/Publisher’s Note: The statements, opinions and data contained in all publications are solely those of the individual author(s) and contributor(s) and not of MDPI and/or the editor(s). MDPI and/or the editor(s) disclaim responsibility for any injury to people or property resulting from any ideas, methods, instructions or products referred to in the content.

