Abstract
The wide use of telecommunications, computers and the internet, especially over the last four decades, has formed a new economic phenomenon, the “Digital Economy”. As a matter of facts, the development of digitalization has raised questions about its contribution to official economic indicators. This research examines the evolution of the information and communication industry (ICI) and its contribution to the national Gross Domestic Product (GDP) of six European entities. Time series and auto-ARIMA models are employed to process the data. Moreover, this study forecasts the development of the ICI in the future. The results demonstrate a clear stable growth in the variable under examination over time, showing an increasingly greater contribution of the ICI to the national GDP in most cases with the exception of Greece, which has a high provisional risk.
1. Introduction
One of the most crucial changes in recent decades is the change to a society based on the internet and digitalization (Unold 2003; Limna et al. 2022). Nowadays, digitalization is involved in everyday life through the use of smartphones, virtual reality and information networks (Grigorescu et al. 2021). The extensive use of the internet, information technology (software and applications) and telecommunications since the early 1990s has created a new economic phenomenon, the “Digital Economy” (Wang 2022; Williams 2021).
The research on the digital economy is diverse and covers multiple axes or areas of focus such as the conceptual definition and scope of the digital economy (Tapscott 1996; Maglio and Spohrer 2008; Meisenberg 2014; Bukht and Heeks 2017), the digital economy and economic development (Qian et al. 2020; Kristoffersen et al. 2020; Škare and Soriano 2021), infrastructure and technological integration (Wu et al. 2021; Milskaya and Seeleva 2019), challenges in the digital economy (Xia et al. 2024; Guryanova et al. 2019), the impact on high-quality economic development (Pouri and Hilty 2021; Zhang et al. 2021; Ding et al. 2022), and the impact on environmental fields (Xue et al. 2022; Dong et al. 2022; Zhang et al. 2022). However, there is a gap in the observation of digital economy development (Zhang et al. 2021), and quantifying its impact on national economies remains a complex and challenging endeavor (Oloyede et al. 2023).
The digital economy is characterized by the integration of digital technologies into various aspects of economic life, leading to increased efficiency and the creation of new business models (Bressanelli et al. 2018). The application of big data, cloud computing and new algorithms has enabled the rapid exchange of data, streamlined communication, and facilitated the development of platforms that disrupt traditional industries and the structure of the economy (Kenney and Zysman 2016). This rapid growth in the information and communication sector necessitates a thorough examination of its impact on economic growth (Magoutas et al. 2024). Sawng et al. (2021) investigated the relationship between information and communication technology (ICT) investment and GDP growth in Korea, revealing a bidirectional influence, except in the short term, where only ICT investment impacted GDP growth. Similarly, Haftu (2019) demonstrated that increased mobile phone penetration has significantly contributed to GDP per capita growth in Sub-Saharan Africa. According to Fernández-Portillo et al. (2020), advancements in the implementation and utilization of information and communication technologies contributes to the economic growth in countries within the context of developed European economies.
The American economist and Nobel laureate Robert Solow points to the absence of the computer age in productivity data, although the daily increasing use of digitalization is widely acknowledged. This is mainly because most digital products or services have a non-measurable cost. As a result, their contribution to official economic indicators, which consider only the amount that consumers spend on good or services, is unspecified (Brynjolfsson and Collis 2019). For example, the classical economic indicator of the GDP is unable to measure some aspects of the economy which are associated with the non-measurable benefits of free-of-charge goods and services. However, given the rise in digital-centric economic activities and their growing economic importance, measuring the digital economy is essential (Williams 2021). Considering all the above, the question arises about the real contribution of the digital economy to official data and indicators. The purpose of this research is to address this gap by not only examining the development of the digital economy but also forecasting its future evolution within the European Union’s industrial sector.
More specifically, this research examines the development of the digital economy in six entities. The entities consist of five European countries: Sweden, Austria, Germany, Czechia and Greece and the average of the 27 members of the European Union. The selection of these entities was based on their performance on the DESI 2022 index. Except for Germany, the other four counties have approximately the same population. This study extends from 1995 to 2022. Moreover, this paper uses time series ARIMA models (Chatfield 2003) to process the data. The website of Eurostat (Eurostat 2024) provides the necessary data while R 4.4.1 software (R Core Team 2024) is employed for the statistical analysis. Finally, this research uses the forecast package (Hyndman et al. 2024) to predict the evolution of the information and communication industry (ICI) from 2023 to 2027. The ICI counts the contribution of telecommunications, computer programming, consultancy, information service activities, television production, and publishing activities to the national GDP. The principal conclusions support that there is a stable growth in the ICI during the period under examination, showing a greater contribution to the national GDP in most cases.
This study makes significant contributions to the academic understanding of the digital economy’s impact on traditional economic indicators. This study critiques traditional economic indicators, particularly the GDP, finding their inability to fully capture the contributions of digitalization. This critique is grounded in the observation that digital products and services are often intangible and non-measurable by classical metrics. By focusing on the ICI index across multiple European countries, this research highlights the need to incorporate broader measures of digitalization into economic analysis. This study’s examination of the ICI across five European countries, as well as the average of the 27 E.U. members, allows for a comparative analysis that is often missing in other research, particularly those focusing on single countries like the U.S.A. and China. Unlike recent studies in the context of the European Union (Magoutas et al. 2024), this research introduces a methodological advancement by incorporating the forecasting of future developments, enhancing the study of economic evolution. This broader focus of the research offers a more holistic understanding of the digital economy’s role in national economic performance. Moreover, this study’s emphasis on European countries expands the scope of digital economy research, providing a basis for comparative studies across different regions.
This paper is structured as follows: the next section presents the ways of measuring the digital economy. Moreover, it mentions the effects of digitalization on multiple national economies so far. The third section describes the data used and the employed methodology while the following chapter mentions the results of this study. Finally, the next section draws the conclusions and discusses the results of this study while the last section presents the references used.
2. Literature Review
2.1. The Digital Economy
The digital economy is a dynamic variable which evolves constantly over time due to technological progress. Consequently, since 1996, there have been several definitions that try to describe this new form of economy (Bukht and Heeks 2017). The initial definitions identify the digital economy with the broad concept of the internet (Tapscott 1996; Lane 1999). Through the years, more and more definitions have been presented (Turban et al. 2002; Unold 2003; Carlsson 2004; Asen and Blechschmidt 2016; Bahl 2016; Bukht and Heeks 2017). This study employs one of the most recent definitions, which is the “internet and related information and communication technologies (ICT)” (Barefoot et al. 2018) and focuses on the industry of digitalization. According to the Organization for Economic Co-operation and Development (OECD), the ICT sector is “a combination of industries and services that receive, transmit and display information and data electronically”. The rapid growth in the digital economy has had a huge impact on business operations and consumer interactions, between companies and customers, aiming to meet their needs (Barefoot et al. 2018).
The increased value of the internet and digitalization in recent decades is also reflected in the data. More precisely the percentage of U.S. citizens who use the internet grew from 44% in 2000 to 75% in 2015 (Barefoot et al. 2018) and reached 91.8% in 2023 (Statista 2024). Moreover, in 2018, every U.S. citizen used digital media for 6.3 h per day on average (Brynjolfsson and Collis 2019), and this increased to 8.4 h per day five years later (Smart1marketing 2024). Concerning the U.S. computer industry, it grew from 4.9% of the U.S. Gross Domestic Product (GDP) in 1985 to 9% of that in 2000, while in 1999 alone, internet-related jobs increased by 36% (Unold 2003). Furthermore, revenues from U.S. e-commerce increased approximately 174.5% from 1995 to 1998, generating a turnover of USD 301.4 billion, while the U.S. GDP increased by only 2.8% during the same period (Garner 2002). In 2023, the software and information technology industry accounted for more than 10% of the U.S. GDP and for 12.1 million job openings (Select USA 2024), while total e-commerce sales were estimated at USD 1118 billion during the same year (United States Census Bureau 2024).
In recent years, the digital economy has played a leading role in terms of scientific and technological progress (Voronkova et al. 2020). Digitalization triggers technological innovation, market development and industrial integration (Ding et al. 2022). The digital sector presents a foundation of digital economies (Williams 2021), and innovative products and services contribute significantly to the development of the real economy. Progress made in information technology and digitalization aids the design and development of innovations (Kim 2022). The number of U.S. patents has more than doubled in recent years, mainly due to digitalization (Carlsson 2004). Specifically, in 2023, utility and design patents reached to 349,000 publications (TT Consultants 2024). Companies try to capitalize on these innovations and gain competitive advantages by reducing the costs or improving the quality of products (Kim 2022). As a result, the succession of new information and communications technologies (ICT) such as the Internet of Things, innovative devices and new digital models supports this economic change (Bukht and Heeks 2017). Technological progress, the outcome of the development of the digital economy, creates various economic and scientific models based on the solution of human problems related to budget deficits, crises, corruption, and social security (Voronkova et al. 2020). These models use nanotechnology, artificial intelligence, robotization and automation to solve economic problems and achieve social equity.
It is commonly accepted that the development of science and technology plays a key role in establishing strategies and guaranteeing the labor productivity of a national economy (Bulturbayevich and Jurayevich 2020). Even in cases where production factors are limited, it is estimated that technological evolution and innovation support economic growth by improving production efficiency (Pang et al. 2022). Consequently, countries that expect economic development and recovery should also develop their digital economy (Reinert 2018).
2.2. Measuring the Digital Economy
The various definitions that exist alongside the problems in data quality and the identification of the digital economy in many financial activities make the quantification of the digital economy a demanding process (Bukht and Heeks 2017). Another critical issue is the difficulty in measuring the value of digital goods and services at zero cost (Brynjolfsson and Collis 2019).
A commonly accepted way of measuring the digital economy is ICT (Barefoot et al. 2018). The ICT sector includes activities related to computer manufacture, electronic and optical products, software edition, telecommunications, computer programming and information services (Bukht and Heeks 2017).
Regarding the Eurozone, the European Commission has established the Digital Economy and Society Index (DESI) to record the digital performance of the European Union countries compared with other members of the E.U. According to the official website of the European Commission, this index considers four different dimensions: human capital, connectivity, digital integration and digital public services (European Commission 2024). Despite the digital improvement of European countries as a whole during recent years, there is still a “digital” gap among the member states. Scandinavian countries, which have early invested in digital technologies, perform significantly better than countries like Greece, Bulgaria and Romania, which display a low digital score. The difference between the highest rate of DESI (Finland) and the lowest (Romania) can reach 40 percentage points.
2.3. Digitalization and National Economies
More and more countries are including the digital economy as one of their main development strategies (Tian and Liu 2021). Essentially, every country has a duty to apply new technologies and digitalization in the production process and in administration (Bulturbayevich and Jurayevich 2020). Nevertheless, there are still countries that have not yet treated the exploitation of the multiple benefits of digitalization with the necessary attention (Tayibnapis et al. 2018). It is estimated that in emerging geographical areas, the impact of the digital economy is reduced to one-third or to one-half compared to in developed areas (Bukht and Heeks 2017). More specifically, the internet constitutes 20% of the GDP of developed countries, approximately 10% of the BRIC (Brazil, Russia, India, China) economy and only 5% of the GDP of other developing geographical areas (Manyika and Roxburgh 2011).
At a global level, it is estimated that digital economy contributes approximately 5% of the GDP and 3% of job openings despite the difficulty in locating activities related to digitalization, which significantly degrades the real contribution (Bukht and Heeks 2017). In 2020, products sold globally through the internet alone were worth USD 14.4 trillion (Bulturbayevich and Jurayevich 2020). Moreover, in 2021, the mobile sector accounted for 5% of the global GDP, which is equivalent to USD 4.4 trillion (Global System for Mobile Association 2022). Finally, 3% of transnational employment and 5% of the international GDP is composed by the digital economy (Williams 2021).
Regarding the U.S.A. from 2006 to 2016, the digital economy grew by an average of 5.6% per year while the annual growth rate of the whole economy was just 1.5% (Barefoot et al. 2018). In 2016 alone, digitalization contributed to the development of the U.S. GDP by 6.5%, which is equivalent to USD 1209.2 billion; increased the production of goods and services by 6.2%; created 3.9% of new job openings; and raised employee salaries by 6.7% (Barefoot et al. 2018). “Free digital content”, which describes some free-of-charge aspects of the digital economy like Google and Facebook, alone increased the U.S. GDP by 0.11% per year from 2005 to 2015, as well as increasing the index related to the productivity of private firms (TFP growth) by 0.07% annually in the same period (Nakamura et al. 2017).
In the case of Russia, there are specific federal entities that have a superior level of IT infrastructure in comparison to some European countries (Sidorov and Senchenko 2020). The volume of the Russian digital economy is estimated to reach to 9.6 billion rubles in 2025, which is approximately 3-fold the amount of 3.2 billion rubles in 2015 (Aptekman et al. 2017). This increase is mainly caused by the change in traditional sectors to digitalization. Regarding the emerging market of Indonesia, the digital economy has a primary role in the development of the national economy as it contributes to 4% of global e-commerce (Barata 2019). Another study, which uses eleven eastern and central European countries as entities, suggests that digitalization and a developed human cloud industry, including educational and health components, affect GDP per capita positively (Grigorescu et al. 2021).
Regarding China, the digital economy is a new strategy to trigger technological progress and high-quality development in a country’s economy (Ding et al. 2022). More specifically, through the supply–demand dynamic balance, the digital economy creates high-quality economic growth by triggering eventual consumption, increasing the purchasing needs and increasing the supply system’s productiveness, profitability and quality (Pang et al. 2022). Furthermore, China’s digital infrastructure, industry and integration have an extremely positive influence on the total factor productivity of Chinese cities—0.2452, 0.0773 and 0.3458, respectively (Zhang et al. 2021). Moreover, the growth in China’s digital economy is steadily increasing over time, and the eastern regions show greater digital development as there is a “digital access gap” among the east and the rest of China. Decision makers should narrow this digital gap and minimize development imbalances among Chinese regions by wisely implementing appropriate digitalization tools (Ding et al. 2022). More specifically, in China, Zhejiang shows a good level of coordination between the digital economy and high-quality economic development, resulting in a growth of 0.4694% in terms of the level of high-quality economic development for every 1% increase in the level of the digital economy (Wen and Wang 2024).
Most papers examine the effects of the digital economy in the U.S.A. and China considering only one aspect of digitalization such as the mobile sector, Google or Facebook. The unique nature of this paper is that it considers European countries and employs time series regressions to study the evolution of a non-widely used ICI index which accounts for the contribution of important aspects of economy, like telecommunications, programming and digital activities, to the GDP over the last thirty years. Finally, this research predicts the development of the ICI in the future.
3. Data and Methodology
This research considers the average of the 27 members of the European Union and 5 E.U. countries: Sweden, Austria, Germany, Czechia, and Greece. The selection of these countries was based on the DESI 2022 ranking of the countries, where three of them (Sweden, Austria, Germany) are above the E.U. average while the other two (Czechia, Greece) are below the mean of the European Union. Moreover, except for Germany, the other four counties have approximately the same population. The time period of the research extends from 1995 to 2022. The employed variable is the “National accounts aggregates by industry (up to NACE)” regarding the ICI. NACE stands for the general nomenclature of the economic activities in the European Communities while the ICI counts the contribution of telecommunications, computer programming, consultancy, information service activities, television production, and publishing activities to the national GDP. Chain-linked volumes are used as the unit of measure and 2015 is the base year. This means that the value of the information and communication variable in 2015 is 100 for all the entities. The website of Eurostat provides the required data (Eurostat 2024). More specifically, on the website of Eurostat “National accounts aggregates by industry (up to NACE)”, the frame of “Geopolitical entity” is filled with “Sweden, Austria, Germany, Czechia, Greece and the average of the 27 members of E.U.” while the years from 1995 to 2022 fill up the frame of “Time”. In the field of “Unit of measure”, the “Chain linked volumes, index 2015 = 100” is selected, while the “Information and communication” industry is selected in the “Statistical classification of economic activities in the European Community”. Finally, “Value added, gross” fills the frame of “National accounts indicator”. The data were processed appropriately for further elaboration. R, software for statistical computing and graphics (R Core Team 2024), was used for data processing.
4. Results
This section demonstrates the results of this paper. More precisely, the first part of this section refers to the descriptive statistics while the second part shows the predictive models employed.
4.1. Descriptive Statistics
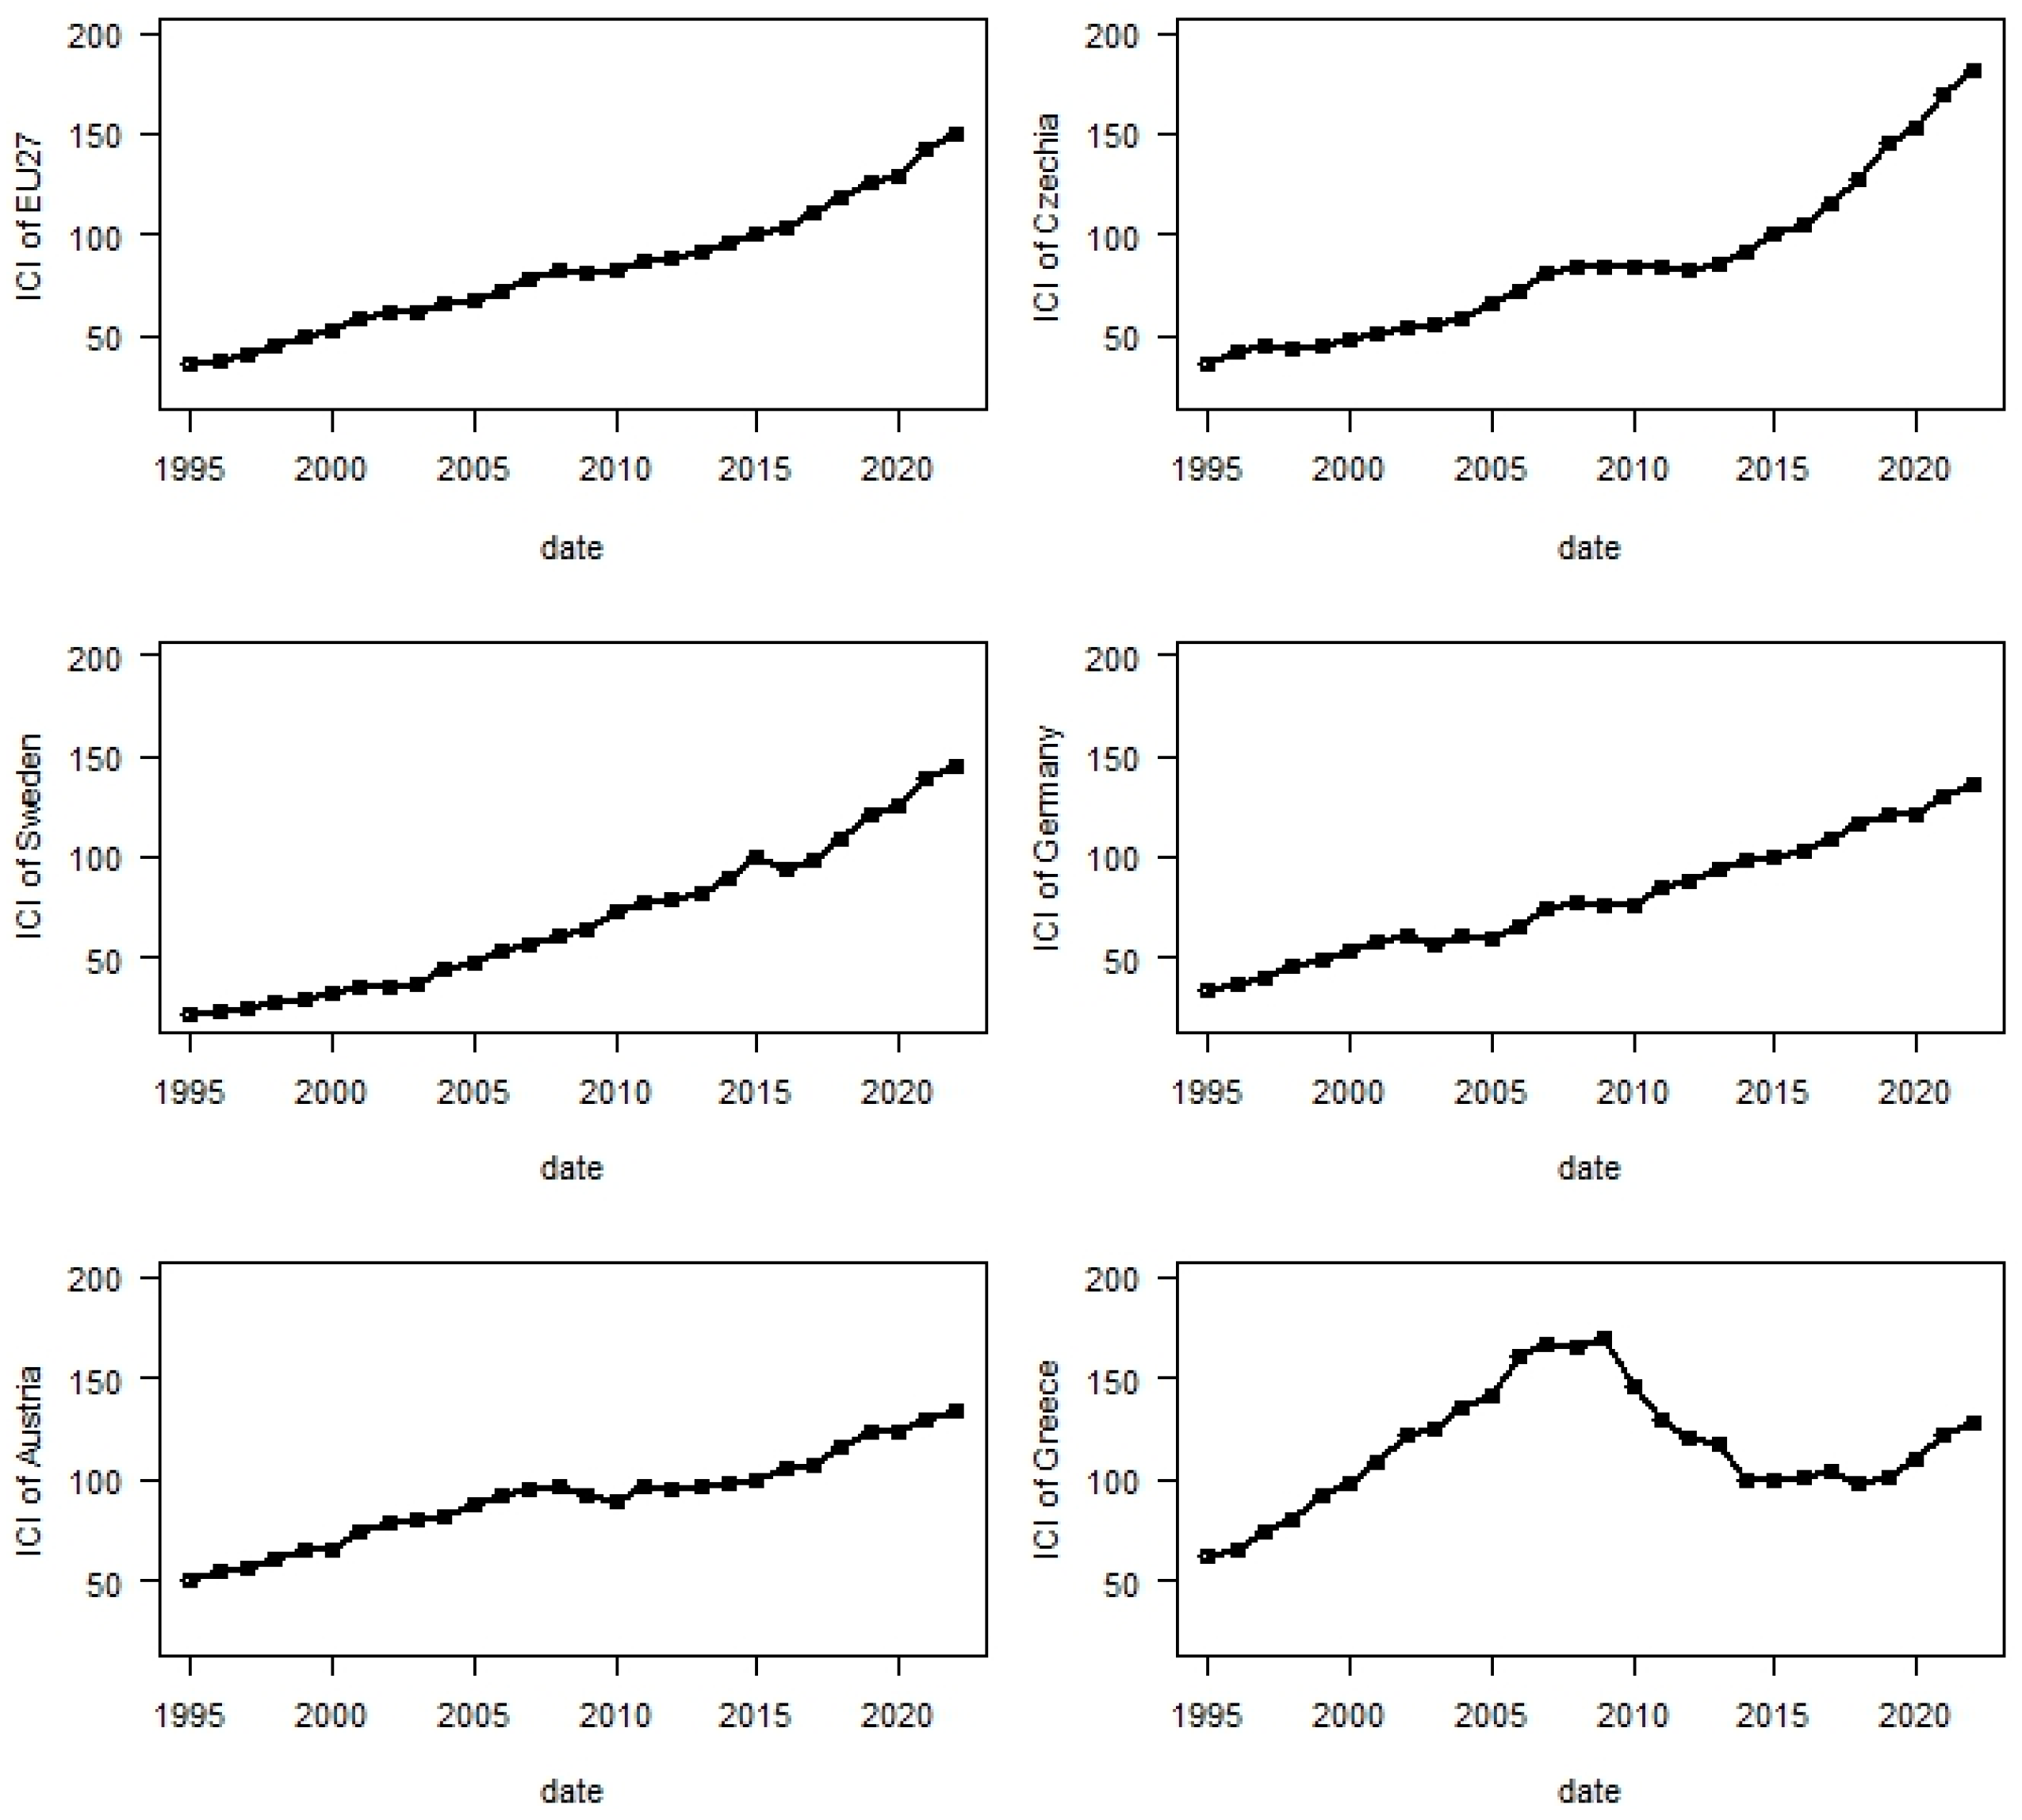
In this subsection, the descriptive statistics of the time series are presented, beginning from the time series plots for each entity (Figure 1).
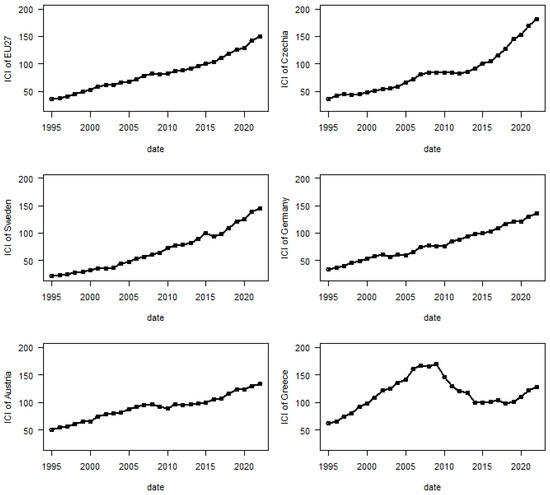
Figure 1.
Time series plots of the information and communication industry (ICI) index for the 27 members of the E.U., Czechia, Sweden, Germany, Austria and Greece.
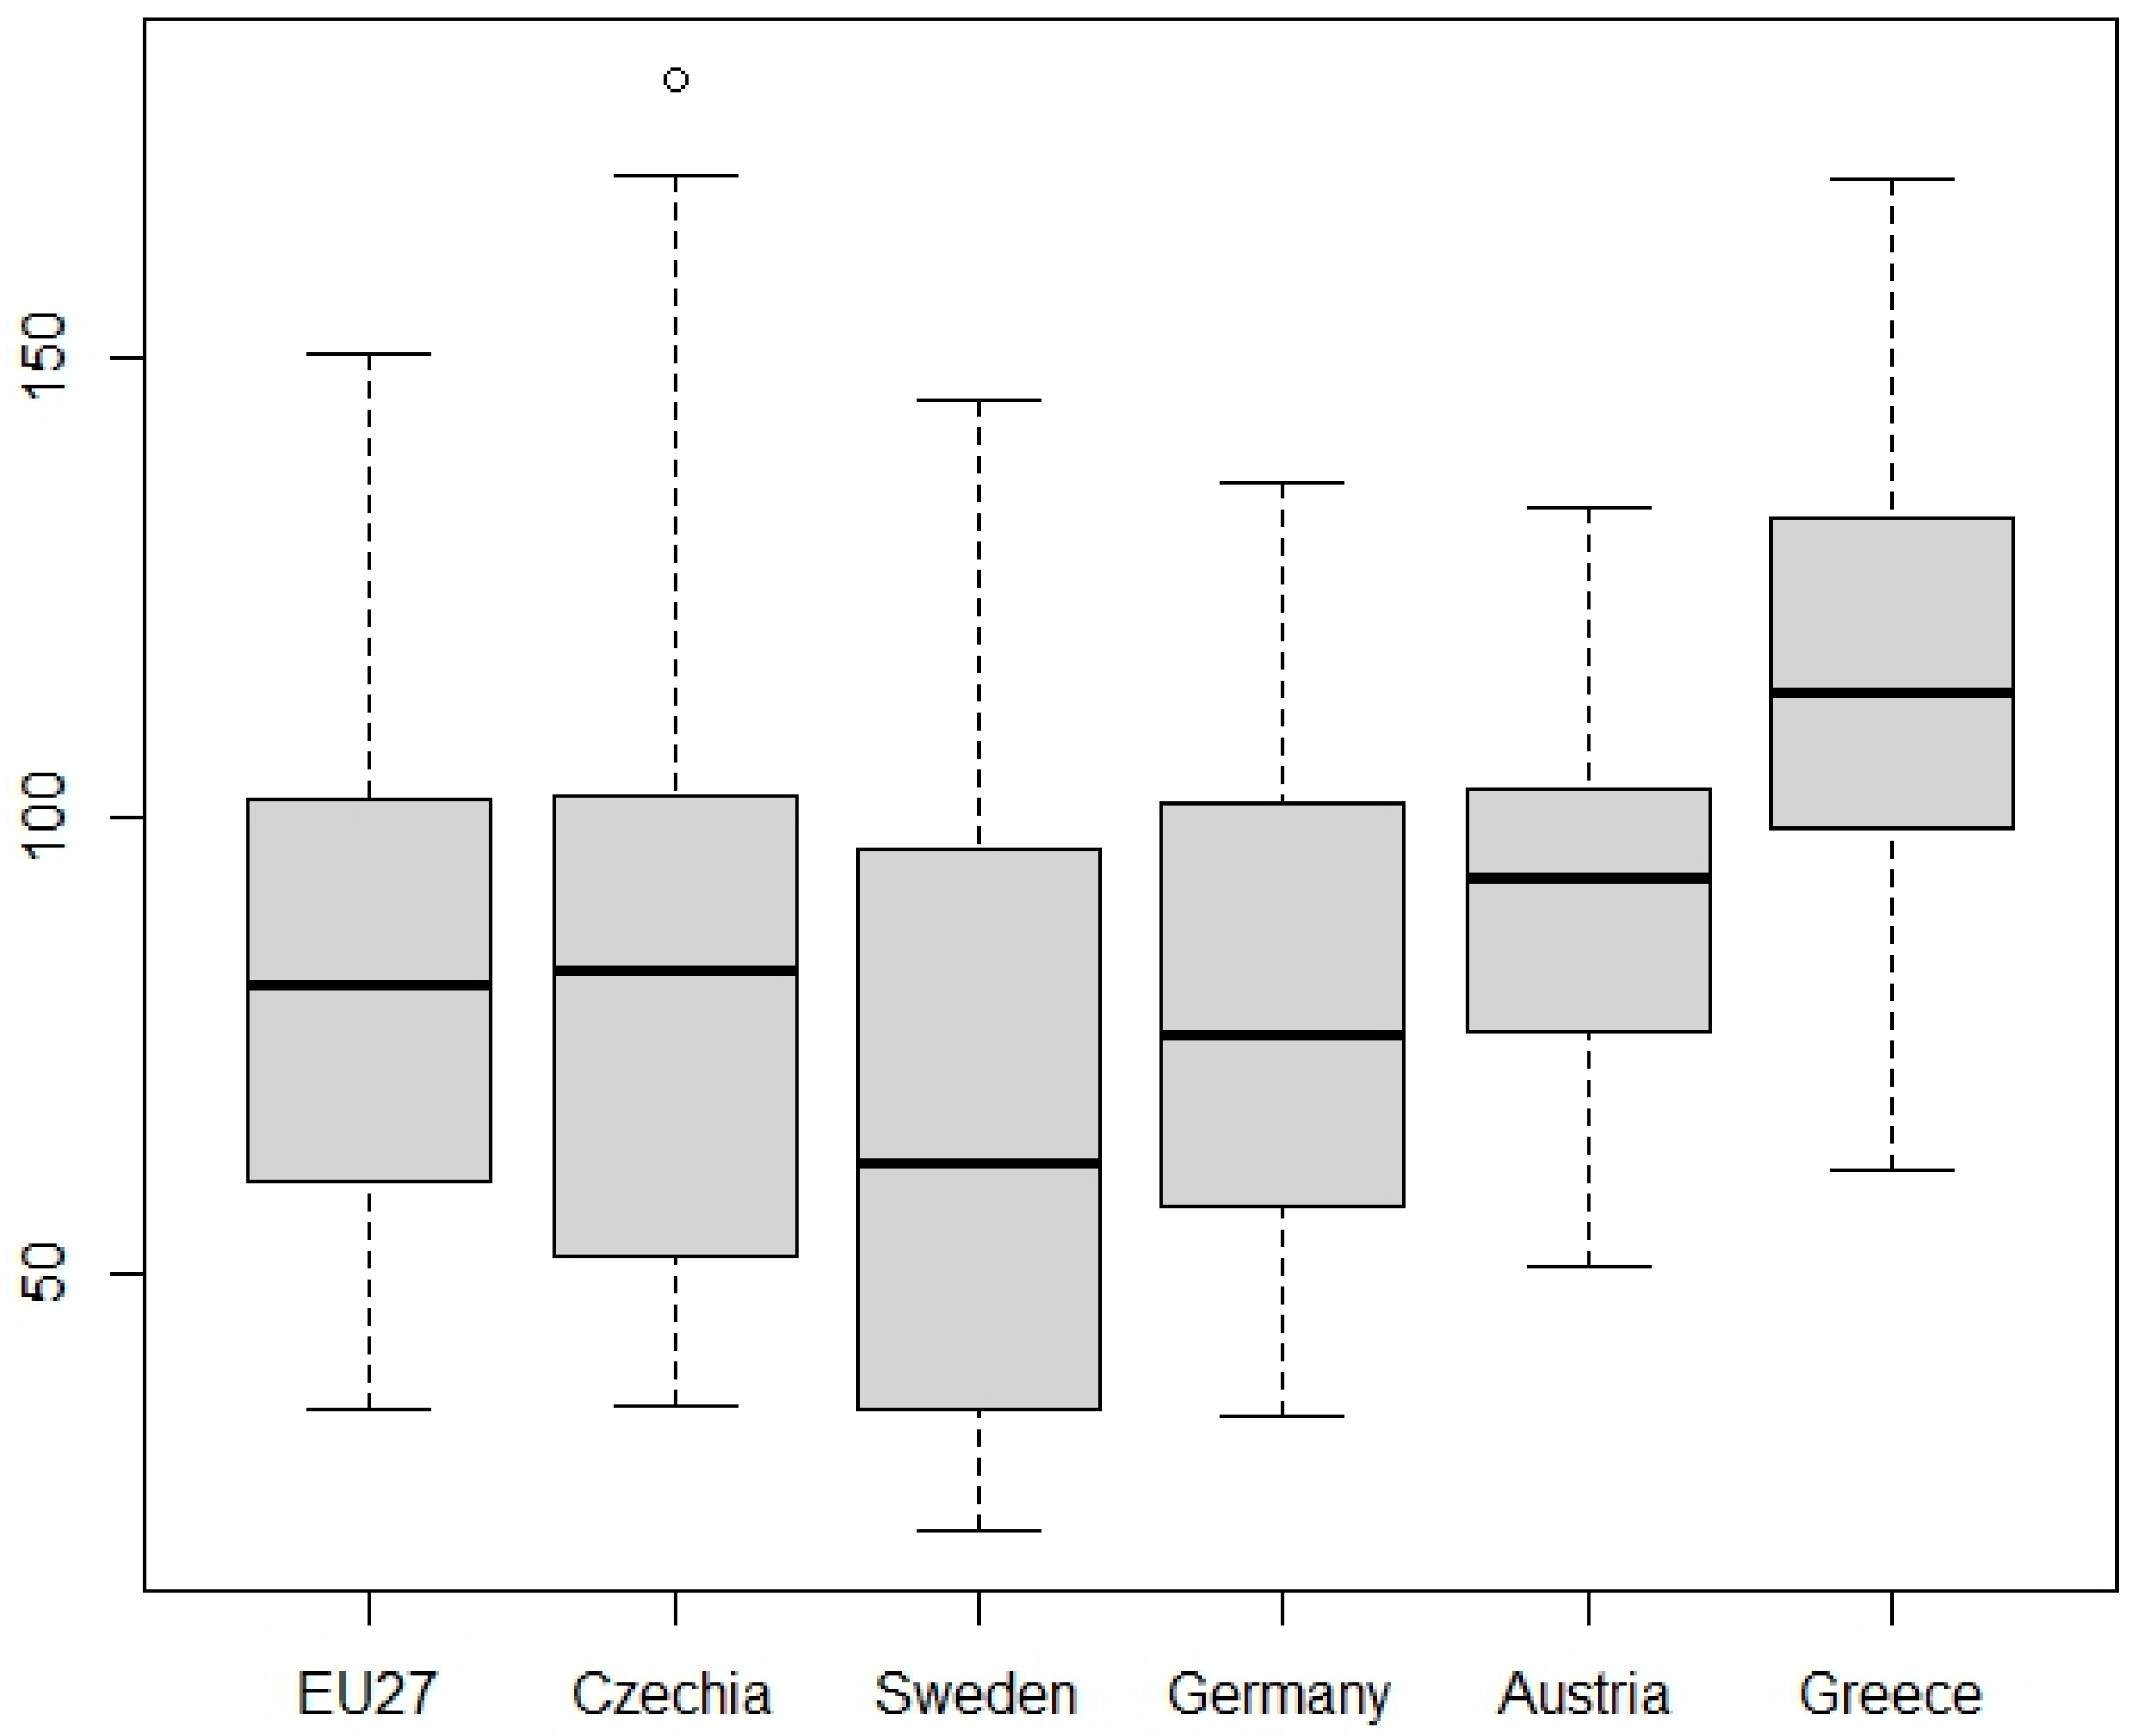
The visualization of the time series reveals similar behavior among all the entities except Greece. Although the 27 members of the E.U., Czechia, Sweden, Germany and Austria have, in some cases, significantly different ICI values (e.g., the ICI of Czechia in 2022 is 180.73 and the ICI of Germany in the same year is 136.54), the overall development of the ICI of these five entities is constantly increasing in time. Czechia seems to show the steepest increasing rate and the highest ICI in 2022 (180.73) compared with Sweden, Germany, Austria and Greece. On the contrary, only Greece shows its highest ICI values in the period 2005–2011 but has a long time period of a significant decrease in the ICI after 2011 and until 2019. Although Greece has very high ICI values overall, as shown in Figure 2, and the highest ICI for a long time period (2005–2011), the current position of the country regarding the digital economy is lower than that of the other five entities included in this study (the ICI of Greece in 2022 is 127.37) due to the significant decrease in the ICI in 2012–2019.
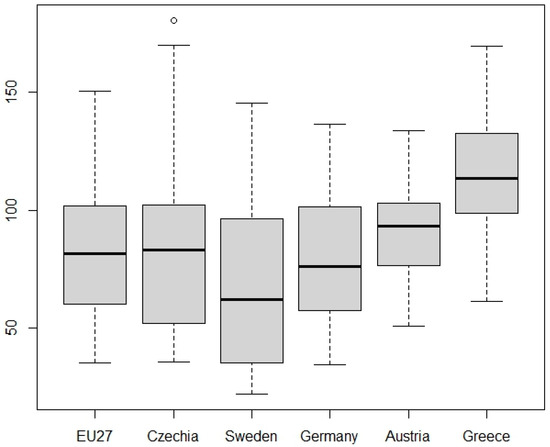
Figure 2.
Box plots of the information and communication industry (ICI) index for the 27 members of the E.U., Czechia, Sweden, Germany, Austria and Greece.
4.2. Predictive Models
In this subsection, Autoregressive Integrated Moving Average (ARIMA) models (Chatfield 2003; Chatfield and Xing 2019) will be employed in order to model the ICI time series and forecast the future behavior of the index. A non-seasonal ARIMA (p, d, q) process is given by the following equation:
where yt is the time series, εt is a white noise process with a mean zero and constant variance, B is the backshift operator, ϕ(Β) = 1 − ϕ1B −· · · ϕpBp and θ(Β) = 1 + θ1B +· · · + θqBq are polynomials of order p and q, respectively, and d is the order of differencing.
ϕ(B)(1 − B)dyt = c + θ(B)εt
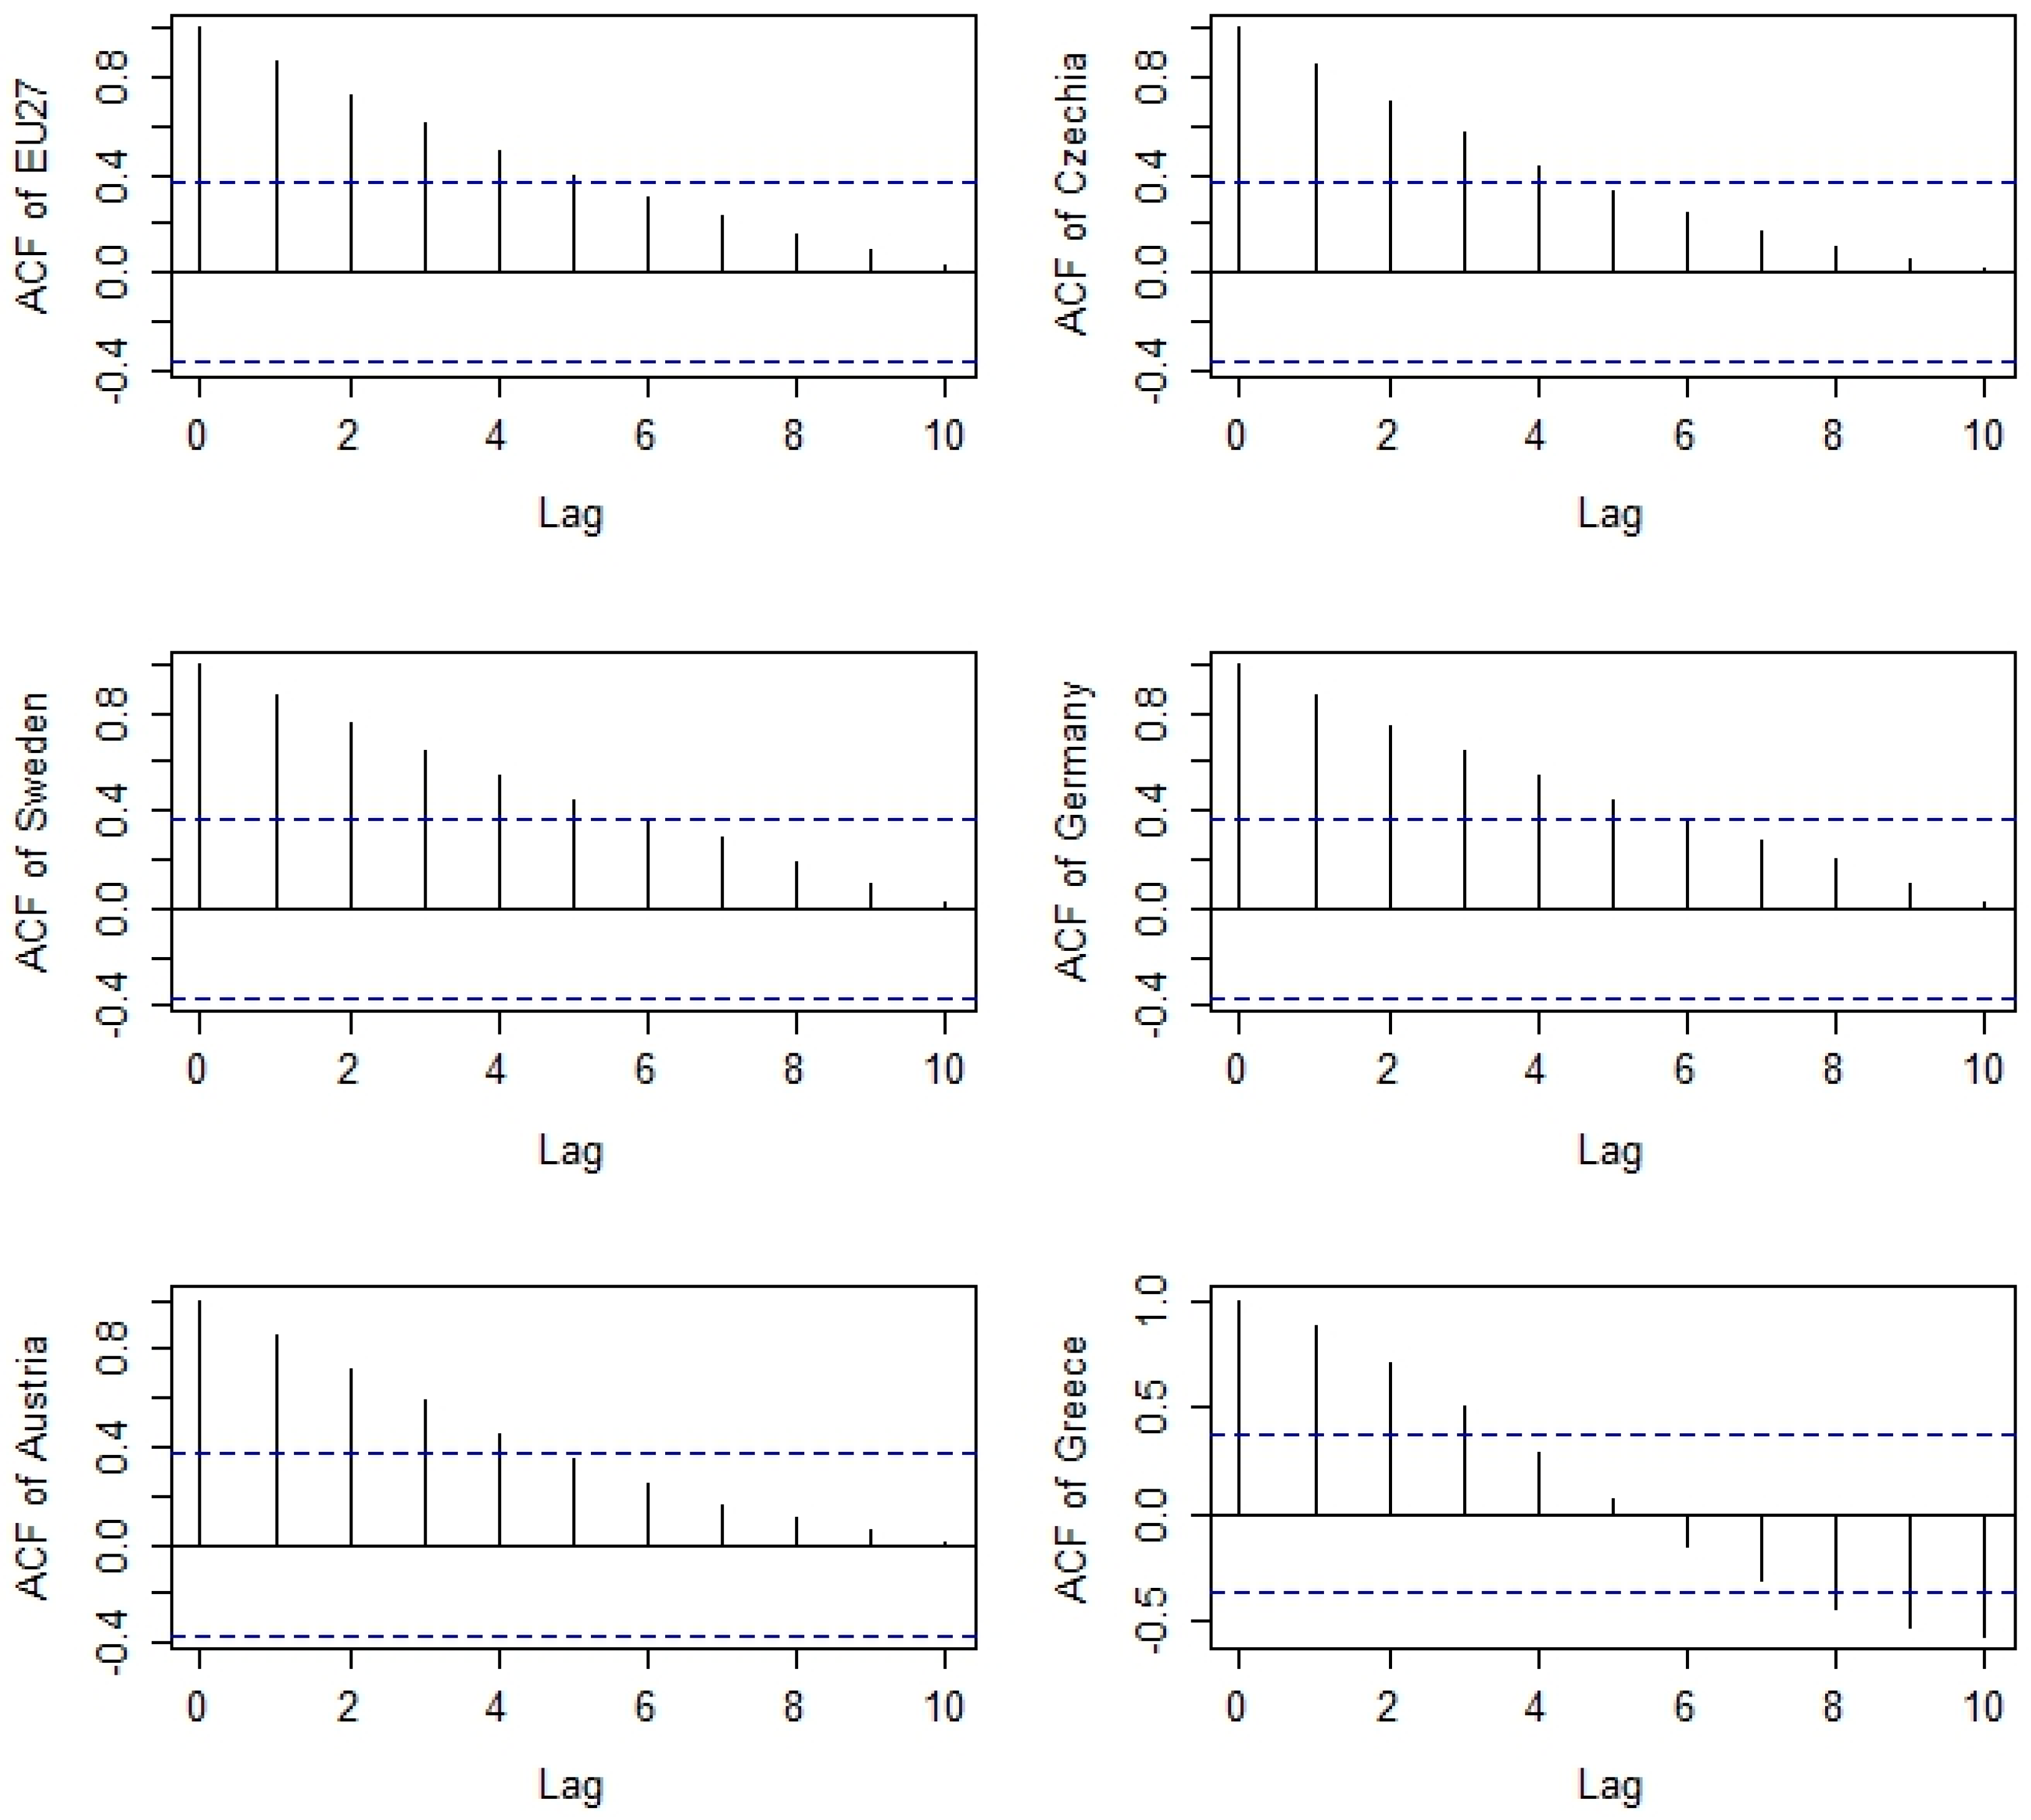
Model selection requires the identification of the parameters p, d, and q and minimizing of information criteria such as Akaike’s Information Criterion (AIC), as described in Hyndman and Khandakar (2008). The visualization of the development of the ICI in Figure 1 shows a trend for the ICI time series of 27 members of the E.U, Czechia, Sweden, Germany and Austria, whereas there is no such evidence for the ICI time series of Greece. Moreover, the plot indicates a lack of stationarity, especially for the first five, as the time series does not show a constant mean over time. Additionally, the autocorrelation function (ACF) of the time series of all entities, depicted in Figure 3, shows a very slowly decaying of the ACF of the 27 members of the E.U., Czechia, Sweden, Germany and Austria, indicating non-stationarity, whereas the correlogram of Greece implies an AR component in the model that will be selected.
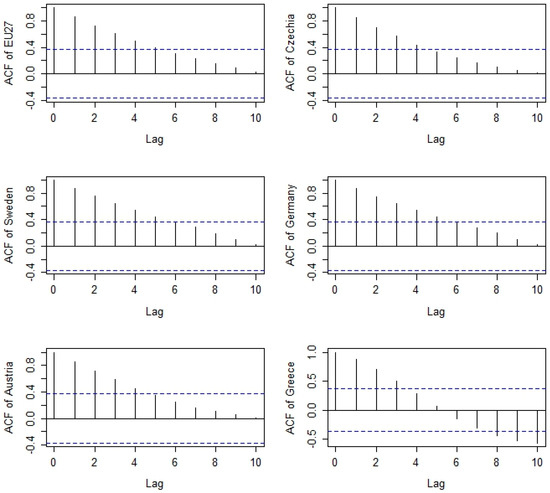
Figure 3.
Correlograms of the information and communication industry (ICI) index for the 27 members of the E.U., Czechia, Sweden, Germany, Austria and Greece.
Furthermore, the Dickey–Fuller test (Dickey and Fuller 1979) was employed to check if the data for each entity was stationary or non-stationary. The p-values of all the entities were greater than 5% (Table 1), which indicates that all the time series have non-stationary characteristics, but Austria and Greece show the smallest discrepancy from stationarity.

Table 1.
Augmented Dickey–Fuller test (lag order = 3).
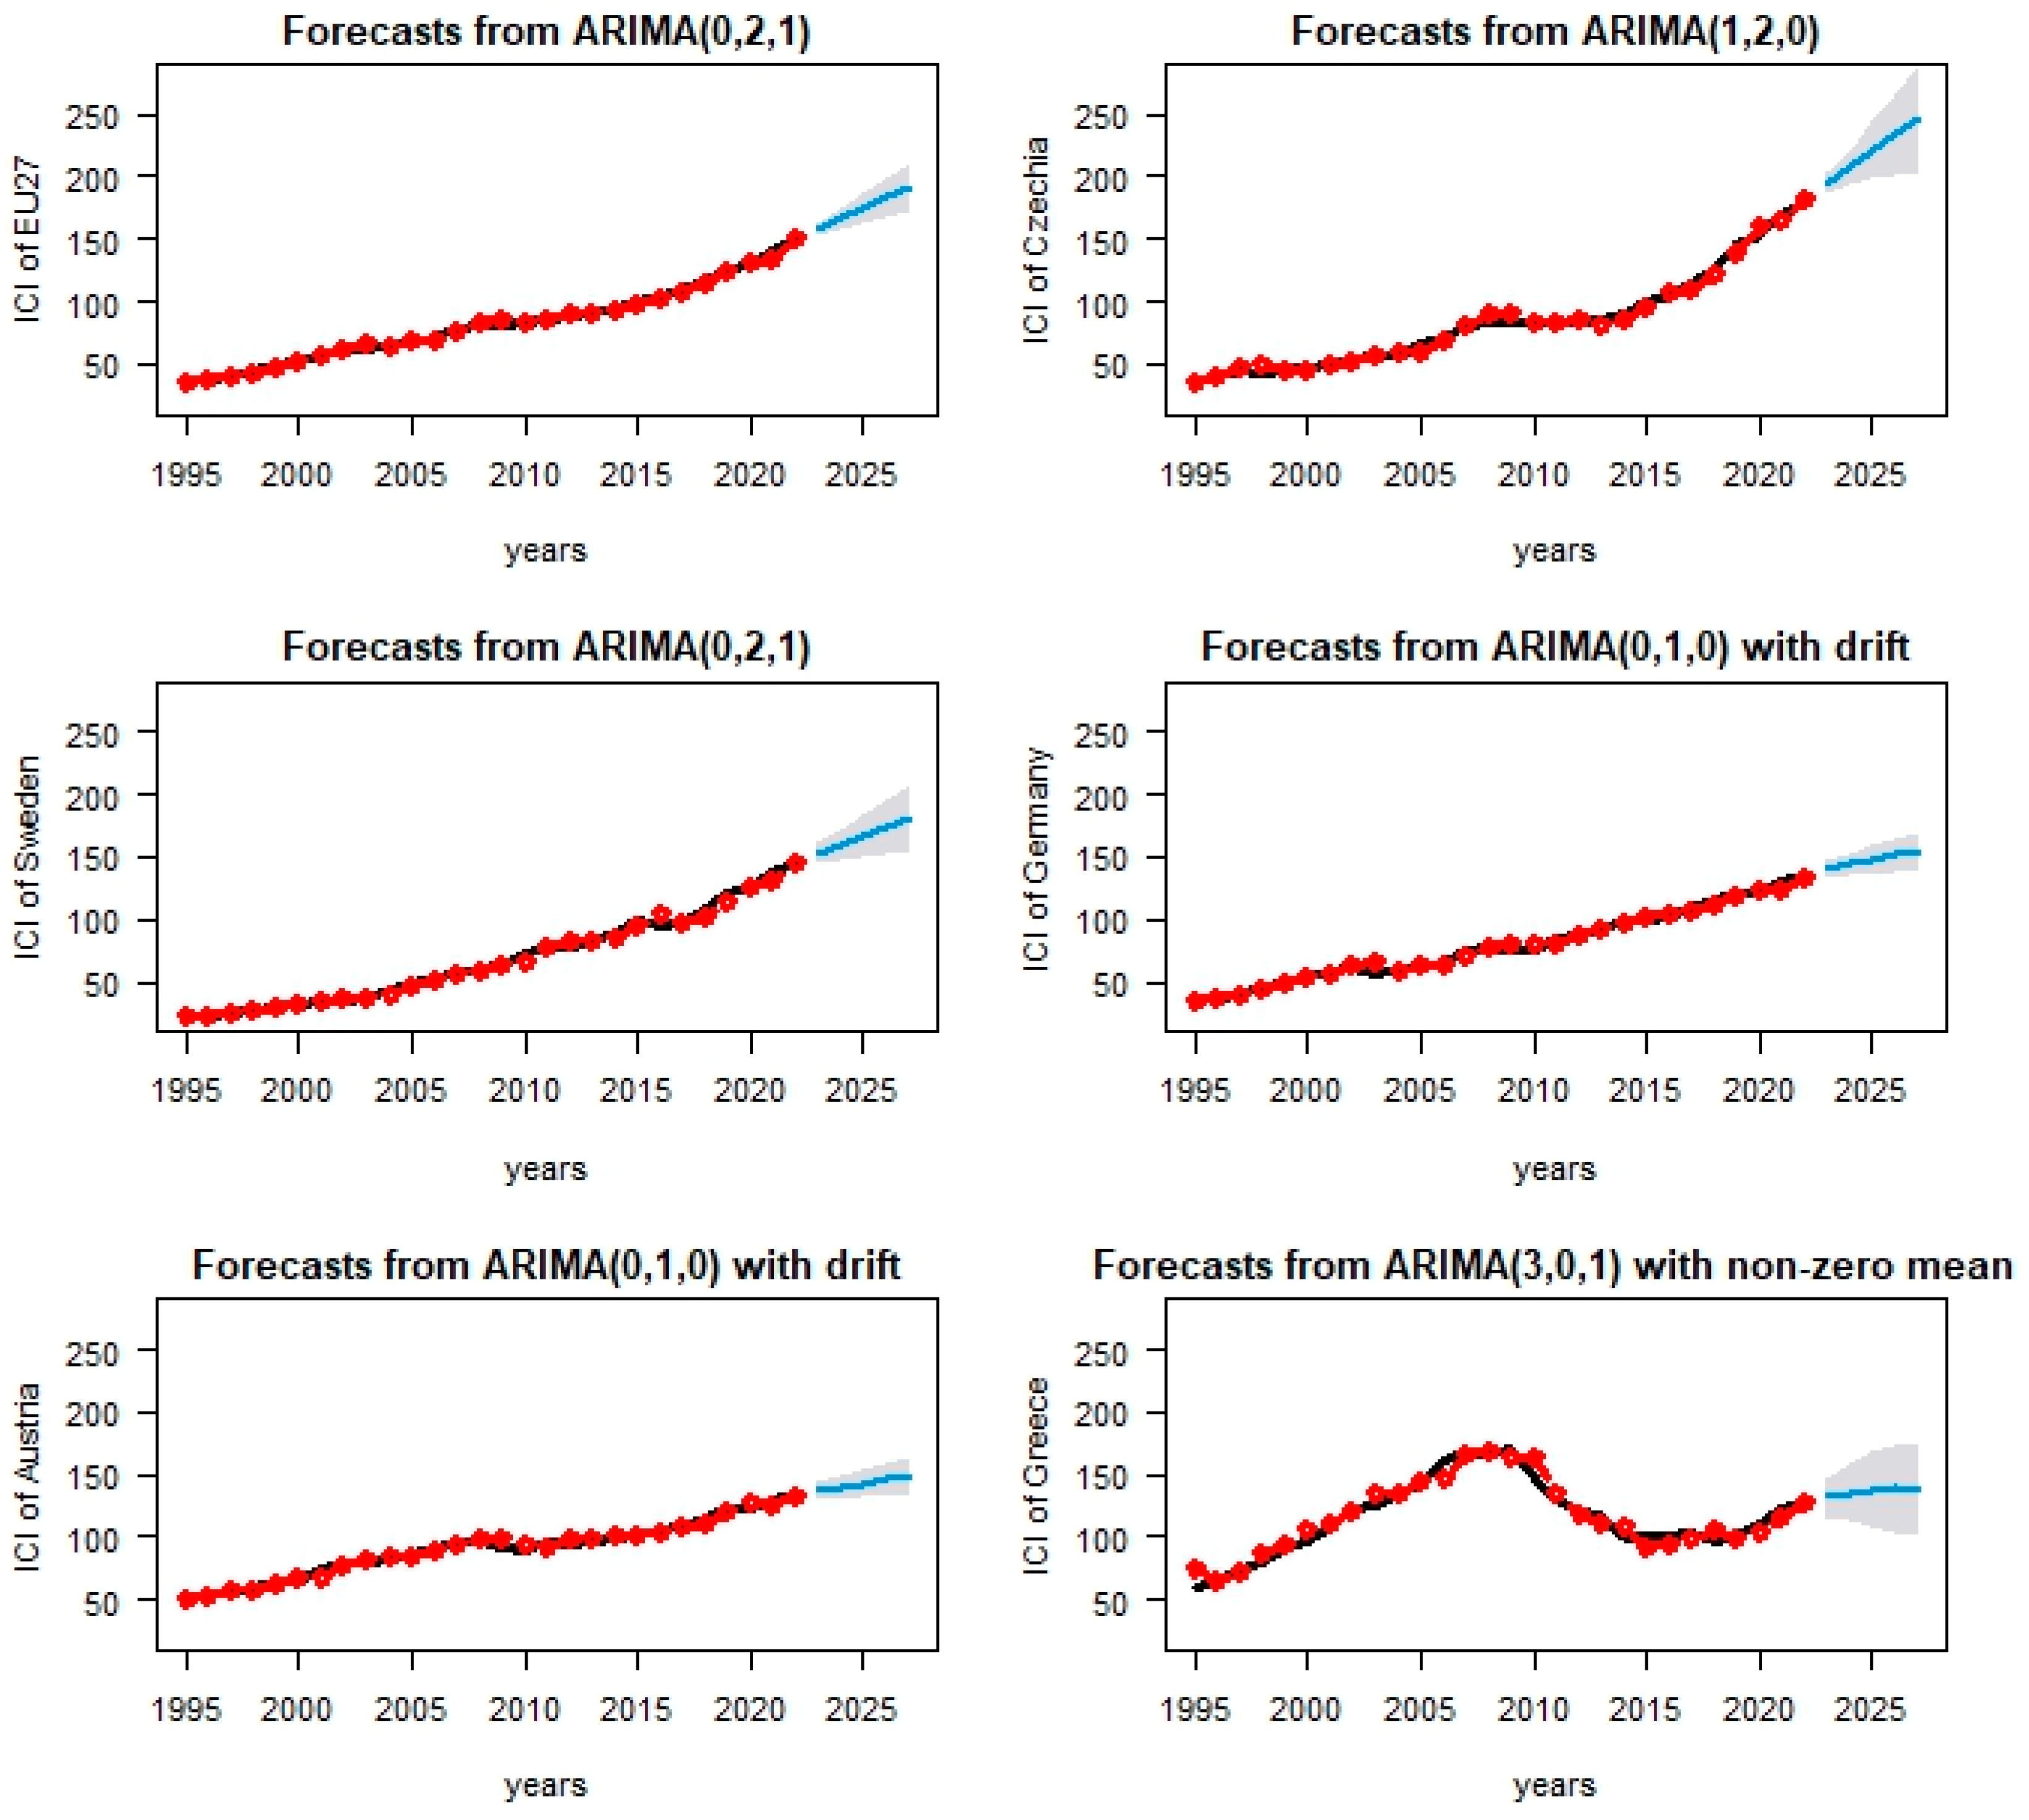
Figure 4 reflects the evolution of the ICI over the examined period for all the entities. The unit of measure is chain-linked volumes and 2015 is considered the base year as its value is 100 in every case. The gray lines show the raw data while the red circles indicate the fitted data. Furthermore, the outlined gray areas in each figure reflect the forecasts of the variable under examination from 2023 to 2027. The forecast R package (Hyndman et al. 2024) was employed to fit the predictive ARIMA models and forecast the ICI values of the entities for the next five years with a 95% confidence level.
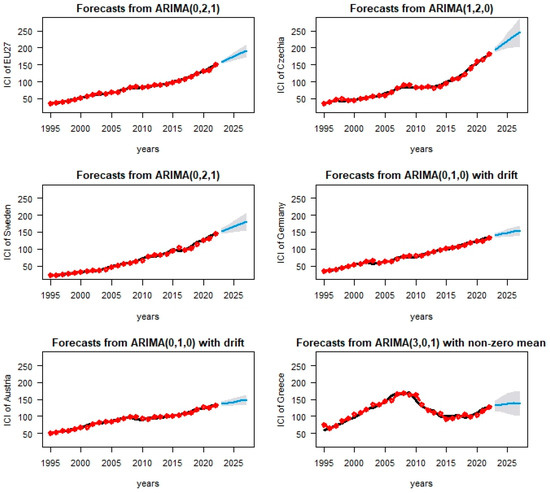
Figure 4.
ARIMA fitted models and forecast of the ICI index for the 27 members of the E.U. (θ1 = −0.6279), Czechia (φ1 = −0.5167), Sweden (θ1 = −0.8226), Germany (c = 3.7811), Austria (c = 3.0755) and Greece (φ1 = 1.8759, φ2 = −0.9508, φ3 = −0.0038, θ1 = 0.7607 and c = 9.4255).
The general upward trend in five out of six cases is indicated in the figures above except for Greece. More specifically, regarding the cases of Sweden and the average of the 27 members of the European Union, there is a clear increase in the ICI value over time. Furthermore, the average predictions of these two entities for 2023 are above 150 while the average predictions for 2027 exceed the values of 180 and 190, respectively. Austria and Germany show a stable increase during the period under examination which is lower than the average of the E.U. Czechia’s ICI shows the steepest trend among the entities. Finally, the evolution of the variable under examination fluctuates and shows great volatility in the case of Greece. It should be noted that Greece is the 25th out of the 27 member countries in the DESI 2022 index. Moreover, the country faced a serious financial crisis from 2010 to 2017, which explains the sharp decrease in the ICI during this period. Finally, a significant increase is indicated from 2020 onwards, although the value of the variable precrisis is still difficult to reach.
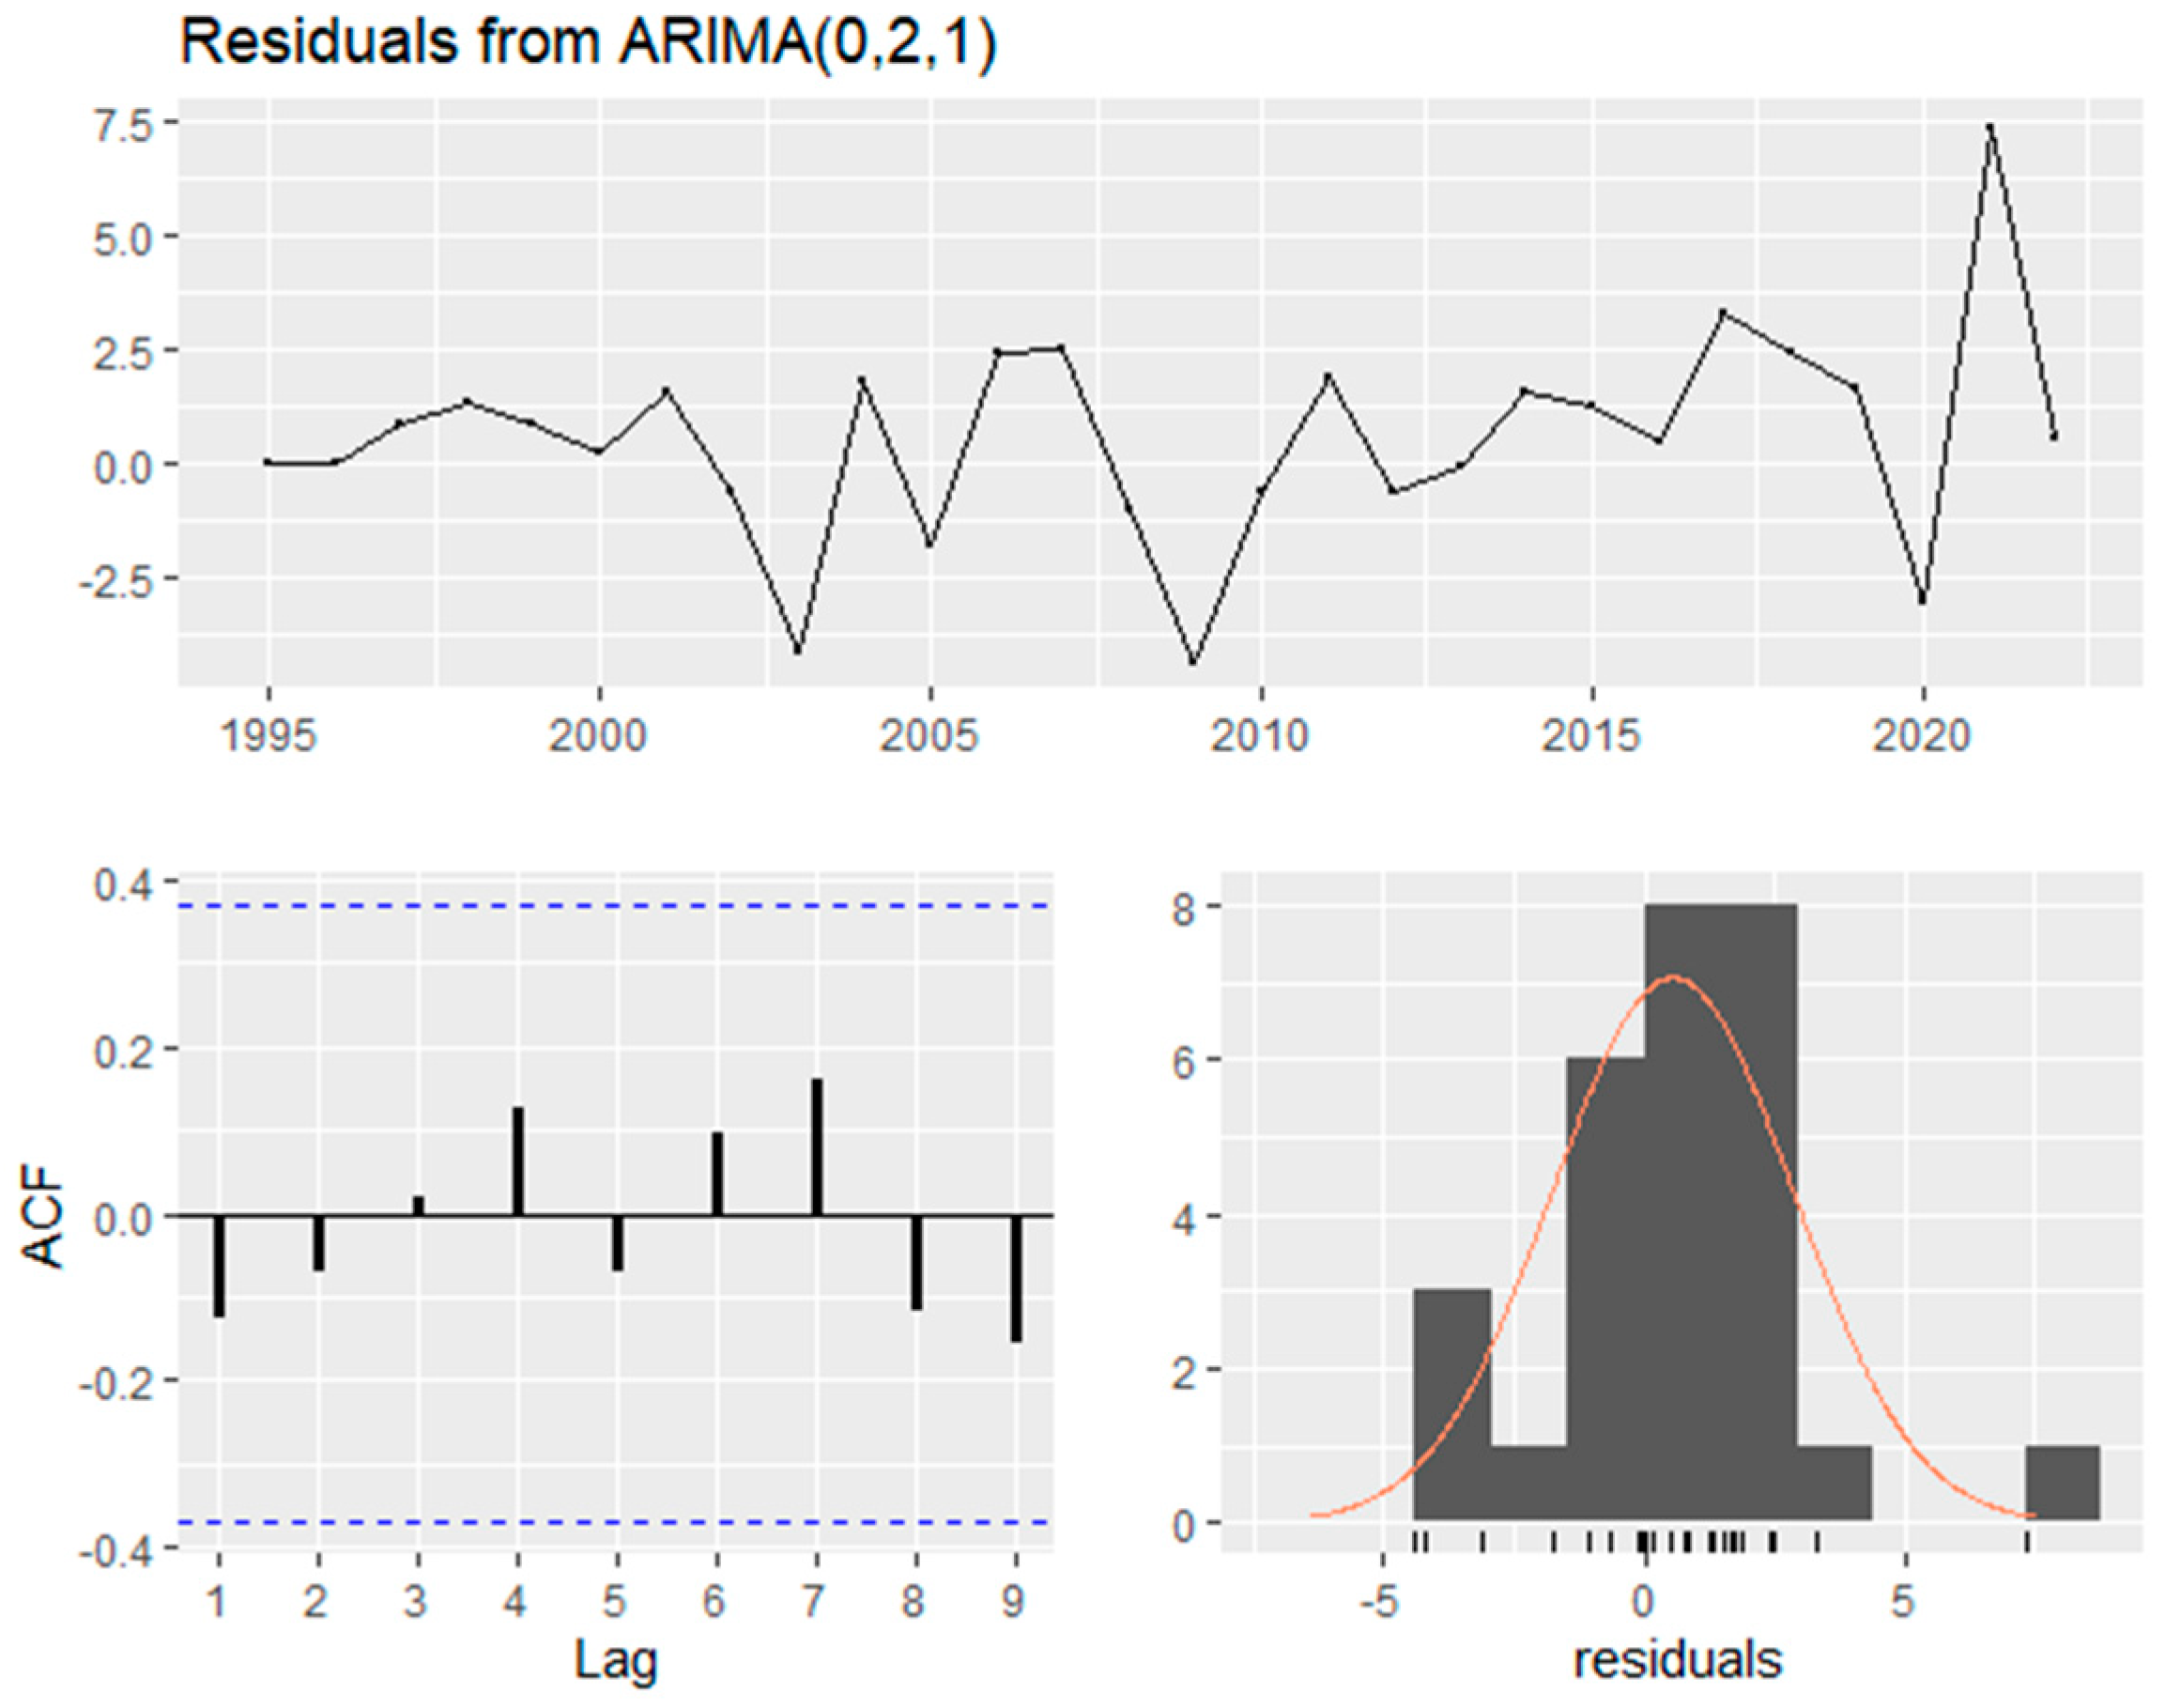
At this point, it should be mentioned that chain-linked volumes are used as a unit of measure control for inflation as they show the ICI deflating and use 2015 as the base year. The quality of the fitted models will be verified by residual analysis. The employed forecasting models indicate a proper fit to data as there is no autocorrelation of the residuals according to the Ljung–Box test (Ljung and Box 1978; Hassani and Yeganegi 2020). The p-values for all the entities are above 5%, with a lag of five time periods. This means that the deviation from the null hypothesis that the residuals are independently distributed is not statistically significant. Consequently, the null hypothesis is not rejected. More precisely, the p-values of the average of the 27 members of the E.U., Czechia, Sweden, Germany, Austria and Greece are 0.922, 0.8691, 0.1206, 0.8189, 0.7772, and 0.9886, respectively.
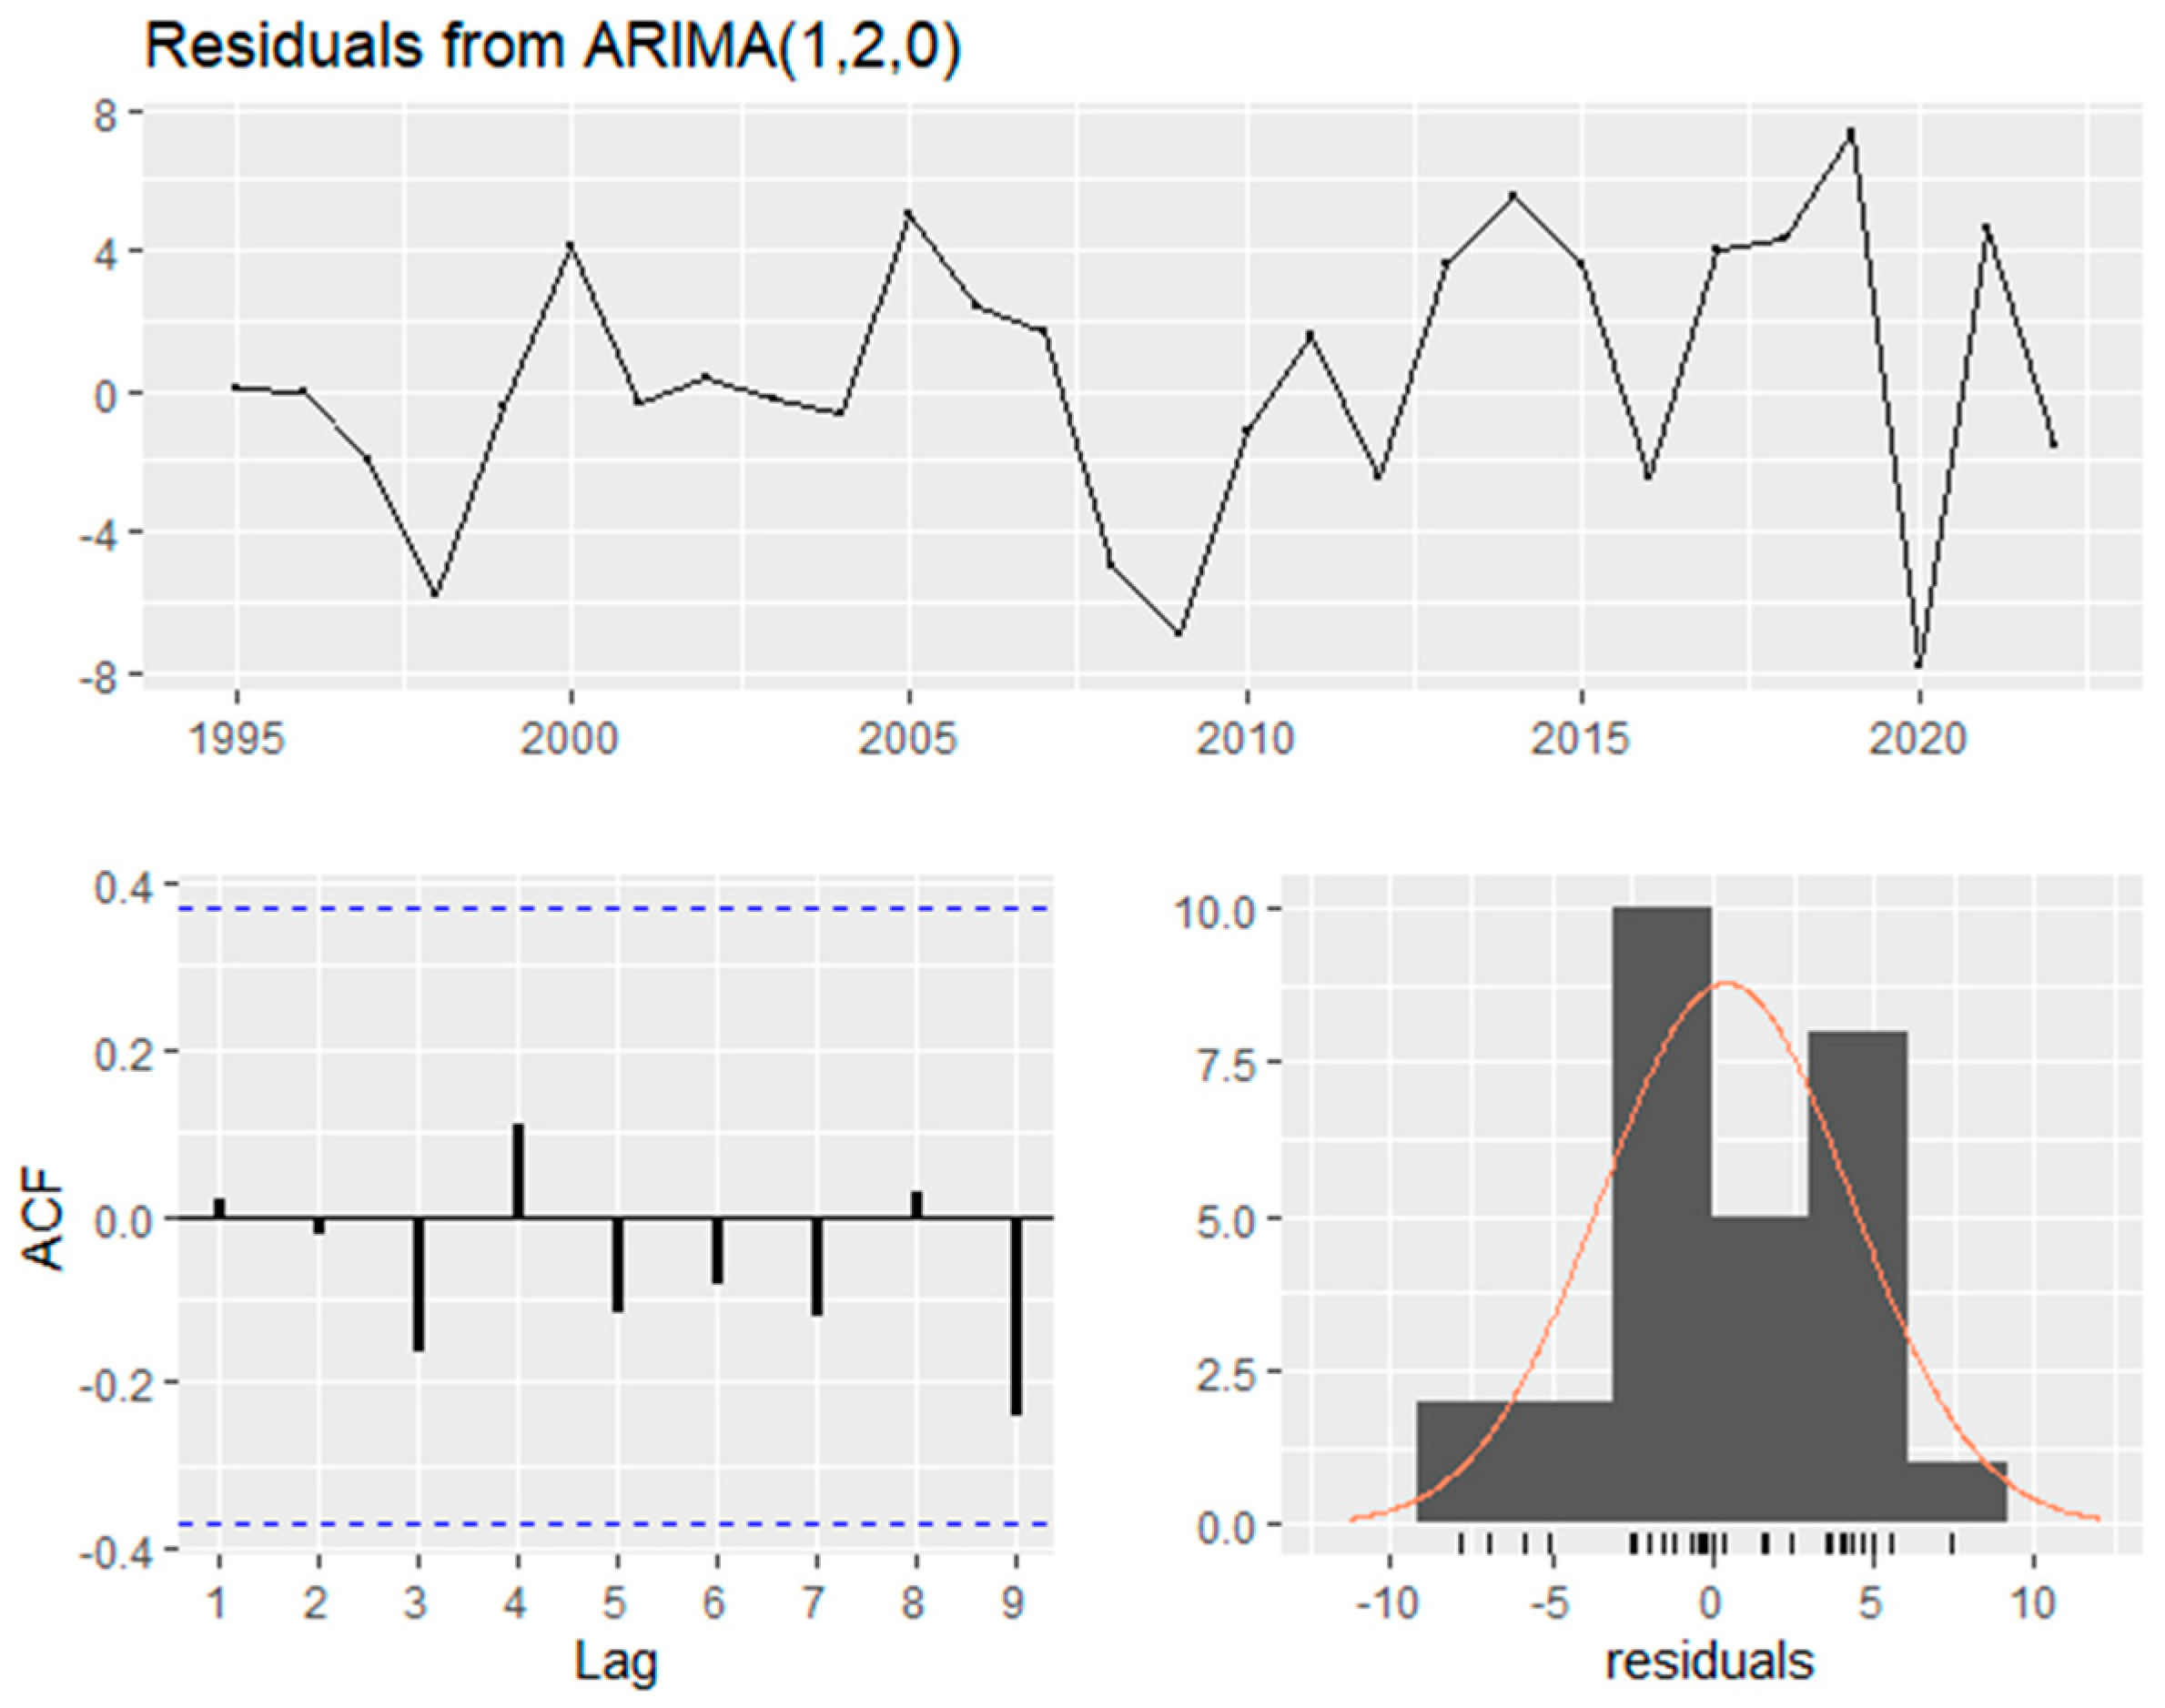
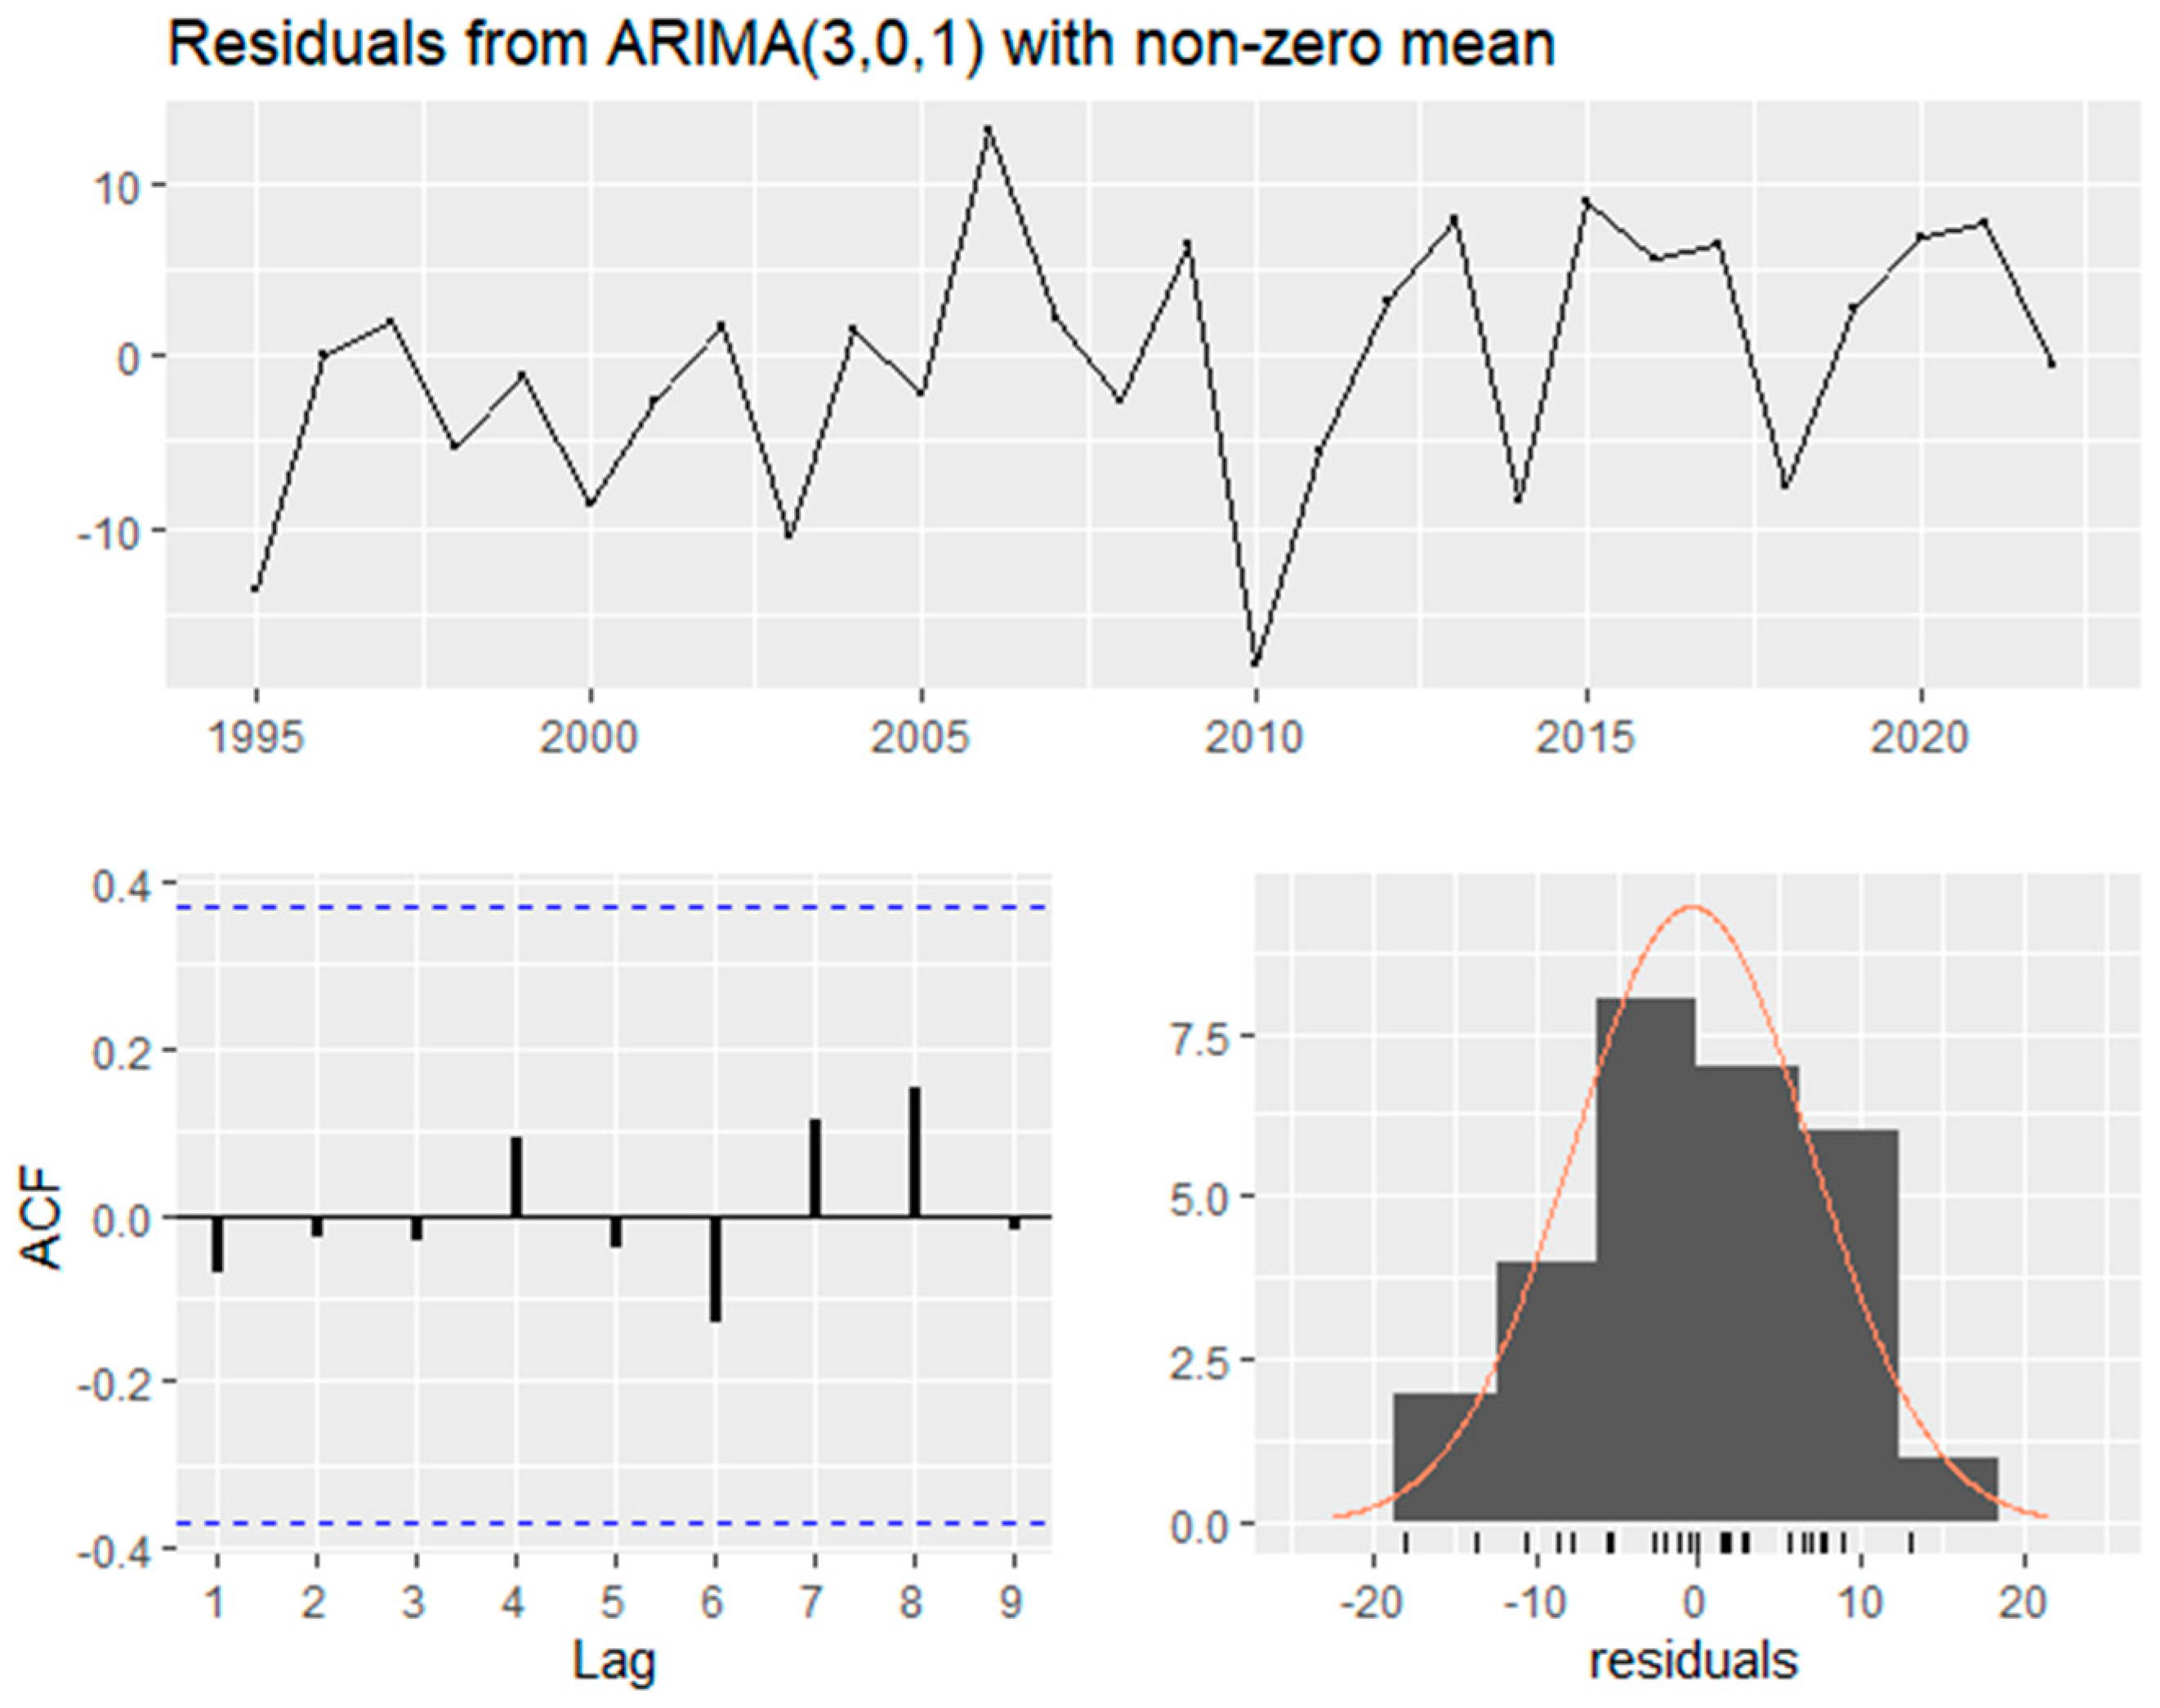
Additionally, the time series plot of the residuals, their ACF correlogram and the histogram of the residuals for the average of 27 members of the E.U. (with an MA component), Czechia (with an AR component), and Greece (with AR and MA components) are presented in Figure 5, Figure 6 and Figure 7, respectively. In all cases, there is no evidence of autocorrelation, and the residuals do not have a significant deviation from mean zero and constant variance, implying the appropriateness of the fitted models.
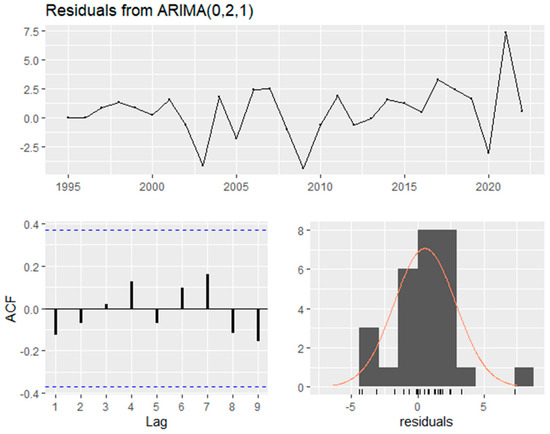
Figure 5.
Time series plot, correlogram and the histogram of the residuals of the fitted model for the 27 members of the E.U.
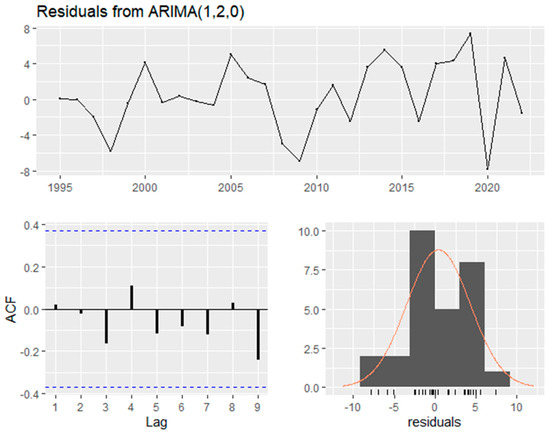
Figure 6.
Time series plot, correlogram and histogram of the residuals of the fitted model for Czechia.
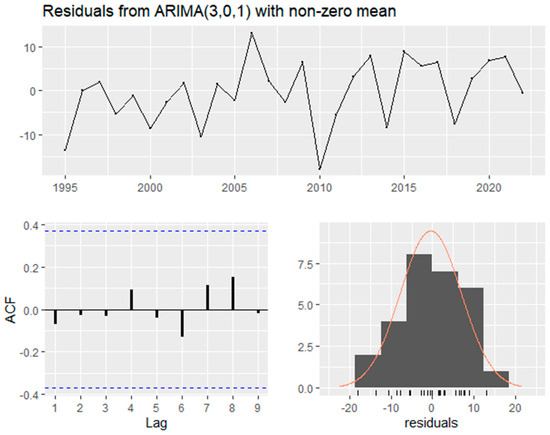
Figure 7.
Time series plot, correlogram and histogram of the residuals of the fitted model for Greece.
The forecasts of the ICI of each entity resulting from the forecast package (Hyndman et al. 2024) are quoted in Table 2. The lowest, average and highest predictions are estimated with a 95% confidence level.
Table 2.
ICI forecasts for all entities.
Once again, there seems to be a clear stable increase in the forecasts of the ICI over the years for most of the entities. Regarding Germany and Austria, the averages of the forecasts fluctuate from approximately 140 in 2023 to 150 in 2027. Moreover, there are cases like Sweden and the average of the 27 members of the E.U., in which the forecasts from 2023 to 2027 exceed the value of 150, which suggests that the contribution of the ICI to the GDP is more than 50% greater than its value in the base year of 2015 in both entities. There are even cases like the average of the E.U. members in 2027 and Czechia from 2024 to 2027 in which the forecasts approach or even exceed the value of 200. This suggests that the contribution of the variable under examination to the GDP is approximately 2-fold higher than that of the base year 2015. It should be noted that, especially in the case of Czechia, the forecasts of the ICI show the greatest increase among the entities as their value reach approximately 247 on average in 2027. Regarding Greece, the fluctuations and the great volatility of the ICI during the period under examination due to the financial crisis alongside the country’s low score in the DESI 2022 index have affected the forecasts of the entity. The averages of the predictions of this entity fluctuate from 132 in 2023 to 137 in 2027. Consequently, the increase in the ICI in Greece is much smoother than that of the other entities and, during the last three years of the forecasts, there seems to be stability in the value of the variable. Moreover, great volatility is also confirmed by the large width of the forecasts’ gray area in Figure 7. This great volatility implies a high forecasting risk regarding the Greek digital economy, which seems to be extremely unsure and may have consequences in the growth in the whole Greek economy.
5. Discussion and Conclusions
Over the last four decades, the wide use of computers, the internet and telecommunications has formed a new economic phenomenon, the “Digital Economy”. Although our society is based on information technology, there is a lack of investigation regarding the contribution of digitalization to official economic indicators. The main reason for this absence is because digital products and services are non-measurable and, consequently, classical economic indicators, like the GDP, are unable to incorporate the benefits of digitalization. However, it is commonly accepted that nowadays the growth in the real economy is highly correlated with the development of the digital economy, which is based on the information industry and the internet. As a matter of facts, the purpose of this research is to examine the evolution of the ICI over time and forecast its development and contribution to the GDP in the future. More specifically, this paper examines the development of the ICI in five European countries and in the average of the 27 members of the European Union. This study makes significant contributions to the academic understanding of the digital economy’s impact on traditional economic indicators. By focusing on the information and communication industry (ICI) index across multiple European countries, this research highlights the need to incorporate broader measures of digitalization into economic analysis. The findings show the limitations of conventional metrics, such as the GDP, in capturing the full extent of digital economy contributions. This opens up new opportunities for research in economic measurement and policy development. Unlike recent studies in the context of the European Union (Magoutas et al. 2024), this research introduces a methodological advancement by incorporating the forecasting of future developments, enhancing the study of economic evolution. Most studies to date (Global System for Mobile Association 2022; Bulturbayevich and Jurayevich 2020; Nakamura et al. 2017) employ only one aspect of digitalization like Google, Facebook or the mobile sector. The use of the ICI as a key metric provides a more comprehensive view of how digital activities contribute to national economies. This broader focus of the research offers a more holistic understanding of the digital economy’s role in national economic performance. Moreover, this study emphasizes European countries. Most papers study the U.S.A. (Barefoot et al. 2018; Nakamura et al. 2017) and China (Ding et al. 2022; Pang et al. 2022; Zhang et al. 2021). Thus, this paper brings valuable insights into the development of the digital economy within the European Union. This geographical focus expands the scope of digital economy research, providing a basis for comparative studies across different regions.
The results of this study support that there is a clear increase in the ICI value in five out of six entities, especially from 2010 onwards. The only country in which the variable under examination fluctuates and shows great volatility is Greece, which faced a serious financial crisis over the examination period. This fact affected the development of the country’s ICI. Furthermore, the position that each entity possesses in the DESI 2022 index seems to affect the evolution of the ICI.
This is the same for the forecasts in this paper. The predictions show a clear stable increase from 2023 to 2027. In some cases, the values of the chain-linked volumes exceed the price of 200, which is 2-fold higher than that of the base year 2015 and even reaches approximately 247 on average in the case of Czechia in 2027, which shows the greatest trend. This fact indicates the increasingly greater contribution of the ICI to the national GDP. Moreover, these results are aligned with the previous studies that support the idea that different aspects of digitalization contribute to the development of the national economy (Ding et al. 2022; Pang et al. 2022; Bukht and Heeks 2017; Bulturbayevich and Jurayevich 2020; Barefoot et al. 2018; Nakamura et al. 2017; Barata 2019) and justify those which use the digital economy as one of their main development strategies (Ding et al. 2022; Tian and Liu 2021). Once again, due to the financial crisis that the country faced alongside its low score in the DESI 2022 index, Greece’s forecasts show a smoother increase and great volatility in their predictions. Further, from 2025 to 2027, there is stability in the ICI value.
The forecasts indicate a stable and increasing contribution of the ICI to the national GDP in most examined countries. This trend suggests that further investment in digital infrastructure and services can drive economic growth. Governments should prioritize the development of the digital sectors to enhance economic resilience and growth. As a matter of fact, this paper could be used by the stakeholders of the employed methodology and the ICI as guides for forecasting the future development of the digital economy. The forecasts are generally reliable across the studied entities, with the exception of Greece, which shows a high provisional risk. Consequently, the development of the Greek digital economy is extremely uncertain, which may affect the growth in the Greek economy as a whole. Thus, targeted efforts are needed in Greece to stabilize and promote digital development and mitigate potential risks.
Extending this study to more variables that measure the digital economy and examination of the effects of digitalization to other aspects of the national economy, like employment, productivity and household disposable income, would be of great interest for future examination. Finally, the case of Greece may be examined extensively in future research.
Author Contributions
Conceptualization, I.K. and V.V.; methodology, I.K.; software, G.K.; validation, I.K. and V.V.; formal analysis, I.K.; investigation, I.K.; resources, I.K.; data curation, I.K. and G.K.; writing—original draft preparation, I.K.; writing—review and editing, I.K. and V.V.; visualization, I.K.; supervision, V.V. and G.K.; project administration, I.K.; funding acquisition, I.K., V.V. and G.K. All authors have read and agreed to the published version of the manuscript.
Funding
This research received no external funding.
Data Availability Statement
Data are available on the website of Eurostat https://ec.europa.eu/eurostat/databrowser/view/nama_10_a64__custom_10881223/default/table?lang=en (accessed on 12 August 2024).
Conflicts of Interest
The authors declare no conflicts of interest. The funders had no role in the design of the study; in the collection, analyses, or interpretation of data; in the writing of the manuscript; or in the decision to publish the results.
References
- Aptekman, Alexander, Вадим Kalabin, Виталий Klintsov, Елена Kuznetsova, Владимир Kulagin, and Игoрь Yasenovets. 2017. Digital Russia: A new reality. Tsifrovaya Rossiya: Novaya Realnost. [Google Scholar]
- Asen, Rob, and Burkhard Blechschmidt. 2016. Making Digital Real and Rewarding. Cognizanti 9: 2–13. [Google Scholar]
- Bahl, Manish. 2016. The Work Ahead: The Future of Businesses and Jobs in Asia Pacific’s Digital Economy. Cognizant. Available online: https://thoughtlabgroup.com/wp-content/uploads/2019/04/the-work-ahead-the-future-of-business-and-jobs-in-asia-pacifics-digital-economy-codex2255.pdf (accessed on 1 June 2024).
- Barata, Amrin. 2019. Strengthening national economic growth and equitable income through sharia digital economy in Indonesia. Journal of Islamic Monetary Economics and Finance 5: 145–68. [Google Scholar] [CrossRef]
- Barefoot, Kevin, Dave Curtis, William Jolliff, Jessica R. Nicholson, and Robert Omohundro. 2018. Defining and Measuring the Digital Economy; Washington, DC: US Department of Commerce Bureau of Economic Analysis, vol. 15, p. 210.
- Bressanelli, Gianmarco, Federico Adrodegari, Marco Perona, and Nicola Saccani. 2018. Exploring how usage-focused business models enable circular economy through digital technologies. Sustainability 10: 639. [Google Scholar] [CrossRef]
- Brynjolfsson, Erik, and Avinash Collis. 2019. How Should We Measure the Digital Economy. Harvard Business Review 97: 140–48. [Google Scholar]
- Bukht, Rumana, and Richard Heeks. 2017. Defining, Conceptualizing and Measuring the Digital Economy. Development Informatics Working Paper 68. Manchester: University of Manchester. [Google Scholar]
- Bulturbayevich, Mullabayev Baxtiyarjon, and Mahmudov Baxriddin Jurayevich. 2020. The impact of the digital economy on economic growth. International Journal of Business, Law, and Education 1: 4–7. [Google Scholar] [CrossRef]
- Carlsson, Bo. 2004. The Digital Economy: What is the new and what is not? Structural Change and Economic Dynamics 15: 246–64. [Google Scholar] [CrossRef]
- Chatfield, Chris. 2003. Time Series Analysis: An Introduction, 6th ed. New York: Chapman and Hall/CRC. [Google Scholar]
- Chatfield, Chris, and Haipeng Xing. 2019. The Analysis of Time Series: An Introduction with R. London: Chapman and Hall/CRC. [Google Scholar]
- Dickey, David A., and Wayne A. Fuller. 1979. Distribution of the estimators for autoregressive time series with a unit root. Journal of the American Statistical Association 74: 427–31. [Google Scholar]
- Ding, Chenhui, Chao Liu, Chuiyong Zheng, and Feng Li. 2022. Digital economy, technological innovation and high-quality economic development: Based on spatial effect and mediation effect. Sustainability 14: 216. [Google Scholar] [CrossRef]
- Dong, Feng, Mengyue Hu, Yujin Gao, Yajie Liu, Jiao Zhu, and Yuling Pan. 2022. How does digital economy affect carbon emissions? Evidence from global 60 countries. Science of The Total Environment 852: 158401. [Google Scholar] [CrossRef]
- European Commission. 2024. The Digital Economy and Society Index (DESI). Available online: https://digital-strategy.ec.europa.eu/en/policies/desi (accessed on 20 May 2024).
- Eurostat. 2024. National Accounts Aggregates by Industry (Up to NACE A*64). Available online: https://ec.europa.eu/eurostat/databrowser/view/nama_10_a64__custom_12554570/default/table?lang=en (accessed on 16 August 2024).
- Fernández-Portillo, Antonio, Manuel Almodóvar-González, and Ricardo Hernández-Mogollón. 2020. Impact of ICT development on economic growth. A study of OECD European union countries. Technology in Society 63: 101420. [Google Scholar] [CrossRef]
- Garner, Damon Eric. 2002. The Effects of Electronic Commerce on the Economy. Baltimore: Morgan State University. [Google Scholar]
- Global System for Mobile Association. 2022. The Mobile Economy 2022. Available online: https://www.gsma.com/mobileeconomy/wp-content/uploads/2022/02/280222-The-Mobile-Economy-2022.pdf (accessed on 20 May 2024).
- Grigorescu, Adriana, Elena Pelinescu, Amalia Elena Ion, and Monica Florica Dutcas. 2021. Human capital in digital economy: An empirical analysis of central and eastern European countries from the European Union. Sustainability 13: 2020. [Google Scholar] [CrossRef]
- Guryanova, A. V., T. V. Korotaeva, and G. A. Chedzhemov. 2019. Digital economy as a social phenomenon: Ethical challenges and perspectives of development. European Proceedings of Social and Behavioural Sciences. [Google Scholar] [CrossRef]
- Haftu, Girmay Giday. 2019. Information communications technology and economic growth in Sub-Saharan Africa: A panel data approach. Telecommunications Policy 43: 88–99. [Google Scholar] [CrossRef]
- Hassani, Hossein, and Mohammad Reza Yeganegi. 2020. Electing optimal lag order in Ljung–Box test. Physica A: Statistical Mechanics and Its Applications 541: 123700. [Google Scholar] [CrossRef]
- Hyndman, Rob, George Athanasopoulos, Christoph Bergmeir, Gabriel Caceres, Leanne Chhay, Mitchell O’Hara-Wild, Fotios Petropoulos, Slava Razbash, Earo Wang, and Farah Yasmeen. 2024. Forecast: Forecasting Functions for Time Series and Linear Models. R Package Version 8.23.0. Available online: https://pkg.robjhyndman.com/forecast/ (accessed on 16 August 2024).
- Hyndman, Rob J., and Yeasmin Khandakar. 2008. Automatic time series forecasting: The forecast package for R. Journal of Statistical Software 27: 1–22. [Google Scholar] [CrossRef]
- Kenney, Martin, and John Zysman. 2016. The rise of the platform economy. Issues in Science and Technology 32: 61. [Google Scholar]
- Kim, Taeha. 2022. Economics of Patent Policy in the Digital Economy. Tucson: The University of Arizona. [Google Scholar]
- Kristoffersen, Eivind, Fenna Blomsma, Patrick Mikalef, and Jingyue Li. 2020. The smart circular economy: A digital-enabled circular strategies framework for manufacturing companies. Journal of Business Research 120: 241–61. [Google Scholar] [CrossRef]
- Lane, Neal. 1999. Advancing the digital economy into the 21st century. Information Systems Frontiers 1: 317–20. [Google Scholar] [CrossRef]
- Limna, Pongsakorn, Tanpat Kraiwanit, and Supaprawat Siripipatthanakul. 2022. The growing trend of digital economy: A review article. International Journal of Computing Sciences Research 6: 1–11. [Google Scholar] [CrossRef]
- Ljung, Greta M., and George E. P. Box. 1978. On a measure of lack of fit in time series models. Biometrika 65: 297–303. [Google Scholar] [CrossRef]
- Maglio, Paul P., and Jim Spohrer. 2008. Fundamentals of service science. Journal of the Academy of Marketing Science 36: 18–20. [Google Scholar] [CrossRef]
- Magoutas, Anastasios I., Maria Chaideftou, Dimitra Skandali, and Panos T. Chountalas. 2024. Digital Progression and Economic Growth: Analyzing the Impact of ICT Advancements on the GDP of European Union Countries. Economies 12: 63. [Google Scholar] [CrossRef]
- Manyika, James, and Charles Roxburgh. 2011. The Great Transformer: The Impact of the Internet on Economic Growth and Prosperity. New York: McKinsey Global Institute. [Google Scholar]
- Meisenberg, Gerhard. 2014. Cognitive human capital and economic growth in the 21st century. In Economic Growth in the 21st Century: New Research. Edited by Tara Abrahams. New York: Nova Publishers, pp. 49–106. [Google Scholar]
- Milskaya, Elena, and Olga Seeleva. 2019. Main directions of development of infrastructure in digital economy. IOP Conference Series: Materials Science and Engineering 497: 012081. [Google Scholar] [CrossRef]
- Nakamura, Leonard I., Jon Samuels, and Rachel H. Soloveichik. 2017. Measuring the ‘Free’ Digital Economy within the GDP and Productivity Accounts. Research Department, FRB of Philadelphia Working Paper No. 17–37. Philadelphia: FRB of Philadelphia. [Google Scholar]
- Oloyede, Abdulkarim A., Nasir Faruk, Nasir Noma, Ebinimi Tebepah, and Augustine K. Nwaulune. 2023. Measuring the impact of the digital economy in developing countries: A systematic review and meta-analysis. Heliyon 9: e17654. [Google Scholar] [CrossRef] [PubMed]
- Pang, Jianing, Fangyi Jiao, and Yimeng Zhang. 2022. An analysis of the impact of the digital economy on high-quality economic development in China—A study based on the effects of supply and demand. Sustainability 14: 16991. [Google Scholar] [CrossRef]
- Pouri, Maria J., and Lorenz M. Hilty. 2021. The digital sharing economy: A confluence of technical and social sharing. Environmental Innovation and Societal Transitions 38: 127–39. [Google Scholar] [CrossRef]
- Qian, LLihua, Qi Fang, and Zhu Lu. 2020. Research on the synergy of green economy and digital economy in stimulus policies. Southwest Finance 413: 3–13. [Google Scholar]
- R Core Team. 2024. R: A Language and Environment for Statistical Computing; Vienna: R Foundation for Statistical Computing. Available online: https://www.R-project.org/ (accessed on 16 August 2024).
- Reinert, Eric. 2018. How Rich Wealth Enriched… and Why Poor Countries Remain Poor. London: Hachette UK. [Google Scholar]
- Sawng, Yeong-wha, Pang-ryong Kim, and JiYoung Park. 2021. ICT investment and GDP growth: Causality analysis for the case of Korea. Telecommunications Policy 45: 102157. [Google Scholar] [CrossRef]
- Select USA. 2024. Software and Information Technology Industry Overview. Available online: https://www.trade.gov/selectusa-software-and-information-technology-industry (accessed on 1 June 2024).
- Sidorov, Anatoly, and Pavel Senchenko. 2020. Regional digital economy: Assessment of development levels. Mathematics 8: 2143. [Google Scholar] [CrossRef]
- Smart1marketing. 2024. Average Time Spent per Day with Digital Media in the United States from 2011 to 2024. Available online: https://smart1marketing.com/blog/average-time-spent-per-day-with-digital-media-in-the-united-states-from-2011-to-2024 (accessed on 3 June 2024).
- Statista. 2024. Percentage of Population Using the Internet in the United States from 2000 to 2024. Available online: https://www.statista.com/statistics/209117/us-internet-penetration/ (accessed on 21 May 2024).
- Škare, Marinko, and Domingo Riberio Soriano. 2021. A dynamic panel study on digitalization and firm’s agility: What drives agility in advanced economies 2009–2018. Technological Forecasting and Social Change 163: 120418. [Google Scholar] [CrossRef]
- Tapscott, Don. 1996. The Digital Economy: Promise and Peril in the Age of Networked Intelligence. New York: McGraw-Hill. [Google Scholar]
- Tayibnapis, Ahmad Zafrullah, Lucia Endang Wuryaningsih, and Radita Gora. 2018. The development of digital economy in Indonesia. International Journal of Management and Business Studies 8: 14–18. [Google Scholar]
- Tian, Jinfang, and Yiran Liu. 2021. Research on total factor productivity measurement and influencing factors of digital economy enterprises. Procedia Computer Science 187: 390–95. [Google Scholar] [CrossRef]
- TT Consultants. 2024. The State of the U.S. Innovation: USPTO Patent Statistics Report 2023. Available online: https://ttconsultants.com/the-state-of-u-s-innovation-uspto-patent-statistics-report-2023/ (accessed on 17 June 2024).
- Turban, Efraim, David King, Jae Lee, Merrill Warkentin, and H. Michael Chung. 2002. Electronic Commerce 2002: A Managerial Perspective. Hoboken: Prentice Hall. [Google Scholar]
- United States Census Bureau. 2024. Quarterly Retail E-Commerce Sales. Available online: https://www.census.gov/retail/ecommerce.html (accessed on 30 May 2024).
- Unold, Jacek. 2003. Basic Aspects of the Digital Economy. Folia Oeconomica 167: 41–49. [Google Scholar]
- Voronkova, Valentyna H., Vitalina A. Nikitenko, Tatyana V. Teslenko, and Vlada E. Bilohur. 2020. Impact of the worldwide trends on the development of the digital economy. Amazonia Investiga 9: 81–90. [Google Scholar] [CrossRef]
- Wang, Yuchan. 2022. Development of the digital economy: A case study of 5G technology. In Digital Transformation in Industry: Digital Twins and New Business Models. Cham: Springer International Publishing, pp. 215–25. [Google Scholar] [CrossRef]
- Wen, Ma Cheng, and Song Lin Wang. 2024. Research on Digital Economy and High Qualiy Development of Regional Economy. Value, Function, Cost 4: 2614. [Google Scholar] [CrossRef]
- Williams, Luyanda Dube. 2021. Concepts of Digital Economy and Industry 4.0 in Intelligent and information systems. International Journal of Intelligent Networs 2: 122–29. [Google Scholar] [CrossRef]
- Wu, Ying, Yanpeng Wu, Josep M. Guerrero, and Juan C. Vasquez. 2021. Digitalization and decentralization driving transactive energy Internet: Key technologies and infrastructures. International Journal of Electrical Power and Energy Systems 126: 106593. [Google Scholar] [CrossRef]
- Xia, Lei, Sh Baghaie, and Mohammad Sajadi. 2024. The digital economy: Challenges and opportunities in the new era of technology and electronic communications. Ain Shams Engineering Journal 15: 102411. [Google Scholar] [CrossRef]
- Xue, Yan, Chang Tang, Haitao Wu, Jianmin Liu, and Yu Hao. 2022. The emerging driving force of energy consumption in China: Does digital economy development matter? Energy Policy 165: 112997. [Google Scholar] [CrossRef]
- Zhang, Lu, Renyan Mu, Yuanfang Zhan, Jiahong Yu, Liyi Liu, Yongsheng Yu, and Jixin Zhang. 2022. Digital economy, energy efficiency, and carbon emissions: Evidence from provincial panel data in China. Science of the Total Environment 852: 158403. [Google Scholar] [CrossRef] [PubMed]
- Zhang, Wei, Siqi Zhao, Xiaoyu Wuan, and Yuan Yao. 2021. Study on the effect of digital economy on high-quality economic development in China. PLoS ONE 16: 112997. [Google Scholar] [CrossRef] [PubMed]
Disclaimer/Publisher’s Note: The statements, opinions and data contained in all publications are solely those of the individual author(s) and contributor(s) and not of MDPI and/or the editor(s). MDPI and/or the editor(s) disclaim responsibility for any injury to people or property resulting from any ideas, methods, instructions or products referred to in the content. |
© 2024 by the authors. Licensee MDPI, Basel, Switzerland. This article is an open access article distributed under the terms and conditions of the Creative Commons Attribution (CC BY) license (https://creativecommons.org/licenses/by/4.0/).