Abstract
This study investigates the role of the Big Three passive investors (BlackRock, Vanguard, and State Street) in influencing firms’ cost of equity. By examining the unique ownership structure these investors bring, the research sheds light on a pivotal yet underexplored aspect of institutional ownership and its implications for corporate financing. Using a comprehensive dataset spanning from 1997 to 2016, this study demonstrates that increased ownership by the Big Three is associated with improved disclosure practices and reduced information asymmetry, leading to a lower cost of equity. However, the study also uncovers a nuanced trade-off, as concentrated ownership may introduce liquidity risks in certain contexts. These findings bridge a critical gap in the literature by reconciling divergent perspectives on the role of passive investors and provide actionable insights for institutional investors, regulators, and corporate managers seeking to understand the broader implications of passive ownership on firm valuation and financing strategies.
1. Introduction
Passive investing, which seeks to match the returns of an existing stock index, has become increasingly popular.1 While it has been gradually gaining ground against active investing since its inception in the 1970s, the pace sharply increased after the financial crisis. In an unprecedented shift in investor behavior, investors sold roughly USD 600 billion of their equity holdings in active funds while pouring almost USD 1 trillion into passive funds between 2008 and 2015 (Bogle, 2016). This shift is largely attributable to investors’ heightened awareness of the lower costs, tax advantages, and better average performance associated with passive investment (Bebchuk et al., 2017).
The large, and yet still growing, passive investment market is dominated by the “Big Three” asset managers: BlackRock, Vanguard and State Street.2 Fichtner et al. (2017) report that the Big Three collectively manage over 90% of all assets in passive U.S. equity funds.3 Treated as a single entity, these three investors would be the largest shareholder in over 40% of listed U.S. firms and in 88% of the S&P 500 (Fichtner et al., 2017). This concentration of ownership among a few passive investors has received attention from various disciplines including finance, law, and political science since they now have, at least on paper, the necessary power to exert influence on firm policies and outcomes.4 An interesting question this growing literature has not examined is the impact of concentrated ownership by passive investors on firms’ cost of equity capital, i.e., how other equity holders perceive the Big Three’s influence, or the lack thereof. In this study, we aim to fill this gap by investigating the effect of combined ownership by the Big Three asset managers of a firm and its cost of equity capital.
The concentration of ownership in the hands of Big Three asset managers could potentially impact firms’ cost of equity through its effect on firms’ agency risk, information risk, or liquidity risk. Big Three ownership has distinct characteristics that lead to various expectations for each of these channels. The agency risk channel essentially relates to passive owners’ incentives and abilities to monitor managers, whose interests may not be fully aligned with those of shareholders (Jensen & Meckling, 1976). On the one hand, the long-term nature of passive ownership (i.e., holding a firm’s stock as long as it stays on a tracked index) and their large ownership shares relative to active investors, which are usually smaller and more dispersed, suggest they have incentives and voting shares to monitor managers to ensure long-term value creation.5 On the other hand, precisely because they are long-term investors, they cannot pose credible threats that they will sell their positions to influence managerial behavior, i.e., they cannot govern through “exit”.6 Also, they lack any competitive incentives to increase the value of the firms in their portfolios; any increase will also increase the value of the index they track. The second channel, information risk, concerns the effect of improved disclosure and transparency (Botosan, 1997; Francis et al., 2008). Consistent with this channel, recent literature shows improved disclosure after changes in predominantly passive institutional ownership (Boone & White, 2015; Bird & Karolyi, 2016). Hence, it is likely that Big Three ownership reduces information risk. The third channel, liquidity risk, may operate indirectly through an effect on information risk (Diamond & Verrecchia, 1991), leading to a negative impact on cost of equity, or directly, as concentrated ownership may reduce free-float and thus liquidity, leading to a positive impact (Edmans & Holderness, 2017). Overall, the existence and the direction of the effect of concentration of Big Three ownership on firms’ cost of equity is not clear and thus an empirical question.
We study the effect of Big Three ownership of a firm’s stock on the firm’s cost of equity capital, for a panel of U.S. firms over the period 1997–2016. We measure Big Three ownership both as a continuous ownership ratio, computed as the sum of the holdings of the big passive asset managers over total common shares of a firm outstanding and as a dichotomous variable based on whether they collectively hold a 5% block.7 Similar to prior research (Hou et al., 2012; Green et al., 2014), we construct a composite measure of implied cost of capital (ICC) by averaging five ICC measures proposed by Gordon and Gordon (1997), Claus and Thomas (2001), Gebhardt et al. (2001), Easton (2004) and Ohlson and Juettner-Nauroth (2005). In this approach, each of the ICC estimates is the discount rate that equates the market value of equity at a given period to the present value of future earnings or return on equity (ROE), depending on the model used. Future earnings and ROE are estimated using Hou et al.’s (2012) cross-sectional earnings prediction model.
For both measures of Big Three ownership, we find that ownership by big passive institutions is positively associated with cost of equity, suggesting a heightened perception of risk by investors. This association holds after controlling for known determinants of cost of equity and is robust to including fixed firm and year effects. Though not the focus of our study, total institutional ownership carries a negative sign in the full regression model, consistent with prior research suggesting their positive impact on governance (e.g., Agrawal & Mandelker, 1990; Chung et al., 2002) and confirming our belief that Big Three ownership is distinct in its effect on cost of equity compared to ownership by active investors.
We also conduct several cross-sectional tests based on firm characteristics to study whether the impact of Big Three ownership on cost of equity operates through the channels we identify. First, we find some evidence that the effect is stronger for firms with poor governance mechanisms, suggesting a heightened agency risk associated with ownership by big passive institutions. We also examine the agency channel using subsamples based on firms’ monitoring needs, proxied by firm size, market-to-book and free cash flows. The results of this test are consistent with the prior test, i.e., the effect is concentrated for firms with higher monitoring needs. Overall, we find suggestive evidence that ownership by big passive institutions increases firms’ agency risk, which is consistent with Schmidt and Fahlenbrach (2017) who show increased managerial power and worse M&A’s after increases in passive ownership. Next, we study the other two channels, information risk and liquidity risk, using a similar approach to our prior tests. The main effect is concentrated in low information asymmetry (low illiquidity) subsamples, suggesting that the informational (liquidity) benefits of Big Three ownership mitigate its agency-related costs for firms in high information asymmetry (low illiquidity) environments. These results are consistent with the recent literature showing increased disclosure, transparency and liquidity after increases in passive ownership (Bird & Karolyi, 2016; Boone & White, 2015; Schoenfeld, 2017).
Lastly, we find that our main results are generally robust to measuring Big Three ownership with an indicator based on if the Big Three is collectively the largest institutional owner of the firm, using ownership of each member of the Big Three separately, using a more recent period and excluding firms with considerable active ownership by Big Three owners from the sample.
Our paper makes several contributions to the literature. First, our study adds to the growing literature on the concentration of ownership in the hands of a few asset managers (e.g., Fichtner et al., 2017; Azar et al., 2018). While these papers examine the anti-competitive effects of common ownership or voting behavior of passive owners, we examine the cost of equity impact of big passive ownership. While passive investing offers some benefits in the form of better average net returns and ease of mind to investors, it also induces a cost to firms in the form of a higher cost of equity capital. Second, our findings extend the literature by linking different forms of institutional ownership and cost of equity capital. This literature finds that the existence of multiple large shareholders (Attig et al., 2008) and institutional investors with long-term investment horizons (Attig et al., 2013) have a negative impact on the cost of equity. Our study highlights the importance of accounting for institutional heterogeneity, not only in block size and investment horizon but also in passive vs. active designation. In this vein, our paper answers Edmans’s (2014) call for studying different blockholder classes, particularly passivists.
Third, our paper is related to but distinct from the literature examining the impact of corporate governance (CG) on increases in institutional ownership around Russell index reconstitutions. Cost of equity relates to equity holders’ perception of risk in the firm while corporate governance provides mechanisms to limit some types of those risks. However, just because a firm has certain CG mechanisms in place does not mean that the managers are effectively monitored, and the firm has lower agency costs of equity. It is particularly hard to quantify big passive owners’ actual monitoring efforts and influence. Fichtner et al. (2017) note that they hold informal meetings with management or send letters to the board to “voice” their concerns directly. Also, the literature examining the corporate governance impact of increases in institutional ownership around the Russell index reconstitutions offers contrasting evidence on the overall impact of passive ownership on CG. Appel et al.’s (2016) results suggest that passive mutual funds influence firms’ governance choices, resulting in more independent directors, the removal of takeover defenses, and more equal voting rights. Schmidt and Fahlenbrach (2017) find increases in CEO power, fewer new independent director appointments and worse merger and acquisition performances following increases in passive institutional ownership. Overall, it is not clear whether their impact is a lower or higher agency cost of equity. We find suggestive evidence for the latter. More importantly, we show that investors perceive a heightened overall risk with increases in Big Three ownership.
A few caveats are in order. First, while we include firm- and year-fixed effects to control for time-invariant firm characteristics and time-varying omitted variables such as macroeconomic conditions, we cannot fully rule out endogeneity concerns.8 Second, our tests that examine the link between Big Three ownership and cost of capital are joint tests of the following hypotheses: (i) the former increases some form of firm risk, and (ii) this risk is priced. Therefore, the lack of a significant relationship between the two for some subsamples does not provide evidence as to which hypothesis may be incorrect.
The rest of the paper is organized as follows. Section 2 provides a brief review of related literature and motivation. Section 3 describes our sample, variables, and research design. Section 4 outlines our empirical findings, followed by Section 5, which delves into actionable policy implications and recommendations. Finally, Section 6 concludes the study.
2. Literature Review, Empirical Predictions, and Hypotheses
The growing prominence of passive investors such as index funds has reshaped the corporate governance landscape. Agency theory posits that the divergence between the manager’s interest and those of the outside shareholders gives rise to agency costs since the manager will bear only a fraction of the costs of any non-pecuniary benefits he takes out in maximizing his own utility (Berle & Means, 1932; Jensen & Meckling, 1976). Costly monitoring efforts are needed to keep managers in check. However, a monitor incurs the whole cost of monitoring efforts while sharing the accrued benefits with other shareholders. To overcome, or to at least mitigate this free-rider problem, investors need to accumulate large blocks (Shleifer & Vishny, 1986). The governance literature recognizes two channels through which large investors engage in corporate governance: voice and exit9. The former relates to large shareholders’ direct engagement with management to “voice” their preferences while the latter concerns the threat of “exit”, i.e., selling their shares and pushing down the stock price, which ex-ante incentivizes the manager to act in the best interests of investors.
Building on the basic theoretical underpinnings of institutional ownership and blockholdership, empirical literature extensively examines their impact on various firm policies and outcomes. Institutional ownership in general is linked to better corporate governance mechanisms (Aggarwal et al., 2011), more influential shareholder proposals (Gillan & Starks, 2000) and higher CEO pay sensitivity (Hartzell & Starks, 2003). A few studies focus on specific types of institutional ownership, recognizing the importance of accounting for their heterogeneity. One group of studies focuses on activist investors, who generally purchase blocks with the intention of influencing firm policies in the short term (Brav et al., 2008; Klein & Zur, 2009), while a more recent strand examines the impact of changes in predominantly passive institutional ownership around Russell index reconstitutions. This stream links passive ownership to improved disclosure, both in quantity and quality as well as increased liquidity (Boone & White, 2015; Schoenfeld, 2017). However, it fails to reach a consensus on the corporate governance impact of passive ownership. On the one hand, Appel et al. (2016) find that increased passive ownership results in more independent directors, removal of takeover defenses, and more equal voting rights. Similarly, Edmans et al. (2019) argue that passive investors, through their consistent and widespread holdings, mitigate agency problems and align management decisions with long-term shareholder interests. Complementing this view, Khan et al. (2024) show that strategic alliances and lending relationships are positively impacted by the presence of passive investors due to enhanced information flow and monitoring. On the other hand, Schmidt and Fahlenbrach (2017) report increases in CEO power, fewer new independent director appointments and worse M&A performance in the same setting. Schmidt and Fahlenbrach (2017) explain these seemingly contrasting results using low-cost vs. high-cost governance activities distinction with passive institutions engaging only in the former. Finally, a few studies link different forms of institutional ownership directly to the cost of equity capital. They find that the existence of multiple large shareholders (Attig et al., 2008) and institutional investors with long-term investment horizons (Attig et al., 2013) have a negative impact on the cost of equity.
A recent strand of literature focuses on the Big Three passive asset managers, Blackrock (Barclays Global Investors before their merger in 2009), Vanguard and State Street. Fichtner et al. (2017) warn about the “hidden power” of the Big Three and show that they follow a centralized corporate governance strategy and generally vote with the management. They report that the Big Three members collectively manage over 90% of all assets in passive U.S. equity funds and they are the only three decidedly passive asset managers in the market. Researchers of law (Lund, 2018) and political science (Jahnke, 2019) also examine corporate governance impact and voting behavior of big passive owners, with the former even proposing a case against passive shareholding voting, claiming that they do not act in the best interest of their clients.
Considering the empirical and theoretical research on institutional ownership and large shareholders, we summarize the reasons why passive owners might have a negative impact on firms’ cost of equity through reduced agency risk. First, passivists are long-term players and, therefore, have incentives to ensure managers act to enhance value in the long term. They generally hold a firm’s stock if it stays in an index, e.g., the S&P 500. In contrast, most active institutional owners focus on short- and medium-term value creation and liquidate their positions when they expect low future returns. Consistent with increased monitoring incentives for long-term institutions, Chen et al. (2007) and Harford et al. (2017) show that they are better monitors. Also, since Big Three owners do not have the “exit” option, they have more incentives to monitor than active owners, ceteris paribus. Further, as argued by Jensen and Murphy (2012) and Martin (2011), capital-market pressures lead executives to focus on the “expectations market” and tempt them to take actions that boost short-term stock prices at the expense of long-term value. The ownership by passive investors likely mitigates this effect and thus decreases the cost of equity. As Vanguard CEO F. William McNabb puts it: “We’re going to hold your stock when you hit your quarterly earnings target. And we’ll hold it when you don’t… That is precisely why we care so much about good governance.”. Second, the Big Three generally hold bigger blocks, giving them more voting shares and more potential to exert influence when compared to active investors, which are usually smaller and more dispersed. This is particularly true in recent years, after their decade-long growth. As of 2016, there are no active managers in the U.S. equity market with a higher AuM (assets under management) than any member of the Big Three, making them the top 3 asset managers (Fichtner et al., 2017). Since the Big Three members share similar incentives, they frequently collude in making important decisions and follow a centralized corporate governance strategy, making them even more powerful (Fichtner et al., 2017). Finally, note that it is the asset managers’ fiduciary responsibility to vote and act in the best interests of their clients under SEC rules.
Following the above arguments, the Big Three passive investors (BlackRock, Vanguard, and State Street) are known for their significant ownership stakes in public companies and their focus on corporate governance and long-term value creation (Boone & White, 2015; Edmans & Holderness, 2017). These investors actively engage in improving firms’ disclosure practices, transparency, and financial reporting quality (Schoenfeld, 2017). Enhanced disclosure reduces information asymmetry between firms and investors, thereby lowering perceived risk and the cost of equity (Ge et al., 2021). Additionally, the sheer scale and visibility of these investors provide credibility to the firms they invest in, further lowering the cost of capital. This hypothesis tests the notion that increased ownership by the Big Three correlates with favorable financial outcomes for firms.
H1.
Higher ownership by the Big Three passive investors is negatively associated with firms’ cost of equity due to enhanced disclosure quality and reduced information asymmetry.
On the other hand, there are reasons why a positive impact of Big Three ownership on the cost of equity is plausible due to heightened agency risk. First, precisely because they are long-term investors, they cannot pose credible threats that they will sell their positions to influence managerial behavior, i.e., they cannot govern through “exit”. Second, recent research argues that passive owners lack the incentives and ability to monitor management (Bebchuk et al., 2017; Schmidt & Fahlenbrach, 2017). While a free-rider problem where investment managers bear the costs of stewardship but share the benefits, they generate exists throughout all investor classes, it is particularly troublesome for passivists whose expense ratios are much lower than that of active investment managers. Also, since both vehicles of passive investing, index funds and ETFs (exchange-traded funds), track indices, passive investors lack any competitive incentives to increase the value of the firms in their portfolios; any increase will also increase the value of the index they track. Third, significant engagement action such as nominating directors and undertaking a proxy contest for board representation would qualify investment managers as seeking to exert control and require them to complete costly disclosure on Schedule 13D. These factors manifest in the Big Three expending negligible resources on stewardship. For example, Vanguard employs about 15 staff for voting and stewardship at its 13,000 portfolio companies, as reported by the Wall Street Journal.10 The numbers are comparable for the other members of the Big Three, Blackrock and State Street. Overall, the extant literature does not enable us to make a clear prediction regarding the direction of the impact of Big Three ownership on the agency’s cost of equity capital.
Information risk is likely another channel of how passive ownership affects the cost of equity. Prior literature links increased disclosure levels to reduced cost of equity capital (Botosan, 1997; Botosan & Plumlee, 2002). This channel may operate through reduced transaction costs and increased demand for a firm’s stock, effectively increasing firm liquidity (Diamond & Verrecchia, 1991) or through reduced estimation risk regarding the parameters of the payoff of a firm’s stock. Given the consistent findings of the recent literature regarding the improved disclosure impact of passive ownership (Bird & Karolyi, 2016; Boone & White, 2015; Schoenfeld, 2017), it is likely that Big Three passive ownership is associated with reduced information risk.
Following the above arguments, market liquidity plays a crucial role in determining the cost of equity, as it affects investors’ ability to buy or sell shares without significantly impacting prices (Robinson, 2008). Firms with high liquidity are more attractive to institutional investors like the Big Three, as these firms offer ease of trading and lower transaction costs (Gulati & Singh, 1998). When the Big Three invest in highly liquid firms, the combination of improved corporate governance and efficient market conditions amplifies the effect of reducing the cost of equity (Johnson & Houston, 2000). Conversely, in firms with low liquidity, the influence of the Big Three on the cost of equity may be muted due to persistent market frictions. This hypothesis examines whether liquidity acts as a boundary condition for the effectiveness of passive ownership in reducing the cost of equity.
H2.
The relationship between Big Three ownership and cost of equity is moderated by market liquidity, such that the effect is stronger in firms with higher liquidity.
Boone and White (2015) and Schoenfeld (2017) argue that increases in passive ownership by institutional investors lead to improved disclosure and transparency. These benefits are expected to reduce information asymmetry and, consequently, the cost of equity. For example, Boone and White (2015) document significant improvements in disclosure quantity and quality post-changes in passive ownership. However, Edmans and Holderness (2017) offer a counterpoint. They suggest that concentrated ownership, especially stable large blocks, may reduce market liquidity, thereby increasing liquidity risk and elevating the cost of equity. This highlights a tension: while passive investors like the Big Three may encourage greater transparency, their substantial ownership could inadvertently limit the free float of shares, leading to higher costs in specific contexts. To reconcile these views, the literature suggests that the net effect of Big Three ownership on the cost of equity is likely contingent on firm-specific characteristics such as baseline liquidity and information asymmetry. In firms with high information asymmetry, the benefits of improved transparency may outweigh liquidity risks, while in liquid firms, concentrated ownership’s drawbacks may dominate. Rational investors may price-protect against this risk, suggesting a heightened liquidity cost of capital.
In recent years, research has expanded to explore the implications of passive ownership in areas beyond governance, such as sustainability, innovation, and stakeholder relations. For instance, BlackRock’s annual stewardship reports emphasize the integration of Environmental, Social, and Governance (ESG) factors into passive investment strategies (BlackRock, 2023). Studies by García et al. (2024) reveal that passive investors have been instrumental in pushing firms toward better ESG disclosures, particularly in industries exposed to regulatory scrutiny.
Despite the growing body of work, significant gaps remain. Notably, the interplay between passive ownership and firm-specific factors, such as disclosure quality and financial performance, has yet to be fully explored. Moreover, while prior studies often emphasize either the benefits or drawbacks of passive ownership, there is limited discussion on the conditions under which one perspective dominates the other. This study contributes to the literature by addressing this gap, investigating how passive investors influence corporate disclosure practices and whether their impact is consistent across varying firm characteristics.
Finally, the implications of passive ownership for policymakers and corporate leaders have gained traction in recent debates. Policymakers are increasingly recognizing the need for regulatory frameworks that balance the benefits of passive ownership with potential systemic risks (OECD, 2025). Concurrently, corporate leaders are urged to proactively engage with passive investors to align governance strategies with evolving market expectations.
3. Sample Selection, Research Design, and Descriptive Statistics
3.1. Sample
Our sample spans the period 1997–2016. We required firms to have institutional ownership data from SEC 13-F filings in the Thomson Reuters Institutional Holdings database, financial data from COMPUSTAT, price and return data from the Center for Research in Security Prices (CRSP) and analyst data from I/B/E/S. We excluded firms in the financial industries (SIC code 6000–6999) and utility industries (SIC code 4900–4949). In our cross-sectional and robustness analyses, we also used the Trade and Quote (TAQ) database to construct PIN (the probability of informed trading), Thomson Reuters Mutual Fund Holdings database (S12) and CRSP Mutual Fund database to compute active share ratios of passive institutions and Institutional Shareholder Services (ISS) to compute governance variables. The final sample used in our analyses includes 24,823 firm-year observations for 4836 unique firms.
3.2. Implied Cost of Equity Capital Estimates
We measured equity risk using the implied cost of equity (ICC). We followed prior research (Hou et al., 2012; Green et al., 2014) to construct a composite measure of ICC by averaging five ICC measures proposed by Gordon and Gordon (1997), Claus and Thomas (2001), Gebhardt et al. (2001), Easton (2004) and Ohlson and Juettner-Nauroth (2005). In this approach, each of the ICC estimates is the discount rate that equates the market value of equity at the end of June of each year t to the present value of future earnings or return on equity (ROE), depending on the model used. Future earnings and ROE are estimated using Hou et al.’s (2012) cross-sectional earnings prediction model, which uses the accounting variables from firms with fiscal year ends from April of year t − 1 to March of year t.11
3.3. Research Design
To examine the relation between ownership by big passive institutions and the implied cost of equity, we estimate the following panel regression model:
where Cost of Equityt is our average ICC measure and Big Three Ownershipt−1 is the sum of the ownership ratios of the Big Three passive institutions, consisting of Blackrock Inc. (Barclays Global Investors before its acquisition by Blackrock in 2009), Vanguard Group and State Street Global Advisors.12 We replaced our continuous measure Big3 Ownership with an indicator variable (Big3 5% Block) set to one if they collectively hold a 5% block in some specifications. We also included total institutional ownership (Inst. Ownershipt−1), and an indicator variable (Other Inst. 5% Blockt−1) set to one if there is a 5% blockholder that is not a member of the Big Three to highlight the differential roles of Big Three and other institutional owners in their possible impact on firms’ cost of capital. In fact, the literature uses each of these two variables as a proxy for improved governance (e.g., Cremers & Nair, 2005; Dittmar & Mahrt-Smith, 2007). We measured ownership variables at the end of year t − 1. We also controlled for the known determinants of the cost of equity capital, following prior literature (Chen et al., 2011; Dhaliwal et al., 2016). Our set of control variables includes Size, Book to Market, Return on Assets, Sales Growth, Leverage, Ana. For. Dispersion, Long-Term Growth Rate, Number of Ana. For., Beta, Idiosyncratic Risk and Momentum. Definitions of all variables are in Appendix A. We also included firm- and year-fixed effects to control for time-invariant firm characteristics and potential time-varying omitted variables such as macroeconomic conditions and cluster standard errors by firm. Across all tables, continuous variables are winsorized at the top and bottom 1% levels.
Cost of Equityt = β1*Big3 Ownershipt−1 + β2–12*Controlst + β13*Inst. Ownershipt−1+ β14* Other Inst. 5% Blockt−1+ Firm FE + Year FE + εt,
3.4. Descriptive Statistics
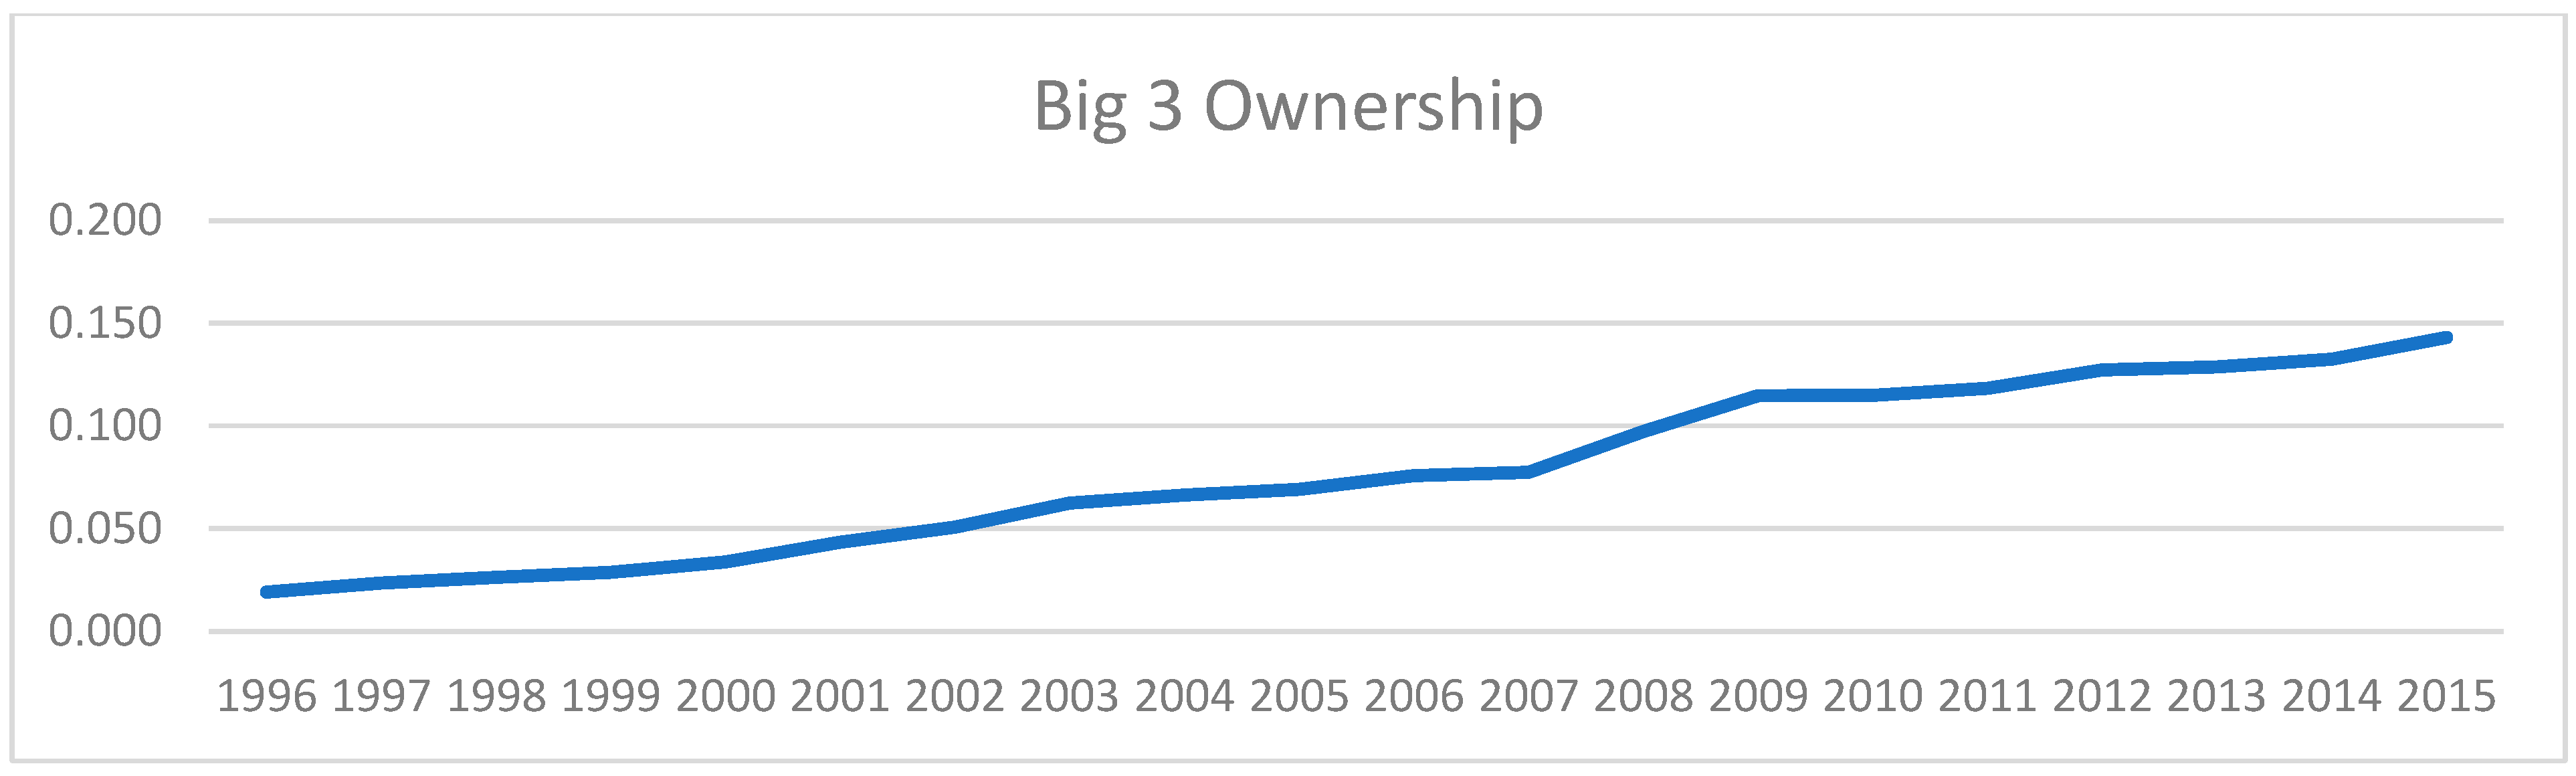
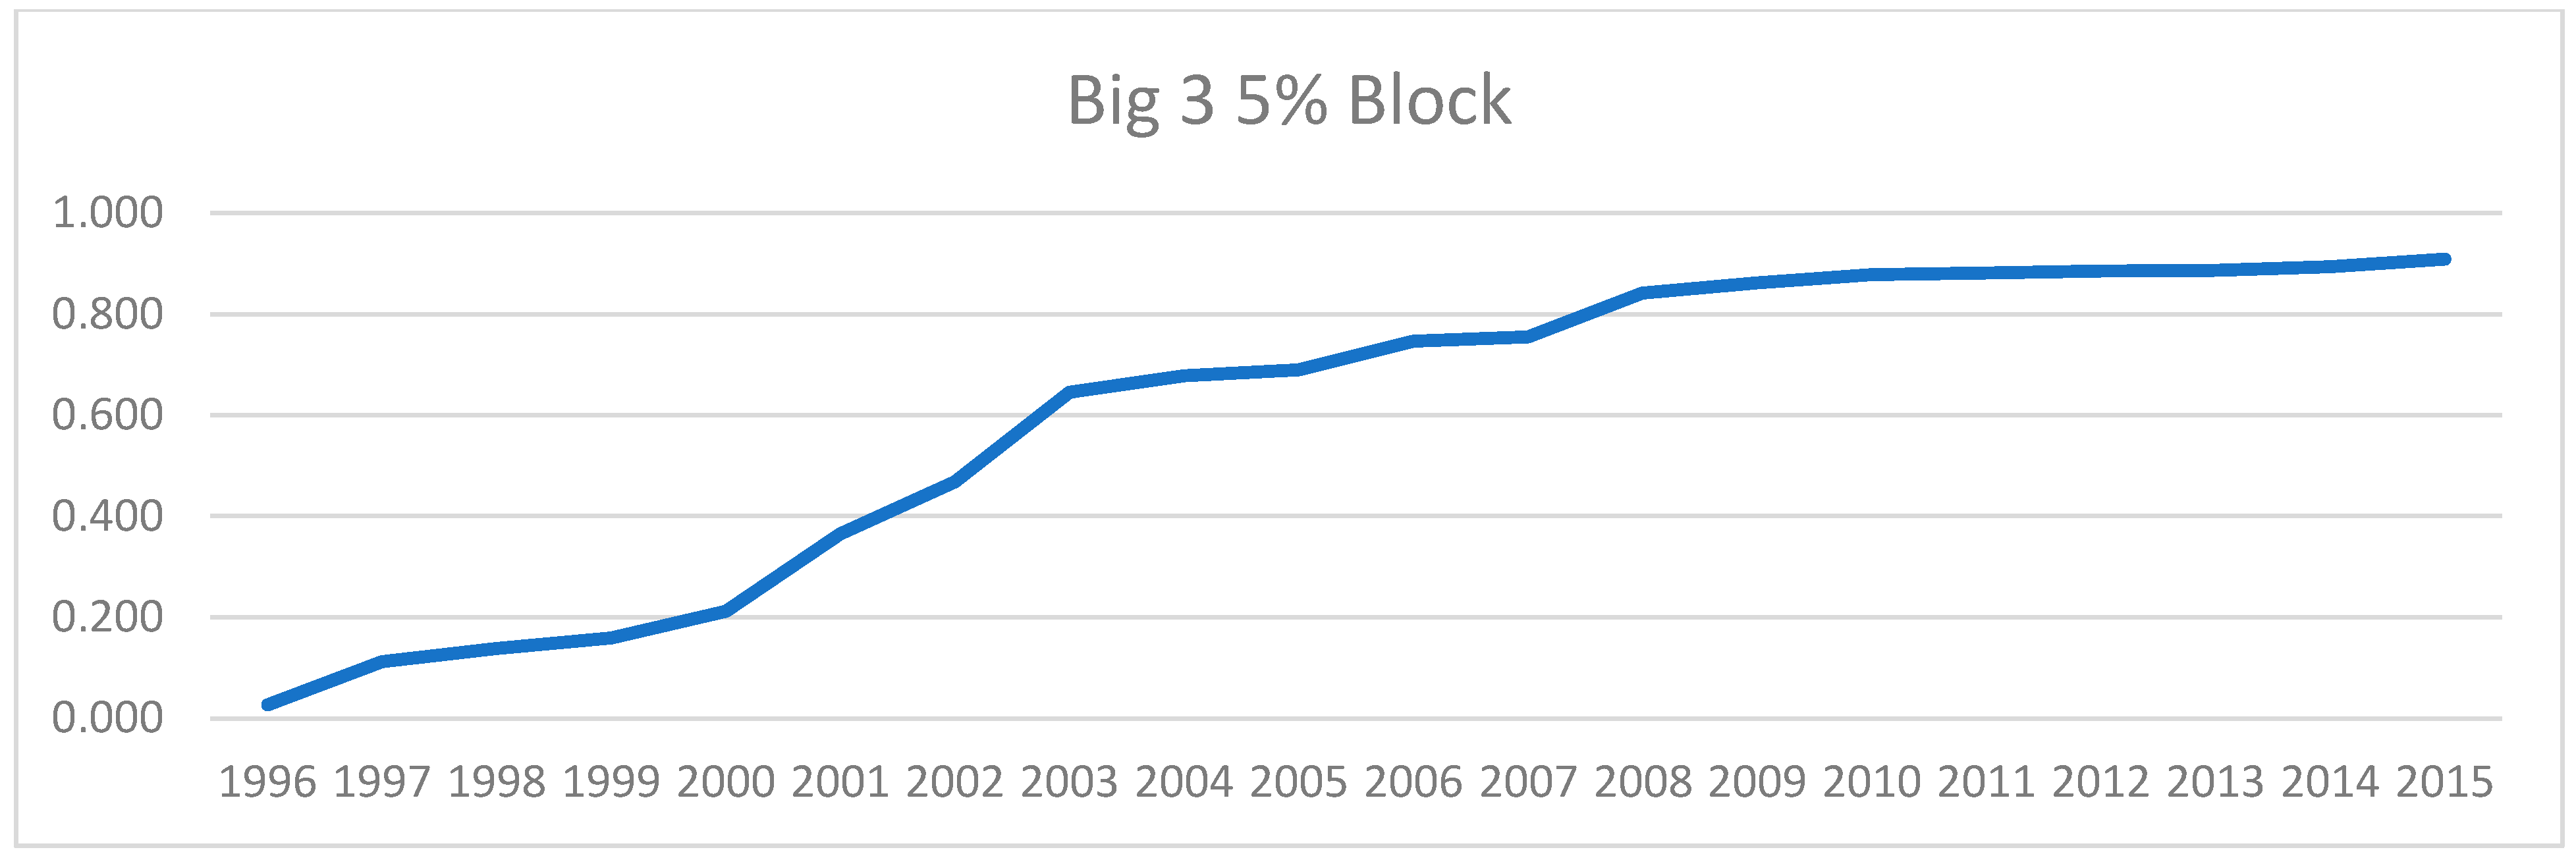
Table 1, Panel A reports summary statistics for the variables used in our regressions. The summary statistics are comparable to those reported by prior literature (Chen et al., 2011; Dhaliwal et al., 2016). The mean (median) Big3 Ownership is 7% (5.8%) and exhibits substantial variation ranging from 1.1% at the 10th percentile and 15.3% at the 90th percentile. Our second test variable, Big3 5%Block, has a mean of 55% and median of 1. Figure 1 (Figure 2) visualizes the rise of Big3 Ownership (Big3 5% Block), increasing from 1.9% (2.7%) to 14.3% (90.9%) during our sample period. Panel C presents yearly statistics of ownership variables for each member of the Big Three, while Panel B reports descriptive statistics for the individual cost of equity estimates.

Table 1.
Descriptive statistics.
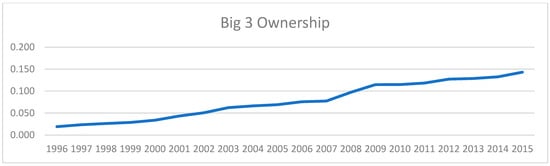
Figure 1.
The yearly ownership ratios of Big Three passive managers for an average firm.
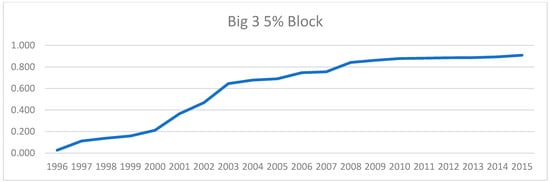
Figure 2.
The ratio of firms with 5% Big Three ownership.
Table 2 presents Pearson correlations among variables. Not surprisingly, our two measures for Big Three ownership are highly correlated (0.8). Big 3 Ownership is not significantly correlated with Cost of Equity, highlighting the importance of controlling for various known determinants of cost of equity. Big3 5% Block has a small negative correlation (−0.03) with Cost of Equity. Panel B of Table 2 reports the correlations among individual implied cost of equity capital estimates, with Cost of Equity EASTON showing notably lower correlations with the others, which is consistent with Hou et al. (2012).
Table 2.
Pearson Correlations.
4. Empirical Analyses
4.1. Main Results
Table 3 presents our main results: coefficient estimates for Equation (1). Columns 1 through 4 use Big3 Ownership, our continuous measure, and columns 5–8 use Big3 5% Block, our dichotomous measure, as the main variable of interest. We employed firm- and year-fixed effects throughout. We only used Size in columns 1 and 5, added other firm characteristics in columns 2 and 6, added analyst variables in columns 3 and 7 and finally added stock-related variables along with Inst. Ownership and Other Inst. 5% Block in columns 4 and 8, which present the results of our full model. Across the board, we find that Big Three ownership variables are significantly positively associated with Cost of Equity. Inst. Ownership enters the regression models with a negative sign, which is consistent with the studies linking institutional ownership to better governance or improved disclosure (e.g., Gillan & Starks, 2000; Aggarwal et al., 2011; Chung & Zhang, 2011) while Other Inst. 5% Block does not carry a sign. Collectively, the results reported in Table 3 are consistent with ownership by big passive institutions, increasing firms’ cost of equity capital. This supports our Hypothesis 1.
Table 3.
Impact of Big Three ownership on cost of equity capital (Testing H1).
This table reports coefficient estimates from the following panel regression:
where the dependent variable, Cost of Equityt is the average of five implied cost of equity measures, and Big 3 Ownershipt−1 is the sum of the ownership ratios of the Big Three passive institutions, consisting of Blackrock Inc. (Barclays Global Investors before its acquisition by Blackrock in 2009), Vanguard Group and State Street Global Advisors. In columns 5–8, we replace Big3 Ownershipt−1 with an indicator variable Big3 5% Block set to one if the Big Three collectively hold a 5% block. All variables are defined in the Appendix A. The sample includes 24,823 firm-year observations and 4836 unique firms between 1997 and 2016. The t-statistics, reported in parentheses, are based on robust standard errors clustered by firm. ***, **, and * denote statistical significance at the 1%, 5%, and 10% levels, respectively.
Cost of Equityt = β1*Big3 Ownershipt−1 + β2–12*Controlst + β13*Inst. Ownershipt−1 + β14* Other Inst. 5% Blockt−1 + Firm FE + Year FE + εt,
4.2. Cross-Sectional Tests
We next employ various subsample analyses to explore the channels through which Big Three ownership may impact cost of equity capital. In each test, we split our firm-years based on the median value of a firm characteristic to see whether the main effect is stronger or concentrated in subsamples predicted by the channels we identify. We used Big Three ownership throughout the remaining tests.13
4.2.1. Agency Channel Subsamples
We started our cross-sectional analyses by sorting firm-years in our sample based on the median value of our governance mechanisms proxies. These are (i) ATI index, Cremers and Nair’s (2005) alternative takeover index based on three anti-takeover provisions—the presence of a staggered (classified) board, a preferred blank check (“poison pill”), and restrictions on shareholder voting to call special meetings or actions through written consent. (ii) Inv. Board indep., inverse board independence, computed as the number of executive directors divided by the number of directors in a firm’s board. (iii) G-index, governance index proposed by Gompers et al. (2003) based on 24 provisions reducing shareholder rights. All three proxies are inverse governance measures, with high values indicating poor governance and all have been extensively used by prior literature (e.g., Armstrong et al., 2015; Baranchuk et al., 2014; Baber et al., 2015). We also use a fourth proxy Avg Inv. Gov. by averaging the other three proxies, each used as high (1) vs. low (0). Table 4 presents the results of our analyses. While each coefficient of Big Three in the High columns exceeds its counterpart in the Low columns, coefficient tests (H0: coefficients are equal) reveal that only those of Inv. Board indep. and Avg Inv. Gov. are significantly different. Overall, we found some evidence that the positive association between Big Three ownership and cost of equity capital is stronger for firms with poor governance mechanisms, suggesting a higher agency cost of equity for those firms.
Table 4.
Cross-sectional analyses: governance mechanisms.
To further explore the agency channel, we next divided our sample based on proxies of monitoring needs. The idea is that if the main effect we showed operates through a heightened agency risk for increased Big Three ownership, we expect to see stronger results for firms that require higher monitoring. We used firm characteristics commonly associated with monitoring needs: Size (Jensen & Meckling, 1976), Market-to-book (Myers, 1977) and Free cash flows (Jensen, 1986), which we define as cash flow from operations, less capital expenditures, divided by average total assets. Table 5 presents the results of our analyses. The positive association between the cost of equity capital and Big Three ownership is concentrated in firms that are bigger and have more free cash flows. The coefficient test reveals that Big 3 ownership just misses being statistically significantly different for value vs. growth firms (p-value = 0.103). Overall, the results of this test are consistent with that of our prior test and strengthen our inference that Big Three ownership is associated with a higher agency cost of equity.
Table 5.
Cross-sectional analyses: monitoring needs.
This table reports coefficient estimates from the following panel regression:
where ATI index is Cremers and Nair’s (2005) alternative takeover index, Inv. Board indep. is inverse board independence, the ratio of executive directors on the number of board members and G-index is the governance index proposed by Gompers et al. (2003). Avg Inv. Gov. is the average of the other three proxies, each used as high (1) vs. low (0). High vs. Low designation is based on sample medians. All regression variables are defined in Appendix A. All regressions include firm- and year-fixed effects. The t-statistics, reported in parentheses, are based on robust standard errors clustered by firm. ***, **, and * denote statistical significance at the 1%, 5%, and 10% levels, respectively.
Cost of Equityt = β1*Big3 Ownershipt−1 + β2–12*Controlst + β13*Inst. Ownershipt−1 + β14* Other Inst. 5% Blockt−1 + Firm FE + Year FE + εt,
This table reports coefficient estimates from the following panel regression:
where Size is the market value of equity, Market-to-book is the market value of equity divided by book value of equity, and Free Cash Flows is the cash flow from operations, less capital expenditures, divided by average total assets. High vs. Low designation is based on sample medians. All regression variables are defined in Appendix A. All regressions include firm- and year-fixed effects. The t-statistics, reported in parentheses, are based on robust standard errors clustered by firm. ***, **, and * denote statistical significance at the 1%, 5%, and 10% levels, respectively.
Cost of Equityt = β1*Big3 Ownershipt−1 + β2–12*Controlst + β13*Inst. Ownershipt−1 + β14* Other Inst. 5% Blockt−1 + Firm FE + Year FE + εt,
4.2.2. Information and Liquidity Channel Subsamples
Next, we explored the remaining two channels we identified. We used three proxies of information asymmetry as surrogates for information risk: (i) Bid-ask spread, defined as the annual average of the ratio of the daily closing bid-ask spread to the closing price during the fiscal year. (ii) Stock return volatility, defined as the standard deviation of stock returns during the fiscal year. (iii) PIN, the probability of informed trading, developed by Easley et al. (1996) and adjusted for the use of intra-day transaction data by Easley et al. (2002)14. Given the consistent findings of the recent literature regarding the improved disclosure impact of passive ownership (Bird & Karolyi, 2016; Boone & White, 2015; Schoenfeld, 2017), we expect that the positive association between our variables of interest will be mitigated for firms facing higher information risk. Columns 1–6 of Table 6 present the results. Consistent with our expectations, the coefficient on Big3 Ownership is weaker—in fact not significant at all—for High subsamples. Coefficient tests reveal that the differences in High vs. Low subsamples are statistically significant for Stock return volatility and PIN.
Table 6.
Cross-sectional analyses: information and liquidity risk subsamples (Testing H2).
Finally, we tested whether liquidity risk is another channel through which Big Three ownership impacts cost of equity capital. While recent literature finds increased liquidity after increases in passive ownership (Boone & White, 2015; Schoenfeld, 2017), Edmans and Holderness (2017) argue that blockholders likely reduce the number of shareholders who may provide liquidity when the stock suffers a shock. Columns 7–8 of Table 6 present the results of our test where we split our sample by Illiquidity. Following Amihud (2002), we define the illiquidity of a stock as the absolute value of daily stock returns divided by daily trading volume in dollars, averaged over the fiscal year. We found that Big3 Ownership was only significant for the low Illiquidity subsample, which is consistent with the impact of ownership by big passive owners on firms’ cost of equity mitigated for firms facing high liquidity risk, as would be suggested by the findings of recent literature (Boone & White, 2015; Schoenfeld, 2017). This finding supports Hypothesis 2.
Overall, the results of the information and liquidity channel tests support the conjecture that Big Three ownership likely reduces firms’ information and liquidity risk. Therefore, it mitigates the impact of heightened agency risk associated with Big Three ownership for the subsample of firms in high information asymmetry environments or firms with illiquid stocks. Given that the proxies we used in subsample analyses are imperfect, we interpreted our cross-sectional results cautiously, as suggestive but not conclusive.
This table reports coefficient estimates from the following panel regression:
where Bid-ask spread is the annual average of the ratio of the daily closing bid-ask spread to the closing price during the fiscal year. Stock return volatility is the standard deviation of stock returns during the fiscal year. PIN is the probability of informed trading. Illiquidity is Amihud (2002)’s measure, defined as the absolute value of daily stock returns divided by daily trading volume in dollars, averaged over the fiscal year. High vs. Low designation is based on sample medians. All regression variables are defined in Appendix A. All regressions include firm- and year-fixed effects. The t-statistics, reported in parentheses, are based on robust standard errors clustered by firm. ***, **, and * denote statistical significance at the 1%, 5%, and 10% levels, respectively.
Cost of Equityt = β1*Big3 Ownershipt−1 + β2–12*Controlst + β13*Inst. Ownershipt−1 + β14* Other Inst. 5% Blockt−1 + Firm FE + Year FE + εt,
4.3. Robustness
In this section, we test the robustness of our main findings against alternative measures and time periods. Table 7 reports the results of our analyses. We included our earlier results of estimating our full model in Column 1 for easy comparison. In columns 2–5, we replaced Big3 Ownership with different ownership ratios. Column 2 shows the result when we use Big3 Largest Inst Owner, set to 1 if Big Three collectively is the largest institutional owner of the firm. The idea is that the Big Three’s impact on firm policies might differ based on this distinction. We found consistent, even stronger results (t-stat = 3.69). Next, we used separate ownership ratios for each member of the Big Three, Barclays/Blackrock (using Barclays ownership before 2009 and Blackrock ownership after 2009, the year of their merger), Vanguard and State Street, where the coefficient on Vanguard Ownership is not statistically significant, while that of the other two members is consistent with the main results. In tabulated tests, we found that Vanguard Ownership yielded consistent results when we used a more recent time, starting in 2005, around the time the company started its impressive ascent to more than triple its ownership by the end of our sample period. Next, we changed our sample period to start from 2002, when each member of the Big3 started holding at least 1% of an average firm. Column 6 shows that the results are consistent and even stronger both in terms of magnitude and significance level. Finally, using Thomson Reuters Mutual Fund Holdings (S12) and CRSP Mutual Fund databases to compute active share ratios of passive institutions, we excluded from our samples the firm-years with an active share of Big Three owners exceeding 20%. Our aim is to mitigate any concern that Big Three’s holding of active funds might confound our results. Since the Big Three are passive-majority, with at least 80% of the assets being passive for each member (Fichtner et al., 2017), we only excluded 1524 (6.1%) firm-years out of 24,823. The results shown in Column 7 are consistent with our main finding.
Table 7.
Robustness analyses.
In untabulated results, we also found that our results are robust to adding lagged cost of equity as a control, to account for the mean reversion in cost of equity capital (Gebhardt et al., 2001).
This table reports coefficient estimates from the following panel regression:
where the dependent variable, Cost of Equityt is the average of five implied cost of equity measures, and Big 3 Ownershipt−1 is the sum of the ownership ratios of the Big Three passive institutions. We replace Big3 Ownershipt with alternative ownership variables in columns 2–5. We include but do not report the intercept in the regressions for brevity. In column 7, we exclude firm-years with 20% or more Big Three active ownership.
Cost of Equityt = β1*Big3 Ownershipt−1 + β2–12*Controlst + β13*Inst. Ownershipt−1 + β14* Other Inst. 5% Blockt−1 + Firm FE + Year FE + εt,
5. Discussion of Actionable Policy Implications and Recommendations
The study highlights the growing influence of passive investors, such as the “Big Three”, on corporate governance and strategic decision-making, underscoring the need for actionable policy implications and recommendations for both policymakers and corporate leaders. Policymakers must address the potential systemic risks arising from the dominance of passive investment strategies. Regulatory oversight is essential to ensure that these investors, who often wield significant ownership stakes, do not inadvertently contribute to market concentration or governance conflicts. Strengthening disclosure requirements to mandate transparency in voting behaviors, engagement practices, and governance influence is a critical step. Additionally, global adoption of stewardship codes, such as those implemented in the UK and Japan, could emphasize the accountability of institutional investors, encouraging them to align their stewardship practices with broader societal goals, including environmental, social, and governance (ESG) priorities. Furthermore, antitrust laws could be revisited to mitigate the market concentration effects of passive investors, ensuring a competitive and efficient marketplace while preventing the excessive centralization of power.
For corporate leaders, the study provides valuable insights into navigating the expectations of passive investors. Proactive engagement with these investors is crucial, particularly to communicate long-term strategies that emphasize governance practices, sustainability, and stakeholder priorities. Establishing dedicated investor relations teams can help bridge communication gaps and foster alignment on key governance decisions. Corporate leaders should also prioritize long-term value creation by adopting strategies that balance financial performance with ESG considerations, recognizing that many passive investors have a long-term focus. This includes adopting clear frameworks for measuring and reporting sustainability metrics, which align with the growing emphasis on ESG factors.
Additionally, this study underscores the importance of robust board composition and governance structures to meet the expectations of passive investors. Boards should be independent, diverse, and regularly evaluated for effectiveness to ensure alignment with investor priorities. Transparency in reporting financial performance, governance policies, and ESG progress is paramount for building trust and accountability. Corporate leaders should also be prepared to justify major decisions to passive investors, who are increasingly active in proxy voting and governance influence. By addressing these actionable policy implications and corporate recommendations, this study provides a comprehensive framework for mitigating risks and aligning the interests of passive investors, firms, and society at large, thereby enhancing the relevance and impact of its findings.
6. Conclusions
This study examines the influence of the Big Three passive investors on firms’ cost of equity, providing novel insights into the interplay between passive ownership and corporate financing. By addressing a significant gap in the literature, the research highlights how increased ownership by passive investors enhances disclosure quality and reduces information asymmetry, thereby lowering the cost of equity. However, the findings also underscore the complexity of this relationship, as concentrated ownership by the Big Three may inadvertently introduce liquidity risks under certain conditions.
The implications of this study extend beyond academia to practical applications for institutional investors, regulators, and corporate managers. For investors, the findings offer valuable insights into the potential benefits and trade-offs of concentrated ownership structures. Regulators may use these insights to consider policies aimed at mitigating liquidity risks while preserving the benefits of improved disclosure practices. Managers can leverage these findings to better understand the dynamics of their investor base and its impact on firm valuation and financing.
Despite its contributions, this study has several limitations that warrant further exploration. The analysis focuses primarily on a specific subset of firms and ownership structures, which may limit the generalizability of the findings to other contexts. Additionally, the study relies on publicly available data, which may not fully capture the private dynamics of passive investor engagement.
Future research could build on these findings by exploring the role of passive investors in different market environments or across varying regulatory frameworks. Investigating how the Big Three’s influence evolves in response to economic or financial crises could also offer valuable insights. Moreover, further studies could examine the interaction between passive investors and other institutional ownership structures to uncover broader implications for corporate governance and financial performance.
In conclusion, this study advances our understanding of passive ownership by the Big Three and its implications for firms’ cost of equity. By shedding light on this critical area, it lays a foundation for future research while offering practical guidance for stakeholders navigating the evolving landscape of institutional investment.
Author Contributions
Conceptualization, S.D. and T.M.F.P.; methodology, S.D. and T.M.F.P.; software, T.M.F.P.; validation, S.D. and T.M.F.P.; formal analysis, T.M.F.P.; investigation, S.D. and T.M.F.P.; resources, S.D. and T.M.F.P.; data curation, S.D.; writing—original draft preparation, S.D. and T.M.F.P.; writing—review and editing, S.D.; visualization, T.M.F.P.; supervision, S.D.; project administration, T.M.F.P.; funding acquisition, S.D. All authors have read and agreed to the published version of the manuscript.
Funding
This research received no external funding.
Data Availability Statement
The raw data supporting the conclusions of this article will be made available by the authors on request.
Conflicts of Interest
The authors declare no conflict of interest.
Appendix A. Variable Definitions
| Cost of Equity | Average of the 5 implied cost of equity measures |
| Big3 Ownership | Ownership ratio of the Big Three passive-majority institutions: Blackrock (Barclays GI before 2009), Vanguard and State Street. |
| Big3 5% Block | Indicator variable set to 1 if Big Three’s combined ownership is at least 5% |
| Size | Market value of equity, its log value is used in the regressions |
| Book to Market | Book to Market |
| Return on Assets | Net income scaled by lagged total assets |
| Sales Growth | Change in the natural logarithm of a firm’s net sales |
| Leverage | Ratio of total liabilities to total assets |
| Ana. For. Dispersion | Natural logarithm of the standard deviation of the analysts’ estimates for the next period’s earnings divided by the median forecast for the next period’s earnings |
| Long-Term Growth Rate | Median analyst forecast of the long-term earnings growth rate |
| Number of Ana. For. | Number of analysts providing a forecast for the next period |
| Beta | Beta, estimated by regressing daily individual stock returns over the fiscal year on the contemporaneous CRSP value-weighted market returns |
| Idiosyncratic Risk | Annualized standard deviation of the residuals from regressing daily individual stock returns over the fiscal year on the contemporaneous CRSP value-weighted market returns |
| Momentum | Stock return over the fiscal year |
| Inst. Ownership | Ownership ratio of all institutions |
| Other Inst. 5% Block | Indicator variable set to 1 if there is a 5% institutional blockholder that is not a member of Big Three |
| Individual Cost of equity estimates | |
| Cost of Equity GLS | Gebhardt et al. (2001)’s implied cost of equity measure |
| Cost of Equity OJ | Ohlson and Juettner-Nauroth (2005)’s implied cost of equity measure |
| Cost of Equity GORDON | Gordon and Gordon (1997)’s implied cost of equity measure |
| Cost of Equity EASTON | Easton (2004)’s implied cost of equity measure |
| Cost of Equity CT | Claus and Thomas (2001)’s implied cost of equity measure |
Notes
| 1 | See http://graphics.wsj.com/passivists/ for a series of articles examining the rise of passive investing. Accessed on 10 October 2024. |
| 2 | Throughout this paper, we use the terms “Big 3 owners”, “big passive owners”, “passivists” and “big passive asset managers” interchangeably. |
| 3 | Fidelity, an active-majority asset manager (with a passive ratio of 16.9%) is the 4th largest manager of index funds, with AuM less than 7 times that of the smallest of the Big 3, State Street (Fichtner et al., 2017, using 2016 numbers). |
| 4 | The concentration of ownership in the hands of a few asset managers e.g., Azar et al. (2018); corporate governance impact and voting behavior of big passive owners e.g., Jahnke (2019). |
| 5 | Chen et al. (2007) and Harford et al. (2017) argue that long-term independent institutions are better monitors. |
| 6 | See Admati and Pfleiderer (2009) and Edmans (2009) for exit models of block holder governance. |
| 7 | Note that there is significant variation in Big 3 ownership even among the members of popular indices such as S&P 500 and Russell 1000 since passive owners manage various index funds based not only on size, but also on various investment styles including value vs growth designation, high or increasing dividend payers, membership to specific sectors/industries, portfolios that minimize taxable dividend income, social investing etc. |
| 8 | Our results are also robust to controlling for lagged cost of equity to account for possible mean reversion in cost of equity (Gebhardt et al., 2001). |
| 9 | See Shleifer and Vishny (1986), Coffee (1991) and Bhide (1993) for early voice models. Admati and Pfleiderer (2009) and Edmans (2009) provide exit models of block holder governance |
| 10 | Meet the New Corporate Power Brokers: Passive Investors, accessible at https://www.wsj.com/articles/the-new-corporate-power-brokers-passive-investors-1477320101, 24 October 2016. |
| 11 | See Green et al. (2014) Appendix and Hou et al. (2012) for more details on how the individual ICC measures are computed. We closely follow their approach. |
| 12 | We refer to the Big 3 members shortly as Blackrock, Vanguard, and State Street throughout the paper. |
| 13 | Results using our dichotomous test variable, Big3 5% Block, generally are consistent, but weaker. This is possibly because Big3 5% Block only captures variation in the ownership around the 5% cutoff, making it harder to detect an effect in most cases. |
| 14 | We thank Stephen Brown for his help with the PIN data. |
References
- Admati, A. R., & Pfleiderer, P. (2009). The “Wall Street Walk” and shareholder activism: Exit as a form of voice. The Review of Financial Studies, 22(7), 2645–2685. [Google Scholar] [CrossRef]
- Aggarwal, R., Erel, I., Ferreira, M., & Matos, P. (2011). Does governance travel around the world? Evidence from institutional investors. Journal of Financial Economics, 100(1), 154–181. [Google Scholar] [CrossRef]
- Agrawal, A., & Mandelker, G. N. (1990). Large shareholders and the monitoring of managers: The case of antitakeover charter amendments. Journal of Financial and Quantitative Analysis, 25(2), 143–161. [Google Scholar] [CrossRef]
- Amihud, Y. (2002). Illiquidity and stock returns: Cross-section and time-series effects. Journal of Financial Markets, 5(1), 31–56. [Google Scholar] [CrossRef]
- Appel, I. R., Gormley, T. A., & Keim, D. B. (2016). Passive investors, not passive owners. Journal of Financial Economics, 121(1), 111–141. [Google Scholar] [CrossRef]
- Armstrong, C. S., Blouin, J. L., Jagolinzer, A. D., & Larcker, D. F. (2015). Corporate governance, incentives, and tax avoidance. Journal of Accounting and Economics, 60(1), 1–17. [Google Scholar] [CrossRef]
- Attig, N., Cleary, S., El Ghoul, S., & Guedhami, O. (2013). Institutional investment horizons and the cost of equity capital. Financial Management, 42(2), 441–477. [Google Scholar] [CrossRef]
- Attig, N., Guedhami, O., & Mishra, D. (2008). Multiple large shareholders, control contests, and implied cost of equity. Journal of Corporate Finance, 14(5), 721–737. [Google Scholar] [CrossRef]
- Azar, J., Schmalz, M. C., & Tecu, I. (2018). Anticompetitive effects of common ownership. The Journal of Finance, 73(4), 1513–1565. [Google Scholar] [CrossRef]
- Baber, W. R., Kang, S. H., Liang, L., & Zhu, Z. (2015). External Corporate Governance and Misreporting. Contemporary Accounting Research, 32(4), 1413–1442. [Google Scholar] [CrossRef]
- Baranchuk, N., Kieschnick, R., & Moussawi, R. (2014). Motivating innovation in newly public firms. Journal of Financial Economics, 111(3), 578–588. [Google Scholar] [CrossRef]
- Bebchuk, L. A., Cohen, A., & Hirst, S. (2017). The agency problems of institutional investors. Journal of Economic Perspectives, 31, 89–112. [Google Scholar] [CrossRef]
- Berle, A., & Means, G. (1932). The Modern Corporation and Private Property. Macmillan. [Google Scholar]
- Bhide, A. (1993). The hidden costs of stock market liquidity. Journal of Financial Economics, 34(1), 31–51. [Google Scholar] [CrossRef]
- Bird, A., & Karolyi, S. A. (2016). Do Institutional Investors Demand Public Disclosure? The Review of Financial Studies, 29(12), 3245–3277. [Google Scholar] [CrossRef]
- BlackRock. (2023). Annual stewardship report. Available online: https://www.blackrock.com (accessed on 22 October 2024).
- Bogle, J. C. (2016). The Index Mutual Fund: 40 Years of Growth, Change, and Challenge. Financial Analysts Journal, 72(1), 9–13. [Google Scholar] [CrossRef]
- Boone, A. L., & White, J. T. (2015). The effect of institutional ownership on firm transparency and information production. Journal of Financial Economics, 117(3), 508–533. [Google Scholar] [CrossRef]
- Botosan, C. A. (1997). Disclosure level and the cost of equity capital. The Accounting Review, 72, 323–349. [Google Scholar]
- Botosan, C. A., & Plumlee, M. A. (2002). A re-examination of disclosure level and the expected cost of equity capital. Journal of Accounting Research, 40(1), 21–40. [Google Scholar] [CrossRef]
- Brav, A., Jiang, W., Partnoy, F., & Thomas, R. (2008). Hedge Fund Activism, Corporate Governance, and Firm Performance. The Journal of Finance, 63(4), 1729–1775. [Google Scholar] [CrossRef]
- Chen, K. C., Chen, Z., & Wei, K. J. (2011). Agency costs of free cash flow and the effect of shareholder rights on the implied cost of equity capital. Journal of Financial and Quantitative Analysis, 46(1), 171–207. [Google Scholar] [CrossRef]
- Chen, X., Harford, J., & Li, K. (2007). Monitoring: Which institutions matter? Journal of Financial Economics, 86(2), 279–305. [Google Scholar] [CrossRef]
- Chung, R., Firth, M., & Kim, J. B. (2002). Institutional monitoring and opportunistic earnings management. Journal of Corporate Finance, 8(1), 29–48. [Google Scholar] [CrossRef]
- Chung, K. H., & Zhang, H. (2011). Corporate governance and institutional ownership. Journal of Financial and Quantitative Analysis, 46(1), 247–273. [Google Scholar] [CrossRef]
- Claus, J., & Thomas, J. (2001). Equity premia as low as three percent? Evidence from analysts’ earnings forecasts for domestic and international stock markets. Journal of Finance, 56, 1629–1666. [Google Scholar] [CrossRef]
- Coffee, J. (1991). Liquidity versus control: The institutional investor as corporate monitor. Columbia Law Review, 91(6), 1277–1368. [Google Scholar] [CrossRef]
- Cremers, K. J., & Nair, V. B. (2005). Governance mechanisms and equity prices. The Journal of Finance, 60(6), 2859–2894. [Google Scholar] [CrossRef]
- Dhaliwal, D., Judd, J. S., Serfling, M., & Shaikh, S. (2016). Customer concentration risk and the cost of equity capital. Journal of Accounting and Economics, 61(1), 23–48. [Google Scholar] [CrossRef]
- Diamond, D. W., & Verrecchia, R. E. (1991). Disclosure, liquidity, and the cost of capital. The Journal of Finance, 46(4), 1325–1359. [Google Scholar] [CrossRef]
- Dittmar, A., & Mahrt-Smith, J. (2007). Corporate governance and the value of cash holdings. Journal of Financial Economics, 83(3), 599–634. [Google Scholar] [CrossRef]
- Easley, D., Hvidkjaer, S., & O’Hara, M. (2002). Is information risk a determinant of asset returns? The Journal of Finance, 57, 2185–2221. [Google Scholar] [CrossRef]
- Easley, D., Kiefer, N., & O’Hara, M. (1996). Cream-skimming or profit-sharing? The curious role of purchased order flow. The Journal of Finance, 51, 811–833. [Google Scholar]
- Easton, P. D. (2004). PE Ratios, PEG ratios, and estimating the implied expected rate of return on equity capital. The Accounting Review, 79, 73–95. [Google Scholar] [CrossRef]
- Edmans, A. (2009). Blockholder trading, market efficiency, and managerial myopia. The Journal of Finance, 64(6), 2481–2513. [Google Scholar] [CrossRef]
- Edmans, A. (2014). Blockholders and corporate governance. Annual Review of Financial Economics, 6(1), 23–50. [Google Scholar] [CrossRef]
- Edmans, A., & Holderness, C. G. (2017). Blockholders: A survey of theory and evidence. The Handbook of the Economics of Corporate Governance, 1, 541–636. [Google Scholar] [CrossRef]
- Edmans, A., Levit, D., & Reilly, D. (2019). Governance through exit and voice: A theory of multiple blockholders. Review of Financial Studies, 32(7), 2673–2718. [Google Scholar] [CrossRef]
- Fichtner, J., Heemskerk, E. M., & Garcia-Bernardo, J. (2017). Hidden power of the Big Three? Passive index funds, re-concentration of corporate ownership, and new financial risk. Business and Politics, 19(2), 298–326. [Google Scholar] [CrossRef]
- Francis, J., Nanda, D., & Olsson, P. (2008). Voluntary disclosure, earnings quality, and costs of capital. Journal of Accounting Research, 46, 53–99. [Google Scholar] [CrossRef]
- García, R., Hernández, T., & Morales, P. (2024). The role of passive investors in driving ESG disclosures: Evidence from regulatory scrutiny. Journal of Business Ethics, 174(2), 233–256. [Google Scholar]
- Ge, R., Ji, Y., & Louis, H. (2021). Accounting quality and alliance contract provisions. The Accounting Review, 96(4), 261–287. [Google Scholar] [CrossRef]
- Gebhardt, W. R., Lee, C. M. C., & Swaminathan, B. (2001). Toward an implied cost of capital. Journal of Accounting Research, 39, 135–176. [Google Scholar] [CrossRef]
- Gillan, S. L., & Starks, L. T. (2000). Corporate governance proposals and shareholder activism: The role of institutional investors. Journal of Financial Economics, 57(2), 275–305. [Google Scholar] [CrossRef]
- Gompers, P., Ishii, J., & Metrick, A. (2003). Corporate governance and equity prices. The Quarterly Journal of Economics, 118(1), 107–156. [Google Scholar] [CrossRef]
- Gordon, J. R., & Gordon, M. J. (1997). The finite horizon expected return model. Financial Analysts Journal, 53, 52–61. [Google Scholar] [CrossRef]
- Green, T. C., Jame, R., Markov, S., & Subasi, M. (2014). Broker-hosted investor conferences. Journal of Accounting and Economics, 58(1), 142–166. [Google Scholar] [CrossRef]
- Gulati, R., & Singh, H. (1998). The architecture of cooperation: Managing coordination costs and appropriation concerns in strategic alliances. Administrative Science Quarterly, 43(4), 781–794. [Google Scholar] [CrossRef]
- Harford, J., Wang, C., & Zhang, K. (2017). Foreign Cash: Taxes, Internal Capital Markets and Agency Problems. Review of Financial Studies, 20, 1490–1538. [Google Scholar] [CrossRef]
- Hartzell, J. C., & Starks, L. T. (2003). Institutional investors and executive compensation. The Journal of Finance, 58(6), 2351–2374. [Google Scholar] [CrossRef]
- Hou, K., Van Dijk, M. A., & Zhang, Y. (2012). The implied cost of capital: A new approach. Journal of Accounting and Economics, 53(3), 504–526. [Google Scholar] [CrossRef]
- Jahnke, P. (2019). Ownership concentration and institutional investors’ governance through voice and exit. Business and Politics, 21(3), 327–350. [Google Scholar] [CrossRef]
- Jensen, M. C. (1986). Agency costs of free cash flow, corporate finance, and takeovers. The American Economic Review, 76(2), 323–329. [Google Scholar]
- Jensen, M. C., & Meckling, W. H. (1976). Theory of the firm: Managerial behavior, agency costs and ownership structure. Journal of Financial Economics, 3(4), 305–360. [Google Scholar] [CrossRef]
- Jensen, M. C., & Murphy, K. J. (2012). The earnings management game. Harvard Business School NOM Unit Working Paper No. 12-004. Available online: https://ssrn.com/abstract=1894304 (accessed on 10 October 2024).
- Johnson, S., & Houston, M. B. (2000). A reexamination of the motives and gains in joint ventures. Journal of Financial and Quantitative Analysis, 35(1), 67–85. [Google Scholar] [CrossRef]
- Khan, U., Lin, V., Ma, Z., & Stice, D. (2024). Strategic alliances and lending relationships. The Accounting Review, 99(5), 307–332. [Google Scholar] [CrossRef]
- Klein, A., & Zur, E. (2009). Entrepreneurial shareholder activism: Hedge funds and other private investors. The Journal of Finance, 64(1), 187–229. [Google Scholar] [CrossRef]
- Lund, D. S. (2018). The Case against Passive Shareholder Voting. Journal of Corporation Law, 43, 493. [Google Scholar] [CrossRef]
- Martin, R. L. (2011). Fixing the game: Bubbles, crashes, and what capitalism can learn from the NFL. Harvard Business Press. [Google Scholar]
- Myers, S. C. (1977). Determinants of corporate borrowing. Journal of Financial Economics, 5(2), 147–175. [Google Scholar] [CrossRef]
- OECD. (2025). Principles of corporate governance. Organisation for Economic Co-operation and Development. [Google Scholar]
- Ohlson, J. A., & Juettner-Nauroth, B. E. (2005). Expected EPS and EPS growth as determinants of value. Review of Accounting Studies, 10, 349–365. [Google Scholar] [CrossRef]
- Robinson, D. (2008). Strategic alliances and the boundaries of the firm. Review of Financial Studies, 21(2), 649–681. [Google Scholar] [CrossRef]
- Schmidt, C., & Fahlenbrach, R. (2017). Do exogenous changes in passive institutional ownership affect corporate governance and firm value? Journal of Financial Economics, 124(2), 285–306. [Google Scholar] [CrossRef]
- Schoenfeld, J. (2017). The effect of voluntary disclosure on stock liquidity: New evidence from index funds. Journal of Accounting and Economics, 63(1), 51–74. [Google Scholar] [CrossRef]
- Shleifer, A., & Vishny, R. W. (1986). Large shareholders and corporate control. Journal of Political Economy, 94((3, Pt 1)), 461–488. [Google Scholar] [CrossRef]
Disclaimer/Publisher’s Note: The statements, opinions and data contained in all publications are solely those of the individual author(s) and contributor(s) and not of MDPI and/or the editor(s). MDPI and/or the editor(s) disclaim responsibility for any injury to people or property resulting from any ideas, methods, instructions or products referred to in the content. |
© 2025 by the authors. Licensee MDPI, Basel, Switzerland. This article is an open access article distributed under the terms and conditions of the Creative Commons Attribution (CC BY) license (https://creativecommons.org/licenses/by/4.0/).