Article

Attenuation of Wave Energy Due to Mangrove Vegetation off Mumbai, India

1
Ocean Engineering Division, CSIR-National Institute of Oceanography, Dona Paula, Goa 403 004, India
2
Environmental Science Center, Qatar University, 2713 Doha, Qatar
3
Department of Ocean Engineering and Naval Architecture, Indian Institute of Technology Kharagpur, Kharagpur 721 302, India
4
Space Applications Centre, Ambawadi Vistar, Ahmedabad 380015, India
5
Department of Marine Science, Bharathidasan University, Tiruchirappalli 620024, India
*
Author to whom correspondence should be addressed.
Energies 2019, 12(22), 4286; https://doi.org/10.3390/en12224286
Submission received: 19 August 2019 / Revised: 20 September 2019 / Accepted: 24 September 2019 / Published: 11 November 2019
(This article belongs to the Special Issue Impact of Climate Change on Wave Energy Resources)

Abstract

:
Coastal regions of India are prone to sea level rise, cyclones, storm surges, and human-induced activities, resulting in flood, erosion, and inundation, and some of these impacts could be attributed to climate change. Mangroves play a very protective role against some of these coastal hazards. The primary aim of the study was to estimate wave energy attenuation by mangrove vegetation using modeling, and to validate the model results with measurements conducted off Mumbai coast, where a mangrove forest is present. Wave measurements were carried out from 5–8 August 2015 at three locations in a transect normal to the coast using surface-mounted pressure-level sensors in spring tide conditions. The measured data presented wave height attenuation of the order of 52%. Model set-up and sensitivity analyses were conducted to understand the model performance with respect to vegetation parameters. It was observed that wave attenuation increases with an increase in drag coefficient, vegetation density, and stem diameter. For a typical set-up in the Mumbai coastal region having a vegetation density of 0.175 per m2, stem diameter of 0.3 m, and drag coefficient varying from 0.4 to 1.5, the model reproduced attenuation ranging from 49% to 55%, which matches reasonably well with the measured data. Spectral analysis performed for the cases with and without vegetation very clearly portrays energy dissipation in the vegetation area. This study also highlights the importance of climate change and mangrove vegetation.

Graphical Abstract

1. Introduction

Many coasts are subject to severe coastal hazards such as sea level rise, increase in storms, and changes in temperature and salinity caused by climate change. These factors are all related with each other and are variable at both the regional and global scale. This suggests that the impact of climate change can be studied more precisely using a regional approach, i.e., by reviewing all the different parameters for that particular region. The main barrier along the coast, acting as a protective shield, is coastal vegetation. Coastal vegetation protects the coast to a certain extent from the fury of wind waves, storm surges, and tsunamis. As waves propagate through vegetation having sufficient width, due to interactions (with roots, stem, and canopy of vegetation), waves lose energy, resulting in a reduction in wave height. Although they act as a natural buffer along the coastal areas, it is still uncertain as to what extent waves are attenuated by the vegetation. On a more general note, the impact of climate change on mangroves is a very serious issue, especially due to the increase in the tropical cyclones in the Indian Ocean. As mangroves are very sensitive to inundation duration and frequency, sea level rise due to climate change also becomes a major threat for mangroves [1]. There are experimental studies to understand how mangroves respond individually and collectively to sea level rise due to climate change. Studies in [2,3,4,5] showed how specific species of mangroves tolerate water logging. Specific species such as Avicennia marina can exhibit a high tolerance degree to water logging, and the response is dependent on the length and depth of water immersion, as well as salinity, temperature, and other environmental factors [6,7]. The study in [8] indicated that mangroves exhibit differences in morphology and anatomy in relation to changing climate. Their study also showed that, for a large number of mangrove species, the leaf anatomy, vascular vessel density, diameter, length, and fiber wall thickness are influenced by salinity variations and flooding. In the context of climate change, rising CO2 concentrations can also affect mangrove vegetation characteristics. The response of mangroves to increasing CO2 is a complex process, wherein some species thrive, and a decline may be noticed in some other species. More impact can be seen for mangroves that thrive in an estuarine environment, which can experience spatio-temporal variations in temperature and salinity due to climate change. An interesting study reported in [9] suggested that, based on field data estimates, there is a global poleward expansion of mangrove vegetation in response to a global rise in sea surface temperature. Recently, Reference [10] studied the contribution of mangroves to coastal protection from cyclonic storm surges in many tropical countries at risk. Investment in coastal protection will be essential for disaster prevention, and mangroves can play a critical role as a “natural infrastructure” in many places globally [11].
Many studies [12,13,14,15,16,17,18,19,20,21] showed that wave attenuation properties strongly depend on the density of mangrove forest, diameter of stem and root, tides, incident waves, and bathymetry. Reference [22] proposed a formulation for wave-damping effects by vegetation, considering the bulk drag coefficient that takes into account all the approximations considered for wave attenuation. This approach was applied in spectral wave models and calibrated against flume experiment results. Reference [13,15,23,24,25,26] focused their work on the dissipation of wave energy by introducing bottom friction and vegetation density as extra components of the drag force. Furthermore, Reference [14] investigated the dissipation of wave energy due to thick mangrove foliage during cyclones. It led to the development of a quantitative formulation connecting vegetation characteristics, incident wave conditions, and local water depth. The Dalrymple formulation was further extended by [23]; they considered drag as the dominant force, and a parametric relationship was developed using the Keulegan–Carpenter (KC) number, representing wave transformation in a vegetation field. More or less, this relationship covered all the physical processes that occur within the vegetation field as it considered density, diameter, and vegetation height in the over all estimation of the bulk drag coefficient. The SWAN (Simulating Waves Nearshore) model uses this formulation, and it needs calibration of the bulk drag coefficient of particular plant types. The approach of [15] was further extended by [27]; they developed a predictive model for wave propagation through a non-uniform forest of changing water depth. For the Vietnam coast, Reference [16] carried out field experiments and observed that wave attenuation changes with the roughness of the bed (a marshy bottom attenuates about four times more than a sandy bed). It may be noted that all models consider linear wave theory within the vegetated zone.
Due to the inaccessibility of mangrove forests, a limited number of field studies were executed in Vietnam, Australia, China, and Japan [12,13,14,16,27,28,29,30]. Different numerical and analytical models were proposed in the last few decades in order to reproduce the hydrodynamics within a vegetation field with regard to wave energy dissipation.
A recent study by [31] reported that, despite the change in the climate, there is an annual increase of about 1.9% in mangrove cover in India, in contrast to the global mangrove cover that decreases at a rate of 0.66%. There are various other factors such as urbanization, salt farming, developmental activities, changes in hydrologic cycle, increasing salinity, and coastal pollution that impose additional stress on mangrove vegetation. In a geomorphic sense, the mangroves that thrive along the east coast of India are along mild and smooth slopes, whereas mangrove habitats along the west coast of India thrive along steep slopes. Most of the urban cities in India are located on the coastlines, and these cities tend to face multifaceted coastal hazards due to various extreme events, as well as anthropogenic activities. Mumbai is one of the most populated cities along the west coast of India. During monsoons, the city faces frequent floods, which brings in a lot of devastation and economic loss [32]. The reason for floods is mainly attributed to the increase in sea level and increased storminess. Reference [33] carried out a study at select locations along the coast of India and found that, based on the estimated trends (tide-gauge records and altimeter data), the sea level rose at a faster rate during the last two decades than in the entire 20th century. The city is vulnerable and exposed to climate change-induced hazards stemming from sea level rise, heavy precipitation, storm surges, and tropical cyclone risks [34]. An assessment of climate change impacts in this region showed that, by 2080, the likelihood of floods similar to that of the 2005 flood will be more than double [35].
Very few studies are conducted in the coastal region of India on wave energy dissipation due to vegetation. Reference [36] studied the effectiveness of the Kanika Sands Mangrove Island near Dhamra in Odisha, India in attenuating cyclone-induced waves using the SWAN 40.81 model. Reference [37] conducted a sensitivity study with varying bottom slopes on wave attenuation in the presence of mangroves, and their results revealed that the wave height decays exponentially for mild slopes, found to be consistent with earlier studies; however, as the bottom steepness increases, the wave height reduction gradually increases. There are patches of mangrove forests along the coast of India, with varying vegetation density and diameter, but most of these areas are inaccessible for deploying sensors and conducting wave measurements.
The post-2004 Great Indian Tsunami surveys revealed how vegetation protected certain regions along the coast of India. Thereafter, steps were taken to plant vegetation along specific zones that are vulnerable to extreme events. As it is difficult to make observations during an extreme event, we decided to study the wave attenuation characteristics in the vegetation zone along the Indian coast during monsoon season, which represents fairly high wave energy conditions in the Arabian Sea. In this context, we chose the Mumbai coastal region, which is an ideal location to study wave energy attenuation due to its mangrove forests, using modeling and observations. The present study also relates winds, waves, and water level, representing a high-energy scenario. The details of measurements, data analysis, estimations of wave energy attenuation, and SWAN model set-up with and without vegetation are described in the next section.

2. Materials and Methods

2.1. Study Area

The port city of greater Mumbai along the west coast of India lies between 18°55′ north (N) and 19°19′N latitude and 72°47′ east (E) and 73°05′ E longitude (Figure 1). The coastline on the west has four major creeks: Manori, Malad, Mahim, and Mahul. All these creeks and tidal inlets have sheltered shores exposed during low-tide conditions conducive for the growth of mangroves. The tides are found to be semi-diurnal, with a range of about 3 m during spring tide [38]. Coastal currents are primarily driven by tides. During southwest monsoons, run-off from the rivers and creeks marginally alters the hydrodynamics. The maximum current is about 1.0m/s during spring and 0.5m/s during neap. Reference [39] studied the changes in the mangrove habitat around the Mumbai suburban region using remote sensing data.
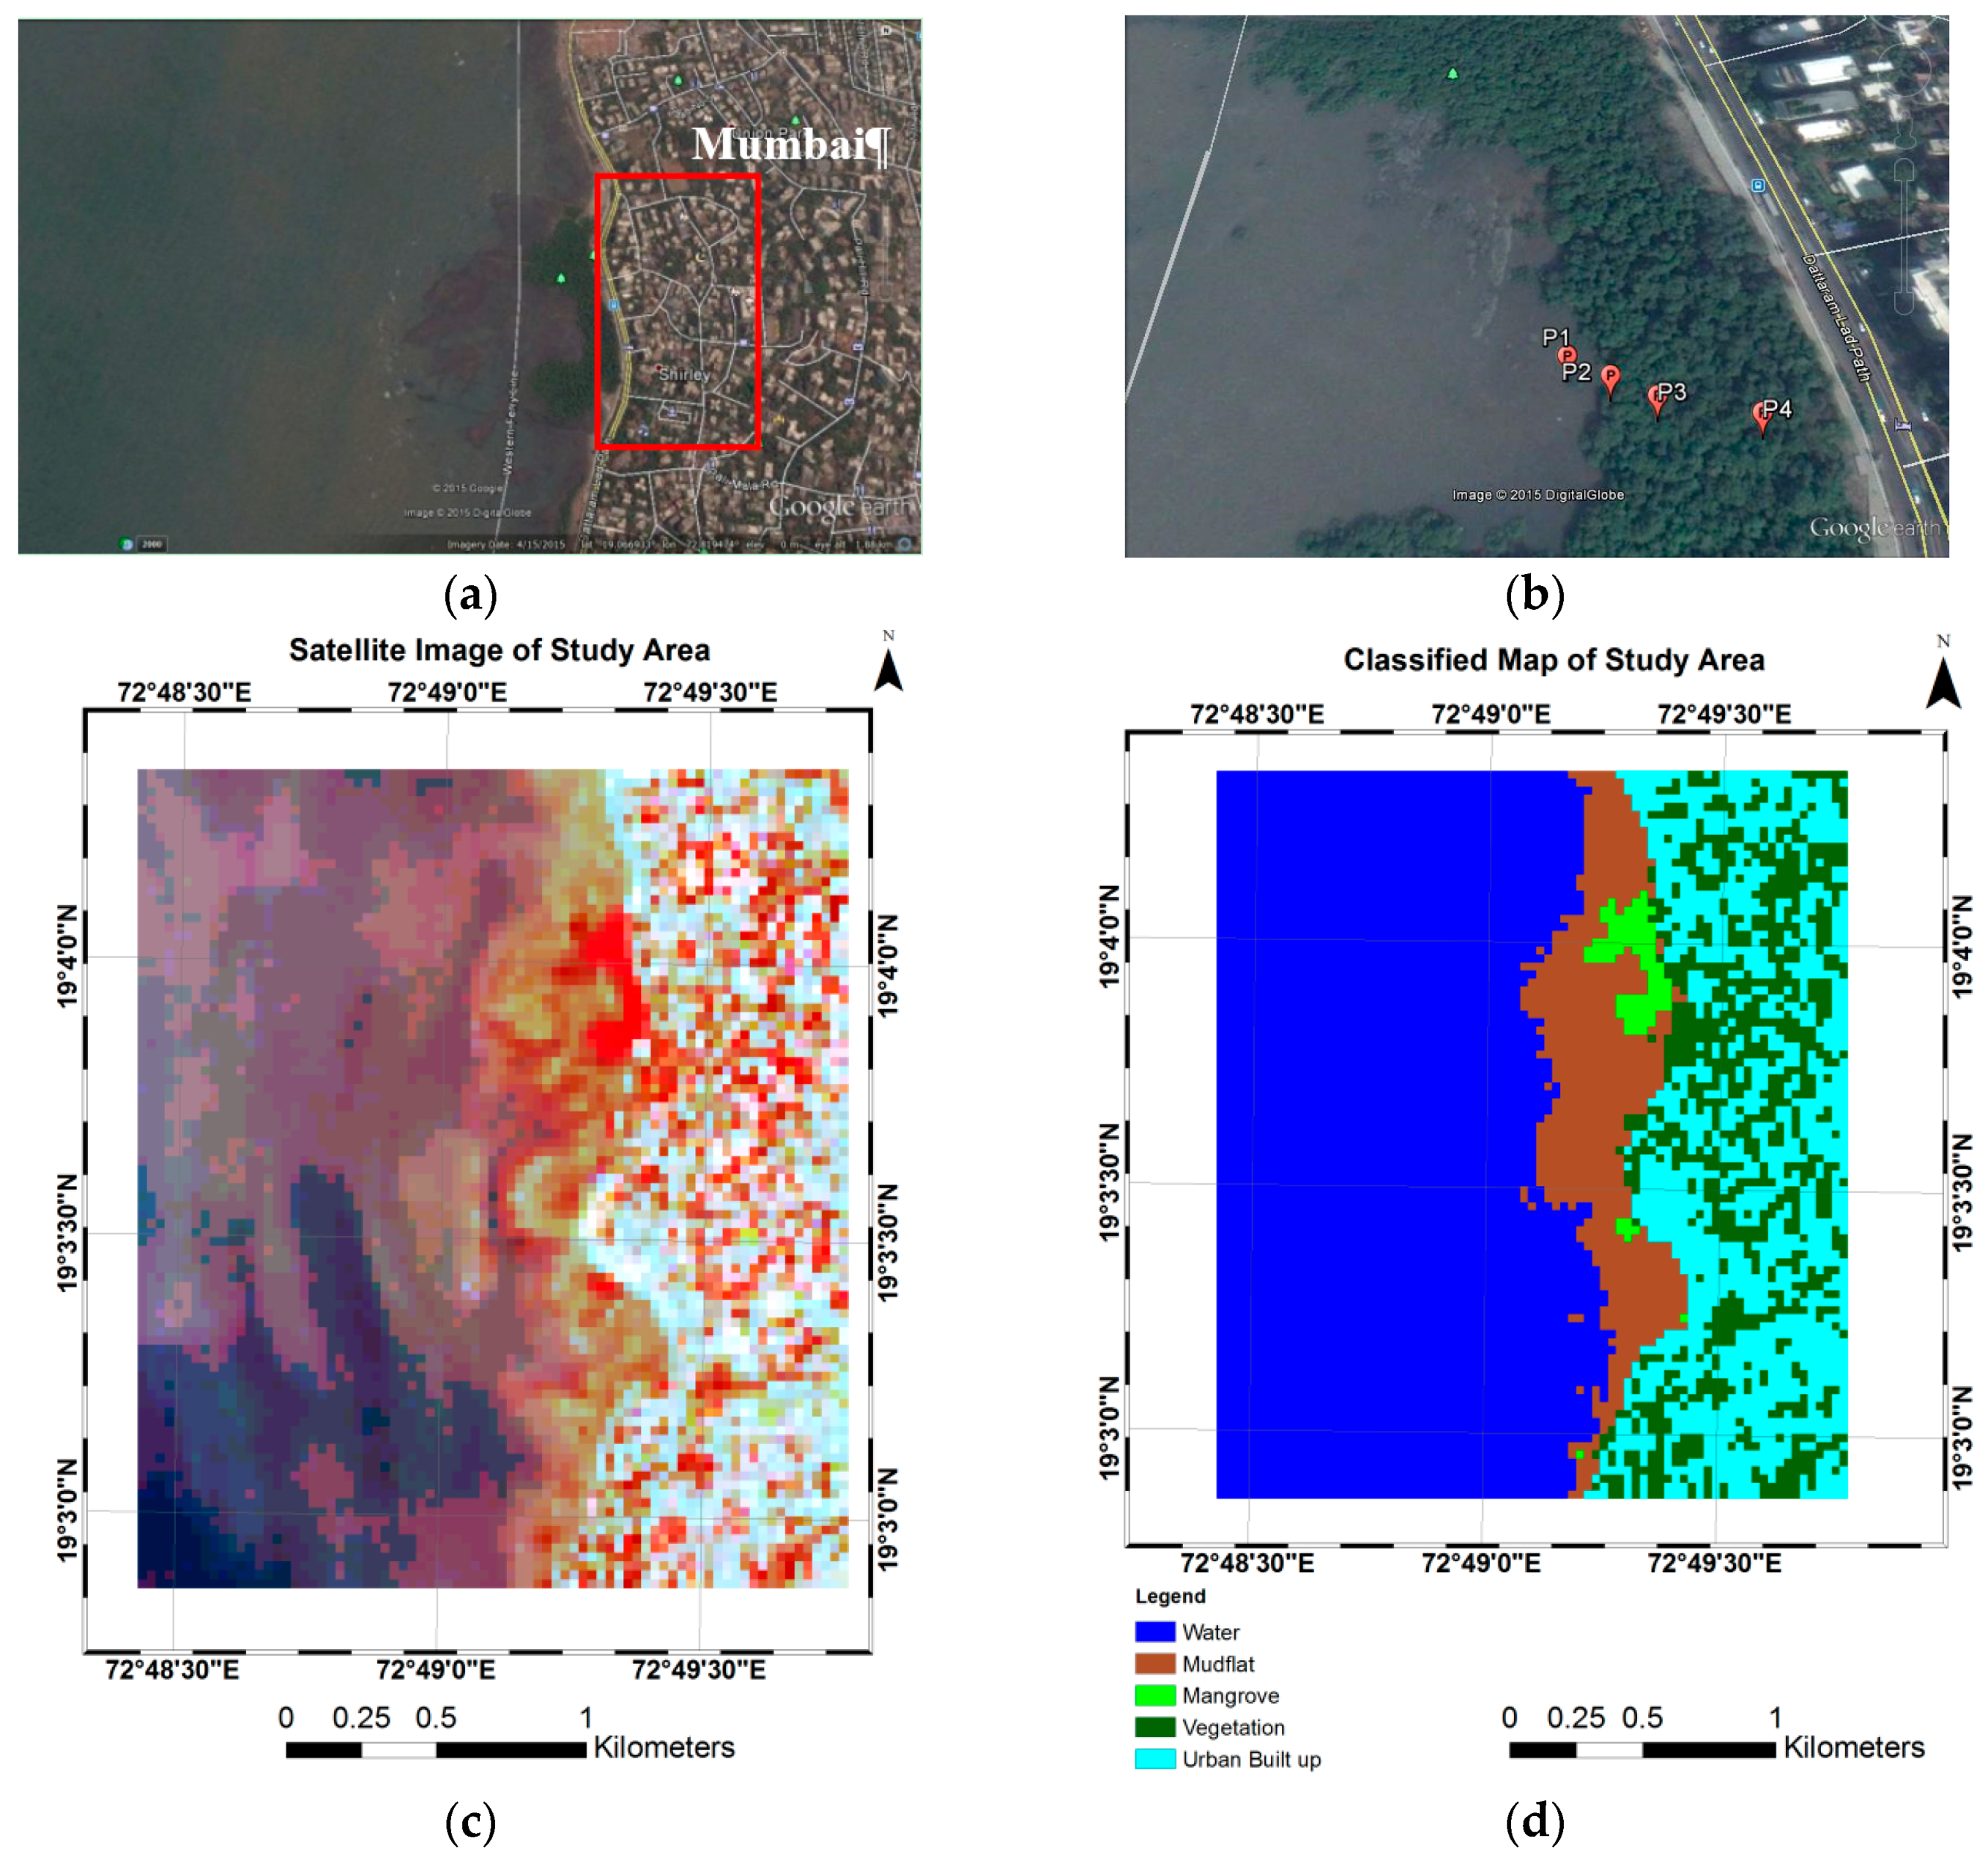
The mangrove forest off Carter Road, Mumbai (http://www.mangroves.godrej.com/MangrovesinMumbai.htm) is a planted one, which grew in height for the past 10 years. The total area under mangroves was measured as roughly 56.40 km2 (including mud flats) in which 45.4% of the total involved dense mangroves. From 1990 to 2001, a total mangrove area of 36.54 km2 was said to be lost, indicating a 39.32% decrease in the area of mangroves [39]. Avicennia marina was found to be the most dominant mangrove species. Rapid developments such as housing, industrialization, coastal reclamation, and the population density of Mumbai resulted in the degradation of mangroves, except for a few areas such as Carter Road, where the mangroves grew and registered an increase in height in the last 10 years. Hence, we conducted field measurements in the coastal region of Carter Road. The study area and measurements carried out are presented in Figure 2a,b.

2.2. Data and Methodology

2.2.1. Mangrove Forest in the Carter Coastal Area, Mumbai

The Landsat 5 TM (9 January 2015) satellite dataset (Figure 2c), obtained from the global land-cover facility site with a resolution of 30 m, was used to estimate the distribution of mangroves off Carter Road. This area was classified based on the Iterative Self-Organizing Data Analysis Technique (ISODATA) algorithm [40]. An unsupervised classification method, ISODATA classifies pixels into spectral clusters based on similar spectral characteristics in the input band. A minimum distance criterion is then used to assign each pixel to the “nearest” cluster. For this study, five classes were extracted (water, mudflat, mangrove, vegetation, and urban (Figure 2d)) using the ERDAS 9.1 unsupervised classification tool, and ARC GIS 10.1 was used to make the classification map. An accuracy assessment was further carried out using Ground Control Points (GCPs) collected during field measurements, and the overall accuracy obtained for the classification was 93.5%. Finally, as the focus of this study was confined to the mangrove region, the area covering mangroves was calculated, separating the vegetation, and it was estimated to be about 0.08 km2.

2.2.2. Wave Measurements

Waves were measured using surface-mounted pressure-level sensors from 5–8 August 2015 under spring tide conditions in the nearshore region off Carter Road (Figure 2b). Four sensors (P1, P2, P3, and P4) were deployed in a transect, stretching over a distance (P1–P4) of 70 m. The measured maximum water depths at each sensor were 2 m (P1), 1.5 m (P2), 1 m (P3), and 0.3 m (P4) during high tide; it may be noted that, during low tide, these locations were exposed. The distance between the probes was maintained as a minimum because of the limited width of the vegetation. P1 was deployed away from the vegetation area, P2 was deployed at a distance of 17 m from P1 (just in front of the vegetation), P3 was deployed at a distance of 35 m from P1, and P4 was deployed at a distance of 71 m from P1. Wave measurements were continued for one tidal cycle every day during the field campaign. The density of vegetation varied along the transect. The mangroves near P2 were short and not fully grown. The vegetation height was ~2.5 m with roots spreading over an area of 1.5 m2. The height of mangrove vegetation near P3 (~5 m) was higher than that near P2, and also denser. At the most landward point of the transect (~70 m from P1), the mangroves were denser and more fully grown, with an average height of 7 m. It was observed that waves attenuated almost completely before they reached the fourth pressure sensor (P4) and, therefore, the observations at P4 were not included. High-frequency (8 Hz) pressure measurements were recorded only when the sensors were submerged under water.

2.2.3. SWAN Model Set-Up for Mumbai Coastal Region

The third-generation numerical model SWAN (Simulating Waves Nearshore) was specifically developed for finite water depth applications [41]. The governing equation in the model is the wave action balance equation with various source and sink terms. The bathymetry was generated with ETOPO1 Earth Topography (1-min resolution) data obtained from the National Geophysical Data Center, United States of America (USA). The SWAN domain (17° N to 20° N and 70° E to 74° E) was set with a spatial resolution of 0.01° × 0.01° (Figure 1b). As the size of the actual patch of the vegetation is approximately one grid size, one single grid was considered with vegetation. ERA-I (ERA–Interim) winds [42] with are solution of 0.125° × 0.125° were used as input.
The model discretization considered 31 frequency bins ranging from 0.05 to 1.00 Hz on a logarithmic scale, and 36 directional bins with an angular resolution of 10°. The SWAN set-up in the present study used [43] wave growth physics, and shallow water triad non-linear interaction using the lumped triad approximation of [44]. The model was initiated with modified white-capping dissipation [45] which is the default formulation in the SWAN model. The quadruplet non-linear wave–wave interaction was computed using the discrete interaction approximation theory [46]. The depth-induced breaking was computed using a spectral version of the model with breaking index γ = 0.73 [47]. The bottom friction in SWAN was calculated based on the Collins formulation [48] with a friction coefficient, cfw = 0.02 m2∙s−3. The model was also run with different bottom friction physics such as MADSEN and JONSWAP available in the model. However, we found that the results were better with the Collins formulation. Therefore, all model runs in this study were simulated using Collins bottom friction. The boundary files containing two-dimensional (2D) directional wave spectra were generated along the SWAN model domain using the WAVEWATCH III (WW3) [49] model with a spatial resolution of 0.5° × 0.5°. The WW3 domain covers the entire Indian Ocean from 60° south (S) to 30° N and 15° E to 130° E (Figure 1a), and accommodates the distant swells propagating from the South Indian Ocean/Atlantic Ocean into the North Indian Ocean [50,51,52].

2.2.4. SWAN Model Set-Up with Vegetation

The best available form to describe the effect of vegetation on wind-waves is representing the vegetation by vertical rigid cylinders, as postulated by [22]. This method provides a reasonably good physical representation of the vegetation and its implementation in SWAN. The vegetation properties that were considered in this formulation include vegetation height, vegetation diameter, vegetation density, and drag coefficient. The calibration parameter, which is important to determine wave dissipation due to vegetation, is the drag coefficient (Cd). By varying drag coefficients, different types of vegetation (both stiff and flexible) can be modeled. Reference [53] first implemented a vegetation module in the SWAN model by including vegetation characteristics and hydraulic conditions. [24] further developed this model by including vertical layers such as those seen in mangroves (e.g., a bottom layer containing aerial roots, higher layers containing leaves and branches) and horizontal variation in vegetation characteristics (e.g., different species being present in different areas) with angular frequency and wave number in the model. Wave attenuation in vegetation mainly depends on the geometrical (number of stems, diameter, branching, and height) and biophysical (stiffness and buoyancy) characteristics of the vegetation, as well as on the hydrodynamic conditions including water depth, wave period, and wave height. In our present study, the SWAN model was setup to estimate wave height reduction due to actual mangroves, as well as for assumed vegetation by changing the vegetation parameters in the model.
The calculation of energy loss was based on the actual work carried out by the vegetation due to plant-induced forces acting on the fluid, expressed in terms of the Morison Equation [54].
ε υ = 2 3 π ρ C d b υ N ( g k 2 σ ) 3 s i n h 3 k α h + 3   s i n h k α h 3 k c o s h 3 k h H 3 ,
where ευ is the time-averaged rate of energy dissipation per unit area, Cd, bv and N are the vegetation drag coefficient, diameter, and spatial density (number of stands per unit area), k is the wave number, σ is the wave frequency, α is the ratio of plant height to water depth, h is the water depth, and H is the wave height at that point. For the vegetation species present in the study region, the control values of vegetation parameters were determined based on the literature, as well as personal communications with experts in the field. Vegetation height provided in the model considered the average height (3 m); the canopy of the mangroves usually remained above mean high water level (MHWL). On average, the stem diameter of the plants was around 0.3 m. The estimated area of vegetation was around 8 ha (80,000 m2), and the number of mangrove plants estimated from the satellite imagery was 14,000. This provided a vegetation density (number of stems/area of vegetation) of 0.175/m2. However, we conducted numerical experiments by varying the stem diameter from 0.3 m to 0.2 and 0.1 m, and density from 0.20 to 0.35/m2. The sensitivity analyses were carried out by varying the drag coefficients, density of the vegetation, and stem diameter. From the incident and transmitted wave heights, the wave reduction factor was computed.

2.2.5. Bulk Drag Coefficient of Vegetation

Reference [13] estimated the effect of the flow resistance due to mangroves as a bottom friction. This drag coefficient, Cd, is approximated by
C d = 32 2 π h 2 H i n Δ x ( H i n H t r a n s 1 ) ,
Where h is the water depth, Hin is the incident wave height, H t r a n s is the transmitted wave height, and Δx is the distance between two sensors deployed in the field. Cd is also influenced by the vegetation density. As waves travel over a vegetated bed, surface waves exert force on the plant stems and, in this process, dissipate some of their energy [55].
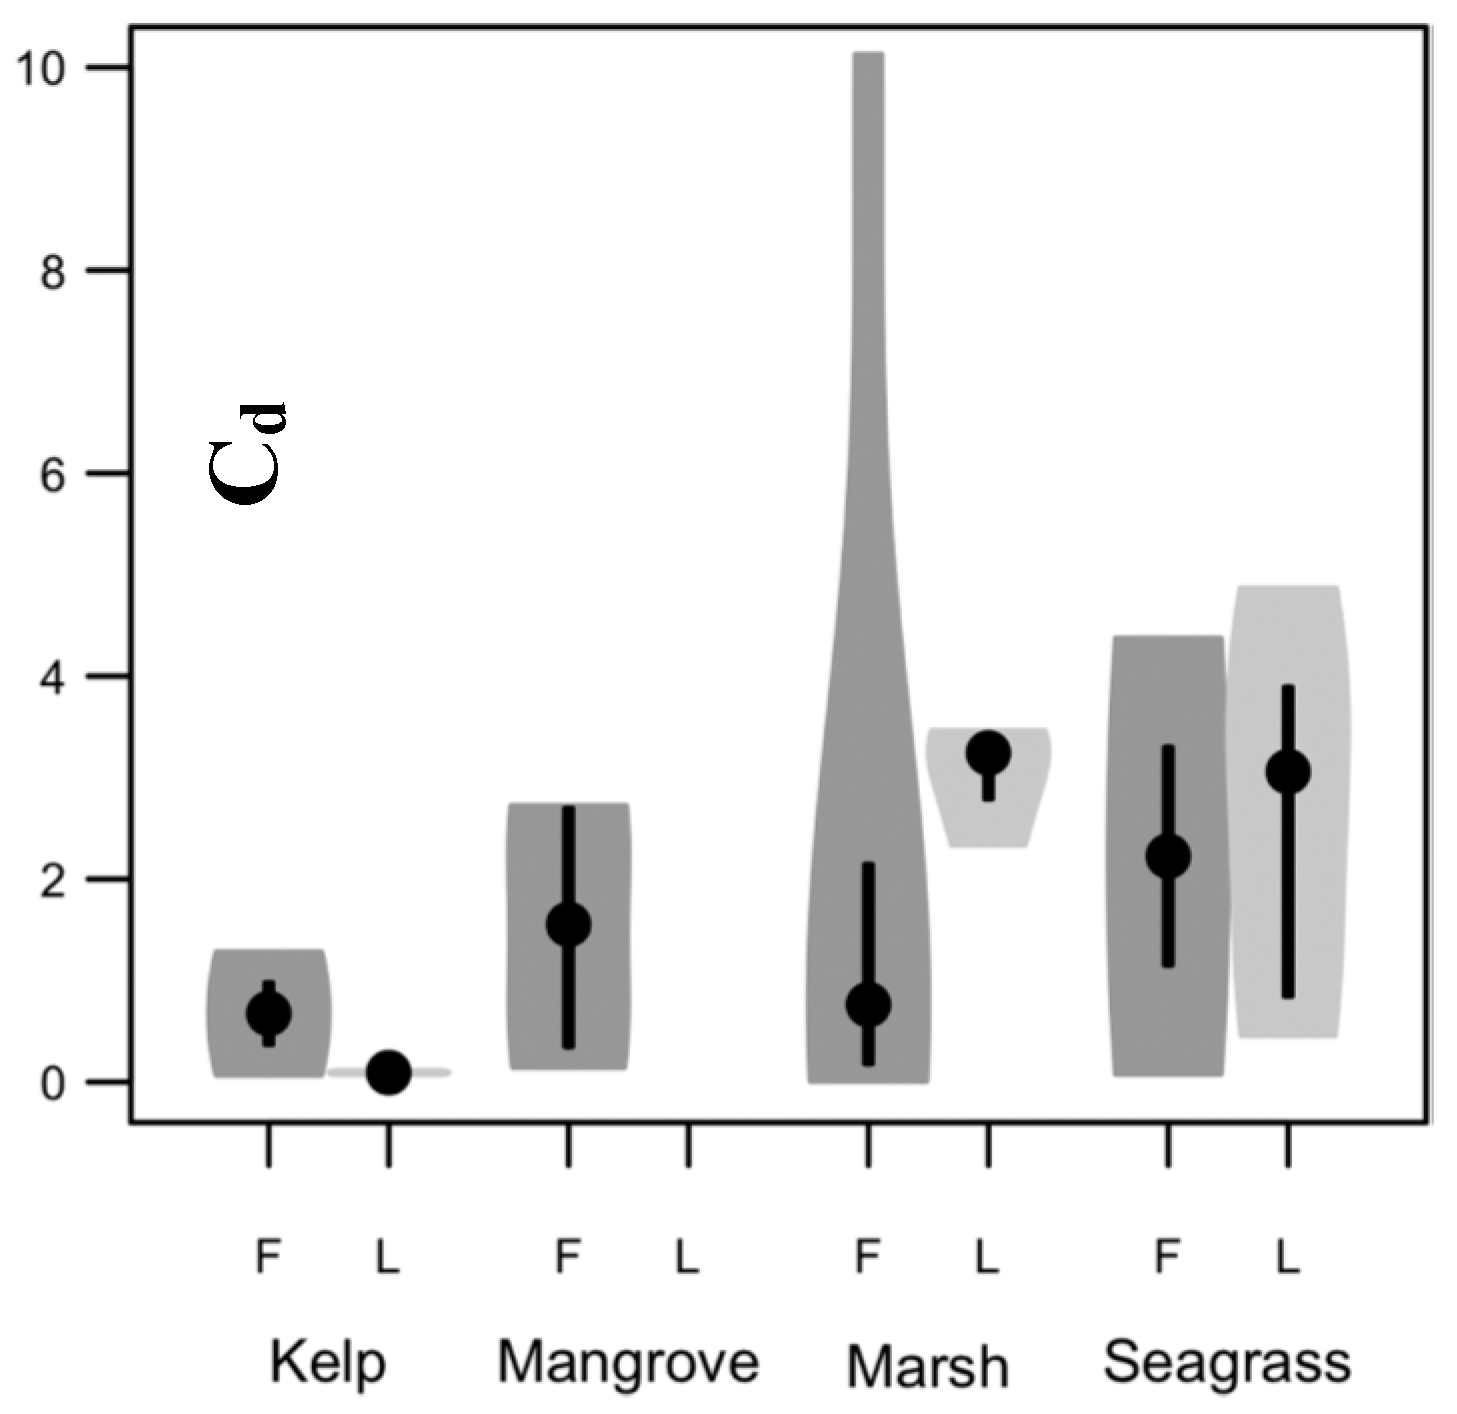
The drag also depends on the flow conditions [56,57]. Two important numbers used to define the type of forces for given flow conditions are the Reynolds number (Re) and the Keulegan–Carpenter number (KC) [58]. Previous studies reported correlations between Cd and non-dimensional quantities Re or KC [23,56,59,60]. When Re is relatively small, the flow is smooth and viscous forces dominate, and, when Re is large, the flow is turbulent and inertial forces dominate. On the other hand, KC is relatively low when inertial forces dominate and high when drag forces dominate. Reference [21] reviewed all the earlier studies carried out in different habitats of vegetation at different locations, and estimated the value of Cd based on the habitats (details related to only mangroves are listed in Table 1). The estimated average bulk drag coefficient from various field measurements for mangroves was 1.5 (Figure 3). We calculated Cd using the equation in [26], based on the measured data, and the value obtained was 0.5. The model was, thus, setup with the Cd values obtained from both methods; the results are discussed in the next section.

3. Results and Discussion

3.1. Analysis of Measured Data

The measured pressure data were analyzed and wave characteristics were calculated using the zero-crossing method for each station using MATLAB programs developed by us. Wave statistics were calculated after de-trending the pressure for any low-frequency tidal component present. Significant wave heights and mean wave periods were extracted from the measured data. Significant wave heights (measured) and predicted tide elevations off Mumbai from 5–8 August 2015 are shown in Figure 4.
Wind was relatively stable and predominantly from the west-southwest direction near the coast during the above period; waves approached the coast nearly in the westerly direction. Due to a logistics problem, measurements could be carried out only for one tidal cycle (in the night) each day. Water level was sufficient to make measurements in the vegetation area only on the first day, and, on the subsequent days, water level was too low for taking measurements. The reason for this was attributed to the low wave heights recorded by the sensors.

3.2. Wave Energy Dissipation in the Mangrove Area

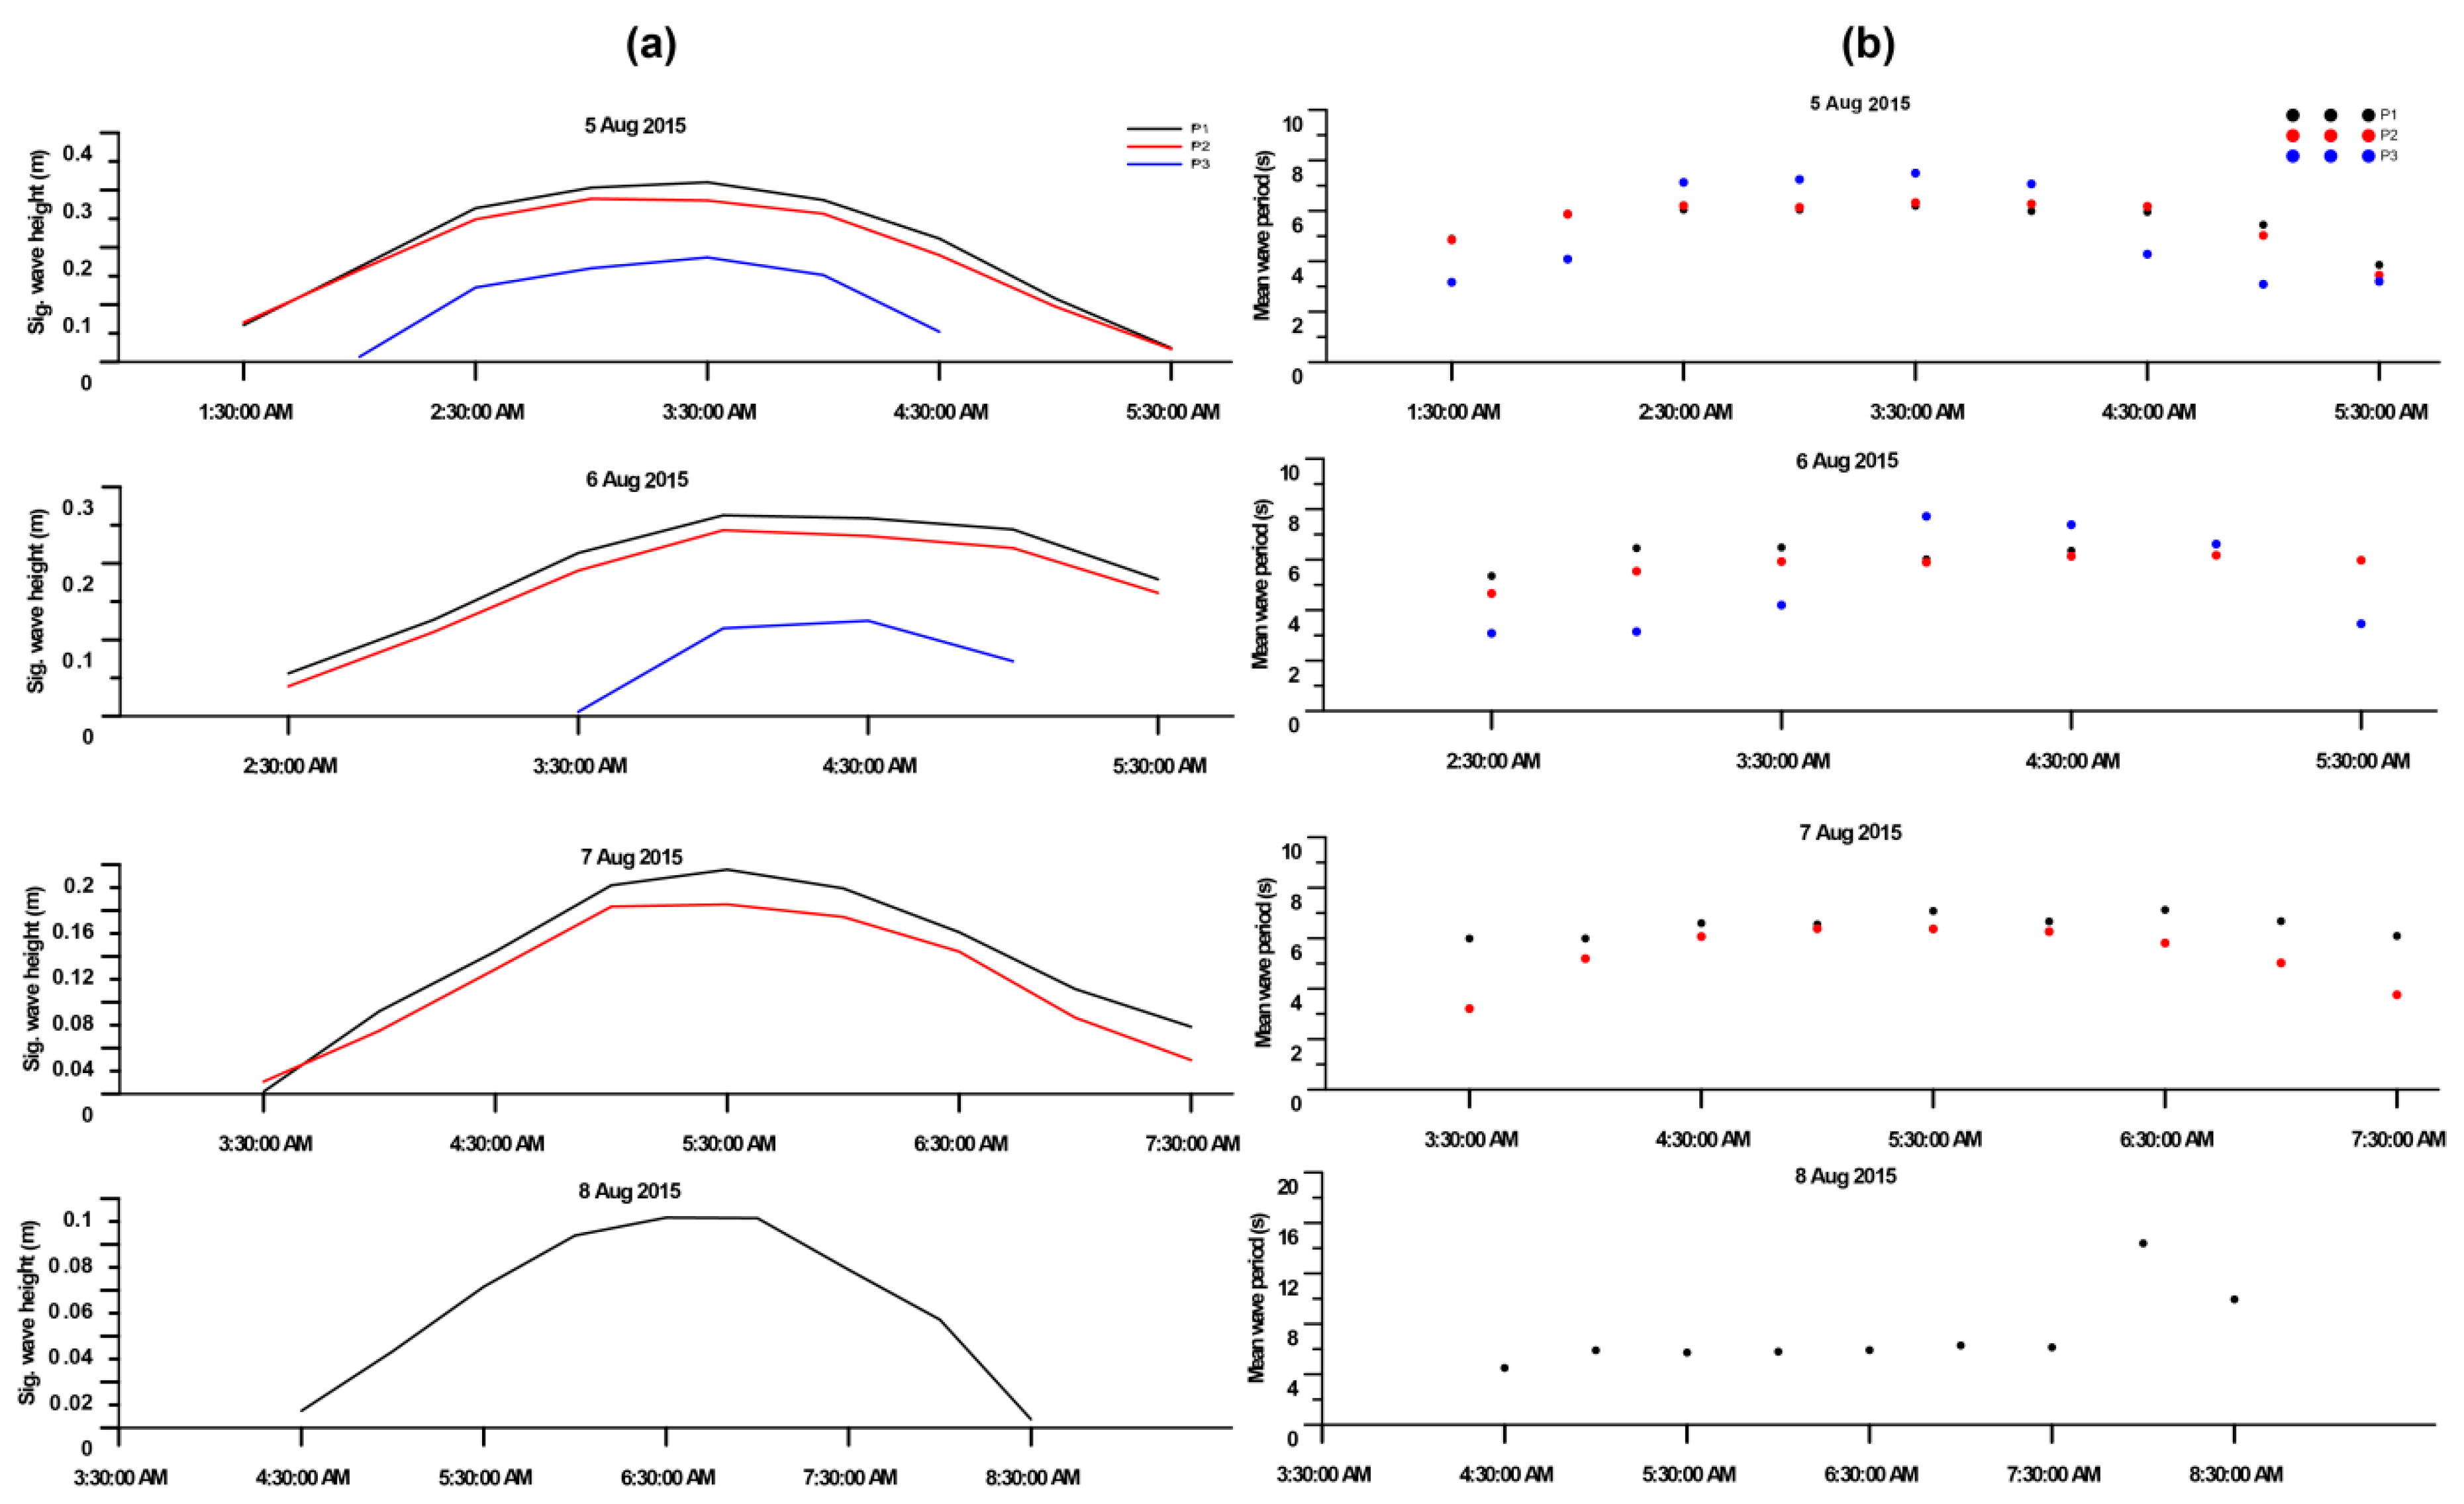
The tidal elevations were predicted using the MIKE 21 inbuilt global tide model. MIKE 21 is a depth-averaged two-dimensional hydrodynamic model, MIKE 21 HD, developed by DHI Water and Environment, Denmark (http://www.dhigroup.com). It has inbuilt global tide model data, which represent the major diurnal (K1, O1, P1, and Q1) and semidiurnal tidal constituents (M2, S2, N2, and K2) with a spatial resolution of 0.25° × 0.25° based on TOPEX/POSEIDON altimetry data. Maximum water level predicted was 3.8 m (Figure 4). A maximum wave height of ~0.3 m with mean wave period ranging between 3 s and 6 s was recorded only on the first day. The significant wave height (Hs) time series of each sensor (Figure 5) show that wave heights experienced attenuation along the transect when the waves approached the vegetation zone. The reduction in wave height was the highest (up to 52%) at P3 and the lowest (10%) at P2. The highest wave height reduction was observed at P3 due to dense vegetation and the attenuation of waves by the matrix of mangroves compared to that at P2. However, a minimal change in mean wave period was observed when the waves traveled from P1 to P3 (Figure 5), and wave periods ranged between 3 s and 8 s (except for a few higher values on 8 August 2015).
In the first two days, maximum Hs observed was 0.3 m at the P1 location and 0.28 m at P2. During these days, a very good relationship was observed (Figure 6) between the water level and wave height (up to R2 = 0.99), but it was not linear. In the last two days of the measurements, waves with a maximum Hs of 0.18 m at P1 and 0.15 m at P2 were recorded, as the water level was relatively lower. At the P3 location, the wave heights were small with a maximum Hs of ~0.15 m on the first day of the measurement period. It may be noted that location P2 lies inside the vegetation and, on the last day, due to low water level, the corresponding wave heights were very small.

3.3. Model Validation: No Vegetation

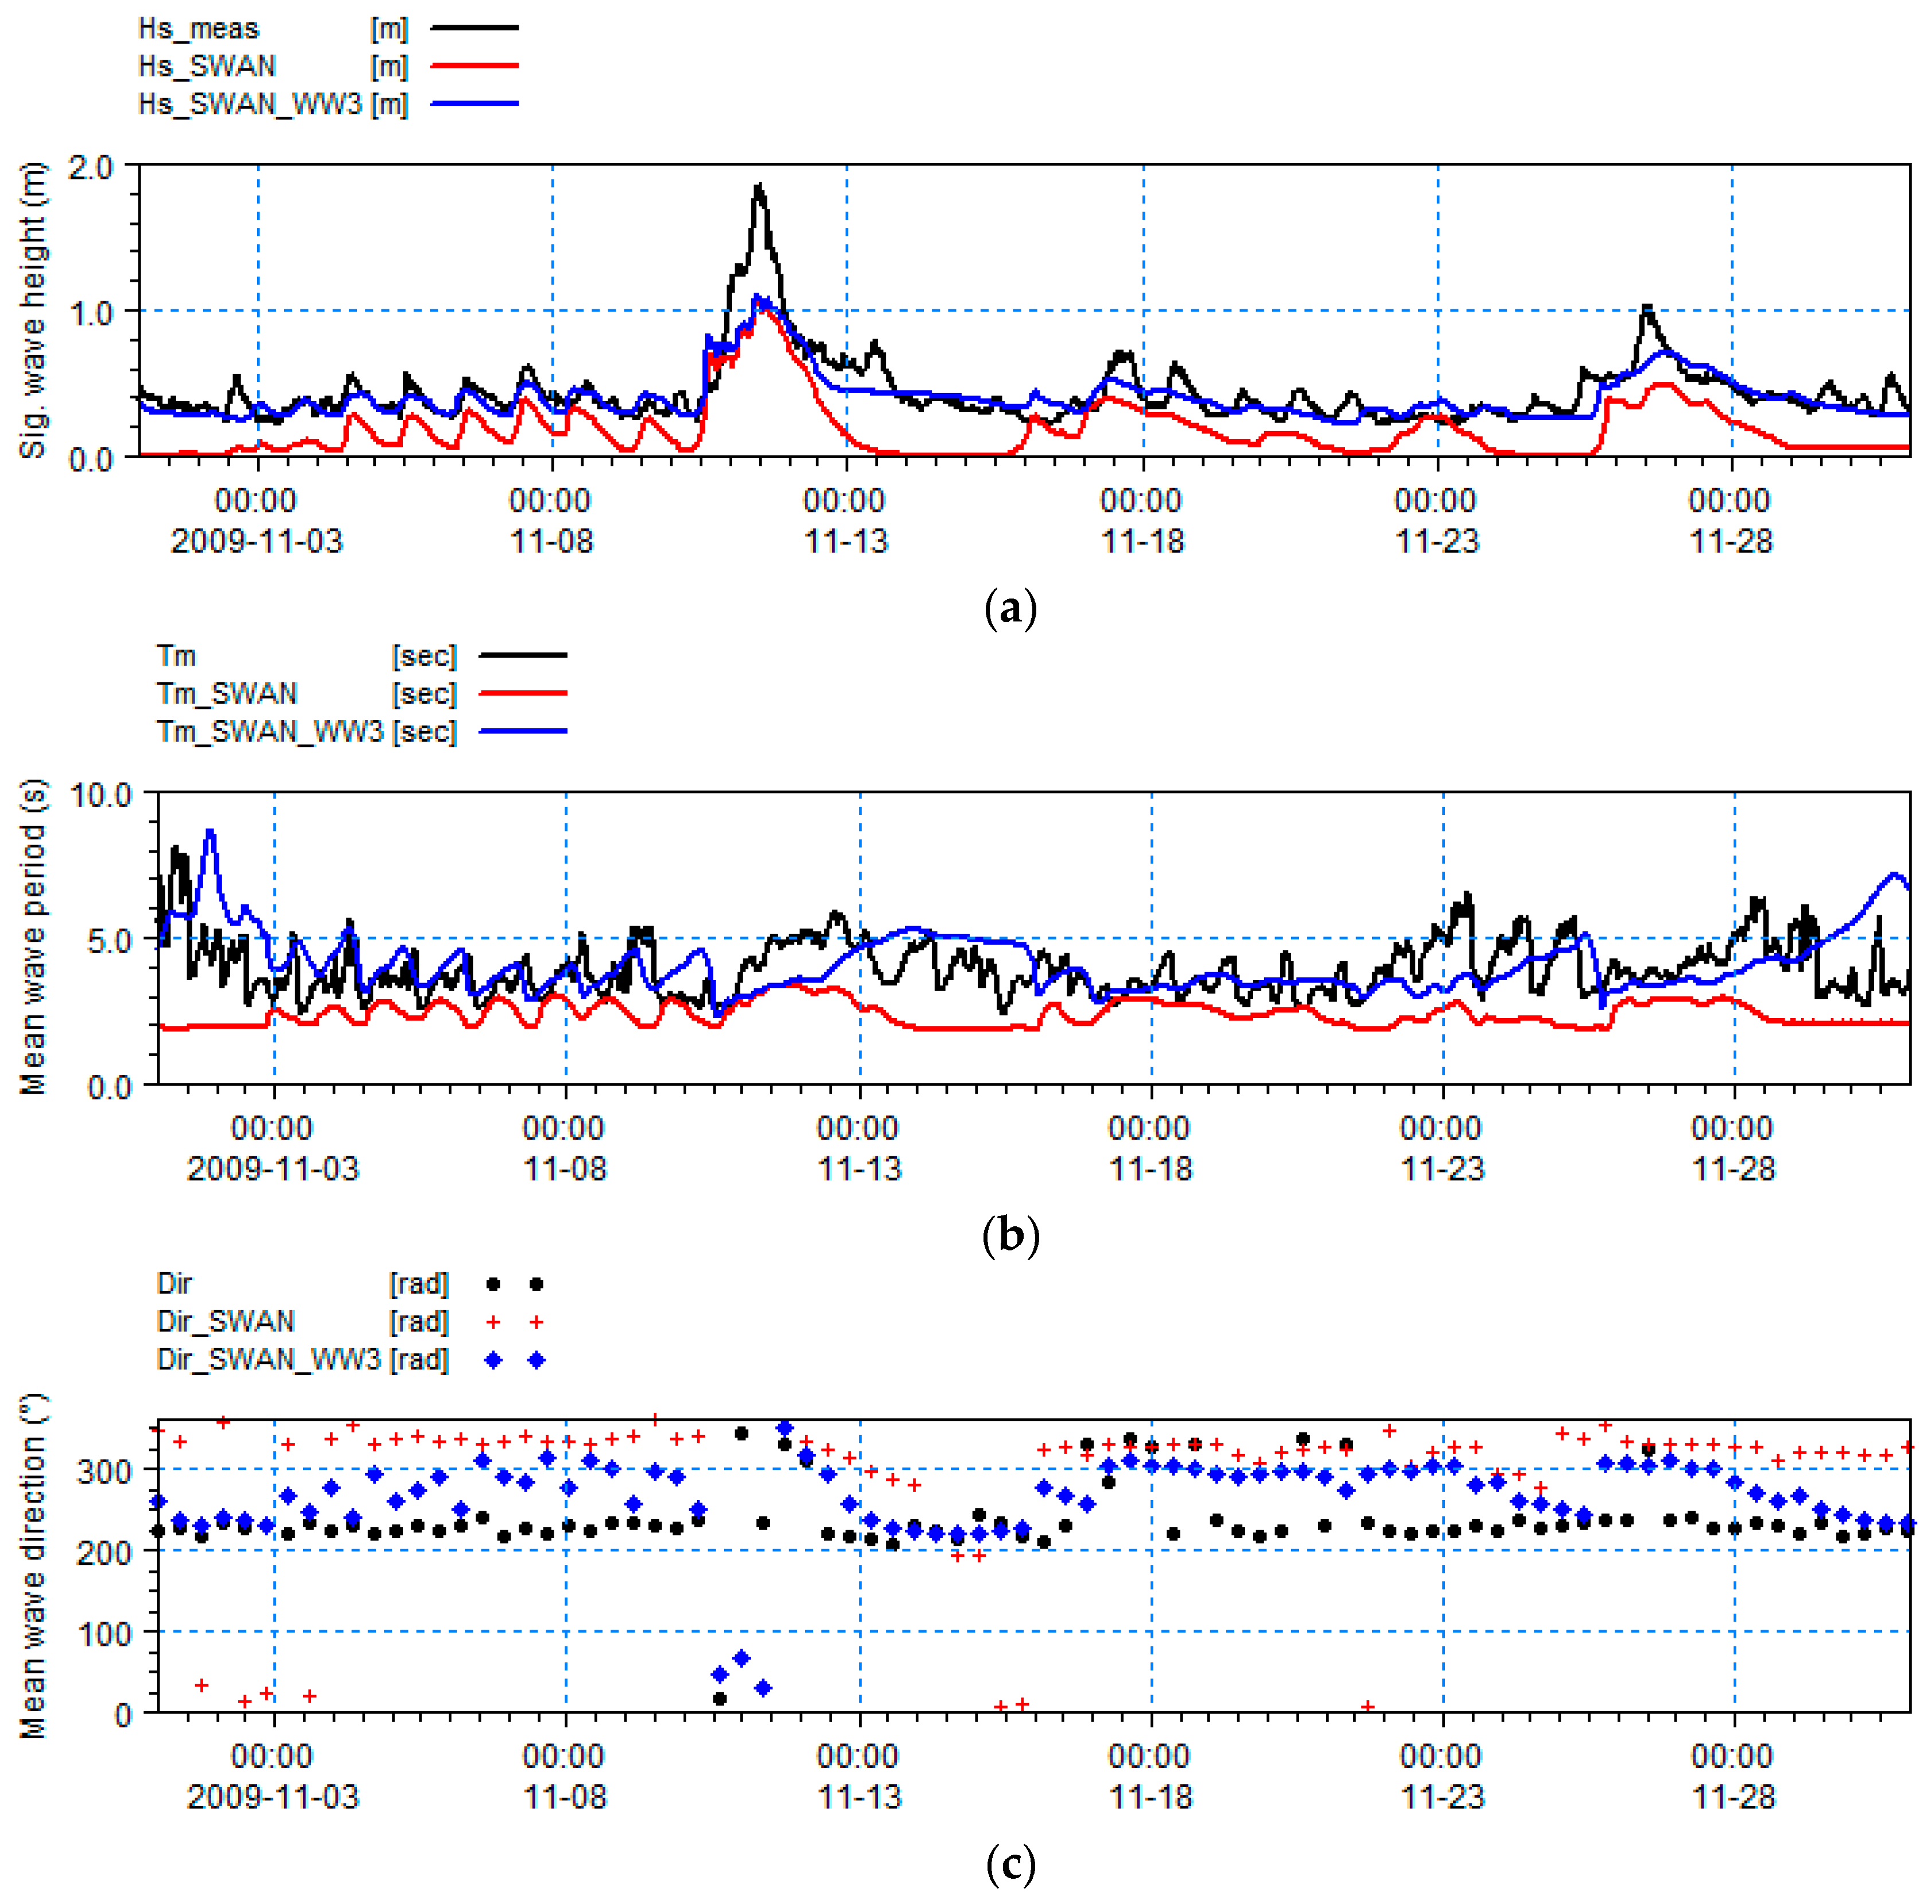
Numerical experiments were conducted with various formulations in order to predict waves off Mumbai accurately. Initially, the SWAN model was setup in standalone mode with default settings on the open boundaries (without boundary information from the WAVEWATCH 3 [62] (WW3) model). The SWAN only model results were validated with available wave data from the buoy deployed off Mumbai at a water depth of 15m water from October–November 2009. The comparison showed an underestimation in the modeled wave heights. The boundary conditions obtained from the WW3were used to force the SWAN model domain, and that resulted in an improvement in the results. Figure 7 shows the comparison between modeled wave parameters with SWAN standalone and SWAN nested with WW3 and the measured wave parameters. It is very evident from this comparison that nesting of SWAN with WW3 captured swells arriving from as far as the Southern Ocean. It may be noted that the cyclone Phyan passed through the coastal area off Mumbai on 11 November 2009 (during this measurement period). However, ERA-I winds under estimated the cyclone winds, thereby predicting low Hs. As the study region was not under the direct influence of this cyclone, the maximum Hs recorded (~2 m) was comparatively lower than even the normal monsoon waves recorded in this region (~3–4 m). It is significant to note that other wave parameters (period and direction) showed considerable improvements when SWAN was nested within WW3 (Figure 7).

3.4. Reduction in Wave Energy Due to Change in Vegetation Density and Cd

The vegetation parameters were varied in the numerical experiments to investigate model sensitivity to the presence of vegetation. SWAN was run for a vegetation height of 3.0 m with stem diameter varying between 0.1 and 0.3 m and density of the mangroves between 0.175 and 0.350/m2 (number of stems per m2). To compute wave attenuation, the major parameter varied was drag coefficient Cd. The direction of the incident waves was taken as normal to the mangrove forest, as was the case when the measurements were performed. The vegetation was considered homogeneous with the characteristics in Table 2. It may be noted that the model was setup based on the bathymetry of ETOPO1 with a 1 km × 1 km resolution. This bathymetry data were augmented with the Naval Hydrographic Office (NHO) chart data for better resolution. Various sensitivity analyses were carried out with the vegetation module of SWAN to understand the role of different parameters affecting the wave attenuation process.

3.4.1. Sensitivity Analysis with Vegetation

The transmitted wave heights were analyzed under different groupings depending on the input parameters provided (vegetation density, vegetation diameter, and drag coefficient). Wave attenuation through the mangrove forest was quantified using the wave reduction factor (r), defined by the following equation [53]:
r = ( H i n H t r a n s ) H i n
This factor could be linked directly to the effectiveness of the forest in attenuating waves. The wave reduction factor, from different cases, was compared to understand the relative importance of different vegetation parameters.
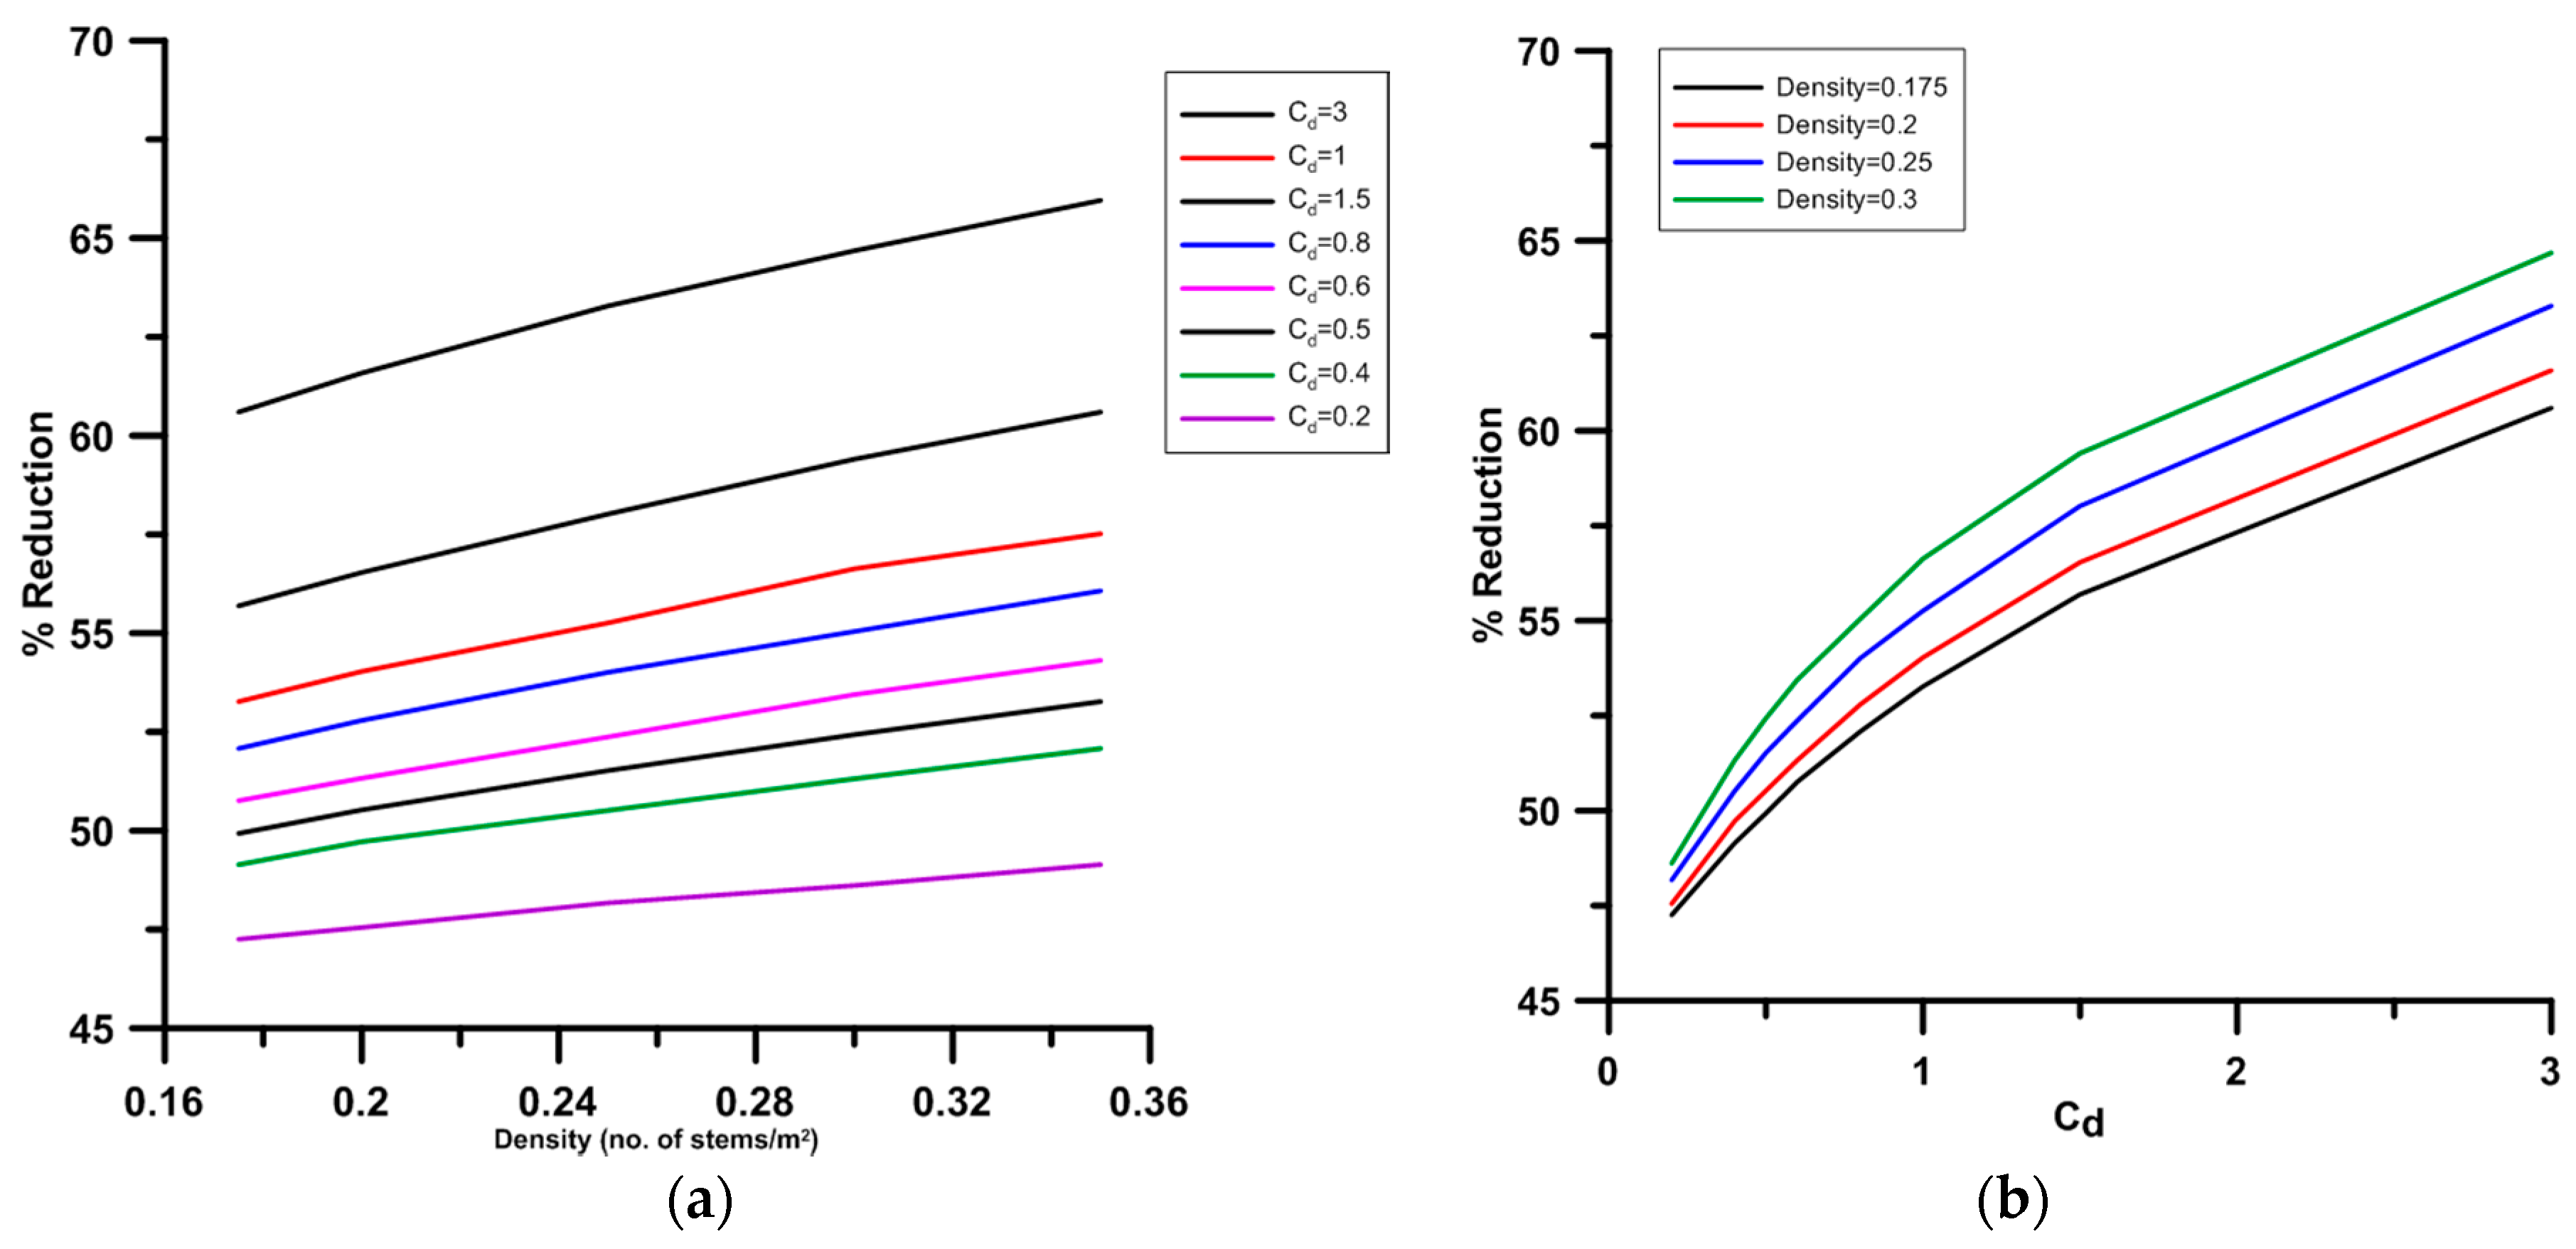
It was observed that wave attenuation increased with an increase in Cd, density and stem diameter (Tables S1 and S2, Supplementary Materials; Figure 8a,b). The resistance of the vegetation generates a drag force that causes a reduction in wave height [26]. Model runs executed with Cd values obtained from the literature (Cd = 1.5) and estimated for the Mumbai region (Cd = 0.5) showed that attenuation varied from 55.69% to 49.93% (Table S1, Supplementary Materials), i.e., a change of ~6%. When Cd was further increased to 3.0, wave attenuation increased by about 10–15%.As shown in Table S1 (Supplementary Materials), wave attenuation was also computed with other Cd values. When the stem diameter was varied from 0.3 m to 0.2 m and 0.1 m, wave attenuation decreased for any given Cd values (Tables S1 and S2, Supplementary Materials).

3.4.2. Wave Height Attenuation Due to Vegetation

SWAN was run with vegetation, and, from the model runs, incident wave parameters and transmitted wave parameters were extracted at the vegetation area. With a vegetation density of 0.175/m2, stem diameter of 0.3m, and drag coefficient varying from 0.4 to 1.5, the model reproduced attenuation ranging from 49% to 55% (Table S1, Supplementary Materials), which is comparable to the measurement (52%; refer to Section 3.2). Reference [27] studied attenuation in a mangrove area in CanGio Mangrove Biosphere Reserve, Southern Vietnam, with the number of trunks varying in the range of 1–21/m2 with mean diameter in the range 0.011–0.379 m, and found that reduction in wave height was about 20% over 100 m in the mangrove forest. These numbers varied depending on the layers and the cells measured in the mangrove site [27]. Similarly, Reference [36] studied wave attenuation in Mangrove Island, considering the stem density varying between 0.5 and 1.7/m2 and vegetation width of 300 m, and found that attenuation reached up to 60% at the port due to the effect of the mangrove island.
The present model results are in agreement with the above studies, as well as the measurements carried out off Mumbai. However, the marginal difference found in the wave height reduction was due to vegetation parameters and resolution of the bathymetry considered in the model. The results obtained in the present study will be very useful in planning the coastal protection of mangroves off Mumbai, as well many other coastal places in the world, which are at risk due to sea level rise [33] or other parameters leading to climate change.

3.4.3. Wave Spectral Changes in the Vegetation Area

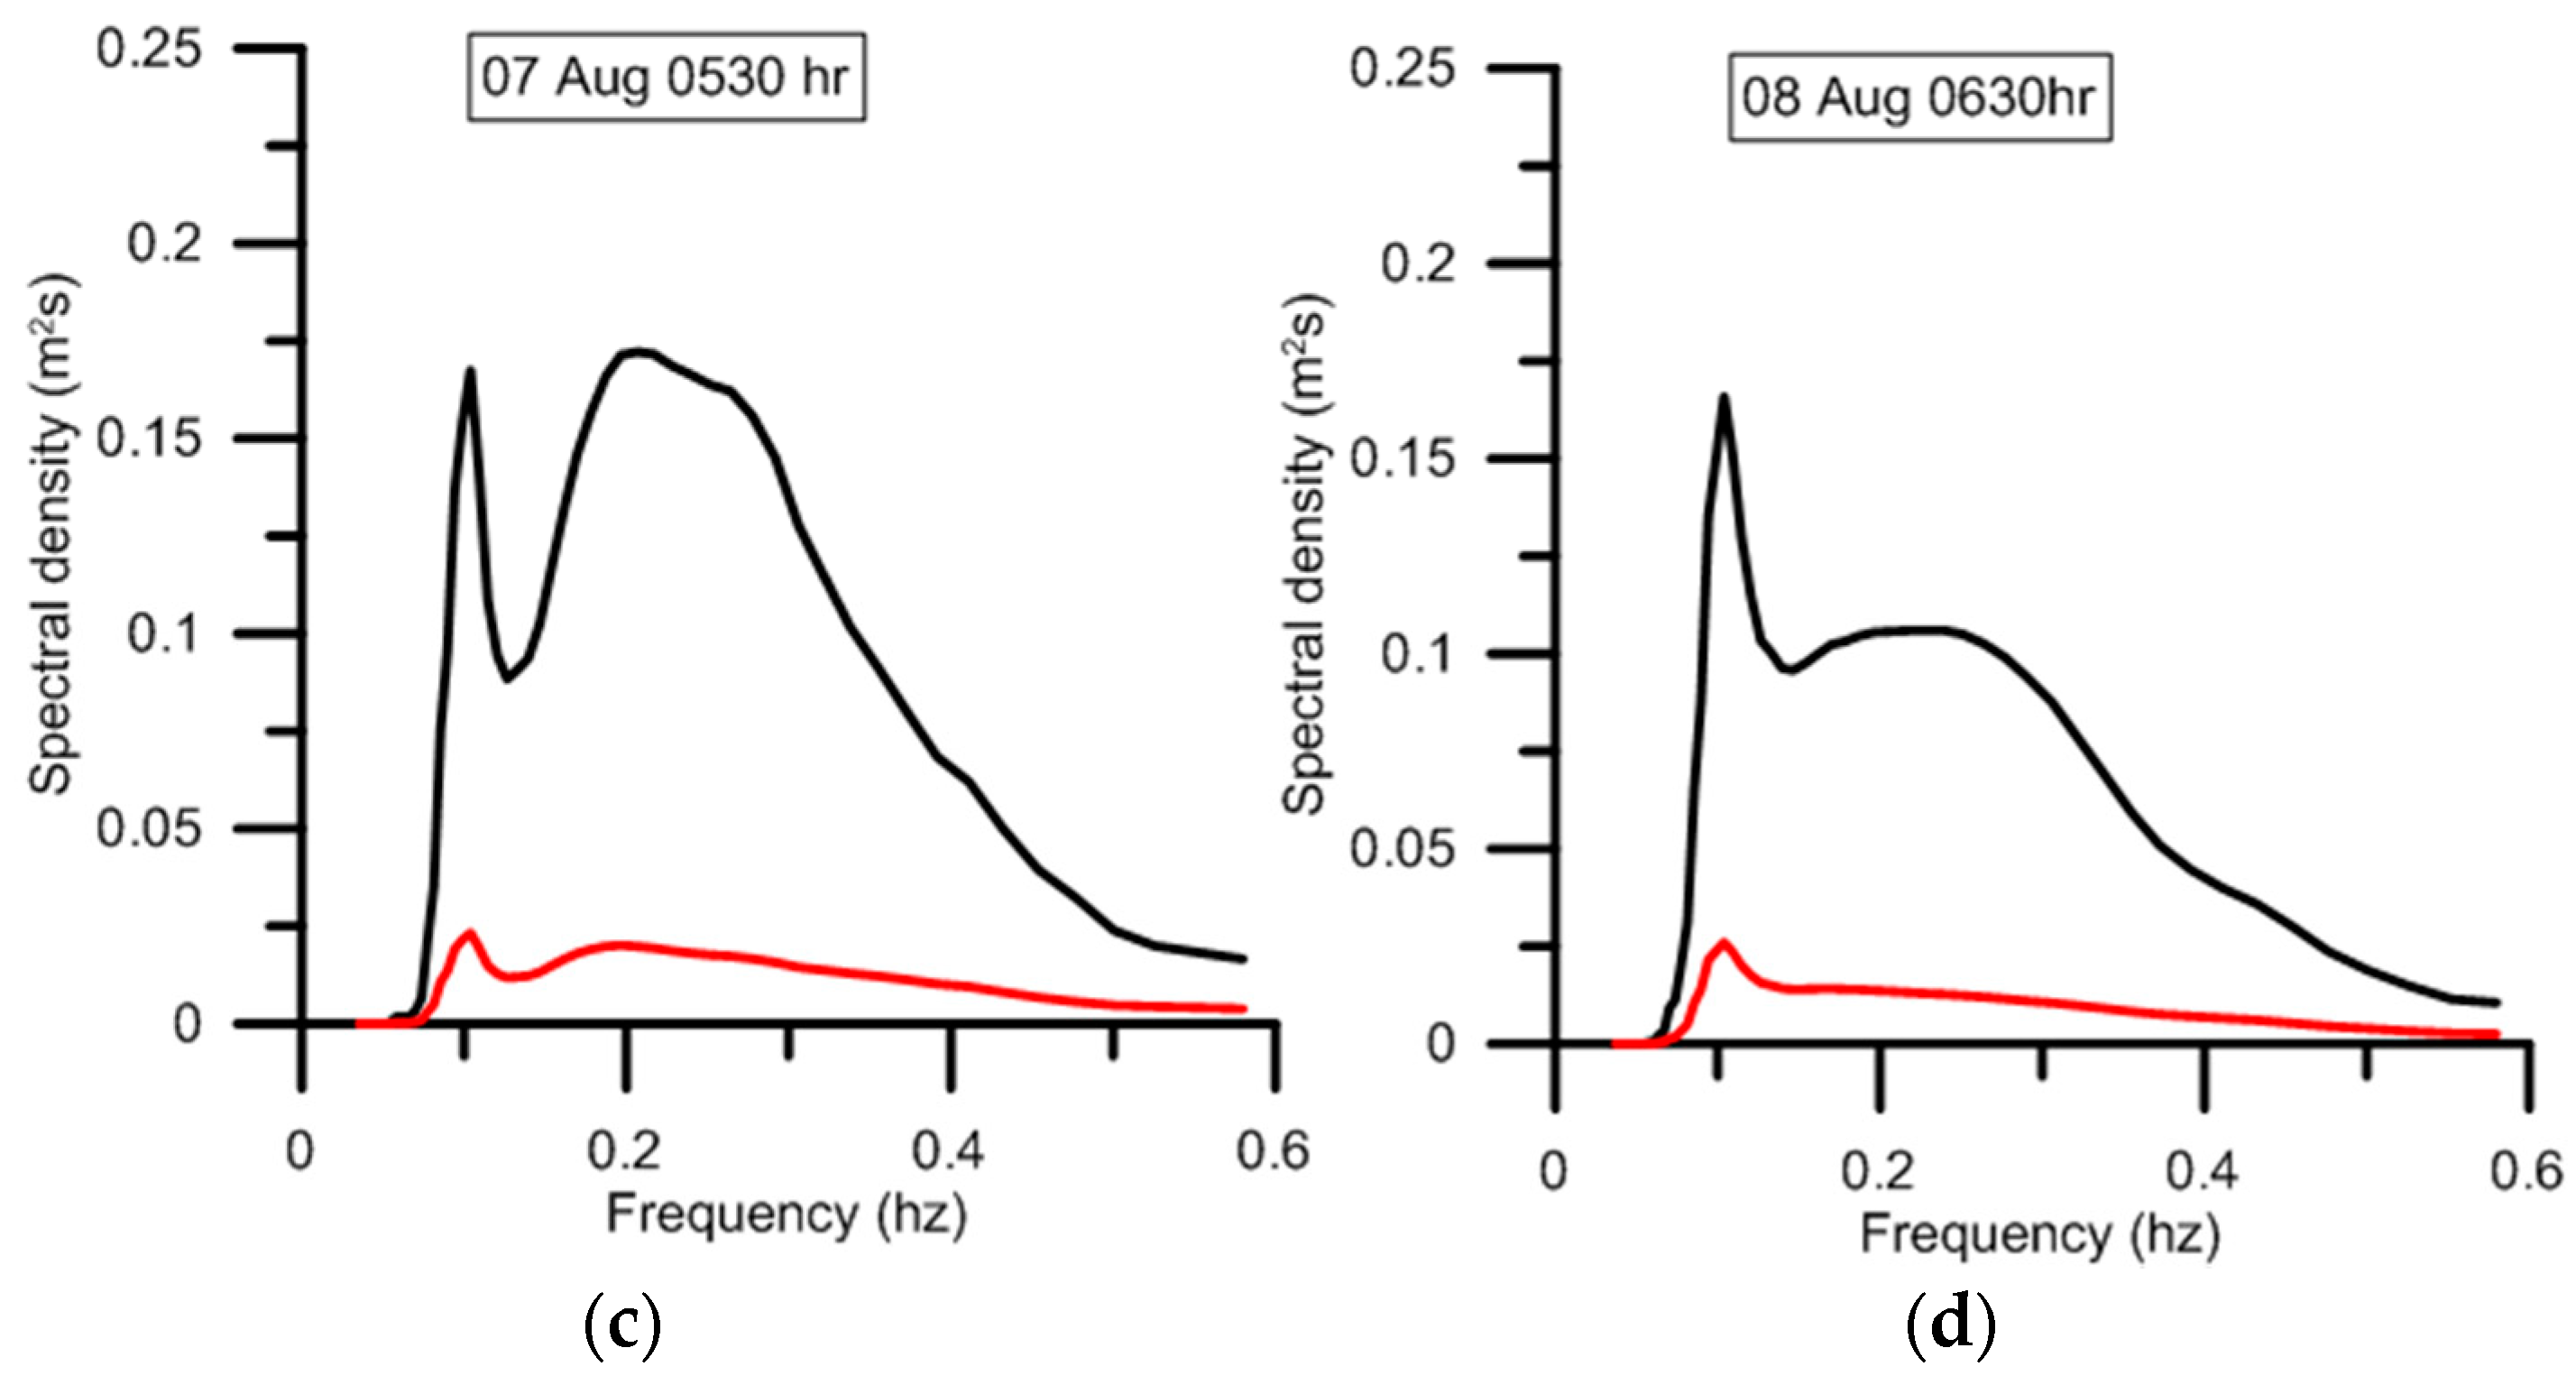
Time series measurements and model results support the hypothesis that the mangroves act as an efficient energy buffer in shallow and near-shore waters for a wide range of wind and wave conditions of typical meso- to macro-tidal coasts. Evidence for this role was found when the wave spectra obtained from the model were compared. Typical one-dimensional (1D) wave energy spectra were extracted at two locations, one in front of the vegetation (P1) and another inside the vegetation (P3). Figure 9 shows an inter-comparison of wave energy spectra at both these locations for select time intervals during consecutive days (high tide). Wave energy was much less at P3 than P1. These model results clearly indicate the contribution of mangrove vegetation as a friction factor for incoming waves and acting as a buffer to high waves.

4. Conclusions

The present study focused on the coastal region (Mumbai), which is vulnerable to climate change in the form of sea level rise and flooding, as well as monsoon high waves. The analysis of measured data collected from the mangrove forest off Mumbai presented wave attenuation on the order of 50%, although the width of the vegetation is not sufficient to provide higher wave attenuation. A wave model was setup for the Mumbai coastal region to study wave energy dissipation due to mangroves. The numerical experiments showed that, for a vegetation density of 0.175/m2, a stem diameter of 0.3m, and a drag coefficient varying from 0.4 to 1.5, the model reproduced wave attenuation ranging from 49 to 55%, which was comparable with measurements (52%), as well as earlier studies. The sensitivity analyses provided knowledge on different vegetation parameters affecting the wave attenuation. The attenuation rate corresponding to varying physical parameters of mangrove forest was estimated using measurements and numerical modeling. The limitation of the present study is that the analysis was carried out only for a short time window during the monsoon season. A more detailed and rigorous exercise with planned field campaigns is warranted in a better perspective to understand the dissipative effects of mangroves in all wave conditions, including extreme weather events, which will form the scope of future work.

Supplementary Materials

The following are available online at https://www.mdpi.com/1996-1073/12/22/4286/s1: Table S1: Wave height attenuation for different vegetation parameters (vegetation height = 3 m; stem dia = 0.3 m); Table S2:Wave height attenuation for different Cd values and constant vegetation parameters (vegetation height = 3 m; density = 0.175).

Author Contributions

Conceptualization, S.S.V. and P.V.; data curation, P.P. and M.J.; formal analysis, M.J.; investigation, S.S.V. and P.V.; methodology, S.S.V. and P.K.B.; project administration, P.V.; software, P.K.B. and M.J.; supervision, S.S.V.; validation, S.S.V.; writing—original draft, S.S.V.; writing—review and editing, P.V. and R.A.J.

Funding

This research was funded by the Department of Science and Technology, Government of India (WOS-A), grant number (SR/WOS-A/ES-17/2012).

Acknowledgments

We thank the Director, CSIR-NIO, Goa for providing the facility to carry out this work. The first author acknowledges the Department of Science and Technology, Government of India for supporting the research work through WOS-A (SR/WOS-A/ES-17/2012). The fieldwork data sharing is limited by our institute data sharing policy. The ERA-Interim wind data were downloaded from ECMWF (http://apps.ecmwf.int/datasets/). We are thankful to SWAN model developers for providing the source code. We acknowledge CSIR-NIO for providing the high-performance computing domain, HPC-Pravah, for running the model. We are also thankful to Ravish Naik for his help during field work, Ankita Misra for helping in satellite image processing, and Chaitanya for assisting in the preparation of figures. The NIO contribution number is 6454.

Conflicts of Interest

The authors declare no conflicts of interest.

References

  1. Friess, D.A.; Phelps, J.; Leong, R.C.; Lee, W.K.; Wee, A.K.S.; Sivasothi, N.; Oh, R.R.Y.; Webb, E.L. Mandai mangrove, Singapore: Lessons for the conservation of Southeast Asia’s mangroves. Scopus 2012, 25, 55–65. [Google Scholar]
  2. Ye, Y.; Tam, N.F.Y.; Wong, Y.S.; Lu, C.Y. Growth and physiological responses of two mangrove species (Bruguiera gymnorrhiza and Kandelia candel) to waterlogging. Environ. Exp. Bot. 2003, 49, 209–221. [Google Scholar] [CrossRef]
  3. Ye, Y.; Tam, N.F.Y.; Wong, Y.S.; Lu, C.Y. Does sea level rise influence propagule establishment, early growth and physiology of Kandelia candel and Bruguiera gymnorrhiza? J. Exp. Mar. Biol. Ecol. 2004, 306, 197–215. [Google Scholar] [CrossRef]
  4. Ye, Y.; Gu, Y.T.; Gao, H.Y.; Lu, C.Y. Combined effects of simulated tidal sea-level rise and salinity on seedlings of a mangrove species, Kandelia candel (L.) Druce. Hydrobiologia 2010, 641, 287–300. [Google Scholar] [CrossRef]
  5. Cardona-Olarte, P.; Twilley, R.R.; Krauss, K.W.; Rivera-Monroy, V. Responses of neotropical mangrove seedlings grown in monoculture and mixed culture under treatments of hydroperiod and salinity. Hydrobiologia 2006, 569, 325–341. [Google Scholar] [CrossRef]
  6. Lu, W.; Chen, L.; Wang, W.; Fung-Yee Tam, N.; Lin, G. Effects of sea level rise on mangrove Avicennia population growth, colonization and establishment: Evidence from a field survey and greenhouse manipulation experiment. Acta Oecologica 2013, 49, 83–91. [Google Scholar] [CrossRef]
  7. Mangora, M.M.; Shalli, M.S. Sacred Mangrove Forests: Who Bears the Pride? In Science, Policy and Politics of Modern Agricultural System: Global Context to Local Dynamics of Sustainable Agriculture; Behnassi, M., Shahid, S.A., Mintz-Habib, N., Eds.; Springer Netherlands: Dordrecht, The Netherlands, 2014; pp. 291–305. [Google Scholar]
  8. Yáñez-Espinosa, L.; Flores, J. A Review of Sea-Level Rise Effect on Mangrove Forest Species: Anatomical and Morphological Modifications. Glob. Warm. Impacts - Case Stud. Econ. Hum. Health Urban Nat. Environ. 2011. [Google Scholar] [CrossRef]
  9. Alongi, D.M. The Impact of Climate Change on Mangrove Forests. Curr. Clim. Change Rep. 2015, 1, 30–39. [Google Scholar] [CrossRef]
  10. Blankespoor, B.; Dasgupta, S.; Lange, G.-M. Mangroves as a protection from storm surges in a changing climate. Ambio 2017, 46, 478–491. [Google Scholar] [CrossRef] [PubMed]
  11. Waite, R.; Burke, L.; Gray, E.; Beukering, P.; Brander, L.; McKenzie, E.; Pendleton, L.; Schuhmann, P.; Tompkins, E. Coastal Capital: Ecosystem Valuation for Decision Making in the Caribbean; World Resources Institute: Washington, DC, USA, 2014. [Google Scholar]
  12. Brinkman, R.M.; Massel, S.R.; Ridd, P.V.; Furukawa, K. Surface Wave Attenuation in Mangrove Forests. In Proceedings of the 13th Australasian Coastal and Ocean Engineering Conference and the 6th Australasian Port and Harbour Conference, Christchurch, Newzealand, 7–11 September 1997; Volume 2, p. 909. [Google Scholar]
  13. Mazda, Y.; Magi, M.; Kogo, M.; Hong, P.N. Mangroves as a coastal protection from waves in the Tong King delta, Vietnam. Mangroves Salt Marshes 1997, 1, 127–135. [Google Scholar] [CrossRef]
  14. Mazda, Y.; Magi, M.; Ikeda, Y.; Kurokawa, T.; Asano, T. Wave reduction in a mangrove forest dominated by Sonneratia sp. Wetl. Ecol. Manag. 2006, 14, 365–378. [Google Scholar] [CrossRef]
  15. Massel, S.R.; Furukawa, K.; Brinkman, R.M. Surface wave propagation in mangrove forests. Fluid Dyn. Res. 1999, 24, 219–249. [Google Scholar] [CrossRef]
  16. Quartel, S.; Kroon, A.; Augustinus, P.G.E.F.; Van Santen, P.; Tri, N.H. Wave attenuation in coastal mangroves in the Red River Delta, Vietnam. J. Asian Earth Sci. 2007, 29, 576–584. [Google Scholar] [CrossRef]
  17. Barbier, E.B.; Koch, E.W.; Silliman, B.R.; Hacker, S.D.; Wolanski, E.; Primavera, J.; Granek, E.F.; Polasky, S.; Aswani, S.; Cramer, L.A.; et al. Coastal Ecosystem-Based Management with Nonlinear Ecological Functions and Values. Science 2008, 319, 321–323. [Google Scholar] [CrossRef] [PubMed]
  18. Gedan, K.B.; Kirwan, M.L.; Wolanski, E.; Barbier, E.B.; Silliman, B.R. The present and future role of coastal wetland vegetation in protecting shorelines: Answering recent challenges to the paradigm. Clim. Chang. 2011, 106, 7–29. [Google Scholar] [CrossRef]
  19. Zhang, K.; Liu, H.; Li, Y.; Xu, H.; Shen, J.; Rhome, J.; Smith, T.J. The role of mangroves in attenuating storm surges. Estuar. Coast. Shelf Sci. 2012, 102–103, 11–23. [Google Scholar] [CrossRef]
  20. Liu, H.; Ren, H.; Hui, D.; Wang, W.; Liao, B.; Cao, Q. Carbon stocks and potential carbon storage in the mangrove forests of China. J. Environ. Manag. 2014, 133, 86–93. [Google Scholar] [CrossRef] [PubMed]
  21. Pinsky, M.L.; Guannel, G.; Arkema, K.K. Quantifying wave attenuation to inform coastal habitat conservation. Ecosphere 2013, 4, 1–16. [Google Scholar] [CrossRef]
  22. Dalrymple Robert, A.; Kirby James, T.; Hwang Paul, A. Wave Diffraction Due to Areas of Energy Dissipation. J. Waterw. Port Coast. Ocean Eng. 1984, 110, 67–79. [Google Scholar] [CrossRef]
  23. Mendez, F.J.; Losada, I.J. An empirical model to estimate the propagation of random breaking and nonbreaking waves over vegetation fields. Coast. Eng. 2004, 2, 103–118. [Google Scholar] [CrossRef]
  24. Suzuki, T.; Zijlema, M.; Burger, B.; Meijer, M.C.; Narayan, S. Wave dissipation by vegetation with layer schematization in SWAN. Coast. Eng. 2012, 59, 64–71. [Google Scholar] [CrossRef]
  25. Wu, W. A 3-D phase-averaged model for shallow-water flow with waves in vegetated water. Ocean Dyn. 2014, 64, 1061–1071. [Google Scholar] [CrossRef]
  26. Mazda, Y.; Wolanski, E.; King, B.; Sase, A.; Ohtsuka, D.; Magi, M. Drag force due to vegetation in mangrove swamps. Mangroves Salt Marshes 1997, 1, 193–199. [Google Scholar] [CrossRef]
  27. Vo-Luong, P.; Massel, S. Energy dissipation in non-uniform mangrove forests of arbitrary depth. J. Mar. Syst. 2008, 74, 603–622. [Google Scholar] [CrossRef]
  28. QuangBao, T. Effect of mangrove forest structures on wave attenuation in coastal Vietnam. Oceanologia 2011, 53, 807–818. [Google Scholar] [CrossRef]
  29. Ysebaert, T.; Yang, S.-L.; Zhang, L.; He, Q.; Bouma, T.J.; Herman, P.M.J. Wave Attenuation by Two Contrasting Ecosystem Engineering Salt Marsh Macrophytes in the Intertidal Pioneer Zone. Wetlands 2011, 31, 1043–1054. [Google Scholar] [CrossRef]
  30. Yang, S.-C.; Riddin, T.; Adams, J.B.; Shih, S.-S. Predicting the spatial distribution of mangroves in a South African estuary in response to sea level rise, substrate elevation change and a sea storm event. J. Coast. Conserv. 2014, 18, 459–469. [Google Scholar] [CrossRef]
  31. Kathiresan, K. Mangrove Forests of India. Curr. Sci. 2018, 114, 976. [Google Scholar] [CrossRef]
  32. Dhiman, R.; Vishnu Radhan, R.; Eldho, T.I.; Inamdar, A. Flood risk and adaptation in Indian coastal cities: recent scenarios. Appl. Water Sci. 2018, 9, 5. [Google Scholar] [CrossRef]
  33. Unnikrishnan, A.S.; Nidheesh, A.G.; Lengaigne, M. Sea-level-rise trends off the Indian coasts during the last two decades. Curr. Sci. 2015, 108, 966–971. [Google Scholar]
  34. Hallegatte, S.; Ranger, N.; Mestre, O.; Dumas, P.; Corfee-Morlot, J.; Herweijer, C.; Wood, R.M. Assessing climate change impacts, sea level rise and storm surge risk in port cities: A case study on Copenhagen. Clim. Chang. 2011, 104, 113–137. [Google Scholar] [CrossRef]
  35. Ranger, N.; Hallegatte, S.; Bhattacharya, S.; Bachu, M.; Priya, S.; Dhore, K.; Rafique, F.; Mathur, P.; Naville, N.; Henriet, F.; et al. An assessment of the potential impact of climate change on flood risk in Mumbai. Clim. Chang. 2011, 104, 139–167. [Google Scholar] [CrossRef]
  36. Narayan, S.; Suzuki, T.; Stive, M.J.F.; Verhagen, H.J.; Ursem, W.N.J.; Ranasinghe, R. On the effectiveness of mangroves in attenuating cyclone induced waves. Coast. Eng. Proc. 2011, 1, 50. [Google Scholar] [CrossRef] [Green Version]
  37. Bhaskaran, P.K. Wave attenuation in presence of mangroves: A sensitivity study for varying bottom slopes. Int. J. Ocean Clim. Syst. 2017, 8, 126–134. [Google Scholar] [CrossRef] [Green Version]
  38. Joseph, A.; Balachandran, K.K.; Mehra, P.; Desai, R.G.P.; VijayKumar, K.; Agarvadekar, Y.; Revichandran, C.; Dabholkar, N. Amplified Msf tides at Kochi backwaters on the southwest coast of India. Curr. Sci. 2009, 97, 776–784. [Google Scholar]
  39. Vijay, V.; Biradar, R.S.; Inamdar, A.B.; Deshmukhe, G.; Baji, S.; Pikle, M. Mangrove mapping and change detection around Mumbai (Bombay) using remotely sensed data. Indian J. Geo-Mar. Sci. 2005, 34, 310–315. [Google Scholar]
  40. Memarsadeghi, N.; Mount, D.M.; Netanyahu, N.S.; Le Moigne, J. A fast implementation of the isodata clustering algorithm. Int. J. Comput. Geom. Appl. 2007, 17, 71–103. [Google Scholar] [CrossRef]
  41. Booij, N.; Ris, R.C.; Holthuijsen, L.H. A third-generation wave model for coastal regions: 1. Model description and validation. J. Geophys. Res. Oceans 1999, 104, 7649–7666. [Google Scholar] [CrossRef] [Green Version]
  42. Dee, D.P.; Uppala, S.M.; Simmons, A.J.; Berrisford, P.; Poli, P.; Kobayashi, S.; Andrae, U.; Balmaseda, M.A.; Balsamo, G.; Bauer, P.; et al. The ERA-Interim reanalysis: Configuration and performance of the data assimilation system. Q. J. R. Meteorol. Soc. 2011, 137, 553–597. [Google Scholar] [CrossRef]
  43. Cavaleri, L.; Rizzoli, P.M. Wind wave prediction in shallow water: Theory and applications. J. Geophys. Res. Oceans 1981, 86, 10961–10973. [Google Scholar] [CrossRef]
  44. Eldeberky, Y. Nonlinear transformation of wave spectra in the nearshore. Oceanogr. Lit. Rev. 1997, 4, 297. [Google Scholar]
  45. Janssen, P.A.E.M. Quasi-linear Theory of Wind-Wave Generation Applied to Wave Forecasting. J. Phys. Oceanogr. 1991, 21, 1631–1642. [Google Scholar] [CrossRef] [Green Version]
  46. Hasselmann, S.; Hasselmann, K.; Allender, J.H.; Barnett, T.P. Computations and Parameterizations of the Nonlinear Energy Transfer in a Gravity-Wave Specturm. Part II: Parameterizations of the Nonlinear Energy Transfer for Application in Wave Models. J. Phys. Oceanogr. 1985, 15, 1378–1391. [Google Scholar] [CrossRef] [Green Version]
  47. Battjes, J.A.; Janssen, J.P.F.M. Energy Loss and Set-Up Due to Breaking of Random Waves. Coast. Eng. 1978, 1978, 569–587. [Google Scholar]
  48. Collins, J.I. Prediction of shallow-water spectra. J. Geophys. Res. 1972, 77, 2693–2707. [Google Scholar] [CrossRef]
  49. Bennis, A.-C. User manual and system documentation of WAVEWATCH-IIITM version 3.14. Tech. Note MMAB Contrib. 2009, 276, 220. [Google Scholar]
  50. Aboobacker, V.M.; Rashmi, R.; Vethamony, P.; Menon, H.B. On the dominance of pre-existing swells over wind seas along the west coast of India. Cont. Shelf Res. 2011, 31, 1701–1712. [Google Scholar] [CrossRef]
  51. Samiksha, S.V.; Vethamony, P.; Aboobacker, V.M.; Rashmi, R. Propagation of Atlantic Ocean swells in the north Indian Ocean: A case study. Nat. Hazards Earth Syst. Sci. 2012, 12, 3605–3615. [Google Scholar] [CrossRef] [Green Version]
  52. Sabique, L.; Annapurnaiah, K.; Balakrishnan Nair, T.M.; Srinivas, K. Contribution of Southern Indian Ocean swells on the wave heights in the Northern Indian Ocean—A modeling study. Ocean Eng. 2012, 43, 113–120. [Google Scholar] [CrossRef]
  53. Burger, B. Wave Attenuation in Mangrove Forests; TU Delft: Delft, The Netherlands, 2005. [Google Scholar]
  54. Morison, J.R.; Johnson, J.W.; Schaaf, S.A. The Force Exerted by Surface Waves on Piles. J. Pet. Technol. 1950, 2, 149–154. [Google Scholar] [CrossRef]
  55. Mork, M. The effect of kelp in wave damping. Sarsia 1996, 80, 323–327. [Google Scholar] [CrossRef]
  56. Augustin, L.N.; Irish, J.L.; Lynett, P. Laboratory and numerical studies of wave damping by emergent and near-emergent wetland vegetation. Coast. Eng. 2009, 56, 332–340. [Google Scholar] [CrossRef]
  57. Denny, M.W. Biology and the Mechanics of the Wave-Swept Environment; Princeton University Press: Princeton, NJ, USA, 1988. [Google Scholar]
  58. Keulegan, G.H.; Carpenter, L.H. Forces on cylinders and plates in an oscillating fluid. Publ. J. Res. Natl. Bur. Stand. Res. Pap. 1958, 2857, 423–440. [Google Scholar] [CrossRef]
  59. Bradley, K.; Houser, C. Relative velocity of seagrass blades: Implications for wave attenuation in low-energy environments. J. Geophys. Res. Earth Surf. 2009, 114. [Google Scholar] [CrossRef]
  60. Paul, M.; Amos, C.L. Spatial and seasonal variation in wave attenuation over Zostera noltii. J. Geophys. Res. Oceans 2011, 116. [Google Scholar] [CrossRef]
  61. Vo-Luong, P.; Massel, S.R. Experiments on wave motion and suspended sediment concentration at Nang Hai, Can Gio mangrove forest, Southern Vietnam. Oceanologia 2006, 48, 23–40. [Google Scholar]
  62. User Manual and System Documentation of WAVEWATCH III Version 3.14. Available online: https://www.researchgate.net/publication/228750848_User_manual_and_system_documentation_of_WAVEWATCH_III_version_314 (accessed on 16 August 2019).
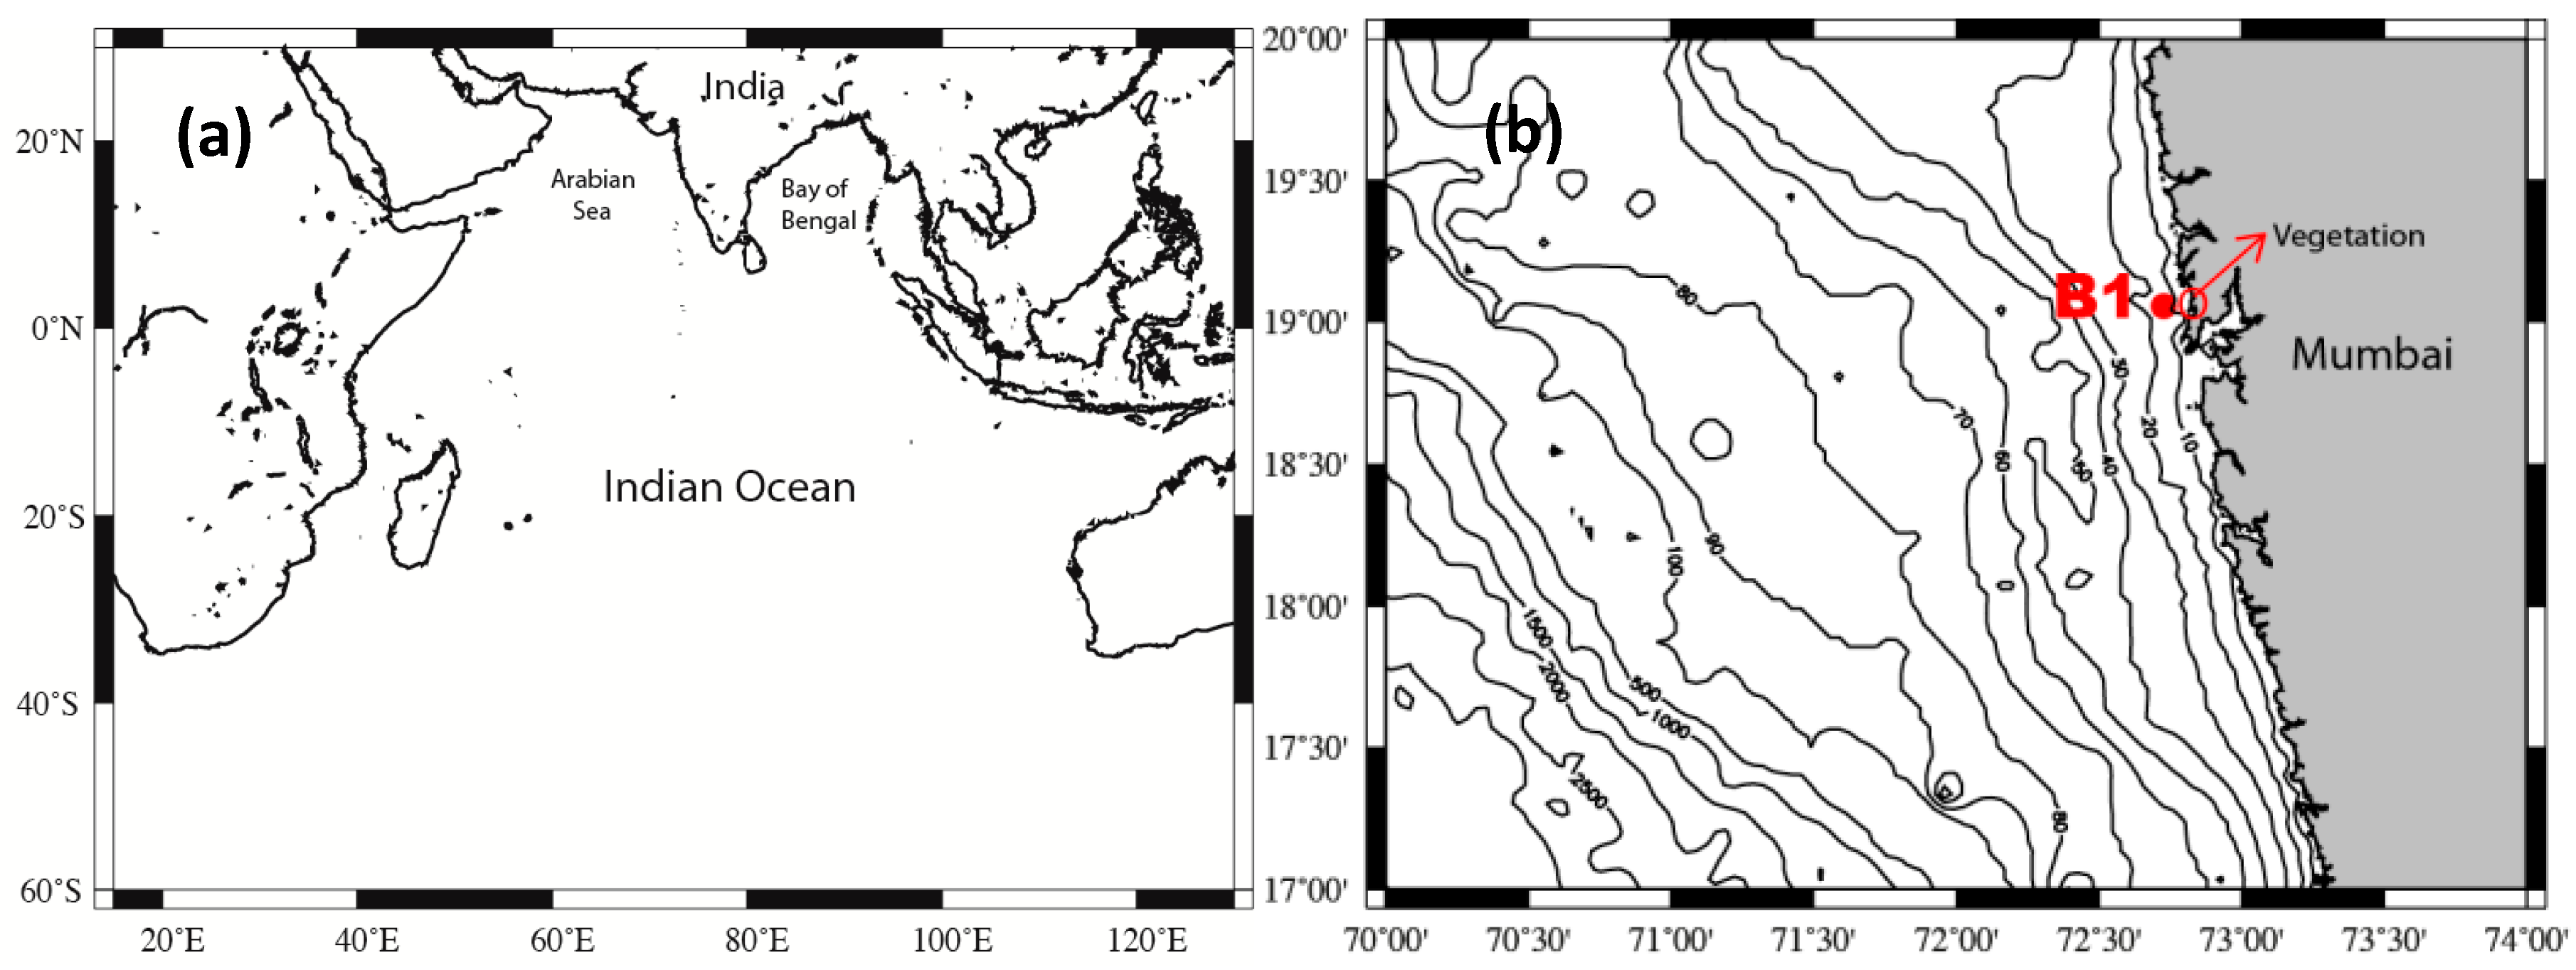
Figure 1. (a) Outer domain of the Indian Ocean chosen for modeling; (b) inner domain with depth contours off Mumbai, including buoy location.
Energies 12 04286 g001
Figure 2. (a) Vegetation area off Mumbai (google image); (b) domain showing the vegetation area and the wave measurement locations (P1, P2, P3, and P4); (c) satellite image; (d) classified image of the study area.
Energies 12 04286 g002
Figure 3. Plot of drag coefficients (Cd) across kelp, mangrove, marsh, and seagrass habitats from lab (L) and field (F) studies. Width of the polygon indicates the kernel density, dots mark the median, and thick black bars mark the interquartile range (Reproduced with permission from [21], esa, 2013).
Energies 12 04286 g003
Figure 4. Significant wave heights and predicted tide elevations off Mumbai from 5–8 August 2015.
Energies 12 04286 g004
Figure 5. (a) Significant wave height, Hs, and (b) mean wave period, Tm, at the four measurement locations (in front of and inside the vegetation) from 5–8 August 2015.
Energies 12 04286 g005
Figure 6. Relationship between water level and significant wave height in the study region on 5 August 2015 (left) and 6 August 2015 (right) at the locations P1 (a,d), P2 (b,e), and P3 (c,f).
Energies 12 04286 g006
Figure 7. Comparison of Simulating Waves Nearshore (SWAN) wave model results with buoy data (without vegetation). (a) Significant wave height (b) Mean wave period (c) Mean wave direction.
Energies 12 04286 g007
Figure 8. Wave height attenuation: (a) varying vegetation density and different Cd, and (b) varying Cd for different vegetation density.
Energies 12 04286 g008
Figure 9. Spectral comparison at two locations P1 (in front of vegetation) and P2 (inside the vegetation) at select time intervals: (a) 5 August 2015: 0330 hrs; (b) 6 August 2015: 0430 hrs; (c) 7August2015: 0530 hrs and (d) 8 August 2015: 0630 hrs.
Energies 12 04286 g009aEnergies 12 04286 g009b
Table 1. Review of Cd calculated for mangroves (Reproduced with permission from [21], esa, 2013).
RegionStudy Cd (Estimated or Assumed Drag Coefficient)DecayCd (Bulk Drag Coefficient)Source
Australia---[15]
Vietnam0.120.0010.14[13]
Vietnam--2.72[14]
Vietnam--2.69[16]
Vietnam--0.42[27,61]
Mumbai, India--0.50Present study
Table 2. Range of vegetation parameters considered for various model runs.
Vegetation Height (m)Stem Diameter (m)Density
(No. of Stems/m2)
Cd
3.00.3–0.1 0.175–0.350 0.2–3.0