Abstract
Crossroads are the main traffic jam generators in densely populated cities. Unmanned vehicles and intelligent transportation systems can significantly reduce congestion and improve road safety by eliminating the main cause of traffic accidents—the human factor. However, full confidence in their safety is necessary. This paper addresses the contextual data integrity problem, when an unmanned autonomous vehicle transmits incorrect data due to technical problems, or malicious attacks. We propose an approach based on trust and reputation that allows detecting vehicles transmitting bogus data. To verify the feasibility of the approach on practice, we conducted both software and physical simulations using the model of intersection and unmanned autonomous vehicle models. The simulation results show that the approach applied allows detecting vehicles with bogus data and excluding them from the group, thus increasing the safety of the intersection traversal by other vehicles.
1. Introduction
Recently, scientific and technological progress in the field of information technologies has led to the emergence of such concepts as the smart city and the Internet of things, based on the communication between physical sensors and the “smart” information elements that perform calculations on the data received. The revolution in the field of transport has led to the emergence of Intelligent Transport Systems (ITS) [1], designed to provide optimal and safe traffic.
However, traffic accidents are one of the leading causes of death in the world now. According to the Association for Safe International Road Travel (ASIRT), nearly 1.25 million people die and 20–50 million are injured or disabled in traffic accidents in the world annually (https://www.asirt.org/safe-travel/road-safety-facts/). World Health Organization reports traffic accidents are the leading cause of death among people aged 5–29 globally [2]. With a growing population in the world, the number of cars sold is growing, which affects the appearance of traffic jams. Studies conducted by Sugiyama et al. [3] show that traffic jams and congestion can spontaneously occur. In dense urban areas, intersections are generators of traffic jams, since the paths of vehicles intersect on them. The approach to optimize the movement of vehicles at the intersection in scientific works has been termed as intersection management [4]. The objectives of the intersection management system are to optimize the time of vehicles traversal through the intersection and resolve conflicts to avoid traffic accidents.
The emergence and development of unmanned autonomous vehicles (AVs), capable of being driven without a driver, and their integration in ITS in the future, can solve both the problem of traffic jams, due to optimal route planning, and the problem of mortality in accidents, due to the exclusion of human factor. However, despite the efforts to eliminate humans to exclude human factor, automation of daily routine activities implies managing, servicing and maintaining of different technical systems, which raises many issues of great importance. Before the full implementation of AVs on public roads, there must be a firm belief that they are safe and secure.
The integration of AVs in ITS involves the exchange of data between vehicles and infrastructure via wireless communication channels, but such communication may be susceptible to network malicious attacks. There are already known cases of remote attacks on AVs, allowing for the access to both the private information of users and AVs controls [5].
For research and modeling of data exchange between AVs, the multi-agent-based approach has gained popularity [6]. AVs and infrastructure objects can be represented as a set of agents, constantly interacting with each other to achieve a common goals, such as the optimization of movement, and reduction of resources consumption. One of the most important aspects of the proper functioning of the agent group is the correctness of messages, transferred between agents, when the correctness of data can be verified. The correctness of data means the data transmitted by the agent, for example, the current location, reflect its real location at a given time.
In addition to external attacks, there are also so-called “soft” attacks, such as collusion or Sybil attack, aimed at the contextual integrity of the transmitted data between AVs. For example, if an AV, which is already authorized in the system, transmits incorrect data about its location to other traffic participants because of a faulty sensor or a software error, then conventional security methods, such as cryptography, are unlikely to allow such an attack to be detected. Mechanisms based on trust and reputation can be used to detect agents transmitting incorrect data and mitigate such malicious attacks.
In earlier works [7,8], we presented a model for optimizing the movement of AVs at the intersection, developed a software simulator, and conducted an empirical study to verify the effectiveness of the model. In the present work, as a method to improve the safety of the system, we introduce a model, based on reputation and trust, to detect AVs transmitting incorrect data and their subsequent exclusion from the group interaction. We assume that this approach, combined with conventional security methods, can increase safety by detecting and blocking AVs transmitting incorrect data to other traffic participants. We also validated our model using our custom software simulator and implemented it on a real physical stand with models of AVs at the intersection.
The paper is organized as follows. Section 2 describes what vehicular wireless networks are, their structure, and on which protocols they are based on, as well as their main security challenges. This section also provides an overview of solutions and approaches that use the mechanisms based on reputation and trust to solve the problem of incorrect data and to increase system security and safety. A formal description of our approach is given in Section 3. The description of the simulation setup, conditions, and assumptions, both for software and physical experiments, as well as the results obtained, are given in Section 4. Section 5 discusses the results obtained. Conclusions on the research conducted and plans for further development of the approach are given in Section 6.
2. Related Work
2.1. VANETs
To organize the transfer of data between vehicles as part of ITS, vehicular ad-hoc networks (VANETs) were first proposed in [9] by Toh. These networks are wireless, self-organizing, and non-dependent on the availability of a network infrastructure. Each of the nodes dynamically forms a path for the transmitted packets depending on the protocol and routing algorithm selected [10]. VANETs mean that every vehicle is equipped with an on-board unit (OBU), which is capable of both receiving and sending data. Data transmission can occur between vehicles (V2V), as well as between vehicles and roadside units (RSUs), which play the role of transport infrastructure objects (V2I). RSUs are stationary, located close to roads, and are key elements in ensuring road safety. The mixed type of communication between RSUs and OBUs is called V2X.
In addition to the listed types of communication, there is a V2S type, which means the ability of a vehicle to interact with on-board sensors. According to Lu et al. [11], connected vehicles (CV) are those vehicles that can receive data from the environment through on-board sensors, process them, and transfer them to other vehicles and objects of the transport infrastructure. The development of driver safety systems is one of the most important developments in CV evolution. However, many of the approaches that are currently being developed and investigated aim to prevent traffic accidents. The same strategy underlies the design of V2I and V2V communications [12]. In V2I-type communication, transport infrastructure objects send vehicles data on traffic jams, traffic conditions, weather conditions, road repairs, accidents, etc. to improve road safety and optimize road traffic. Vehicles also transmit data collected from on-board sensors to transport infrastructure. V2V communication means the exchange of data between two or more vehicles. This type of network is decentralized, and vehicles exchange data on the current traffic situation and make their own group decisions to optimize traffic [13]. V2X is classified as applications for road safety, traffic optimization, and infotainment purposes.
Data transfer is based on dedicated short-range communications (DSRC) [14]. VANETs involve the exchange of data received from the environment using vehicle sensors, such as current speed, current location, obstacles, etc., and it is used by ITS to optimize traffic and ensure safety. DSRC implies the use of 802.11p protocol, which is based on the IEEE 802.11 and uses a 10 MHz channel [15]. A feature of 802.11p is the presence of WAVE Short Message Protocol (WSMP), which allows sending short priority messages. More detailed descriptions of WAVE and communication features between vehicles are given in [16].
At this stage of development, the full implementation of such technologies as VANET is not available ubiquitously [17]. Such technologies for exchanging data between vehicles and infrastructure raise many complex issues for policymakers, vehicle manufacturers, road and infrastructure companies, and scientists in the area of transport. Such networks must be highly scalable, must operate stably under high loads, and ensure reliable data transfer without loss of data. Therefore, to meet the categorically requirements for speed and reliability, perfect routing and scheduling algorithms and approaches are needed. The design of ITS requires large sources of funding, which again raises the question for politicians and economists whether the development and maintenance of such infrastructure are worthwhile and cost-effective.
A distinctive feature of VANETs from other sensor networks is its extremely high dynamics, since vehicles are almost constantly in motion and can move at high speeds. Such conditions require the highest reliability from the network as it is critical for the system to make real-time decisions in any failure [18]. Movement of nodes with high velocity means that nodes are constantly connected and disconnected from the network, and the topology constantly changes. VANETs are highly scalable and have to seamlessly transmit data under high network load conditions; high throughput and low latency are vital in terms of safety. Such networks imply communication between nodes at large distances and the technical characteristics of communications should allow for the transmission of data under environmental interference.
The requirements above and characteristics of VANETs form the security challenges that VANETs face to ensure the reliable and stable system operation. According to the authors of [19,20,21], the main challenges of VANETs are:
- Dynamic topology of the system. As described above, the VANETs should support communication between nodes in the conditions of their high mobility. For this reason, traditional authentication methods cannot be applied. Even though scientific papers propose solutions to these challenges, several issues remain unsolved [22].
- Time limits. The system safety depends on the time of data delivery and decision making based on the received data. To ensure safe operation, it is necessary to adhere to strict limits on the time of delivery, processing, and sending data, since the high dynamics of the system leaves critically little time for data processing.
- Network scale. Prospects for the development of VANETs imply a large number of nodes interacting with each other, and the number of nodes constantly changes. Safe and stable operation of the entire system requires a scalable network infrastructure that can operate in an ever-changing network topology.
- Ability to counter malicious network attacks. As in any network, VANETs are prone to malicious attacks. Since the functioning of VANETs is directly related to the participation of people, the implementation of an attack on VANETs can lead to critical consequences. Necessary mechanisms to counter attacks should include authentication procedures, non-repudiation, access control, privacy protection, confidentiality, integrity, and accessibility assurance. Classification of attacks to which AVs in VANETs are exposed is given in [5].
- Fault-tolerance. ITS collects and processes data obtained from vehicle sensors and uses it to optimize traffic and broadcast emergency and informational messages. The transmission of incorrect data due to a malfunctioning vehicle sensor, for example data on the speed or current location, can lead to traffic accidents and endanger other road users.
- Privacy. To ensure privacy, data transmitted in VANETs should be anonymous [23]. It introduces an additional challenge for schemes using public key infrastructure (PKI), since it implies the identification of the sender and receiver of data [24].
However, vehicles can transmit incorrect data both unintentionally, e.g. in the event of a sensor failure, and intentionally, when an attacker makes unauthorized changes to the software and hardware components of the vehicle. Such attacks are called illusion attacks [25]. The bogus data broadcasting implies that other participants change their route, velocity, and plan further actions based on the data received. This can be used by an attacker both to artificially reduce the traffic jams on his route and to deliberately generate a traffic accident. Traditional authentication procedures and data integrity assurance in wireless networks are not effective against such attacks [26]. As a way to counter attacks aimed at contextual data integrity, the mechanisms based on reputation and trust can be used when each network member has its level of reputation in the system, and based on this level, the rest of the participants decide whether to trust the data received from this member. Below, we examine existing solutions, based on trust and reputation mechanisms.
Our main research question is to verify the developed model based on the trust and reputation approaches in the conditions of “soft” attacks, and assess how effective the use of this model is. Moreover, we are concerned about the potential for further development and application of the model proposed in practice and real physical objects implementation.
2.2. Trust and Reputation Models and Approaches in VANETs
In a dynamic VANETs environment, there is much uncertainty in deciding who to trust. Existing trust models in VANETs include entity-oriented trust models and data-oriented trust models. Entity-oriented trust models focus on the modeling of the trustworthiness of peers. Data-oriented trust models put more emphasis on evaluating the trustworthiness of data.
The authors of [27] compared two types of protocols for secure routing in VANETs: topology-based protocols and position-based protocols. Topology based protocols are traditional ones for mobile ad-hoc networks (MANETs); they use a source to destination information which is stored in the routing table. The sub-categories of topology-based protocols are proactive, reactive, and hybrid protocols. The routing table in proactive protocols (Destination-Sequenced Distance Vector routing protocol, Optimised Link State Routing protocol, and Fisheye State Routing) updates frequently on dynamic topology, and they choose the shortest path algorithm for routing. Reactive protocols (Ad hoc On-demand Distance Vector routing protocol, Dynamic Source Routing Protocol, and Temporally Ordered Routing Algorithm) are used for large networks as they propose high mobility and dynamic nature. When the source communicates with the destination node, the route is discovered by the second one. Later, the destination node sends a reply message to the source. Hybrid protocol (Zone Routing Protocol) is a combination of the first two types and it is used according to the network scenario. The purpose of the hybrid routing protocol is to accelerate the packet delivery and reduce overload. Position-based routing employs the positional information of nodes. The source sends a packet according to the position of another node when each node may decide everyone’s location using GPS. Examples of position-based protocols are DTN protocols, non-DTN protocols, and hybrid protocols.
In [28], Yang introduced a similarity-based trust and reputation framework for VANETs. The message has to be verified after receiving it. A similarity mining algorithm was used to compute the similarity between non-linear similar data. Recommendations of agents and direct experience of the result are integrated as reputation evaluation. As soon as the message content is checked, the values of trust and reputation are updated.
Another algorithm used for trust management, presented in [29] and named BARS, is a blockchain-based anonymous reputation system. Vehicles use two blockchain mechanisms for the authentication based on proofs of presence and absence. Public keys are used as the pseudonyms to protect a vehicle privacy. The broadcasted messages are recorded in one blockchain to evaluate the reputation of vehicles. The results show that BARS effectively improves the trustworthiness of broadcasted messages and protects vehicle privacy efficiently.
In [30], the authors proposed Lightweight Self-Organized Trust (LSOT) Model as an algorithm to protect VANETs communications. In the model, the nodes are self-organized; they aggregate trust certificate-based and recommendation-based performance.
Li and Song [31] described an Attack-Resistant Trust model (ART) to evaluate the trustworthiness of both traffic data and vehicle nodes for VANETs as two separate metrics, namely data trust and node trust. Data trust is used to verify data, but the node trust indicates how trustworthy the nodes in VANETs are. To evaluate the efficiency of ART model, experiments were conducted. The results prove that the ART model copes with malicious attacks.
The authors of [32] used three indicators for trust and proposed REK Trust Evaluation model based on parameters of reputation, experience, and knowledge. Reputation indicates how well the trustee has exchanged data with all of the entities until now. Experience indicates that how well the trustor has accomplished exchanging data with the trustee until now. Knowledge renders observation on the trustee (the vehicle which is providing data) as direct trust.
Primiero et al. [33] formulated a proof-theoretic of the trust and reputation model for VANETs with an extension of the natural deduction calculus (un)SecureND [34]. Using an algorithm, they could qualify the operation passed as a safe message through any number of vehicles by checking at each interaction that consistency is preserved. Therefore, reputation model is based on an evaluation of parameterized feedback messages, in terms of the temporal measure and ranking of the relevant service characteristic of each message.
Javaid et al. [35] proposed DrivMan, blockchain-based trust management, and data sharing solution for VANETs. The use of DrivMan gives each vehicle a unique crypto-fingerprint, which is used to establish data provenance. Certificates issued by infrastructure units are exploited to preserve the privacy of the vehicles. DrivMan can be used as an effective solution to provide both data provenance and data integrity to intelligent vehicles in VANETs for their secure and reliable operation.
In this paper, we address the situation, when legitimate AVs intentionally or unintentionally transmit bogus data that do not reflect the real situation on the road and at the intersection in particular. We propose the trust and reputation-based approach to reduce the likelihood of the intersection traffic accidents and to increase the efficiency of the intersection management system.
3. Trust and Reputation Approach Description
3.1. Truth, Trust and Reputation Models
In our research, we tried to project elements from social science to the information security field. It is supposed that device (agent) reliability can be determined by the level at which other devices assess it. Based on the assessment results, devices decide whether to trust the given agent or not. Agents can assess each other by analyzing the authenticity of the received data. Thus, in our approach, we employed three basic models: , , and .
Definition 1.
is an indicator characterizing the subjective assessment of data correctness, based on sensory devices, provided by the object of observation to the subject. This value can be formalized as Equation (1).
where is a value of data correctness in time moment t, is the block of data being evaluated, and is the function of evaluation in t time moment.
Definition 2.
Reputation (R) is a time-based value, appearing in assesment of the value of the agent-object by the agent-subject. This value can be formalized as Equation (2).
where is the reputation value at t time moment and is the function of R evaluation in t time moment.
Using only the above indicators does not allow unambiguously assessing the data correctness. To minimize possible inaccurate estimates of the behavior of elements and the correctness of data, we introduce a indicator.
Definition 3.
is an indicator calculated on the combination of R and and characterizing the subjective assessment of the agent-object behavior by the agent-subject. This value can be formalized as Equation (3).
where is the value of in t time moment and is the function of evaluation in t time moment.
Each of the presented indicators can take two opposite values, conditionally describing evaluated data as “correct” or “incorrect”. “Correct” means that agent-subject classifies the received data from the agent-object as an actual data. “Incorrect”, in contrast to “correct”, indicates that the received data from the agent-object are classified as a false data. Thus, each indicator can take a value in the range . However, there is a case when data received from the agent-object cannot be evaluated by the agent-subject, and the value of the indicators can be neither 0 nor 1. In this case, the agent-subject should consider valuations of these data by other group agents.
In relation to these indicator values, the following assumptions are introduced:
Assumption 1.
;
Assumption 2.
;
Assumption 3.
.
Suppose that is a set of agents. Then, all agents are considered as homogeneous in relation to their abilities to receive data from the environment using sensor devices and to transmit these data to each other. In this case, agents can accumulate collective knowledge about the environment and employ this knowledge in solving the problems of collective action optimization. The knowledge of each agent in the system can be represented in the form of the set , and the knowledge of each agent can also be represented as a set . Knowledge can be classified as passive and active:
- Passive knowledge represents the current knowledge about the environment that is not the result of collaborative actions.
- Active knowledge is the knowledge gained in the process of collaborative actions.
On the basis of the previously introduced definitions and assumptions, data correctness evaluation requires calculating the vectors of truth, trust and reputation values, produced by each agent to evaluate the correctness of data received from others:
- , where is the truth of data, received from agent ;
- , where is the reputation of the agent , calculated by agent ; and
- , where is the trust value to agent of agent .
Below, one can find further explanation of how these indicators are calculated.
3.1.1. Truth
assessment of the data transmitted from the agent-object to the agent-subject is based on passive knowledge available to the agent-subject. includes information collected using the sensor devices of the agent-subject or information transmitted from other agents.
If the estimated data are represented in the form of several blocks of information, for example, the position of the group is given as the position of each individual agent, then the computation of data correctness is limited to averaging the value over all the blocks. In a formalized form, we present the calculation of this indicator for the agent-object by the agent-subject e, respectively (Equation (4)).
where is the number of data blocks, by which the of the information is evaluated. In such a case, the vector of truth index estimates for all agents can be represented as:
where is the estimated value for the agent-object by the data block . In general, each block of data is valued as correct or incorrect. The indicator is formed as:
With such an assessment of the value by data blocks, the for the agent-object will be in the interval from 0 to 1.
However, when the agent-subject does not have the ability to evaluate data received from the agent-object, or does not have an access to a reliable communication channel, then the value is estimated based on the average values of the indicators received from other agents that conducted the agent-object data assessment:
where and is the number of agents having an estimate of the of the data. If there are no such agents, the value is estimated as , i.e., the average value at which the data are not assessed as correct or incorrect.
3.1.2. Reputation
Calculation of R value can be conducted as:
where is the truth value, received from agent by agent e at the current time moment t, is the reputation value of agent-object in time moment j, and is the threshold for a positive or negative decision on agent’s reputation value.
In this case, the reputation value does not satisfy previously introduced Assumption 2. On this basis, we consider as an intermediate step in calculating the reputation value. To calculate R value, we need to normalize value over the time period. In this case, the reputation value corresponds Assumption 2.
At the initial time of the group operation, the reputation value can be taken equal to , i.e., with . The value of , at which the level is correct, is chosen empirically. In general, .
Evaluation R of the one agent based on transferred data and other agents’ opinions can be calculated according to Equation (9).
where . In this case, the reputation is calculated not only on the basis of agent’s own assessment of the data received from agent-object, but also on the basis of other agents’ valuations. This approach allows clarifying the value of the indicator for the agent-object based on the calculated values of the reputation indicator from other agents, presumably having the ability to directly interact with the agent-object.
The introduced calculus results reveal R growth slower than a possible decrease. It means that the saboteur is unable to immediately increase its reputation level.
3.1.3. Trust
As mentioned above, the function of assessing the value is a function of two parameters—the value of R for the preceding time moments and the value at the current time moment—and is calculated according to Equation (10).
The overall task of assessing the of the agent-object boils down to the comparison of the value against the given threshold and is determined accordingly (Equation (11)).
If the condition in Equation (11) is met, the behavior and the data of the agent-object are assessed by the agent-subject as correct. The function of calculating the reputation value can be represented as a function built on weights. In this case, the values of and R are taken into account when calculating the value with some coefficients characterizing the effect on the calculated value of each indicator. In a generalized form, this function can be represented according to Equation (12).
where is the system reactivity coefficient.
In general, the reputation is formulated as a function that depends on trust calculated at previous time moments. In this case, the reputation is used as the agent’s major characteristic for further actions. Consequently, the trust value has an indirect impact on the decision-making regarding the behavior of the agent. With the linear function of reputation, the data transmitted by the agent can be estimated incorrectly, as, during a long observation period, the value of reputation does not change quickly enough with a sharp change of the trust value. To address this challenge, we have introduced the indicator and reputation decrease with an exponential function.
4. Empirical Study
4.1. Software Simulation
To assess the effectiveness of the trust and reputation model proposed, a custom software simulator has been developed to imitate intersection traffic. All AVs in the simulator are united into a system where each element can communicate with each other to organize the traffic. However, it is necessary to take into account that some AVs can transmit incorrect data (intentionally or because of technical problems) thereby provoking the road collapse. Our trust and reputation model is intended to prevent such actions and provide secure information interaction in the traffic system. The description of the software testing ground is given below:
- The software testing ground is represented as matrix and is divided into square elementary sectors.
- The road map is known to all the AVs.
- There are only straight roads and their coordinates coincide with the coordinates of the elementary sectors located in the same row or column.
- Each road must belong to either vertical or horizontal type.
The testing ground includes the following set of parameters: , where c is the number of columns that define the field; r is the row amount defining the field; is the set of roads where the AV can move. In its turn, each road is characterized by a set of parameters , where t is the road type (vertical or horizontal); d is the road direction (passing or oncoming); and E is the set of elementary sectors defining the roadway. The model of AV (MAV) consists of the following characteristics:
- m is the set of elementary sectors, based on a road map, and the planned start and final positions of the MAV.
- s is the speed; speed is understood as the amount of elementary sectors crossed by a MAV per one conditional discretized time segment.
- is the sequence of steps for the MAV to go through the planned path (calculated on the basis of m and s; one step is passed in one conditional discretized time segment).
- There is an array of reputation values of other MAVs for each discretized time segment t from the beginning of the interaction to the discretized time segment preceding the current interval : .
4.1.1. Experiments Setup
Here, we describe the setup, conditions, and assumptions of the software simulation; how the movement of AVs at the intersection is organized; the input simulation parameters; and the data by which the proposed model was validated.
Movement
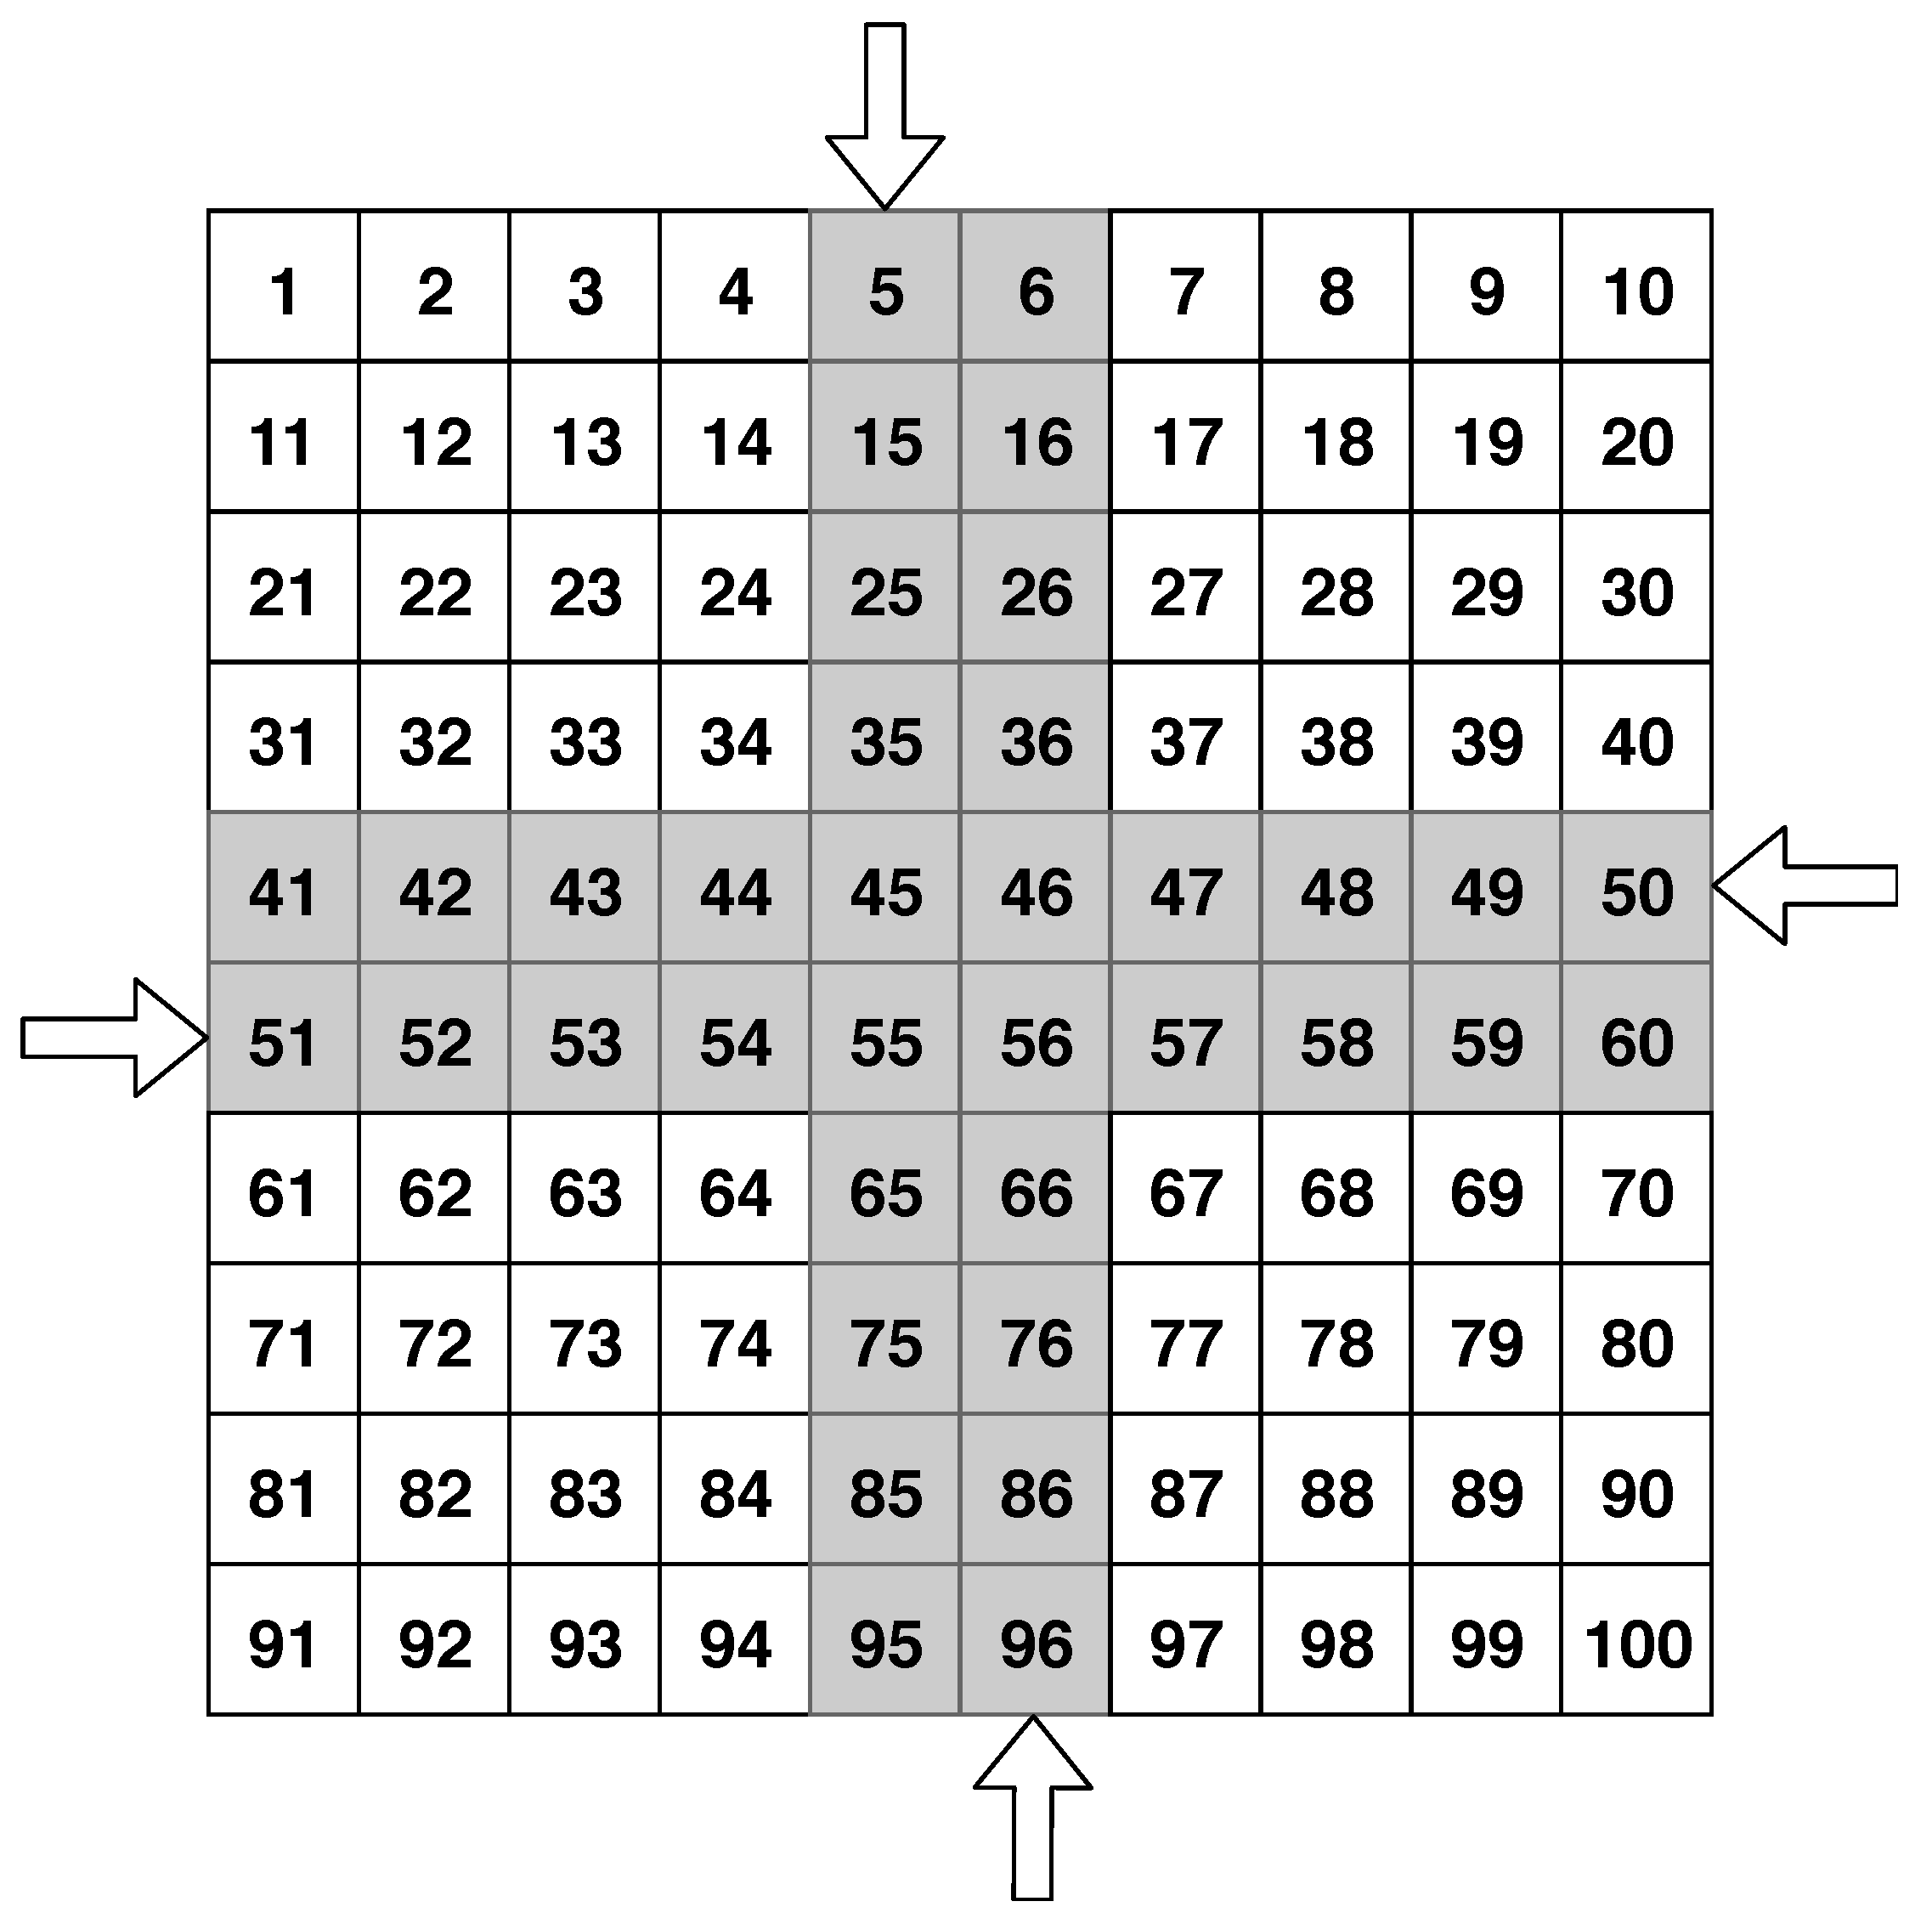
- Testing ground: elementary sectors; 4 lanes for AVs driving: 2 vertical (oncoming and passing), 2 horizontal (oncoming and passing); an example of the software testing ground is represented in the Figure 1.
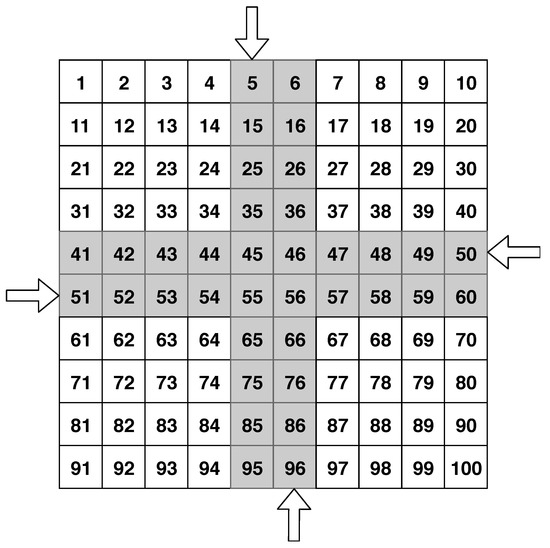 Figure 1. Graphical representation of the intersection in the software simulator, where arrows indicate lane directions.
 - MAVs can drive in any direction within the roadway, according to the direction of the roads.
- On the testing ground, the probability of the appearance of new MAVs is given in advance, while the number of appearing MAVs is determined randomly.
- MAVs speed is constant and equal to 1.
- The testing ground is spatially limited.
- In the case more than one MAVs pretend to be in the same elementary section contemporaneously, the MAVs give way to each other, taking into account the maximization of the intersection capacity, as in Equation (13):where N is the number of MAVs, passing the intersection; L is the number of elementary sections at the intersection; and M is the number of discretized time segments, for which N vehicles passed the intersection.
Simulation Organization
- The experiment was divided into four groups with the probability of a new vehicle appearance with the values equal to 0.25, 0.5, 0.75, and 1, respectively.
- Each experiment group had 1000 tests with a duration of 1000 discretized time segments.
Reputation Calculation
- The initial value of MAV reputation was set as 0.5.
- The probability that new MAV was a saboteur (could transmit bogus data) was 0.5.
- A saboteur, depending on the situation, could transmit either correct or incorrect data.
- The legitimate MAV also could transmit incorrect data due to technical failures; the probability of MAV technical fail occurrence was set as 10%.
- If the vehicle transmitted incorrect data, then its value was equal to 0, otherwise .
- The MAV was detected as saboteur if its reputation was equal to or less than 0.25; such a strict threshold meant that neither saboteurs nor legitimate MAVs with technical problems should not leave the road, because they can quickly cause traffic collapses and provoke fatal consequences.
Limitations
- The simulation was conducted in the traffic area without pedestrians.
- No vehicle had the priority except maximum intersection capacity value.
- No external obstacles were situated on the roads.
Results Validation
- To assess the results, four parameters were calculated: true positive (TP), false positive (FP), true negative (TN), and false negative (FN):
- -
- TP is the case when data transmitted by a MAV were bogus, and its MAV was classified by another group as a saboteur.
- -
- FP is the case when data transmitted by a MAV were correct and its MAV was classified by another group as a saboteur.
- -
- TN is the case when data transmitted by a MAV were correct and its MAV was classified by another group as legitimate.
- -
- FN is the case when data transmitted by a MAV were bogus and its MAV was classified by another group as legitimate.
4.1.2. Results
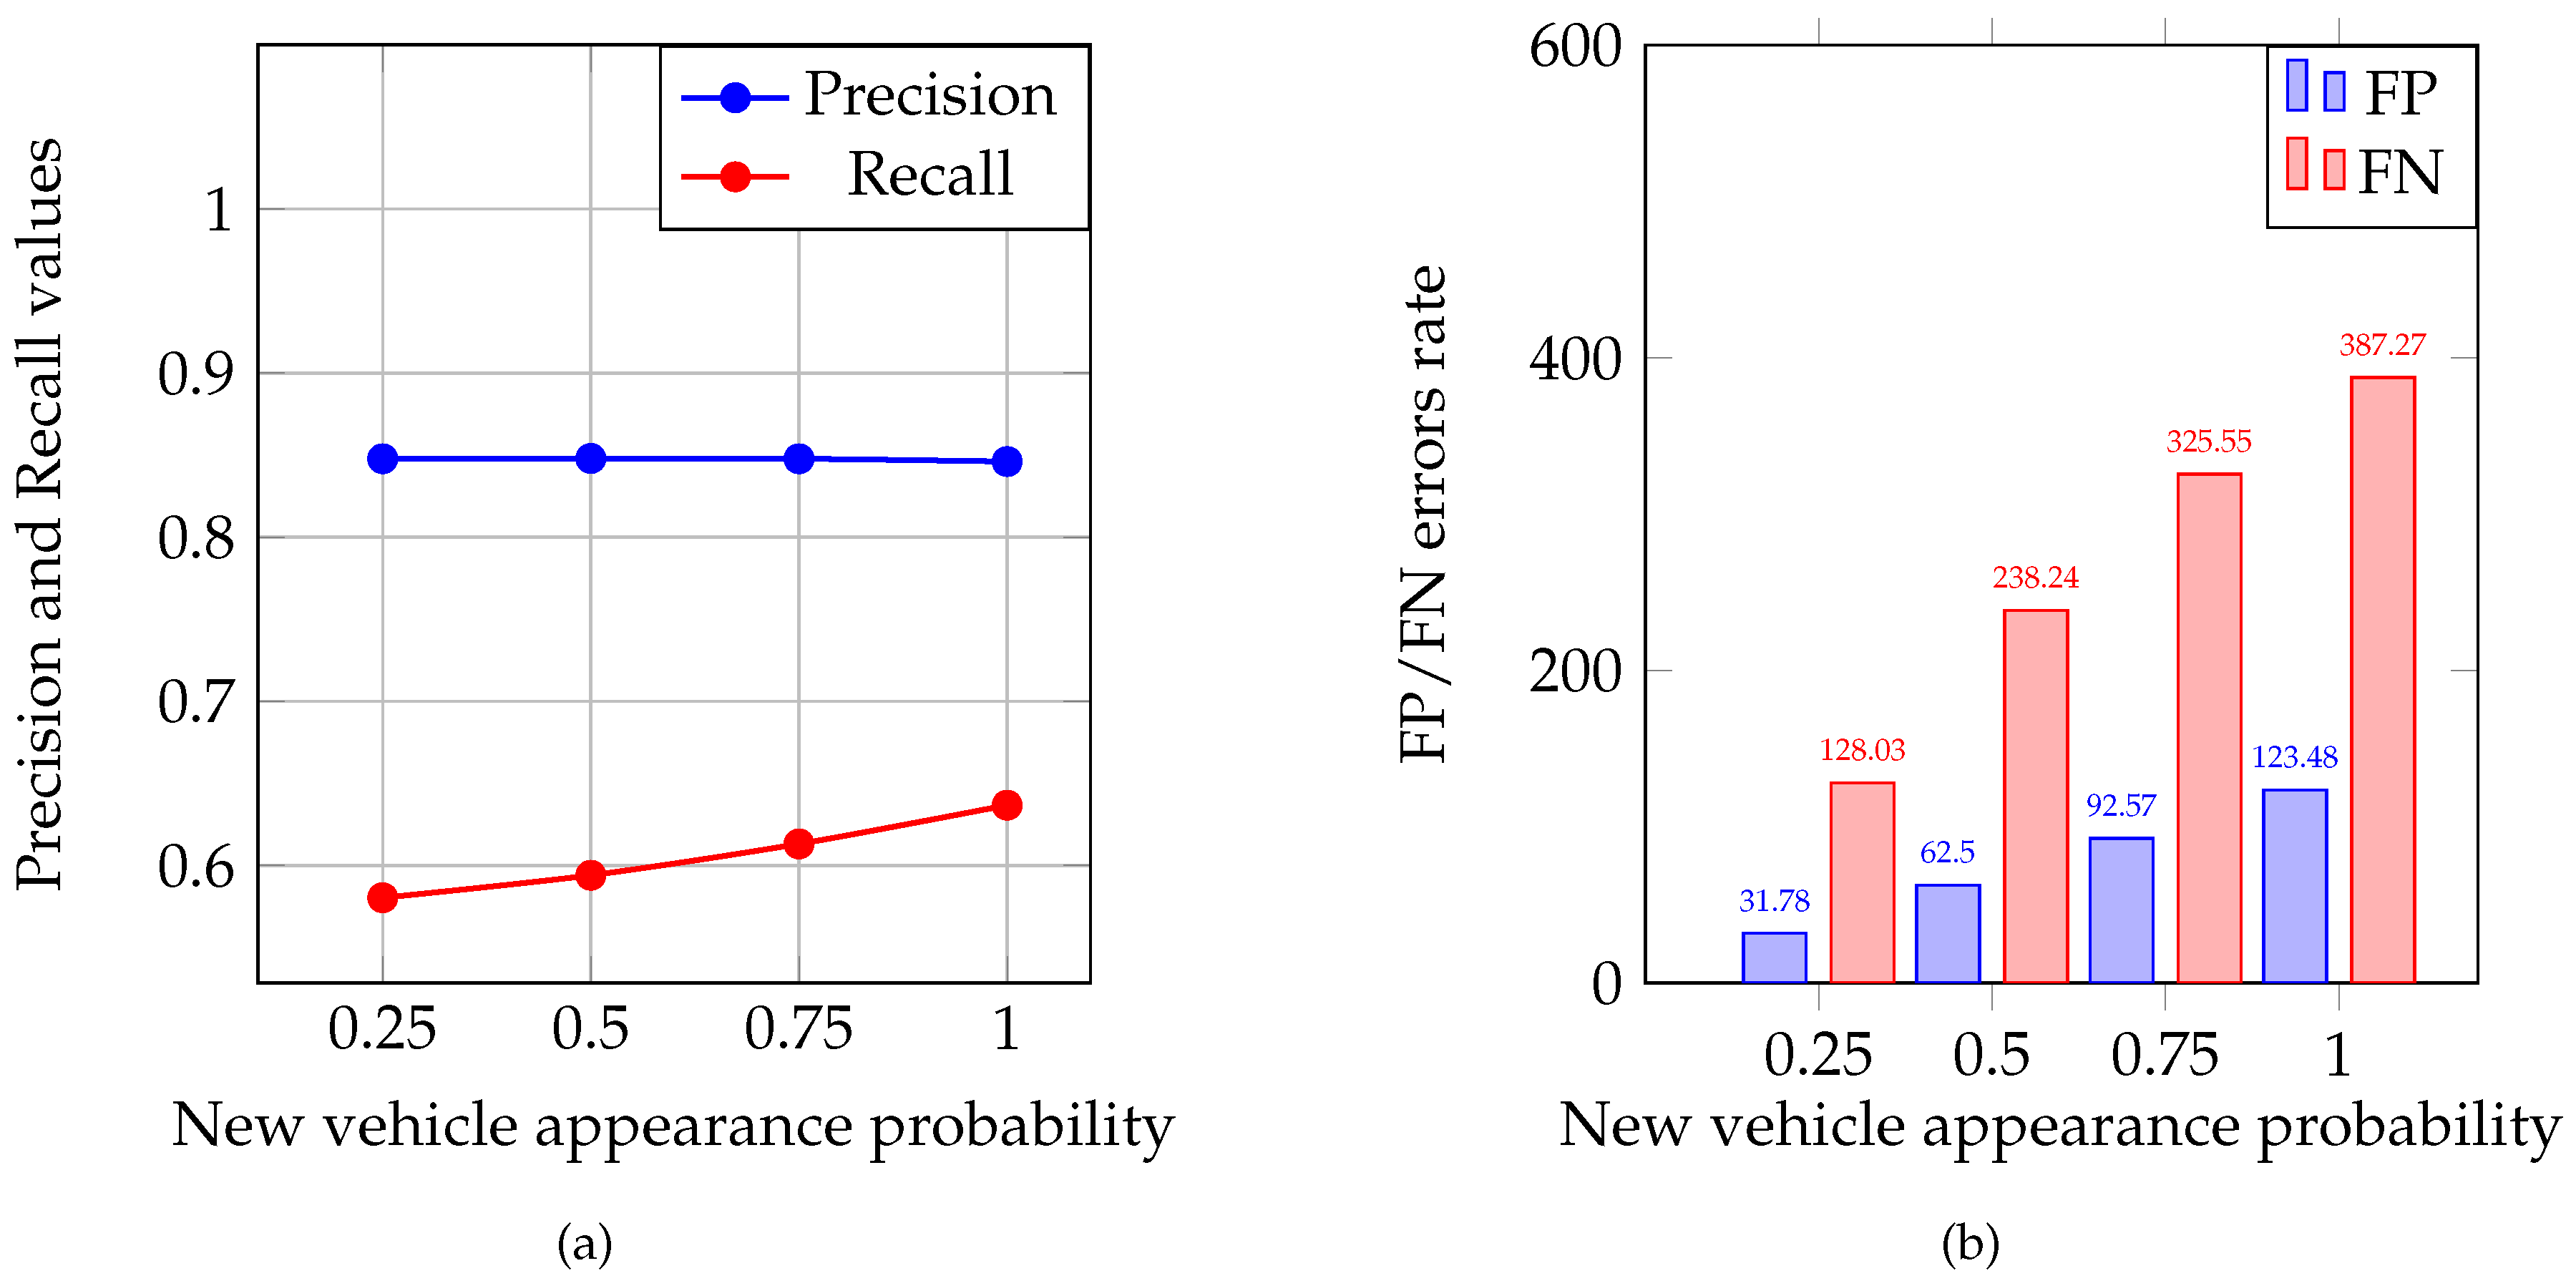
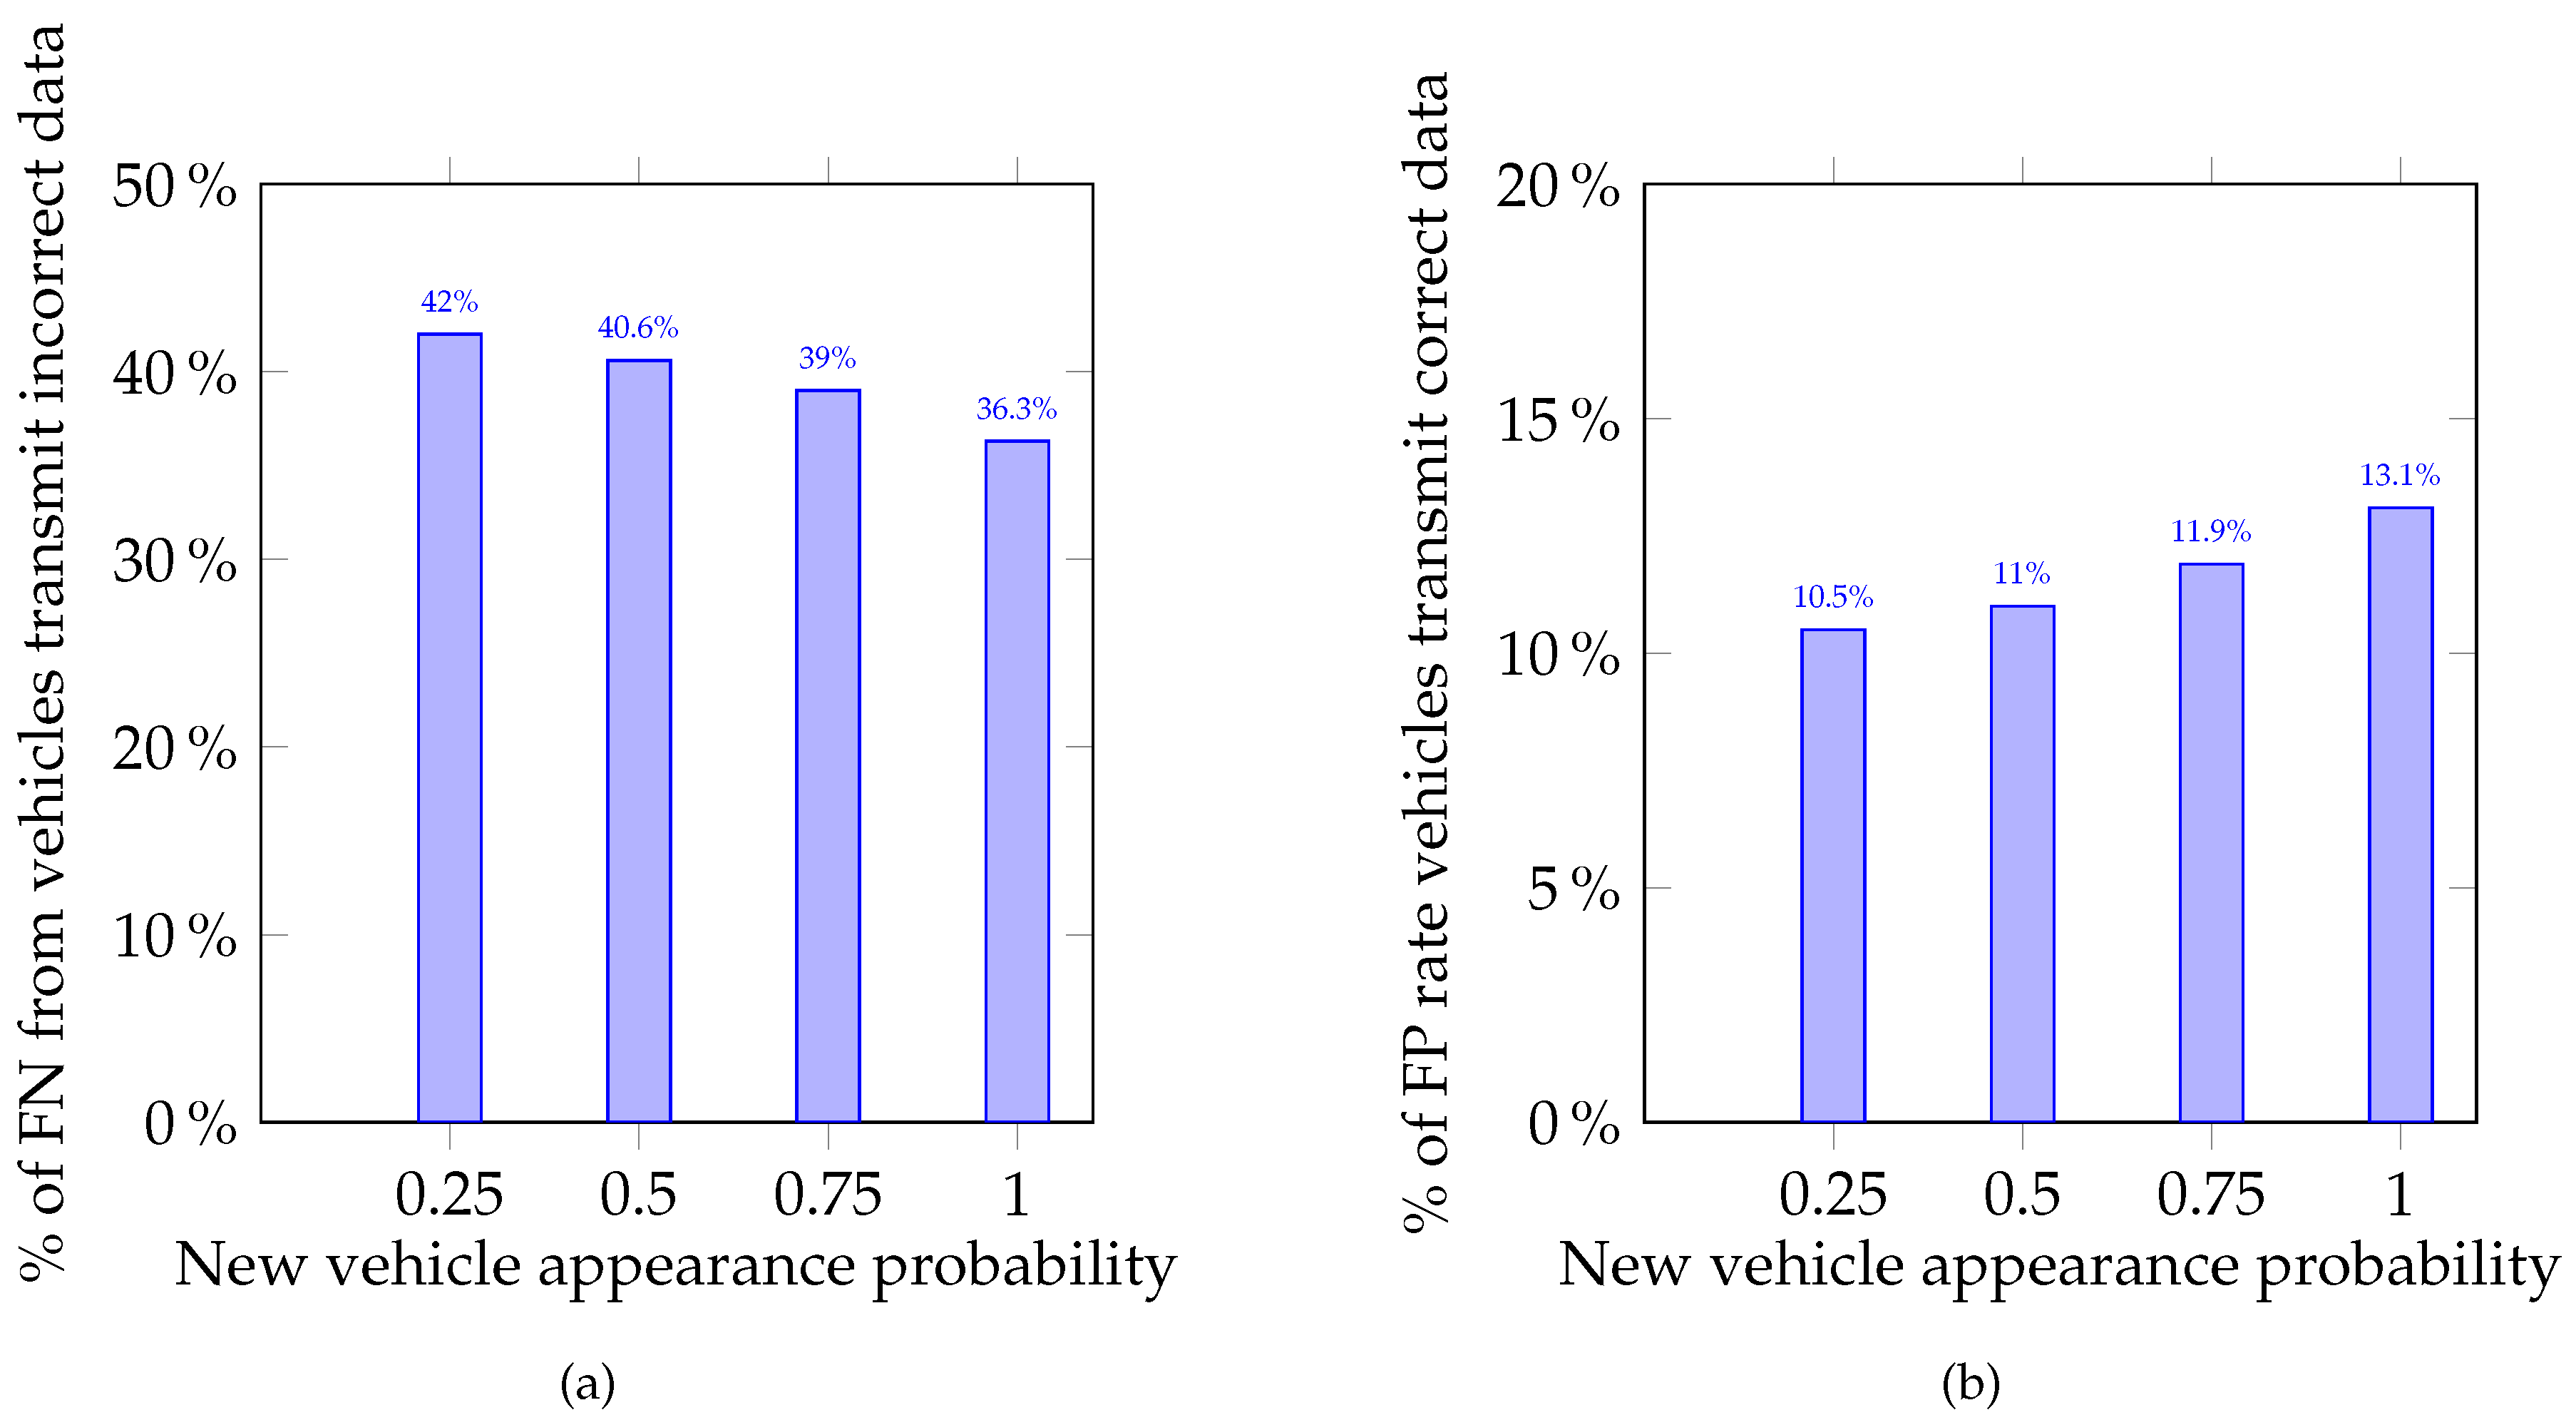
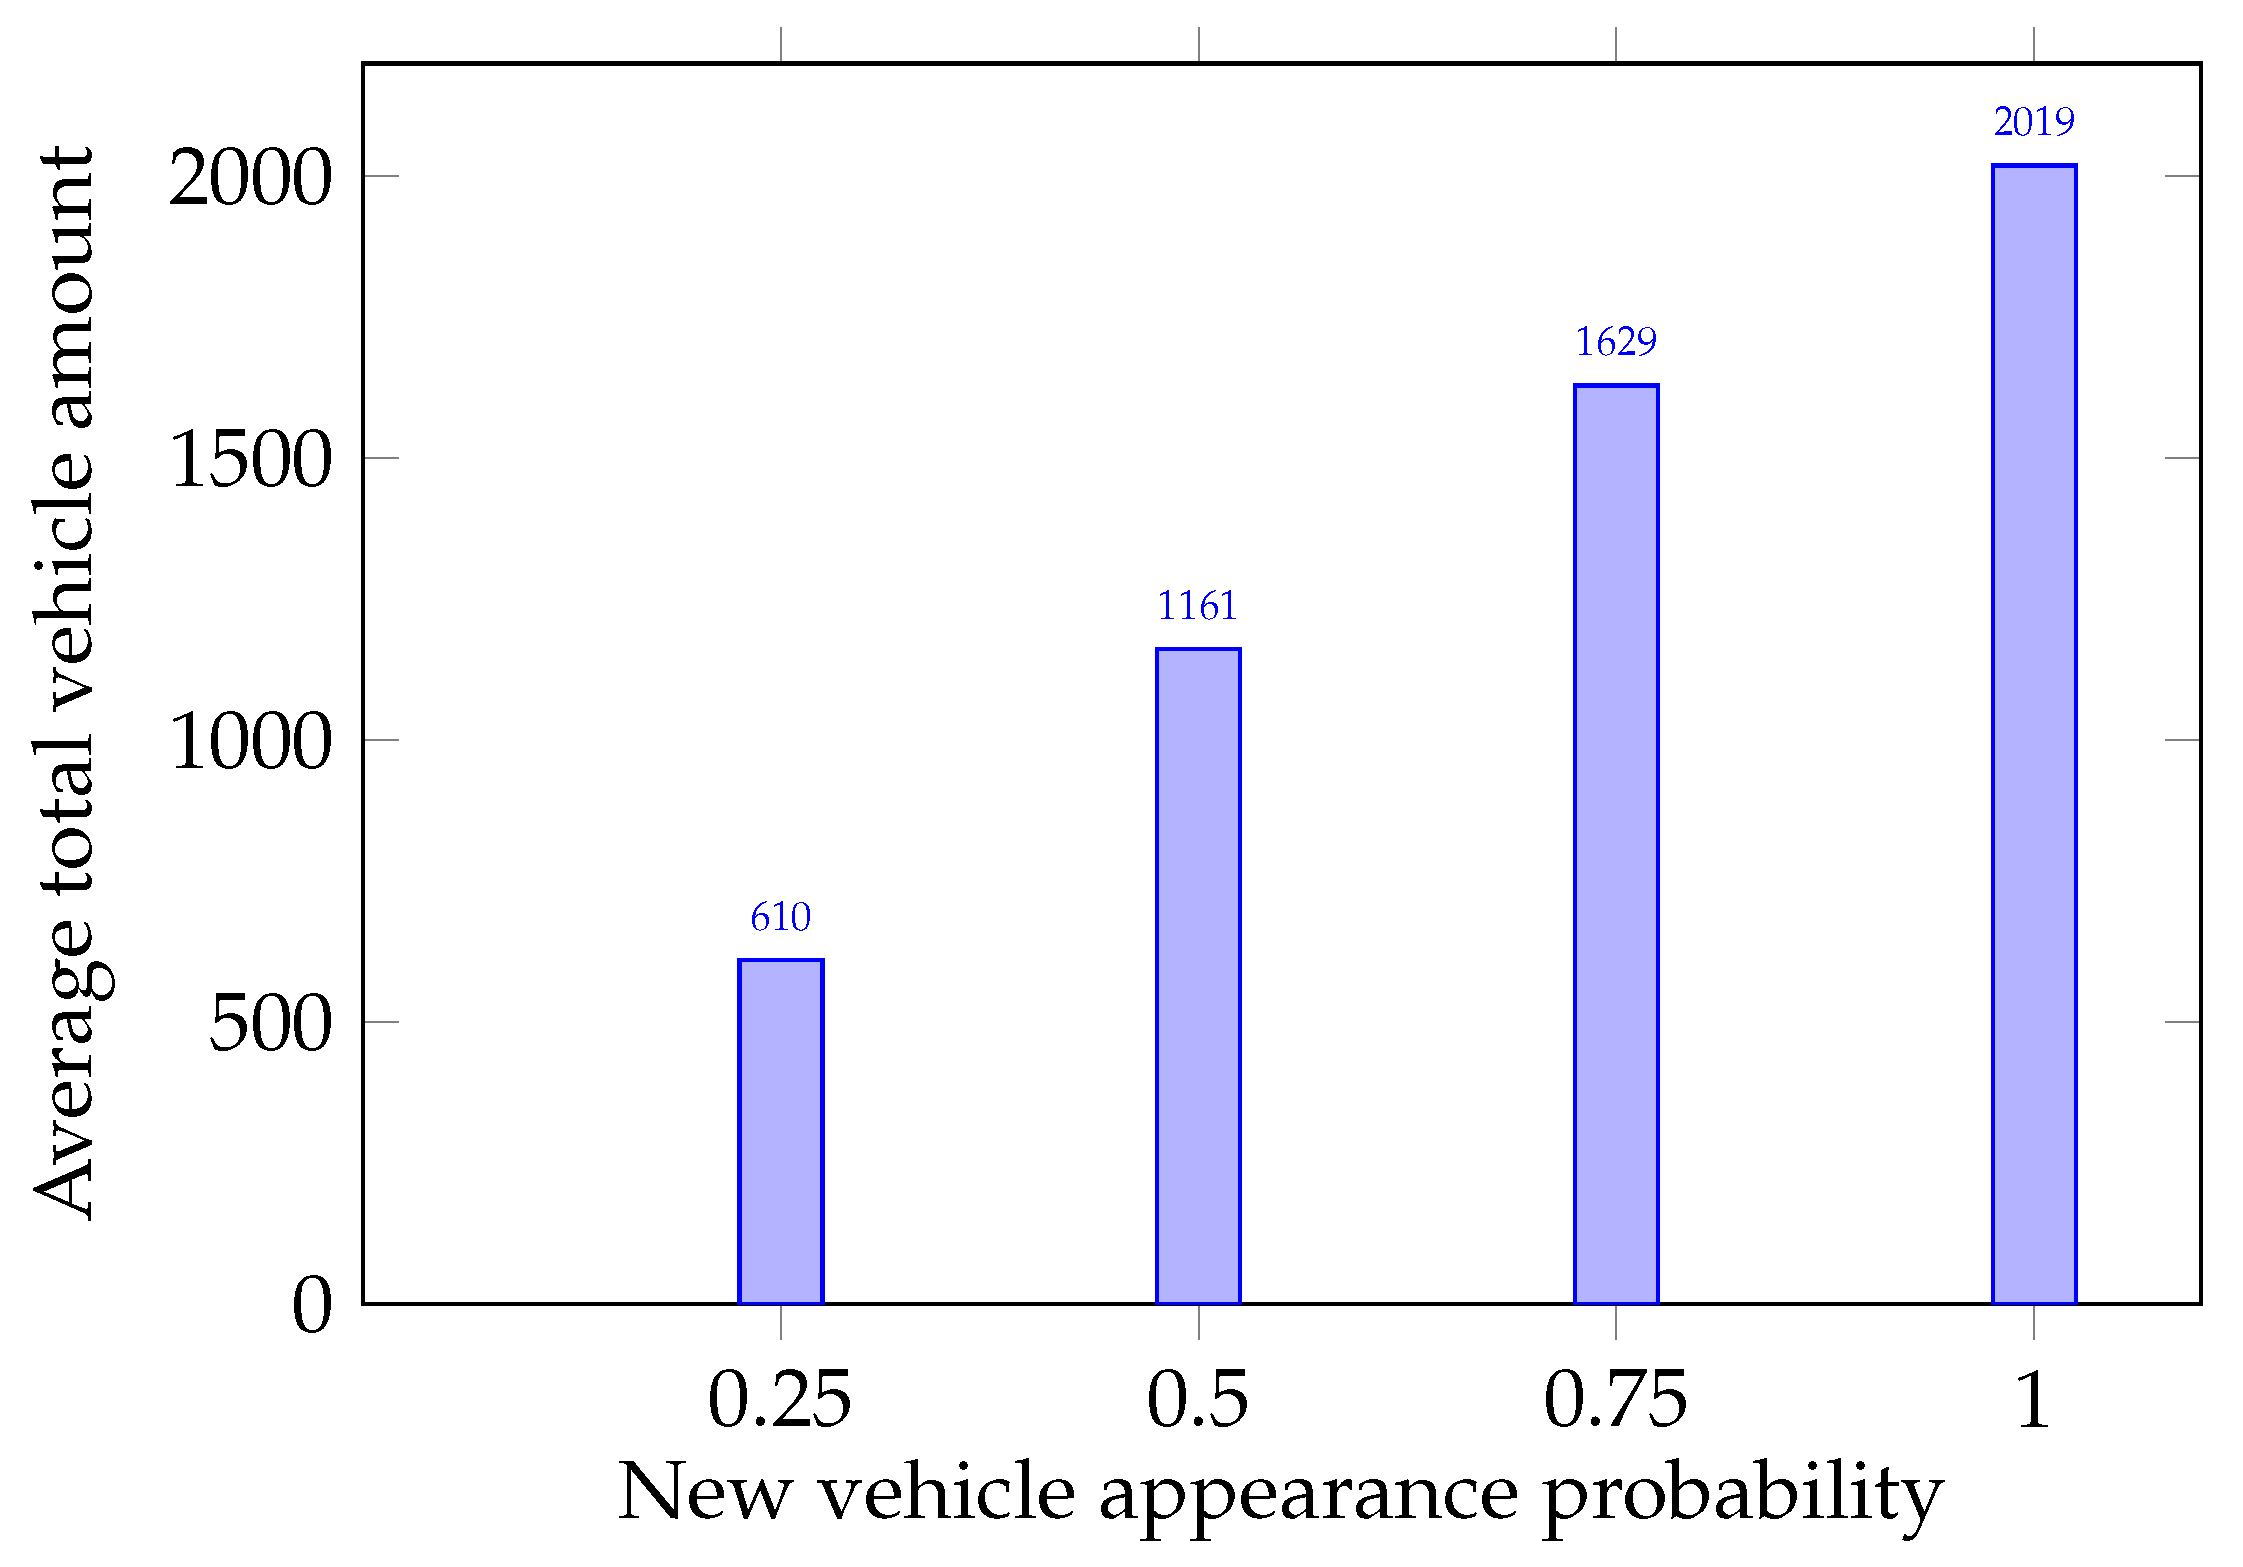
The main purpose of the simulations conducted was to show the method proposed can detect saboteurs in the group of MAVs. This is vital in the context of providing a sufficient safety level in the intersection management system. The average and values were calculated for each of the experiment groups and are presented in Figure 2a. The distribution of average FP and FN is illustrated in Figure 2b. To assess the FP and FN error rates, two relations were calculated: percentage of FP from the total number of legitimate MAVs and percentage of FN from saboteur number. These relations are presented in Figure 3a,b as percentages, respectively. From these relations, one can see that the more the load on the intersection increases, the more strictly the system begins to respond to incorrect data sent by MAVs. The average total number of vehicles that participated in each experiment group is presented in Figure 4.
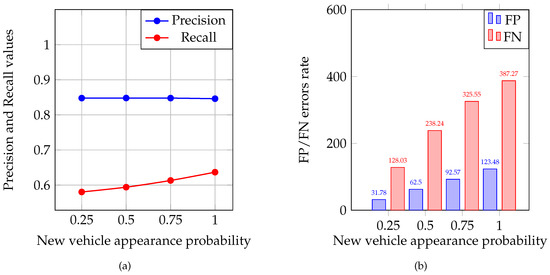
Figure 2.
(a) Precision and recall values distribution through the experiment groups; and (b) FP and FN errors rate distribution.

Figure 3.
Histograms of percentage of FN and FP error rate: (a) FN from total number of AVs, which transmit incorrect data; and (b) FP of total number of vehicles, which transmit correct data.
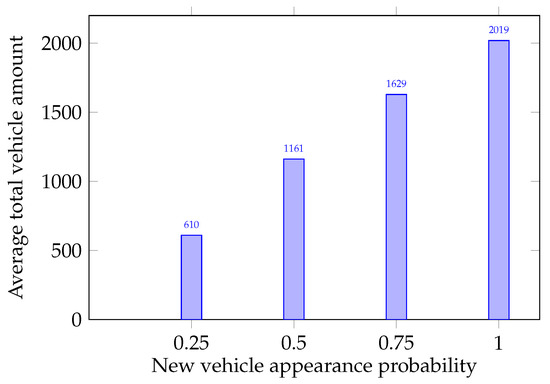
Figure 4.
Average total number of vehicles.
The results obtained have shown the trust and reputation model is effective in saboteur detection regardless of the load on the roads. The MAVs transmitting incorrect data can be found during quite a short period. Prospectively, it is planned to continue the investigation to improve the proposed model, raise the effectiveness of detection parameters, reduce FP and FN errors rate, and determine traffic condition and the impact of the bogus data on it.
4.2. Physical Simulation
4.2.1. Description of the Physical Testing Ground
Prospects for further development of theoretical models involve the consideration of their practical application on real physical objects. To understand the possibilities of implementing the presented model based on reputation and trust in real world, we have developed the physical testing ground, which includes a model of the intersection and three MAVs, assembled from available components. The following is a description of physical testing ground, MAVs, setup and methodology of the physical simulations, and results of the experiments.
We have developed a group of MAVs to implement the theoretical model on the physical ground. Figure 5 represents how each model looks. All MAVs have the same characteristics: appearance, software, hardware, speed, etc. Each MAV consists of:
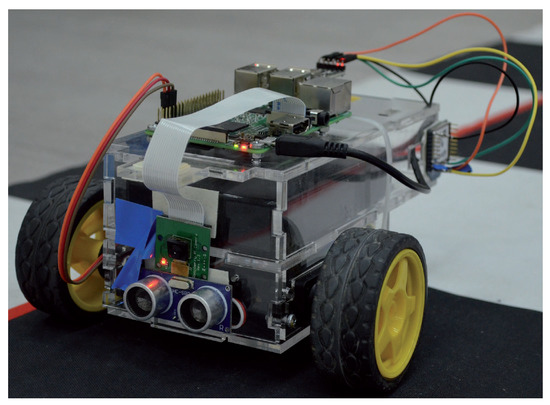
Figure 5.
Model of unmanned autonomous vehicle.
- single on-board computer;
- servos’ control module;
- two servos;
- video-camera;
- ultrasonic range finder (URF);
- wireless module; and
- power supply unit.
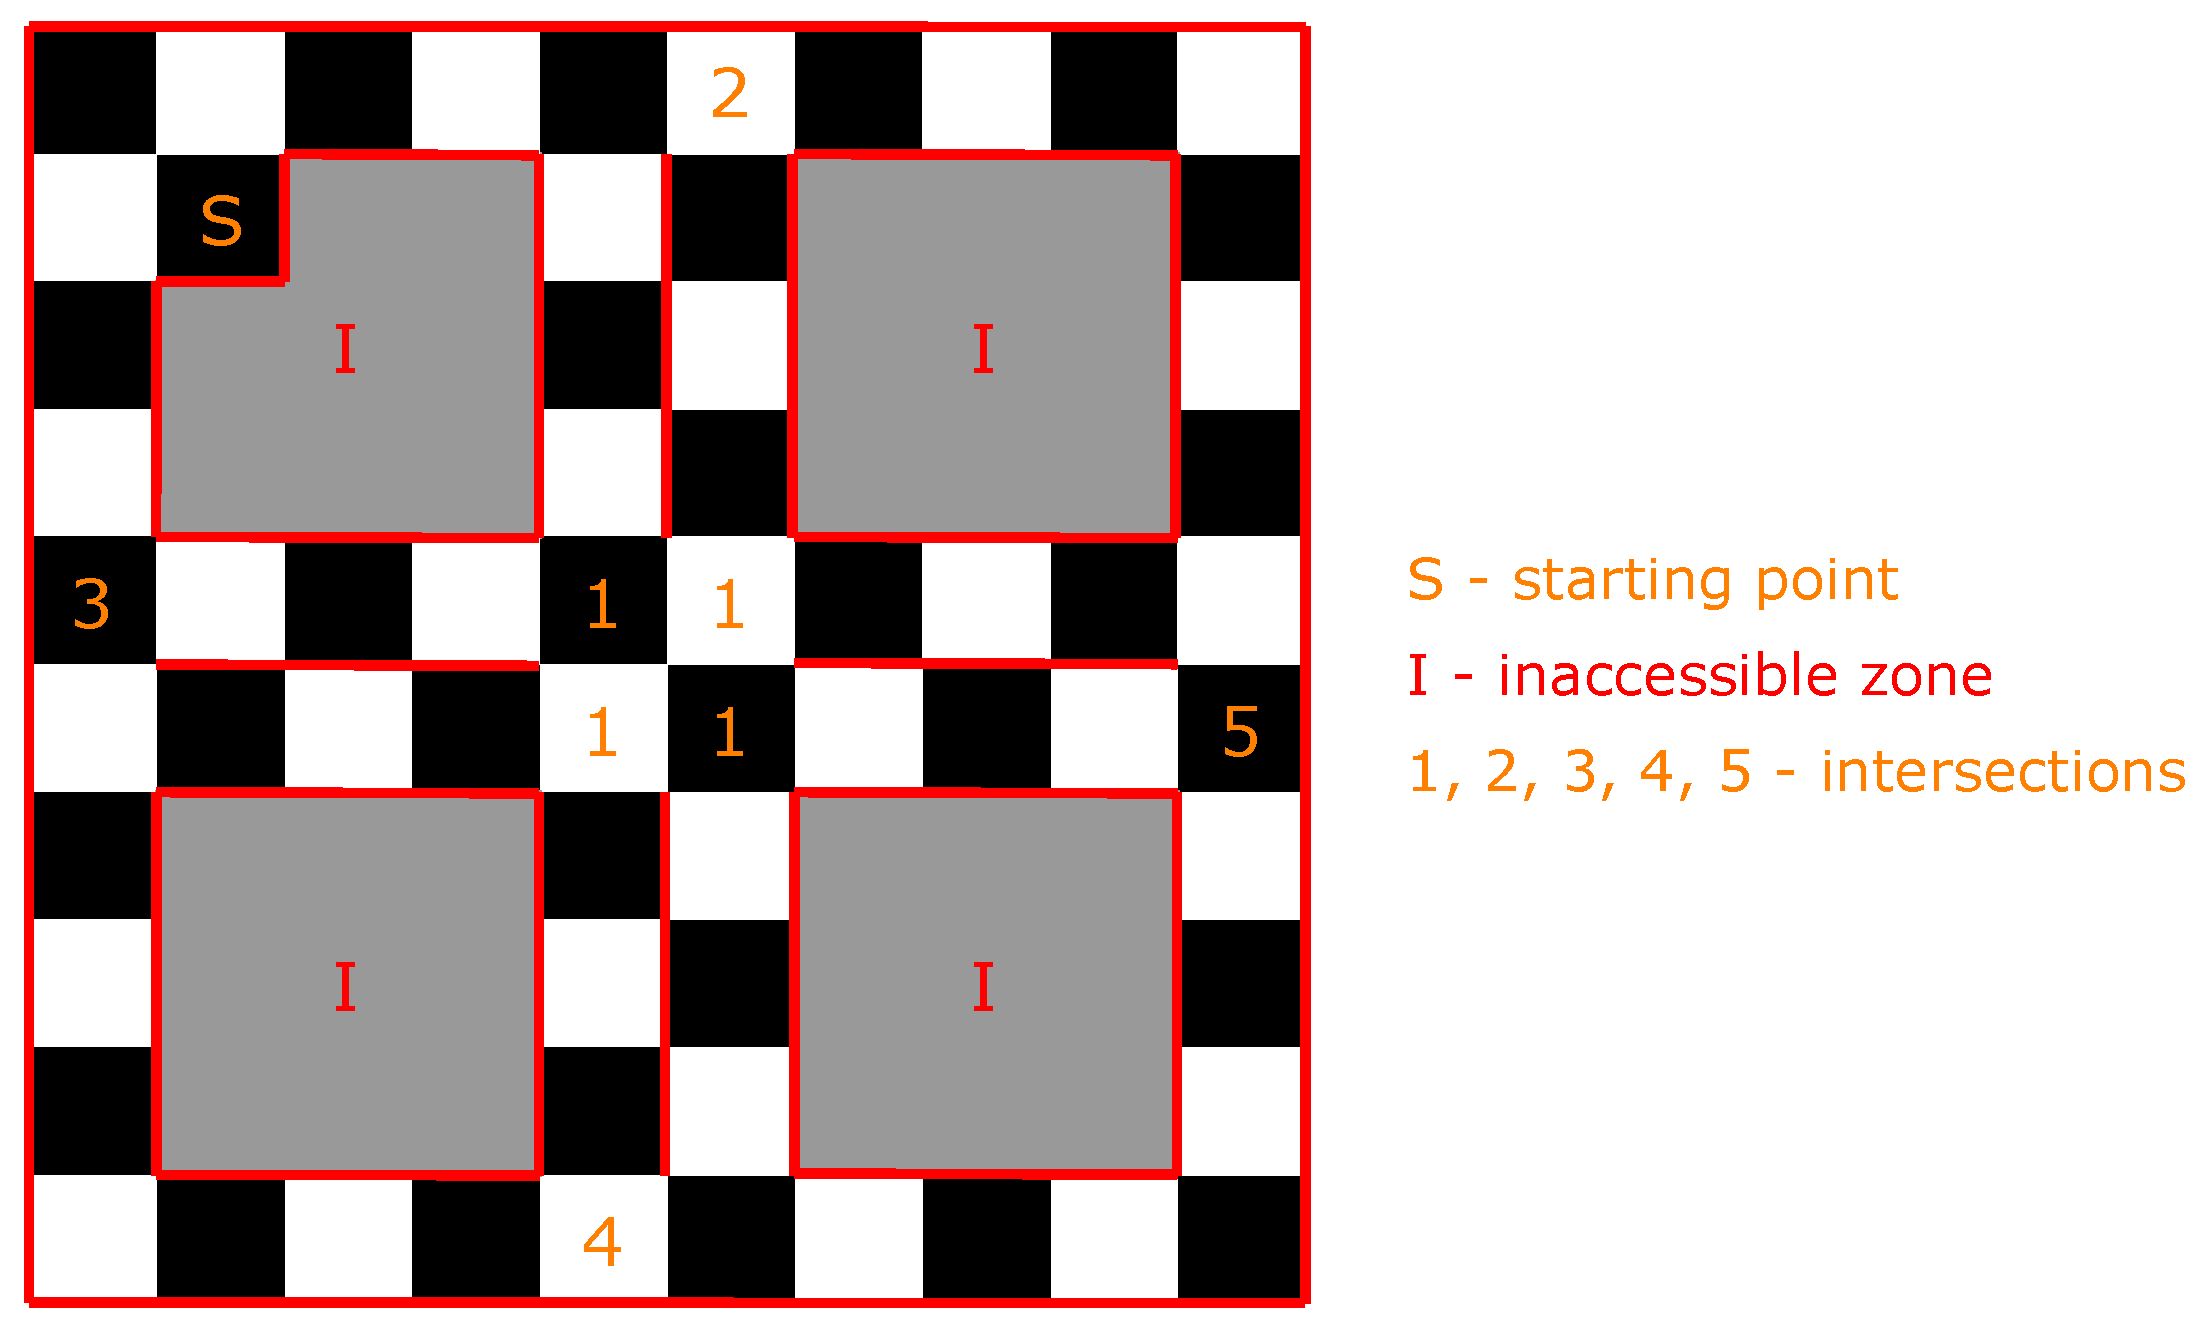
To conduct physical simulations, the model of the intersection should provide an imitation of a part of the urban road network. To establish the current location of any MAV, the roads were split into elementary square sections. Figure 6 presents the developed model of the roads and intersections. The roads consist of elementary sections that were colored in black and white and have borders colored in red.

Figure 6.
Physical model of the urban road network. The numbers indicate the intersections, “I” indicates inaccessible zone for MAVs, and “S” indicates starting point of MAVs.
The main task of the MAVs is to drive according to the generated path. This path is compiled by an algorithm that generates a random endpoint and finds the shortest path. The MAVs should drive without any crashes. Therefore, they need to interact with each other to exchange the data on their location. MAVs transmit their current location each time moment and can predict conflicts. To solve possible conflicts on the intersections, models rely on the priority rules.
MAVs use video cameras to detect their position. The cameras detect the color of the section on which they are located. Then, this color is compared with the color of the previous section and the decision on the current location is made. It is possible because sections color is only black or white. Red-colored borders of the road help MAVs to detect borders using video cameras. Each MAV has a URF to detect other MAVs in front of it.
The implementation of the reputation and trust model allows solving these problems and helps detect intruders within the information interaction of the MAVs’ group.
4.2.2. Physical Simulation Setup
Here, we describe the implementation of the presented theoretical model on physical testing ground and the simulations setup.
Three MAVs were used to perform the simulations. The reputation value can be calculated for the MAV when it is located in front of the intersection. At the start of the simulation, the initial value of reputation for each of the MAVs was set as . After approaching the intersection, the MAV waited for a confidence interval of s. If after this time the MAV did not leave the intersection, we started the R value calculation.
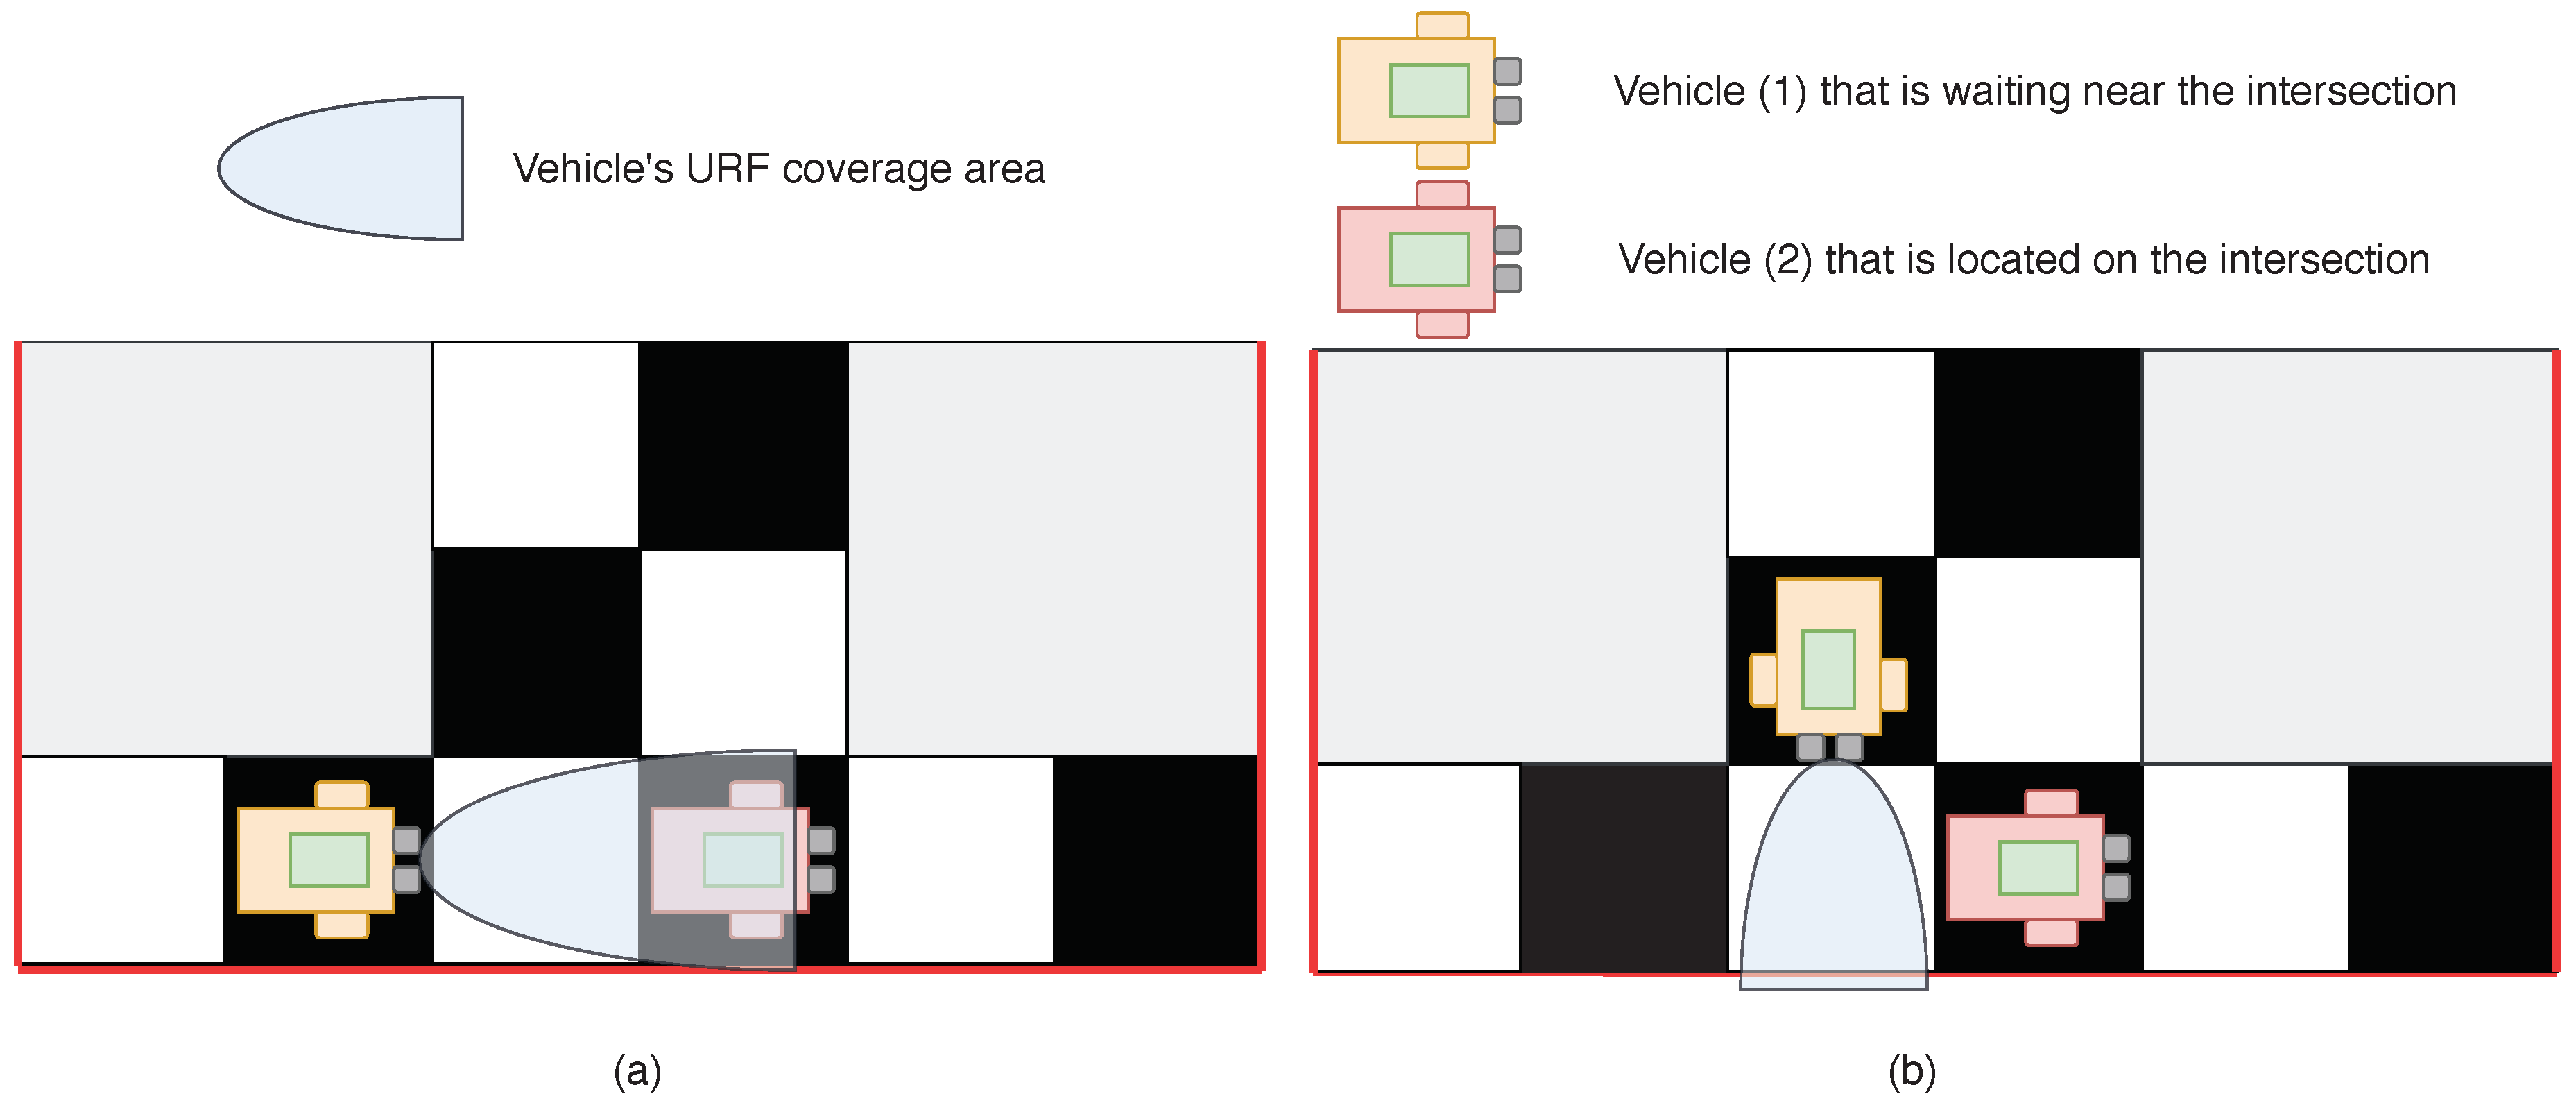
First, we needed to calculate the value. This could be done in two ways. If the MAV was in front of the intersection and the entire intersection was visible, URF could be used to check whether there were other MAVs located at the intersection. An example of such a scenario is represented in Figure 7a. If another MAV was detected at the intersection, then , and otherwise. If the MAV was standing in front of the intersection and the whole intersection was not visible (see Figure 7b), then MAV started to interact with other MAVs and value was calculated based on their “opinion” ( evaluation by other MAVs). In this case, was calculated as , where if the ith MAV opinion was that no one is present at the intersection, and if the ith MAV believed that someone is present at the intersection. Next, we calculated the reputation value according to Equation (8). After that, the intermediate value of reputation was normalized in time.
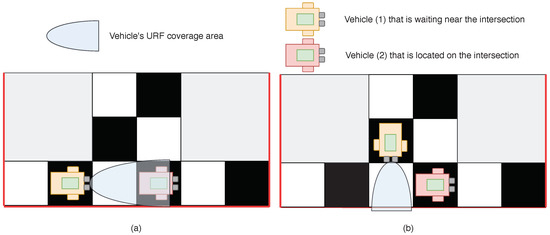
Figure 7.
An example of two possible cases, which can occur at the intersection: (a) The case when the whole intersection is in the field of view of Vehicle (1). Therefore, Vehicle (1) itself checks for the presence of Vehicle (2) at the intersection. (b) The case when Vehicle (1) cannot see the whole intersection and needs to interact with others neighbors.
4.3. Results
According to the results of the experiments, using the approach based on trust and reputation decreases the “waiting” time up to 72 s on average, and the MAV ceases to be trusted after three iterations. “Waiting” time implies the time that MAVs needs to calculate the reputation value is implied. Under iteration, one cycle of updating reputation values is implied, i.e., after three recalculations, the MAVs are no longer be trusted by the reason of the low reputation level (if the reputation is reduced during the system’s operation). The initial “waiting” time was set as 120 s. In other words, the implementation of the approach allows reducing this “waiting” time by 1.66 times.
A series of simulations were conducted in which recalculation of the reputation value was required. Table 1 shows approximate averaged data for the values of reputation and the time elapsed from the occurrence of the conflict situation, in which it was necessary to take into account the reputation value.

Table 1.
Variation of the MAV’s reputation value during physical simulations.
When MAV’s reputation reaches a value of 0.25 or less, it is excluded from interacting with other MAVs. From the results of the simulations, one can see that, if the vehicle begins to send bogus data, then it was disconnected from the communication with others in 41 s on average. Without a reputation-based approach, the wait time was always 120 s. This value was chosen experimentally as the time during which we can be sure that the agent must be disconnected from the system. The implementation of the approach proposed allows calculating this time for each particular situation. Thus, in the event of a malfunction in the system, it stops to opearate for a significantly short time, which is almost three times shorter compared to the operation without using the approach, therefore reducing the likelihood of a traffic accident occurrence.
5. Discussion
In the present work, the method, based on reputation and trust mechanisms has been proposed to improve the safety of AVs in the intersection management system by detecting AVs which transmit incorrect data, and excluding them from further interaction. To verify the effectiveness of the approach, software and physical simulations were conducted, the description of which is given in Section 4. The data obtained in the course of the software simulation, as presented in Figure 3a,b, allow saying that, with an increase in the load on the intersection, the system begins to react more strictly to incorrect data transmitted by AVs. It is worth mentioning that the software simulation was performed with significant assumptions compared to the real world, such as guaranteed message delivery during communication, no interference with data transmission, no delays in data processing, car movement in discrete space, etc. However, the implementation of the method on real physical models showed that its use allows detecting vehicles that transmit false data and excluding them from further communication, which makes it possible to continue further work on improving the implementation of the method on real physical models.
6. Conclusions and Future Work
Progress in the automotive industry and the development of intelligent transport systems in the future can help solve the problem of traffic jams and reduce mortality in traffic accidents. However, before the full implementation of AVs on the streets of our cities, it is necessary to make them safe from crashes and malicious attacks since human lives are at stake. In the present work, we have addressed the problem of transmitting incorrect data by AVs, when crossing intersections and propose the method based on reputation and trust mechanisms that allows detecting AVs with bogus data and exclude them from further interaction. The effectiveness and appropriateness of the method were verified using both software and physical modeling, the results of which show the possibility of applying the method on practice. As tasks for further research, we have identified a decrease in the number of assumptions during simulations and approximation of the system’s functional conditions to real ones, an increase in the load on the system due to an increase in the number of agents, development of a mechanism for internal diagnostics, and troubleshooting of AVs software and hardware components. In addition, the possibility of applying the method in groups of unmanned aerial vehicles (drones) is considered as one more task to explore.
Author Contributions
Conceptualization, S.C. and I.V.; methodology, I.V.; software, I.K.; validation, E.M.; formal analysis, S.C.; investigation, S.C.; resources, D.Z.; data curation, E.L., T.M. and E.M.; writing—original draft preparation, S.C.; writing—review and editing, S.C. and I.K.; visualization, M.U.; supervision, I.V.; project administration, I.V.
Funding
This article was prepared with the financial support of the Ministry of Science and Higher Education of the Russian Federation under the agreement No. 05.605.21.0189.
Conflicts of Interest
The authors declare no conflict of interest.
References
- An, S.H.; Lee, B.H.; Shin, D.R. A survey of intelligent transportation systems. In Proceedings of the 2011 Third International Conference on Computational Intelligence, Communication Systems and Networks, Bali, Indonesia, 26–28 July 2011; pp. 332–337. [Google Scholar]
- World Health Organization. Global Status Report on Road Safety 2018: Summary; Technical Report; World Health Organization: Geneva, Switzerland, 2018. [Google Scholar]
- Sugiyama, Y.; Fukui, M.; Kikuchi, M.; Hasebe, K.; Nakayama, A.; Nishinari, K.; Tadaki, S.i.; Yukawa, S. Traffic jams without bottlenecks—Experimental evidence for the physical mechanism of the formation of a jam. New J. Phys. 2008, 10, 033001. [Google Scholar] [CrossRef]
- Dresner, K.; Stone, P. A multiagent approach to autonomous intersection management. J. Artif. Intell. Res. 2008, 31, 591–656. [Google Scholar] [CrossRef]
- Petit, J.; Shladover, S.E. Potential cyberattacks on automated vehicles. IEEE Trans. Intell. Transp. Syst. 2014, 16, 546–556. [Google Scholar] [CrossRef]
- Erol, R.; Sahin, C.; Baykasoglu, A.; Kaplanoglu, V. A multi-agent based approach to dynamic scheduling of machines and automated guided vehicles in manufacturing systems. Appl. Soft Comput. 2012, 12, 1720–1732. [Google Scholar] [CrossRef]
- Viksnin, I.I.; Zikratov, I.A.; Shlykov, A.A.; Belykh, D.L.; Komarov, I.I.; Botvin, G.A. Planning of Autonomous Multi-agent Intersection. In ITM Web of Conferences; EDP Sciences: Les Ulis, France, 2016; Volume 8, p. 01007. [Google Scholar]
- Chuprov, S.; Viksnin, I.; Kim, I.; Nedosekin, G. Optimization of Autonomous Vehicles Movement in Urban Intersection Management System. In Proceedings of the 2019 24th Conference of Open Innovations Association (FRUCT), Moscow, Russia, 8–12 April 2019; pp. 60–66. [Google Scholar]
- Toh, C.K. Ad Hoc Mobile Wireless Networks: Protocols and Systems; Pearson Education: London, UK, 2001. [Google Scholar]
- Zanjireh, M.M.; Shahrabi, A.; Larijani, H. Anch: A new clustering algorithm for wireless sensor networks. In Proceedings of the 2013 27th International Conference on Advanced Information Networking and Applications Workshops, Barcelona, Spain, 25–28 March 2013; pp. 450–455. [Google Scholar]
- Lu, N.; Cheng, N.; Zhang, N.; Shen, X.; Mark, J.W. Connected vehicles: Solutions and challenges. IEEE Internet Things J. 2014, 1, 289–299. [Google Scholar] [CrossRef]
- Ezell, S. Intelligent Transportation Systems; The Information Technology & Innovation Foundation: Washington, DC, USA, January 2010. [Google Scholar]
- Azmat, M.; Kummer, S.; Moura, L.T.; Gennaro, F.D.; Moser, R. Future Outlook of Highway Operations with Implementation of Innovative Technologies Like AV, CV, IoT and Big Data. Logistics 2019, 3, 15. [Google Scholar] [CrossRef]
- Miller, H.J.; Shaw, S.L. Geographic Information Systems for Transportation: Principles and Applications; Oxford University Press on Demand: Ottawa, ON, Canada, 2001. [Google Scholar]
- Hartenstein, H.; Laberteaux, L. A tutorial survey on vehicular ad hoc networks. IEEE Commun. Mag. 2008, 46, 164–171. [Google Scholar] [CrossRef]
- Uzcátegui, R.A.; De Sucre, A.J.; Acosta-Marum, G. Wave: A tutorial. IEEE Commun. Mag. 2009, 47, 126–133. [Google Scholar] [CrossRef]
- Mahmassani, H.S. 50th anniversary invited article—Autonomous vehicles and connected vehicle systems: Flow and operations considerations. Transp. Sci. 2016, 50, 1140–1162. [Google Scholar] [CrossRef]
- Yang, X.; Liu, L.; Vaidya, N.H.; Zhao, F. A vehicle-to-vehicle communication protocol for cooperative collision warning. In Proceedings of the First Annual International Conference on Mobile and Ubiquitous Systems: Networking and Services (MOBIQUITOUS 2004), Boston, MA, USA, 26 August 2004; pp. 114–123. [Google Scholar]
- Isaac, J.T.; Zeadally, S.; Camara, J.S. Security attacks and solutions for vehicular ad hoc networks. IET Commun. 2010, 4, 894–903. [Google Scholar] [CrossRef]
- Engoulou, R.G.; Bellaïche, M.; Pierre, S.; Quintero, A. VANET security surveys. Comput. Commun. 2014, 44, 1–13. [Google Scholar] [CrossRef]
- Mejri, M.N.; Ben-Othman, J.; Hamdi, M. Survey on VANET security challenges and possible cryptographic solutions. Veh. Commun. 2014, 1, 53–66. [Google Scholar] [CrossRef]
- Karnadi, F.K.; Mo, Z.H.; Lan, K.c. Rapid generation of realistic mobility models for VANET. In Proceedings of the 2007 IEEE Wireless Communications and Networking Conference, Kowloon, China, 11–15 March 2007; pp. 2506–2511. [Google Scholar]
- Hasrouny, H.; Samhat, A.E.; Bassil, C.; Laouiti, A. VANet security challenges and solutions: A survey. Veh. Commun. 2017, 7, 7–20. [Google Scholar] [CrossRef]
- Prasan, U.; Murugappan, S. An Analysis on Vehicular Ad-Hoc Networks: Research Issues, Challenges and Applications. Int. J. Appl. Eng. Res. 2016, 11, 4569–4575. [Google Scholar]
- Al-Kahtani, M.S. Survey on security attacks in Vehicular Ad hoc Networks (VANETs). In Proceedings of the 2012 6th International Conference on Signal Processing and Communication Systems, Gold Coast, Australia, 12–14 December 2012; pp. 1–9. [Google Scholar]
- Lo, N.W.; Tsai, H.C. Illusion attack on vanet applications-a message plausibility problem. In Proceedings of the 2007 IEEE Globecom Workshops, Washington, DC, USA, 26–30 November 2007; pp. 1–8. [Google Scholar]
- Patel, N.J.; Jhaveri, R.H. Trust based approaches for secure routing in VANET: A Survey. Procedia Comput. Sci. 2015, 45, 592–601. [Google Scholar] [CrossRef]
- Yang, N. A similarity based trust and reputation management framework for vanets. Int. J. Future Gener. Commun. Netw. 2013, 6, 25–34. [Google Scholar]
- Lu, Z.; Wang, Q.; Qu, G.; Liu, Z. Bars: A blockchain-based anonymous reputation system for trust management in vanets. In Proceedings of the 2018 17th IEEE International Conference On Trust, Security And Privacy in Computing and Communications/12th IEEE International Conference on Big Data Science And Engineering (TrustCom/BigDataSE), New York, NY, USA, 1–3 August 2018; pp. 98–103. [Google Scholar]
- Liu, Z.; Ma, J.; Jiang, Z.; Zhu, H.; Miao, Y. LSOT: A lightweight self-organized trust model in VANETs. Mob. Inf. Syst. 2016, 2016, 7628231. [Google Scholar] [CrossRef]
- Li, W.; Song, H. ART: An attack-resistant trust management scheme for securing vehicular ad hoc networks. IEEE Trans. Intell. Transp. Syst. 2015, 17, 960–969. [Google Scholar] [CrossRef]
- Truong, N.B.; Lee, G.M. Trust Evaluation for Data Exchange in Vehicular Networks. In Proceedings of the 2017 IEEE/ACM Second International Conference on Internet-of-Things Design and Implementation (IoTDI), Pittsburgh, PA, USA, 18–21 April 2017; pp. 325–326. [Google Scholar]
- Primiero, G.; Raimondi, F.; Chen, T.; Nagarajan, R. A proof-theoretic trust and reputation model for VANET. In Proceedings of the 2017 IEEE European Symposium on Security and Privacy Workshops (EuroS&PW), Paris, France, 26–28 April 2017; pp. 146–152. [Google Scholar]
- Primiero, G. A calculus for distrust and mistrust. In Proceedings of the IFIP International Conference on Trust Management; Springer: Cham, Switzerland, 2016; pp. 183–190. [Google Scholar]
- Javaid, U.; Aman, M.N.; Sikdar, B. DrivMan: Driving Trust Management and Data Sharing in VANETs with Blockchain and Smart Contracts. In Proceedings of the 2019 IEEE 89th Vehicular Technology Conference (VTC2019-Spring), Kuala Lumpur, Malaysia, 28 April–1 May 2019; pp. 1–5. [Google Scholar]

© 2019 by the authors. Licensee MDPI, Basel, Switzerland. This article is an open access article distributed under the terms and conditions of the Creative Commons Attribution (CC BY) license (http://creativecommons.org/licenses/by/4.0/).