Abstract
In this paper, a novel version of the Optimal Distributed Generation Placement (ODGP) problem regarding the siting and sizing of Renewable Energy Sources (RESs) units is presented, called Optimal RES placement (ORESP). Power losses constitute the objective function to be minimized, subject to operational constraints. The simultaneous installation of a mix of RESs is considered and the Capacity Factor (CF) ratio is used as an aid for taking into account: (a) the geographical characteristics of the area, in which the examined Distribution Network (DN) is placed, (b) the different weather conditions, and (c) the availability of RESs, all of that at the same time, while keeping the problem complexity at minimum. The contribution of this work is that the proposed methodology bypasses the weather uncertainties and, thus, the RESs’ power generation stochasticity and provides an adequate solution with minimum computational burden and time, since the proposed CF use allows solving the problem under a straightforward way. Unified Particle Swarm Optimization (uPSO) is used for solving ODGP and ORESP. Moreover, a sensitivity analysis regarding the CFs variations is performed and finally a comparison of the proposed method with a more realistic one is performed, to consolidate further the claims of this paper. The proposed method is evaluated on RES-region-modified 33- and 118 bus systems.
1. Introduction
The implementation of Distributed Generation (DG) has been considered as an efficient way to exploit the advantages provided by the dispersion of small and/or medium sized power units. Installation of such power units, mostly in distribution level, has proved to contribute to several grid-operation issues, such as: loss reduction, either alone [1], or in combination with capacitor banks [2]; considering reliability [3], or even improving it [4]; voltage stability [5], or other, such as improving DG, or RES penetration [6], reducing the RESs’ integration issues in the DN [7] or applied to remote hybrid renewable energy systems [8]. The basic challenge towards the most effective DG penetration is the optimal siting and sizing of the units. Moreover, if storage technologies are to be included, perhaps even better results might be achieved in terms of power quality [9], or smartening the grid [10]. Traditionally, the problem involves the optimization of an objective function by detecting the optimal installation points for the DG units along with their optimal capacity. According to the selected DG technology, either the Optimal Distributed Generation Placement (ODGP) problem for conventional units, or the Optimal Renewable Energy Sources Placement (ORESP) problem for Renewable Energy Sources (RES) units is referred to. It is assumed that the grid penetration of new DGs or RESs will be determined by the Distribution Network Operator (DNO) in terms of a specific strategic plan regarding the optimum location and size for these new power units with the aim to benefit the grid and exploit better the merits of the DG units.
Given this clarification, the ODGP problem for loss minimization in Distribution Network (DN), refers to the optimal siting and sizing of DG units. Such power units are expected to be installed by private investors, under the condition that the DNO would provide guidelines to convey such investments in the recommended locations. These guidelines would in turn conform to the DNO’s strategic plan about loss reduction under ODGP.
The optimal solution for both the aforementioned problems, ODGP and ORESP, towards loss minimization involves the optimization of four variables: the number of units to be installed, the installation points, the capacity of each unit and the aggregated DG or RES capacity to be penetrated. For the ODGP problem most of the published methodologies [11,12,13,14,15,16,17,18,19,20,21,22,23] usually optimize at most three out of the four aforementioned variables, therefore their solutions could not be considered globally optimal. Even with one variable predefined, e.g., the number of units to be installed, the solution is biased and thus it cannot be considered optimal.
Some examples of biased approaches are found in [11,12,13,14,15,16,17,18,19,20,21], where constraints, or pre-sets of at least one of the aforementioned variables, is embedded in the solution process, respectively. There are upper limits [11], upper as well as lower limits for active power [12], same limitations for reactive power [13], as well as apparent power [14] for each DG to be installed. The same applies to [15] as well, confining in that way the optimal solution. In [16] only one DG is considered for installation and there is a constriction on the total DG power not exceeding the total load installed, which constriction is extended in [17], where more than one DG are to be installed, though they are installed one at a time. In [18] the total apparent power of the DGs must be within pre-established thresholds (i.e., between 10% and 80% of the total apparent power load). In [19] the total active power of DGs must also be less than a pre-set limit which is also the algorithm’s termination criterion. Furthermore, there are other penetration schemes relating the optimal solution with the number of DG units to be optimally allocated. More specific, in [20] the problem is solved until a specific predefined number of DG units yield minimum losses, whereas in [21] the same principle is extended to a multi-objective problem, where power loss reduction and voltage profile improvement are considered simultaneously.
A different approach addresses the ODGP problem as two separate optimization problems [22], in a sequential order [23]. In these latter cases, since the solution is influenced by the order regarding the optimization of the two individual sub-problems, it cannot be considered as optimal, but rather sub-optimal. Therefore, the optimal solution, or a near optimal at least, regarding the ODGP problem results from the simultaneous optimization of all variables, as shown in [24].
The ORESP problem could be viewed as a special case of the ODGP problem, since the RES’s power generation variations are imposed by natural resources potentials at each candidate installation area. In this case, several alternatives to the problem formulation are offered.
More specifically, an alternative approach aims in solving the problem on a sequential approach meaning that firstly the optimal siting and sizing of the RES units is determined by facing them as conventional DG units and then their technology type, e.g., PV or Wind Power, is defined, as in [25]. The problem in this case is that no mix of RESs is examined and the solution could be somehow biased. If an optimal mix is required, an investigation about the way the DGs affect power quality and reliability issues must be performed, since the DG penetration level could be limited by harmonic distortion caused by the inverter-based DG units, as well as by protection coordination constraints because of the variation in fault current caused by synchronous-based DG units [26]. Another approach is to apply the Effective Load Factors (ELFs) concept for each bus and each technology of DG [27], but in this case the approach could just be considered a spare of computational effort while the solutions could rely on approximations. In [28], the optimal mix of DGs of different technologies has been achieved via stochastic models of wind speed and solar irradiance. The problem though in this approach is that the candidate nodes for DG installation are predefined and thus, only the sizing of them is determined. Finally, the different DG technologies could be categorized based on their power output, i.e., whether they can control active/reactive power independently (PQ mode, or constant power factor mode), or active power and voltage (PV mode, or variable reactive power mode), as presented in [29]. In this work, the goal is to optimize a multi-objective function that considers both power loss minimization and optimal voltage profile for the DN by simultaneously yielding the optimal siting and sizing of the DG units under consideration. However, the aforementioned distinction between different DG technologies might not be adequate enough, since it is applied in terms of power type management i.e., active/reactive power, and not in terms of energy resource, i.e., solar, wind, hydro, etc., or availability of that resources.
In this paper, both aforementioned problems are examined. The optimal siting and sizing of both DG or RES units is specified via the nodal power requirements that could achieve loss minimization. Unified Particle Swarm Optimization (uPSO) [30] technique is examined for both problems and the methodology is applied to two widely used networks: a radial one with no installed DG units, i.e., the IEEE-33 bus system, and a meshed one with existing DG penetration, i.e., the IEEE-118 bus system. For the ORESP case in particular, Capacity Factors (CFs) are introduced and the buses of the examined DNs are divided into regions with different CFs, reflecting different areas with different potential of installing RESs and more specifically, Photovoltaic (PV), Wind Power (WP) and micro or small Hydro Power plants (HD). The aim is to examine the optimal mix of RESs in a DN with the aid of CFs, while retaining the problem complexity at minimum, instead of a more comprehensive and realistic case study, which will consume much more time and effort. A sensitivity analysis of all possible CF permutations among all areas of each DN is performed, in order to examine how these variations about the potential of the natural resources affect the solution and finally a comparison with a more comprehensive and realistic approach is presented, from the aggregator’s perspective, in order to consolidate the claims of the proposed methodology. The results highlight how the solution to the ORESP problem differentiates from the corresponding one for the ODGP problem due to the use of variable CFs, instead of a unity CF and how the particual use of CF leads to much less computational effort, while achieving an adequate solution. The required simulations have been conducted in Matlab, using MATPOWER [31].
This paper is organized as follows: in Section 2 the problem formulation along with the PSO algorithm for ODGP and ORESP is presented. In Section 3, the examined DNs are demonstrated along with the results after the algorithm application. The sensitivity analysis for the ORESP is also contemplated and presented. Section 4 includes a comparison between the proposed method and a more realistic one, whereas Section 5 is devoted to conclusions.
2. Proposed Methodology
2.1. Problem Formulation
In this work, the optimal penetration of DG or RES units is implemented towards loss minimization. Thus, the objective function to be minimized is:
where:
- , are the voltage magnitudes of bus i and j.
- is the conductance between buses i and j.
- , are the voltage angles of bus i and j.
- is the total number of branches.
- is the objective function.
- is the voltage of node i,
- , are the bus lower and upper voltage limits, respectively,
- is the current of k line, and,
- is the thermal current limit of k line.
The ODGP is a mixed-integer non-linear constrained (MINLC) optimization problem. In general, constrained problems can be solved using either deterministic, or stochastic algorithms. However, deterministic approaches such as feasible direction and generalized gradient descent, require strong mathematical properties of the objective function such as continuity [32] and differentiability [33]. In cases where these properties are absent, evolutionary computation, such as PSO, offers reliable alternative methods. This has been recently verified in [34].
Since most evolutionary approaches were primarily designed to address unconstrained problems, constraint-handling techniques are usually required to detect only feasible solutions. The most common constraint handling technique is the use of penalty functions, for which it is deduced that despite their drawbacks, they perform rather efficiently, provided a proper calibration of the penalty parameters is undertaken [30]. According to this approach, the original objective function is transformed to a function that penalizes unfeasible solutions by adding penalties to their values based on the number and magnitude of violated constraints, as follows [14]:
where:
- is the penalty function, or .
- is the objective function ().
- , are the penalty term and penalty factor, respectively.
- , refer to equality and inequality constraints, respectively.
Therefore, for the ODGP problem, the updated Penalty Function () could be written as follows:
with , , referring to the active and reactive equilibria of each node of the DN, acting as penalty terms of the equality constraints, respectively, i.e.,:
and , , referring to the voltage bus limit of each node and thermal line limit of each line of the DN, acting as penalty terms of the inequality constraints, respectively, i.e.,:
where:
- is the real power generation on bus i,
- is the reactive power generation on bus i,
- is the real power demand on bus i,
- is the reactive power demand on bus i,
- is the total number of network’s buses,
- is the total number of network’s lines,
- is the magnitude of bus admittance element ,
- is the angle of bus admittance element .
2.2. PSO for ODGP Problem
The ODGP problem consists of finding the optimal installation points for DG units (siting), along with their optimal capacity (sizing). To ensure a non-biased solution, apart from siting and sizing, the number of DG units to be installed and the total aggregated DG capacity to be penetrated, should be considered. Therefore, the solution should refer to the simultaneous optimization of all these four mentioned variables [24]. Moreover, as stated earlier, the ODGP is a MINLC optimization problem, subject to several constraints, and the computational volume is susceptible to exponential increase. In this paper, the problem is solved via PSO algorithm due to its ability to provide efficient solutions under minimum computational effort and a particular version of PSO called uPSO, developed by Parsopoulos and Vrahatis [30].
uPSO is a version of PSO in which the two basic versions of PSO, i.e., the Global and Local PSO are merged. The former promotes mainly the exploitation of the solution space, whereas the latter encourages mostly the exploration. Hence, uPSO aims to highlight their advantages while, in parallel, refraining their flaws, thus providing a better balance between exploration and exploitation of the solution space, and therefore improving the swarm’s ability to avoid local optima and reduce convergence time. In this paper a specific version of uPSO is used, using constriction factor and swarm partitioning, as shown in [35], where the introduction of uPSO in the ODGP problem is presented and in [36], where a more thorough comparative analysis of uPSO against other methods is contemplated. A generic flowchart and a vector diagram regarding the velocity and position determination are presented in Figure 1 and Figure 2.
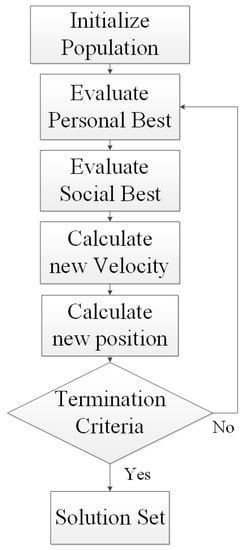
Figure 1.
PSO flowchart.
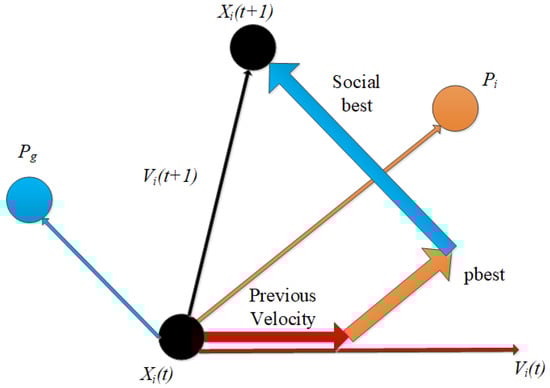
Figure 2.
PSO—velocity vector diagram.
The particle formulation, that is the solution space for the ODGP problem, is the following:
where:
- i is the bus number.
- m the number of generators.
- refers to active power generation at ith node.
The specific formulation for each particle ensures that all problem variables are optimized simultaneously. The first part of the particle (i.e., ) denotes that all nodes are candidates for DG installation, thus no constraints for the number of the DG units or the installation points are imposed. The second part (i.e., ) denotes that no pre–definitions of the aggregated DG capacity and each unit’s capacity are embedded in the problem.
2.3. PSO for ORESP Problem
The basic difference between the ODGP and ORESP problems is that in the latter, variations regarding the power output of RESs related to their technology and the natural resources’ potential have to be taken into account. For example, in this paper, solar irradiance, wind speed and water availability are expected to vary among candidate installation points within a DN, and these variations could have a significant impact on the optimal siting and sizing of such RESs, especially when a mix of various RES technologies is examined. In this paper, as aforementioned earlier, three different technologies of RESs are considered available for installation: PV, WP and HD units. Thus, apart from the optimal siting and sizing the optimal mix of different types of RESs units should be incorporated. In this paper, this additional complexity is introduced by the appropriate reformulation of each particle and of the corresponding penalty function , as presented in Equations (12) and (13):
where:
- is the number of RESs, and
- is the corresponding penalty term.
As observed in Equation (12), each particle in the ORESP problem consists of three parts, each describing the optimal siting and sizing of each RES technology, as in the ODGP problem. The particle formulation in Equation (12) ensures that all available RES technologies are examined concurrently for installation in the network, hence avoiding any bias. Thus, the optimal solution under the proposed approach refers to the following optimization:
- optimal siting of RESs units,
- optimal sizing of RESs units,
- optimal aggregated RES capacity to be penetrated,
- optimal mix of RES technologies, and,
- optimal optimal number of units regarding each RES technology and in total,
The additional variable’s implementation is performed by the aid of the CFs for the three RES technologies at each node. Each node should be treated as a candidate installation point with different CFs concerning the three examined RES technologies. The values of these CFs express the potential of the respective natural resources in this particular installation point. Thus, the promotion of one or more RES technologies for installation will be defined by the solution algorithm.
The for the ORESP formulation, shown in Equation (13), differentiates from the corresponding for the ODGP problem as presented in Equation (6), due to an additional penalty term that should be considered regarding the CFs, as seen in Equation (14). The network nodes are divided into regions, representing different areas with different natural characteristics and resources, therefore different CFs. Thus, according to their positions, RES units obtain their appropriate CFs. These CFs are then added up together and the sum is subtracted from the .
The contribution of the proposed methodology is the consideration of one or more RES technologies via their respective CFs; the CFs’ incorporation to the shaping of the final solution through the addition of one simple penalty term, i.e., the CFs’ penalty term; the consideration of all examined RES technologies for possible installation happens concurrently, ergo the final solution will not be biased as it would be if different RES technologies are installed one technology at a time [25].
The is problem- and constraint-dependent, i.e., it cannot bear a univocal and constant value for all the penalty terms and for all the test cases. Thus, after thorough examination, the penalty terms of each penalty factor, are given the appropriate value in order to be comparable with the target function. Special care has been drawn upon the CFs’ constraint penalty term which is given a suitably high value, reflecting the term’s strict prohibition upon geography and natural resources.
3. Results
3.1. Examined DNs
The proposed methodology for both ODGP and ORESP problems has been applied on the typical 33 [37] and 118 [38] bus systems. These DNs have been selected, in order to cover a wide application spectrum, since the first one is a radial network without DG units installed, whereas the second one is a meshed one, with a high penetration of DG units. To assign different capacity for the local natural resources at each node, each DN has been divided into three areas. Within each area each node is assigned a CF corresponding to the three examined RES technologies. Assuming that each area is relatively small, it is rational to accept that the nodes within each sub-area share the same CFs for the respective RES technologies. Figure 3 and Figure 4 present the aforementioned DNs, while the three areas with different CFs are suitably shaded.
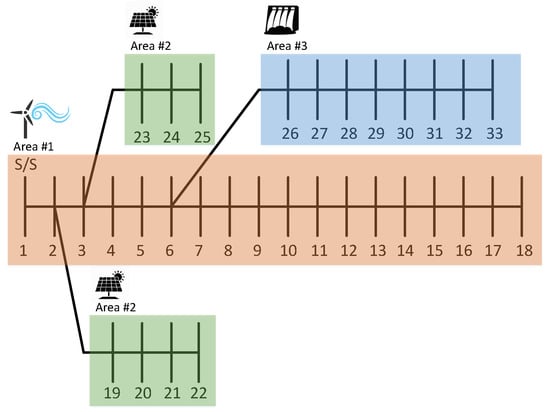
Figure 3.
33 bus system divided in three areas.
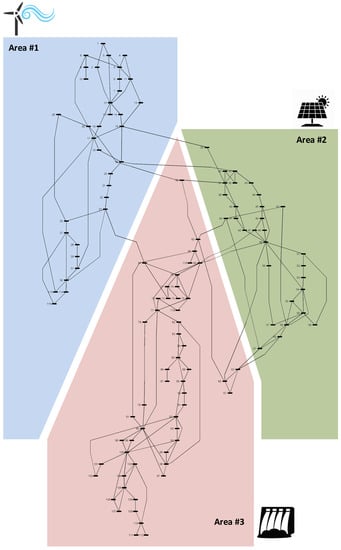
Figure 4.
118 bus system divided in three areas.
In Table 1 the values for the CFs used for this paper, as a case study, are presented. It should be stated that these values constitute typical values regarding PV, WT and HD units, respectively [39,40,41]. Especially for HD units the possible values for their respective CF are either zero, if there is no availability of water resources in the area, or 0.45, if otherwise. Furthermore, as a base case scenario, the CFs have been assigned at each area, so that each resource would be promoted more than the others in a particular area, e.g., the WPs in area #1, as shown in Table 1 and also in Figure 3 and Figure 4.

Table 1.
CFs values.
3.2. Results about the Examined Scenarios
For consistency reasons with most of the published respective methodologies and current real practice, both ODGP and ORESP have been examined considering DG and RES units, respectively, as active power producers. The reason for this is that the majority of the existing ODGP approaches examine the installation of DG units with unity power factor. Therefore in order to enable a direct comparison between the two problems (ODGP and ORESP) both WP and HD units were assumed to produce only active power. In Table 2, Table 3, Table 4 and Table 5 the results about the ODGP and ORESP problems for the 33 and 118 bus systems are accordingly presented. CFs for the ORESP are presented in Table 1.
Table 2.
ODGP results for 33 bus system.
Table 3.
ORESP results for 33 bus system.
Table 4.
ODGP results for 118 bus system.
Table 5.
ORESP results for 118 bus system.
The results shown in Table 2 and Table 3 indicate that both approaches yield almost the same loss reduction. It is also apparent that the majority of the nodes (4 nodes in ORESP from 6 in ODGP, respectively) that emerge as the critical ones for DG installation towards loss minimization are still the prevalent ones to also host RESs. Finally, based on the CFs values to the three DN areas, the algorithm promotes the installation of the most appropriate RES technology to the areas with the highest CFs.
Although the aggregated RES capacity is lower than the corresponding of DG, since in the 118 Bus system there is already DG installed, the results shown in Table 4 and Table 5 indicate a smoother capacity distribution for the ODGP problem as compared to the ORESP, where a larger number of RES units is installed. In this latter case the majority of the RES units constitute relatively small units while only three nodes are prevalent to host large PV or HD units, i.e., node 41, 54 and 70, respectively. Apart from that, loss reduction is higher in the ODGP problem as compared to ORESP, because in ODGP all nodes share the same production potential (i.e., candidate units with unity CF), thus the nodes’ position is expected to play essential role towards the optimal solution.
In the ORESP problem the different CFs for the nodes among the three DN areas modify the problem since the algorithm is guided to perform a compromise between the prioritization of the candidate nodes to host units and their power production potentials defined by the assigned CFs. By that sense, the solution regarding the ORESP problem shown in Table 2, Table 3, Table 4 and Table 5 is expected to be altered given different CF values from those shown in Table 1. Nevertheless, the analysis in this paper proposes an efficient formulation concerning the structure of the PSO algorithm, both the particle formulation and problem statement, for the ORESP problem and the results highlight that the solution in this case is modified in terms of siting and sizing about the RES units with respect to the solution derived from the ODGP problem. Thus, although some network nodes seem to be prioritized for power unit installation, this observation might not be valid when different production potential are taken into account.
In Figure 5 the voltage profile of the 33 bus system is presented.
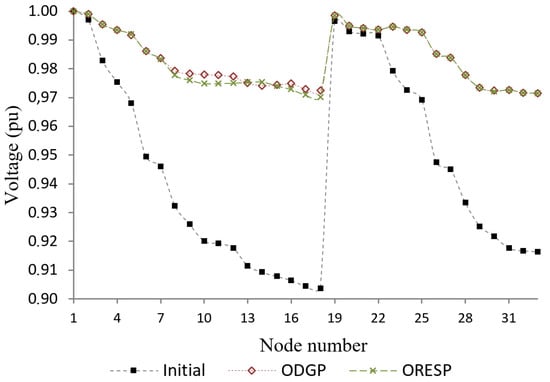
Figure 5.
Voltage profile for 33 bus system regarding the ODGP and ORESP problems.
Although the voltage profile improvement for both problems seems to be almost the same, as presented in Figure 5, some nodes experience a slightly better voltage profile in the ODGP problem with respect to the ORESP. This is because the power capacity deviations among DG units are smaller than the respective ones among the RESs. Thus, the aggregated penetrated DG capacity is distributed at the installation nodes under a more uniform dispersion with respect to the ORESP case. The same conclusion stands for the 118 bus system as illustrated in Table 6.
Table 6.
Average voltage profile for the 118 bus system.
3.3. Sensitivity Analysis Regarding the CFs Assignment
A crucial aspect of the ORESP problem formulation is the selection of the CF value of each node, since changes of the CFs of various RES types among the considered network areas or among the nodes of the same area, are expected to assign different power production capabilities for each node. Therefore, these changes are expected to prioritize specific nodes for RES installation with respect to others. This could be assumed valid, if the impact of each node’s position across the network for loss minimization is negligible. Therefore, it is accepted that the nodes with the highest CFs are expected to host the respective RES technologies. To investigate the impact of CF variations among the network, on both siting and sizing of RESs, a sensitivity analysis regarding all possible permutations for the CFs shown in Table 1 has been performed. The possible CF permutations of the same RES technology per column (i.e., for the 3 areas) is equal to six, thus considering three RES technologies for each DN the total scenarios examined is equal to . In Figure 6 the results provided by the sensitivity analysis concerning the 33 bus system are presented.
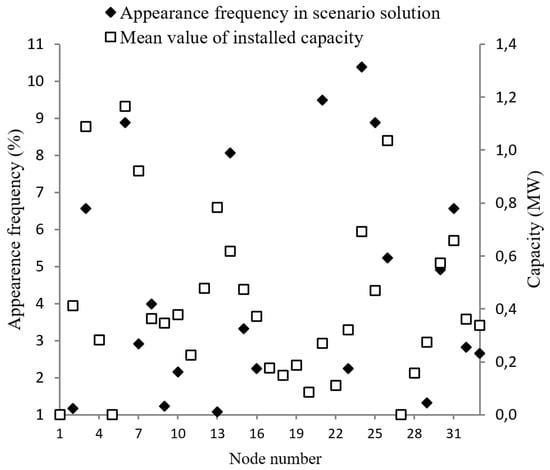
Figure 6.
Sensitivity analysis regarding CF variations for 33 bus system.
In Figure 6 the primary (left) y-axis presents the % participation frequency of each node for the 216 different scenarios regarding different assignments of the CFs of Table 1 among the network’s nodes, while the secondary (right) y-axis presents the mean capacity for all types of RES units. Figure 6 presents the prioritization of the network’s nodes for RES installation along with the mean power production of the respective units for loss minimization, for all possible prioritizations concerning the power production potentials of the nodes. The first six more frequent nodes to host RESs among the 216 scenarios for the ORESP are nodes 6, 14, 21, 24, 25 and 31 regardless of the CFs assignment among the three areas, while the optimal nodes for DG installation for the ODGP problem are nodes 6, 10, 16, 24, 25 and 31 (Table 2 and Table 3). Four out of six nodes for the ODGP problem are the ones to be the optimal for RES installation concerning the ORESP problem regardless of the nodes’ production potential. The results show that for either DG or RES units, some specific nodes seem to constitute more dominant installation points but further investigation is required to come up to a safer conclusion.
In Figure 7 the variations regarding different RES technologies installation for node 6 (33 bus system) and for all 216 examined scenarios are presented. It is observed that for this node, the most frequent RES type assignment concerns the installation of HD units while the less frequent one concerns PV units. It should also be reminded that this specific node is indicated by the algorithm as a highly prevalent node regarding DG or RES installation towards loss minimization. Thus, since the CF for HD units is too high with respect to the other two RES technologies, the algorithm recommends in most cases the installation of HD units in this node, whenever water is available in the area. Nevertheless, the sensitivity analysis provides all the information for the RES type installation and for each node, with respect to the CFs changes among the defined areas of each DN. This could potentially indicate possible correlations between the natural resources capacity of each node and the actual RES type requirements for loss minimization.
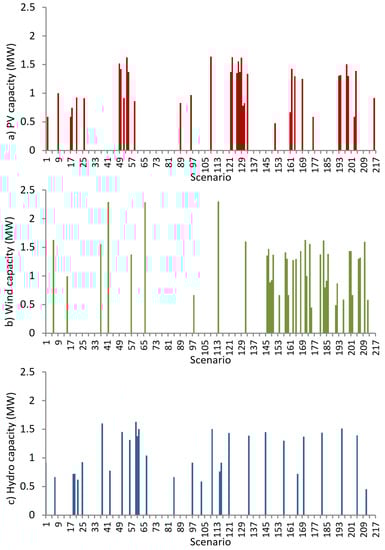
Figure 7.
Sensitivity analysis regarding different RES type installation for node 6 (33 bus system): (a) PV (b) WP (c) HD.
4. Detailed Analysis with Load and Generation Timeseries
The ORESP, as examined above, takes into account a particular state of an examined DN, i.e., a particular state of the load, or a single snapshot of it. However, for a more realistic approach, time is a vital factor, since the load changes over time, as well as the generation of a RES unit. Thus, time variations for the loads on the buses should be considered, as well as for the generation of the RES units to be installed. This leads to using timeseries for both of them. It also means that the objective function should be expanded from power to energy loss reduction, as depicted in Equation (15):
where:
- is the time interval considered and,
- is the total time period considered.
since, the impact of power losses over time, i.e., energy losses, becomes the real issue now.
Regarding the constraints, they remain the same as stated in Section 2. The difference is that a time period is considered and therefore the worst cases over that time period are taken into account, and those are considered as inputs for the penalty terms and finally into the formulation of the . For instance, for the maximum voltage constraint, the maximum bus voltage reached during the time period examined for each node is taken into account, since this is the most severe case.
As for the particle formulation for this case, it remains the same as in Equation (12). However, instead of introducing CFs in every single bus of the examined DN, according to the area that belongs to, a particular timeseries of weather conditions is assigned, e.g., solar irradiance or wind speed. This, in turn, leads to particular RES generation timeseries and, hence, a specific CF for a RES technology.
4.1. Load Variation
To simulate load variations over time, standard load profiles provided online by [42], have been retrieved. These standard load profiles are annual timeseries in a quarter of an hour interval. For combining them with the examined DN, the following assumptions are made:
- the examined DN’s single snapshot is the annual DN’s load peak,
- the total DN load, as seen from the Slack Bus, follows the standard load profile’s pattern,
- the buses’ load profile follow their own random individual patterns, while not breaching any DN constraint, thus, no uniform load variations are considered, and,
- their total summation is equal to that seen from the Slack Bus, plus losses.
This aims to create, not only a load variation, but also load variation diversity, since the load on each bus follows seemingly each own load profile. These are depicted in Figure 8 and Figure 9, where it can be seen that the loads on three buses, 3, 10 and 22 of the 33 bus system, follow their own individual load profiles, and, when combined, the load, as seen from Slack Bus’ point of view, follows the standard load profile.
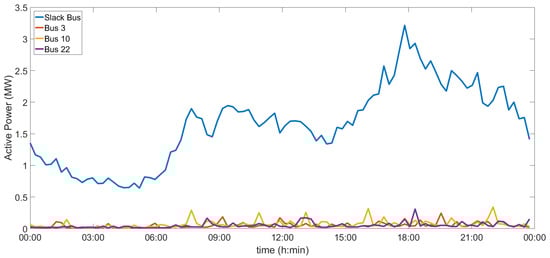
Figure 8.
Daily load profiles of Slack Bus and Buses 3, 10 and 22 of the 33 Bus System.
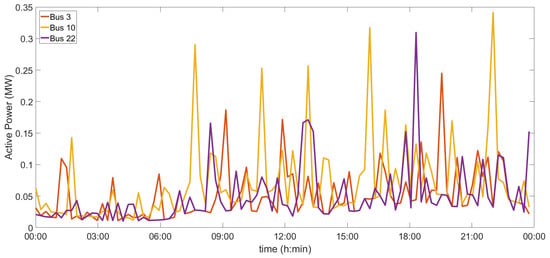
Figure 9.
Daily load profiles of Buses 3, 10 and 22 of the 33 Bus System zoomed in.
4.2. Generation Variation
In this case, only PV and WP generation will be taken into account. HD units have been omitted for this part, as they are susceptible to less stochasticity and hence unpredictability than the others.
4.2.1. PV
For the PV generation, real data of irradiance have been used directly, that is, the solar irradiance timeseries data have been retrieved from SoDa Service [43]. In this paper, the power generated by a PV unit is considered to be depended on solar irradiance and its rated power. In Figure 10 the solar irradiance for two buses within a period of one day is presented and its respective variation, reflecting in that way various weather conditions, such as cloudiness.
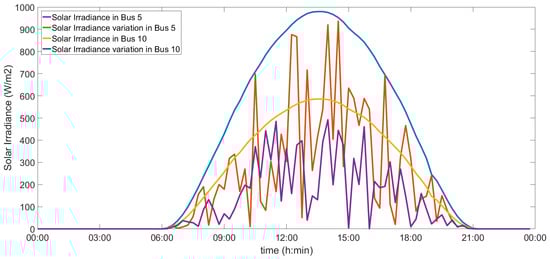
Figure 10.
Daily Solar Irradiance Variation.
4.2.2. WP
For the WP generation, synthetic data have been generated, based on real wind speed data measurements from Serifos Island, Greece.
More specifically, the Weibull probability distribution function (pdf) is selected [44], as a good model of the wind speed’s uncertainty [45]:
where and are the Weibull shape and scale parameters, respectively, determined by the real wind speed data measurements.
The power output of the WP units, being depended on the on-site wind speed and power performance curve, is calculated as follows:
where:
- , is the power output of the WP unit according to the current wind speed,
- , is the rated power of the WP unit,
- , and are the cut-in, rated and cut-out speed of the WP unit, respectively.
As cut-in, rated and cut-out speeds for the WP units 4, 12 and 24 m/s have been selected as typical values for most of the WP units [28]. In Figure 11 wind speed in various buses is presented within a period of one day.
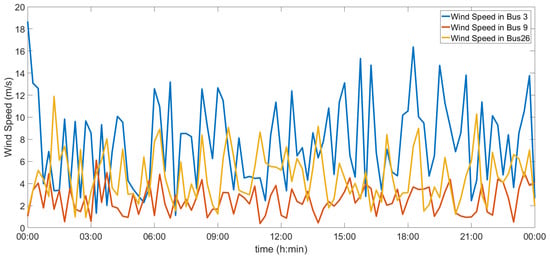
Figure 11.
Daily Wind Speed Variation.
4.3. Implementation
For the application, the 33 bus system is used and it is divided into two areas instead of three, as depicted in Figure 12. As in the case of the CFs, each area is assigned with certain weather conditions and more specifically with certain solar irradiance and wind speed timeseries according to the time period examined. These timeseries are not identical for every bus of the same area, but within a variance range of ±20%, so that apart from generation variation, also generation variation diversity is taken into account.
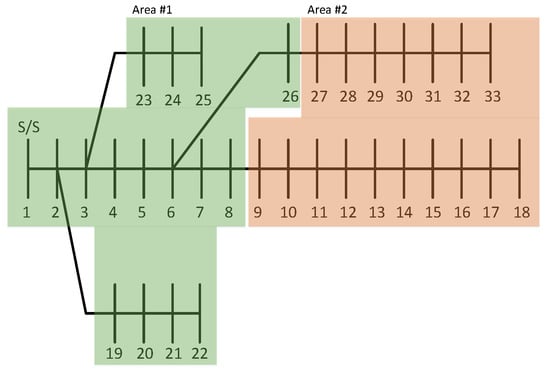
Figure 12.
33 bus system divided in two areas.
With the use of those weather conditions timeseries, the respective RES generation timseseries can be calculated, as presented in Section 4.2.1 and Section 4.2.2. Ergo, for each bus, according to its location, a particular generation pattern for either PV, or WP is assigned.
Additionally, the RES units have been considered to provide not only active power, but also reactive power control capabilities [46], in order to prevent voltage rise [47] and enable high RES penetration [48].
For this section, three scenarios have been contemplated, shown also in Table 7:
Table 7.
Scenarios considered.
- Scenario #1: Area #1 has significantly better solar potential than wind potential, and Area #2 vice versa. Τhat is, in Area #1 PVs are promoted and in Area #2 WPs,
- Scenario #2: The opposite of Scenario #1, where Area #1 has significantly better wind potential than solar potential, and Area #2 vice versa. Τhat is, in Area #1 WPs are promoted and in Area #2 PVs, and,
- Scenario #3: Both Areas have good solar and wind potential. That is, in both areas PVs and WPs are promoted for installation.
The results of this implementation are presented in Table 8, Table 9 and Table 10, and Figure 13, Figure 14 and Figure 15. The period of one year has been considered. In the tables apart from the Bus Number, where the RES units will be installed, the area where these Bus Numbers belong to, are also given and their respective CFs, according to the Bus Numbers’ location, as calculated after the installation of the RES unit. As can be seen, PVs have been installed in both Areas, with the only difference being the different CF, circa 18% and 11%, whereas WPs only to the area where wind potential was the most potent, with a CF ranging from circa 34% to 39%. As can be deduced, apart some minor differences, certain Bus Numbers appear in all three scenarios, as, for example, Buses 3, 6 and 20, to host RES units, regardless of technology, indicating, as also mentioned in Section 3, further that some buses are critical, or prevalent for DG installation, regardless of RES technology, bearing in mind a specific objective, in this paper being loss reduction.
Table 8.
Detailed Analysis—Scenario #1.
Table 9.
Detailed Analysis—Scenario #2.
Table 10.
Detailed Analysis—Scenario #3.
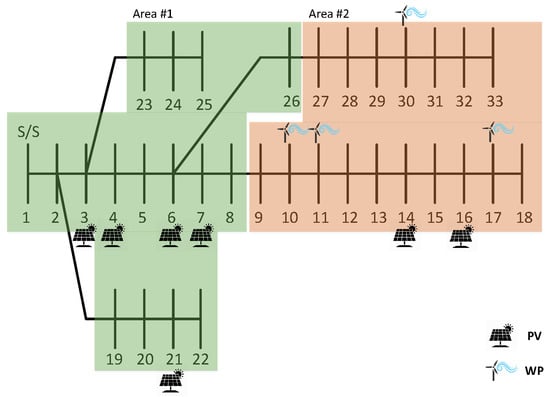
Figure 13.
Detailed Analysis—Scenario #1 solution.
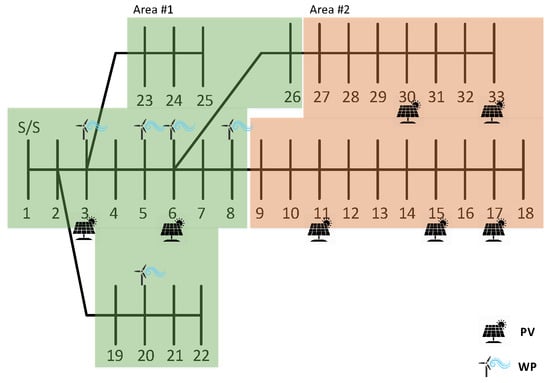
Figure 14.
Detailed Analysis—Scenario #2 solution.
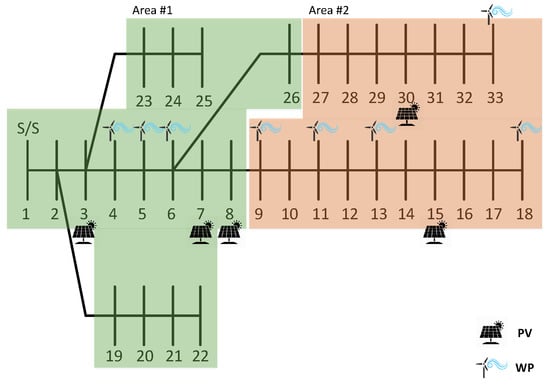
Figure 15.
Detailed Analysis—Scenario #3 solution.
In Figure 16, Figure 17, Figure 18, Figure 19 and Figure 20 the impact on load, losses, Line Ampacity and Maximum and minimum Voltage profiles are presented, using the detailed analysis, over the course of one day for all three scenarios. In Figure 16 the daily load profile as seen from the Slack Bus is presented. It becomes apparent the PV penetration via the Duck Curve effect and the WP penetration via the rapid variability. Evidently, in Scenario #2 the variance is more extreme (red line), since in this Scenario Area #1, that is, the area closer to the Slack Bus, is promoting more WP than Area #2, with greater wind potential. The losses in Figure 17, as expected, are reduced along with the maximum Line Ampacity of the period examined, shown in Figure 18 for every scenario. The Maximum Voltage Profile, shown in Figure 19, with every scenario is elevated above the 1 p.u. value, which is expected due to the RES penetration. However, this occurs only by a small margin, reaching a maximum of 1.025 p.u. in Scenario #2, especially considering the penetration percentage which, in terms of apparent generation to apparent load ratio, amounts to 66.16%, 72.61% and 59.27% for Scenarios #1, #2 and #3, respectively. The Minimum Voltage Profile is improved with every scenario approaching the 1 p.u., from a minimum of 0.90 p.u. in the initial state to 0.93, 0.94 and 0.95 p.u. for Scenarios #1, #2 and #3, respectively, as shown in Figure 20.
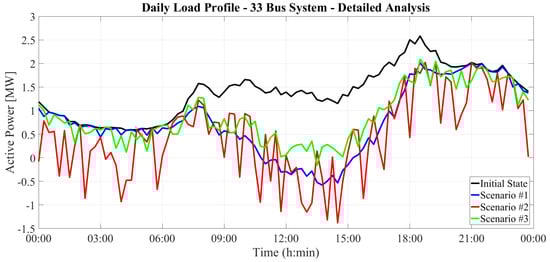
Figure 16.
Detailed Analysis—Daily Load profile for all Scenarios.
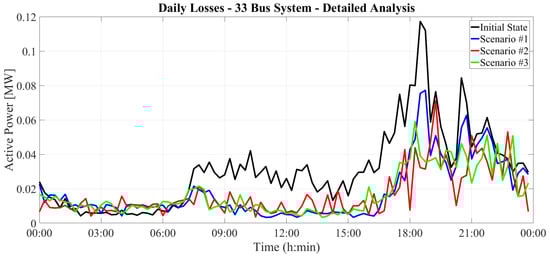
Figure 17.
Detailed Analysis—Daily Losses profile for all Scenarios.
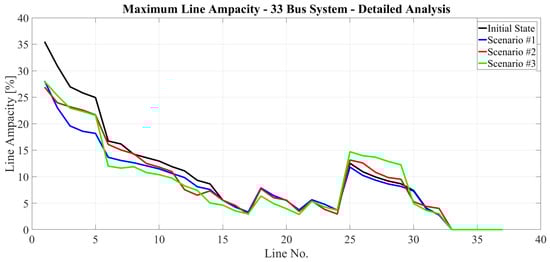
Figure 18.
Detailed Analysis—Line profile for all Scenarios.
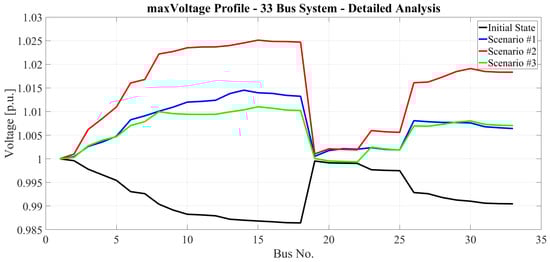
Figure 19.
Detailed Analysis—Maximum Voltage profile for all Scenarios.
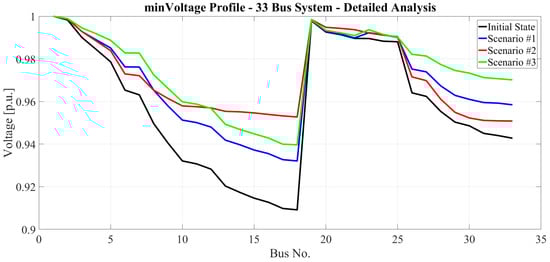
Figure 20.
Detailed Analysis—Minimum Voltage profile for all Scenarios.
This detailed analysis, although it offers a more realistic approach, it has an important drawback; computational burden and time. The more realistic the approach is, the more time it takes to reach an optimal solution. For a time period of one year it took almost 20 days for the process to complete, whereas for a single snapshot, as presented in Section 3.2 less than 40 min, i.e., 720 times less, using the same computer system with the same settings. Even though, the ODGP, or ORESP, problem addresses primarily DN planning and not operation, meaning that computation time is not considered as important as the optimal solution, it still raises the question of whether a Golden Ratio approach between time and optimal solution can be achieved.
In this paper, the idea would be to approximate the analytic and more realistic approach with a single snapshot. For the RES variation approximation, the CF method, as previously discussed, have been used, with the values being those presented in Table 11. These are the CFs mean values of those areas for a whole year. As for the load variation, i.e., the load profiles, three approaches-snapshots have been selected: the maximum load, the mean load and the 50% percent load.
Table 11.
CFs considered for the single snapshot approach, according to scenarios.
The maximum load is selected since it depicts the maximum load demand that is expected to be accommodated. The mean load as the average representation of the whole year and, as seen in Figure 21, it covers almost 75% of the load snapshots of the annual load. The 50% value snapshot is selected as an intermediate between the maximum and the mean value since it covers almost 98% of the load snapshots of the annual load.
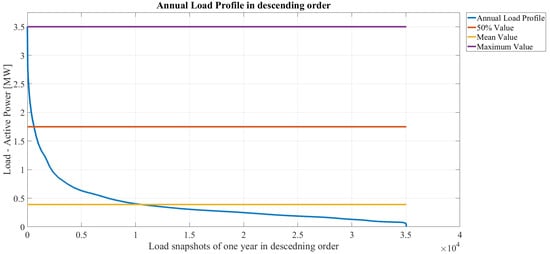
Figure 21.
Annual Load Profile in descending order with mean max and 50% values.
The solutions reached from those three snapshots in the three aforementioned scenarios and the results of their implementation in the load and RES generation variation time-series are depicted in Table 12, Table 13, Table 14, Table 15, Table 16, Table 17, Table 18, Table 19 and Table 20 and the respective Figure 22, Figure 23, Figure 24, Figure 25, Figure 26, Figure 27, Figure 28, Figure 29 and Figure 30.
Table 12.
Snapshot approach—Max Value—Scenario #1.
Table 13.
Snapshot approach—Max Value—Scenario #2.
Table 14.
Snapshot approach—Max Value—Scenario #3.
Table 15.
Snapshot approach—50% value—Scenario #1.
Table 16.
Snapshot approach—50% value—Scenario #2.
Table 17.
Snapshot approach—50% value—Scenario #3.
Table 18.
Snapshot Approach—mean value—Scenario #1.
Table 19.
Snapshot Approach—mean value—Scenario #2.
Table 20.
Snapshot approach—mean value—Scenario #3.
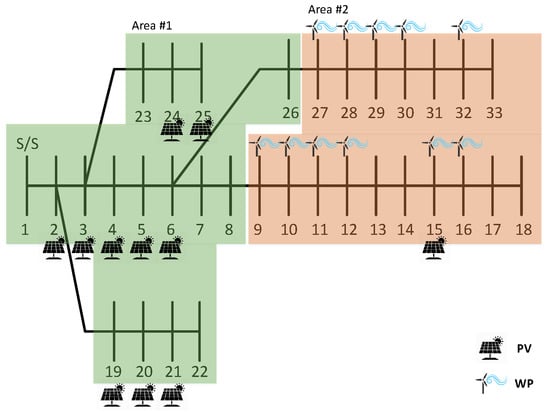
Figure 22.
Snapshot Approach—Max Value—Scenario #1 solution.
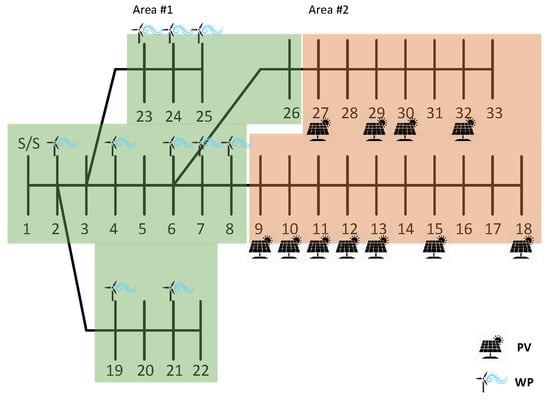
Figure 23.
Snapshot Approach—Max Value—Scenario #2 solution.
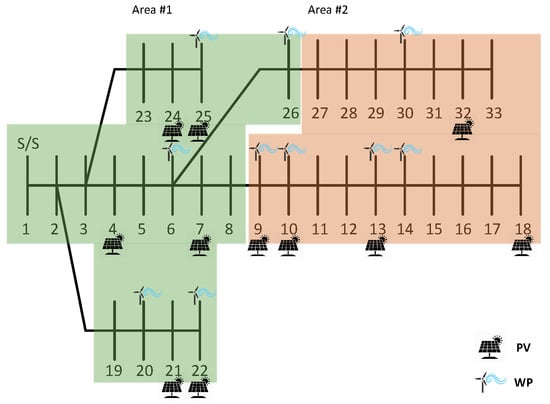
Figure 24.
Snapshot Approach—Max Value—Scenario #3 solution.
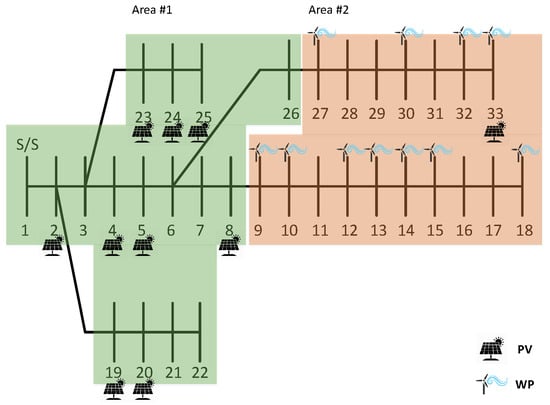
Figure 25.
Snapshot Approach—50% Value—Scenario #1 solution.
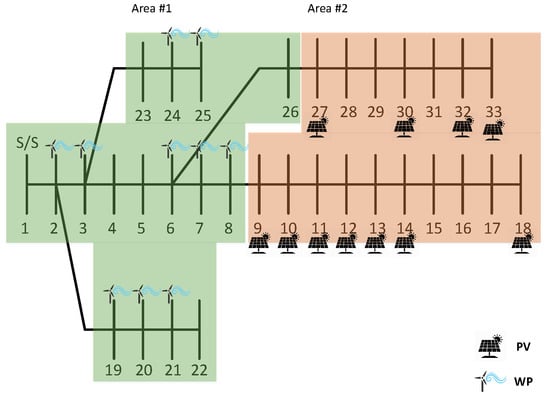
Figure 26.
Snapshot Approach—50% Value—Scenario #2 solution.
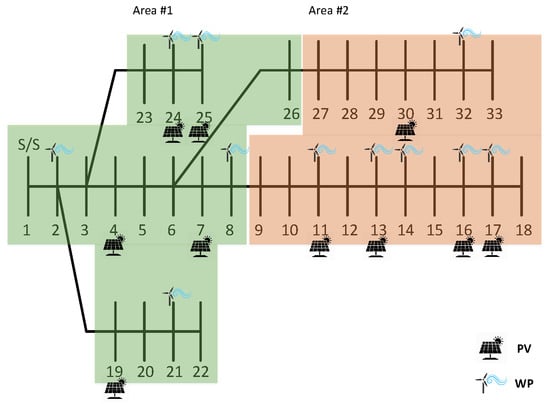
Figure 27.
Snapshot Approach—50% Value—Scenario #3 solution.
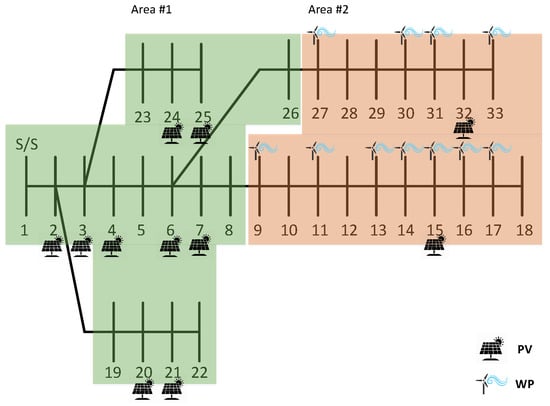
Figure 28.
Snapshot—mean value—Scenario #1 solution.
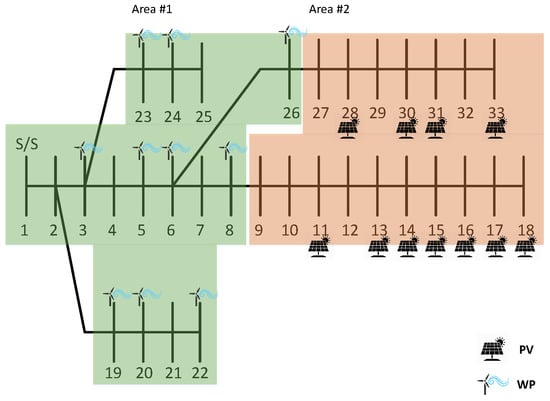
Figure 29.
Snapshot—mean value—Scenario #2 solution.
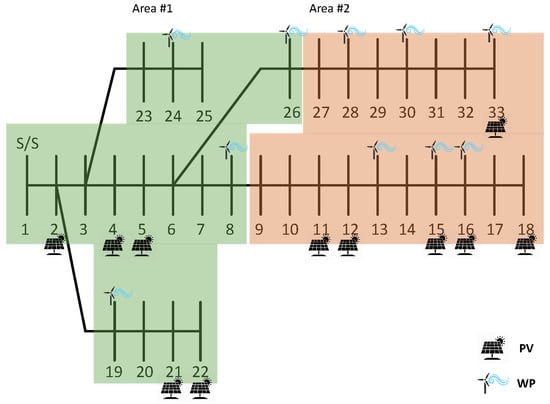
Figure 30.
Snapshot—mean value—Scenario #3 solution.
In Table 21 a more concise or pivot results comparison table is presented with respect to the energy losses and energy loss reduction that each snapshot approach reaches compared to the detailed analysis. Additionally, the RES penetration of each approach is provided in terms of apparent power of RES generation to apparent power of load demand ratio. It can be concluded that the Max Value approach gives the greatest penetration, even more than 100%, which leads to an increase in losses. In contrast, the mean Value approach bears the closest resemblance to the detailed analysis, in terms of energy losses and, if Table 18, Table 19 and Table 20 are taken into account and compared to Table 8, Table 9 and Table 10, solutions as well.
Table 21.
Comparison of snapshot approach with detailed analysis.
That is to say, when a single snapshot approach is made, instead of a detailed analysis, to the ODGP, or ORESP problems, perhaps the mean value of the load should be considered instead of the max value or the maximum load installed. Moreover, the CFs approach, proposed in this paper when combined with the latter approach, it can provide results that are closer to reality than the Max Value, or the 50% Value approach.
5. Conclusions
In this paper an innovative version of the Optimal Distributed Generation Positioning (ODGP) problem is contemplated, namely the Optimal Renewable Energy Sources Positioning (ORESP) problem. The integration of the Capacity Factor (CF) notion is introduced in order to face the simultaneous installation of several Renewable Energy Sources (RESs) in a Distribution Network (DN), and to take into account the geographical characteristics of the DN’s area, the weather conditions, and, thus, the availability of RES generation. Thus, under the CF approach a simple and straightforward scheme for determining the optimal mix of RESs is provided. The contribution in this case is the proposition of a method that bypasses all the detailed analysis that considers load and generation variation and diversity and provides and adequate solution with the most minimal computational burden and much faster, in order to have a first estimation. The proposed CF use in this paper, especially when the mean value of the load profile of a DN is being considered, is examined in order to find whether it bears results that are closer to a detailed analysis, and, consequently, closer to the reality. To verify this, the analysis is expanded to a new level where detailed time series about solar irradiance and wind speed are considered in order to provide more accurate values about the CFs. Moreover, load variations are also taken into account in terms of both DN’s aggregated load alterations and of load composition variations. The latter is crucial since it is expected to significantly affect the siting of the RES units and thus, the provided solution could be faced as an optimal one regarding the whole time period under investigation and not regarding an operational status with fixed load composition. The analytical approach involves numerous data and it is time consuming since based on the time step about the loading, irradiance and wind speed time series, a large number of sequential sub-problems should be solved. Each of this sub-problems is faced as a snapshot with fixed load composition and subject to this initial data the optimal siting and sizing of RES should be determined. Rationally, for different snapshots different solutions are expected to be delivered. Therefore, in this analysis apart from the detailed approach, an additional one that considers mean loading values is also examined. The goal here is to investigate whether a solution under low computational burden could be proved to be efficient enough and yield energy loss reduction that, although not optimal, it could still be considered efficient enough to justify the simplification adopted. The results verify that this latter approach constitutes an efficient alternative that provides good solution under rational computational time.
Author Contributions
Conceptualization, P.A.G. and A.S.B.; methodology, P.A.G. and A.S.B.; software, P.A.G.; validation, P.A.G., A.S.B., K.I.S. and D.I.D.; formal analysis, P.A.G. and G.C.C.; investigation, P.A.G.; resources, Power Systems Lab, School of Electrical and Computer Engineering, Aristotle University of Thessaloniki, Thessaloniki, Greece; data curation, P.A.G. and A.S.B.; writing–original draft preparation, P.A.G. and A.S.B.; writing–review and editing, P.A.G., A.S.B., K.I.S. and D.I.D.; visualization, P.A.G., A.S.B. and G.C.C.; supervision, D.P.L.; project administration, D.P.L.; funding acquisition, This research received no funding.
Funding
This research received no external funding.
Conflicts of Interest
The authors declare no conflict of interest.
References
- Soroudi, A.; Ehsan, M.; Caire, R.; Hadjsaid, N. Hybrid immune-genetic algorithm method for benefit maximisation of distribution network operators and distributed generation owners in a deregulated environment. IET Gener. Transm. Distrib. 2011, 5, 961–972. [Google Scholar] [CrossRef]
- Kumar, M.; Nallagownden, P.; Elamvazuthi, I. Optimal Placement and Sizing of Renewable Distributed Generations and Capacitor Banks into Radial Distribution Systems. Energies 2017, 10, 811. [Google Scholar] [CrossRef]
- Esmaili, M. Placement of minimum distributed generation units observing power losses and voltage stability with network constraints. IET Gener. Transm. Distrib. 2013, 7, 813–821. [Google Scholar] [CrossRef]
- Abdmouleh, Z.; Gastli, A.; Ben-Brahim, L.; Haouari, M.; Al-Emadi, N.A. Review of optimization techniques applied for the integration of distributed generation from renewable energy sources. Renew. Energy 2017, 113, 266–280. [Google Scholar] [CrossRef]
- Tu, J.; Yin, Z.; Xu, Y. Study on the Evaluation Index System and Evaluation Method of Voltage Stability of Distribution Network with High DG Penetration. Energies 2018, 11, 79. [Google Scholar]
- Duong, M.Q.; Pham, T.D.; Nguyen, T.T.; Doan, A.T.; Tran, H.V. Determination of Optimal Location and Sizing of Solar Photovoltaic Distribution Generation Units in Radial Distribution Systems. Energies 2019, 12, 174. [Google Scholar] [CrossRef]
- Cetinay, H.; Kuipers, F.A.; Guven, A.N. Optimal siting and sizing of wind farms. Renew. Energy 2017, 101, 51–58. [Google Scholar] [CrossRef]
- Sanajaoba, S.; Fernandez, E. Maiden application of Cuckoo Search algorithm for optimal sizing of a remote hybrid renewable energy System. Renew. Energy 2016, 96, 1–10. [Google Scholar] [CrossRef]
- Vatu, R.; Ceaki, O.; Mancasi, M.; Porumb, R.; Seritan, G. Power quality issues produced by embedded storage technologies in smart grid environment. In Proceedings of the 2015 50th International Universities Power Engineering Conference (UPEC), Stoke on Trent, UK, 1–4 September 2015; pp. 1–5. [Google Scholar]
- Vatu, R.; Ceaki, O.; Golovanov, N.; Porumb, R.; Seritan, G. Analysis of storage technologies within smart grid framework. In Proceedings of the 2014 49th International Universities Power Engineering Conference (UPEC), Cluj-Napoca, Romania, 2–5 September 2014; pp. 1–5. [Google Scholar]
- Truong, A.V.; Ton, T.N.; Nguyen, T.T.; Duong, T.L. Two States for Optimal Position and Capacity of Distributed Generators Considering Network Reconfiguration for Power Loss Minimization Based on Runner Root Algorithm. Energies 2018, 12, 106. [Google Scholar] [CrossRef]
- Abu-Mouti, F.S.; El-Hawary, M.E. Optimal Distributed Generation Allocation and Sizing in Distribution Systems via Artificial Bee Colony Algorithm. IEEE Trans. Power Deliv. 2011, 26, 2090–2101. [Google Scholar] [CrossRef]
- El-Ela, A.A.A.; Allam, S.M.; Shatla, M.M. Maximal optimal benefits of distributed generation using genetic algorithms. Electr. Power Syst. Res. 2010, 80, 869–877. [Google Scholar] [CrossRef]
- Leeton, U.; Uthitsunthorn, D.; Kwannetr, U.; Sinsuphun, N.; Kulworawanichpong, T. Power loss minimization using optimal power flow based on particle swarm optimization. In Proceedings of the ECTI International Confernce on Electrical Engineering/Electronics, Computer, Telecommunications and Information Technology, Chiang Mai, Thailand, 19–21 May 2010; pp. 440–444. [Google Scholar]
- Kumar, T.; Thakur, T. Comparative analysis of particle swarm optimization variants on distributed generation allocation for network loss minimization. In Proceedings of the 1st International Confernce on Networks Soft Computing (ICNSC2014), Guntur, India, 19–20 August 2014; pp. 167–171. [Google Scholar]
- Hung, D.Q.; Mithulananthan, N.; Bansal, R.C. Analytical Expressions for DG Allocation in Primary Distribution Networks. IEEE Trans. Energy Convers. 2010, 25, 814–820. [Google Scholar] [CrossRef]
- Hung, D.Q.; Mithulananthan, N. Multiple Distributed Generator Placement in Primary Distribution Networks for Loss Reduction. IEEE Trans. Ind. Electron. 2013, 60, 1700–1708. [Google Scholar] [CrossRef]
- Abu-Mouti, F.S.; El-Hawary, M.E. Heuristic curve-fitted technique for distributed generation optimization in radial distribution feeder systems. IET Gener. Transm. Distrib. 2011, 5, 172–180. [Google Scholar] [CrossRef]
- Lee, S.H.; Park, J.W. Selection of Optimal Location and Size of Multiple Distributed Generations by Using Kalman Filter Algorithm. IEEE Trans. Power Syst. 2009, 24, 1393–1400. [Google Scholar]
- Moradi, M.; Abedini, M. A combination of genetic algorithm and particle swarm optimization for optimal DG location and sizing in distribution systems. Int. J. Electr. Power Energy Syst. 2012, 34, 66–74. [Google Scholar] [CrossRef]
- Moradi, M.H.; Reza Tousi, S.; Abedini, M. Multi-objective PFDE algorithm for solving the optimal siting and sizing problem of multiple DG sources. Int. J. Electr. Power Energy Syst. 2014, 56, 117–126. [Google Scholar] [CrossRef]
- Iyer, H.; Ray, S.; Ramakumar, R. Assessment of Distributed Generation Based on Voltage Profile Improvement and Line Loss Reduction. In Proceedings of the IEEE/PES Transmission and Distribution Conference and Exhibition, Dallas, TX, USA, 21–24 May 2006; pp. 1171–1176. [Google Scholar]
- Viral, R.; Khatod, D. An analytical approach for sizing and siting of DGs in balanced radial distribution networks for loss minimization. Int. J. Electr. Power Energy Syst. 2015, 67, 191–201. [Google Scholar] [CrossRef]
- Gkaidatzis, P.A.; Doukas, D.I.; Bouhouras, A.S.; Sgouras, K.I.; Labridis, D.P. Impact of penetration schemes to optimal DG placement for loss minimisation. Int. J. Sustain. Energy 2017, 36, 473–488. [Google Scholar] [CrossRef]
- Kayal, P.; Chanda, C. Placement of wind and solar based DGs in distribution system for power loss minimization and voltage stability improvement. Int. J. Electr. Power Energy Syst. 2013, 53, 795–809. [Google Scholar] [CrossRef]
- Pandi, V.R.; Zeineldin, H.H.; Xiao, W. Determining Optimal Location and Size of Distributed Generation Resources Considering Harmonic and Protection Coordination Limits. IEEE Trans. Power Syst. 2013, 28, 1245–1254. [Google Scholar] [CrossRef]
- Keane, A.; O’Malley, M. Optimal distributed generation plant mix with novel loss adjustment factors. In Proceedings of the IEEE Power Engineering Society General Meeting, Montreal, QC, Canada, 18–22 June 2006. [Google Scholar]
- Atwa, Y.M.; El-Saadany, E.F.; Salama, M.M.A.; Seethapathy, R. Optimal Renewable Resources Mix for Distribution System Energy Loss Minimization. IEEE Trans. Power Syst. 2010, 25, 360–370. [Google Scholar] [CrossRef]
- Yammani, C.; Maheswarapu, S.; Matam, S. Optimal placement of multi DGs in distribution system with considering the DG bus available limits. Energy Power 2012, 2, 18–23. [Google Scholar] [CrossRef]
- Parsopoulos, K.E.; Vrahatis, M.N. Particle Swarm Optimization and Intelligence: Advances and Applications; Information Science Reference: Hershey, PA, USA, 2010; pp. 25–41. [Google Scholar]
- Zimmerman, R.D.; Murillo-Sanchez, C.E.; Thomas, R.J. MATPOWER: Steady-State Operations, Planning, and Analysis Tools for Power Systems Research and Education. IEEE Trans. Power Syst. 2011, 26, 12–19. [Google Scholar] [CrossRef]
- Floudas, C.A.; Pardalos, P.M. A Collection of Test Problems for Constrained Global Optimization Algorithms; Springer Science & Business Media: Berlin, Germany, 1990; Volume 455. [Google Scholar]
- Hock, W.; Schittkowski, K. Test examples for nonlinear programming codes. J. Optim. Theory Appl. 1980, 30, 127–129. [Google Scholar] [CrossRef]
- Parsopoulos, K.E.; Vrahatis, M.N. Particle swarm optimization method for constrained optimization problems. In Intelligent Technologies—Theory and Application: New Trends in Intelligent Technologies; IOS Press: Hershey, NY, USA, 2002; Volume 76, pp. 214–220. [Google Scholar]
- Gkaidatzis, P.A.; Bouhouras, A.S.; Doukas, D.I.; Sgouras, K.I.; Labridis, D.P. Application and evaluation of UPSO to ODGP in radial Distribution Networks. In Proceedings of the 13th International Conference on the European Energy Market (EEM), Porto, Portugal, 6–9 June 2016; pp. 1–5. [Google Scholar]
- Gkaidatzis, P.A.; Doukas, D.I.; Labridis, D.P.; Bouhouras, A.S. Comparative analysis of heuristic techniques applied to ODGP. In Proceedings of the 2017 IEEE International Conference on Environment and Electrical Engineering and 2017 IEEE Industrial and Commercial Power Systems Europe (EEEIC/I CPS Europe), Milan, Italy, 6–9 June 2017; pp. 1–6. [Google Scholar]
- Kashem, M.A.; Ganapathy, V.; Jasmon, G.B.; Buhari, M.I. A novel method for loss minimization in distribution networks. In Proceedings of the International Conference on Electric Utility Deregulation and Restructuring and Power Technologies, Proceedings (Cat. No.00EX382), London, UK, 4–7 April 2000; pp. 251–256. [Google Scholar]
- Warkad, S.B.; Khedkar, M.K.; Dhole, G.M. Economics of AC-DC OPF Based Nodal Prices for Restructured Electric Power System. Int. J. Electr. Power Eng. 2009, 3, 276–288. [Google Scholar]
- Salameh, Z.M.; Borowy, B.S.; Amin, A.R.A. Photovoltaic module-site matching based on the capacity factors. IEEE Trans. Energy Convers. 1995, 10, 326–332. [Google Scholar] [CrossRef]
- Ackermann, T. Wind Power in Power Systems; John Wiley & Sons: West Sussex, UK, 2005. [Google Scholar]
- Lako, P. Technical and Economic Features of Renewable Electricity Technologies; Technical Report; Energy Research Centre of The Netherlands: Petten, The Netherlands, 2010. [Google Scholar]
- Standard Load Profiles | RMDS. Available online: https://rmdservice.com/standard-load-profiles/ (accessed on 30 March 2019).
- Solar Radiation Data—Solar Energy Services for Professionals. Available online: http://www.soda-is.com/eng/services/services_radiation_free_eng.php (accessed on 30 March 2019).
- Tu, J.; Xu, Y.; Yin, Z. Data-Driven Kernel Extreme Learning Machine Method for the Location and Capacity Planning of Distributed Generation. Energies 2019, 12, 109. [Google Scholar] [CrossRef]
- Hennessey, J.P., Jr. A comparison of the Weibull and Rayleigh distributions for estimating wind power potential. Wind Eng. 1978, 2, 156–164. [Google Scholar]
- Turitsyn, K.; Sulc, P.; Backhaus, S.; Chertkov, M. Options for Control of Reactive Power by Distributed Photovoltaic Generators. Proc. IEEE 2011, 99, 1063–1073. [Google Scholar] [CrossRef]
- Zhao, H.; Wu, Q.; Wang, J.; Liu, Z.; Shahidehpour, M.; Xue, Y. Combined Active and Reactive Power Control of Wind Farms Based on Model Predictive Control. IEEE Trans. Energy Convers. 2017, 32, 1177–1187. [Google Scholar] [CrossRef]
- Collins, L.; Ward, J. Real and reactive power control of distributed PV inverters for overvoltage prevention and increased renewable generation hosting capacity. Renew. Energy 2015, 81, 464–471. [Google Scholar] [CrossRef]


© 2019 by the authors. Licensee MDPI, Basel, Switzerland. This article is an open access article distributed under the terms and conditions of the Creative Commons Attribution (CC BY) license (http://creativecommons.org/licenses/by/4.0/).