Abstract
A promising heat storage technique is based on thermochemical materials (TCM). Such materials are often used in closed systems under vacuum conditions, which is demonstrated in several projects in the European H2020 R&D programs. In this type of systems, non-condensable gasses (NCG) may have a significant effect on the reactor performance. This paper considers the potential effects of NCG on vacuum TCM reactor performance in detail. Water is used as working material to study NCG. Both experiments and numerical simulations show that the effect of NCG cannot be neglected. A small amount of NCG in a vacuum setup will significantly reduce the evaporation/condensation rate. It will transform the transport process from convection-based into diffusion-based in case the pressure of NCG at the condenser surface is equal to the pressure difference between the evaporator/condenser. Designing a stable vacuum storage system, puts high demands on leak tightness of the reactors but also on avoiding NCG release originating from TCM and any used material in the reactor (like coatings and glue). Additional free volume in the reactor will help to reach the demands of stable performance over longer working periods but decreases system energy density, being a crucial KPI. With help of our model, the performance of a system can be determined.
1. Introduction
Compact heat storage is considered as one of the break through technologies, to realise the European ambition of a 40% domestic greenhouse gas emissions reduction below 1990 levels by 2030. A promising principle of heat storage is based on Thermochemical Materials (TCM), to store loss free over a long time with a relatively high energy density. It uses a gas-solid equilibrium reaction, wherein the usually used gas is water [1] or ammonia [2]. In order of magnitude, the initial material energy density can be 5 times higher compared to sensible and latent (i.e., related to phase changes) storage. As this storage method uses a chemical reaction, the energy will be stored as long as the reaction will not occur, in contrast to sensible and latent heat storage.
In general a gas-solid equilibrium reaction of a salt hydrate, can be represented by:
wherein MX·nHO(s) is a MX complex with n water molecules. The amount of HO inside salt complex MX is called the loading of the salt. The formation reaction of MX·nHO is exothermic, that is, it produces energy. The enthalpy of the formation reaction is , whereas the endothermic decomposition reaction of MX·nHO has an equal negative enthalpy . The equilibrium reaction in Equation (1) implies that the loading of a salt at a temperature T is determined by the vapor pressure of HO(g).
Based on this heat storage concept several large scale demonstrators have been built in different configurations. Currently, two main types of systems are considered: closed and open system. In case of a closed system both reactive gas and TCM are stored within the system. In case of an open system, the reactive gas is not stored in the system but exchanged externally. Both systems have their specific pros and cons, which are well discussed in several reviews [3,4,5]. In this paper, we focus on closed systems under low pressure conditions filled with KCO. KCO is selected based on an extensive investigation of potential TCM candidates [1]. Potassium carbonate is one of the high potential salts for use-cases including tap water production based on working conditions, safety and costs. In this system the water vapor will be transferred by the absolute pressure difference between the water (evaporator/condenser) and TCM compartment of the reactor. No additional fan or other transport mechanism is present in these systems to transport water vapor. As a consequence any decrease of absolute pressure difference will directly result in a decrease of performance of the reactor. Systems with evaporator/condensors under low pressure/vacuum conditions show that non-condensable gases (NCG) largely influence vapor condensation in such systems, resulting in a significant reduction in the condensation rate as the NCG form a layer at the condenser surface. This will hinder the transport of water vapor to the condensor. As a result the condensation rate drops and the performance of the system decrease significantly. This reduction of performance is extensively reported in the literature [6,7,8,9,10,11,12,13,14,15,16,17] and this is also recognized as a challenge of TCM systems under vacuum conditions [5,18,19,20,21,22,23].
In the TCM literature the previously mentioned papers indicate the issue with NCG but does not translate this to acceptable levels of NCG in TCM systems. In general they mention that NCG should be avoided, what in principle is correct but it is hard to achieve in reality since many potential sources of NCGs are available:
- Decomposition of the TCM (i.e., HCl by MgCl[24], HS by NaS [25] and CO by impurities in KCO [25]).
- Adsorbed gases at the surface of the TCM grains (i.e., N, CO and O by zeolite and silica gel [26]).
- Dissolved gases in water (i.e., N, CO and O).
- Leakage from gasses into the setup (especially N and O).
- Any other emission source, e.g., stabilizing material, glues, coatings and sealing.
Therefore, the goal of this paper is to address the potential effect of NCGs on vacuum TCM reactor performance, simultaneously considering its geometry and give a tool to calculate acceptable levels of NCG in a TCM system. Therefore, both experiments and modeling/simulations are carried out. Firstly hydration/dehydration experiments are carried out, indicating the effect of NCG on a TCM system. These experiments are used to validate a new developed model that gives a deepen understanding of NCG potential effects on TCM vacuum systems performance.
2. Materials and Methods
2.1. Experimental Setup
A vacuum system is constructed (see Figure 1) to study the effect of NCG on the evaporation/condensation rate. It consists of two vacuum vessels (vessel 1:108 mL and vessel 2:224 mL), wherein the temperature of the walls can be controlled (vessel 1 between −20 and 80 C; vessel 2 between room temperature and 200 C). The temperature of vessel 1 is controlled with a thermostat bath with an accuracy of 0.1 C (Lauda ECO Silver), active cooling and heating of vessel 1 is possible. The temperature of vessel 2 is controlled with a heat resistor with an accuracy of 0.5 C (heating power of 30 W), only active heating is possible, cooling is by heat losses to the environment. The thermocouple for adjusting the temperature of vessel 2 is located at the bottom of the vessel. This location may result in small deviations between the temperature of thermocouple and the evaporation/condensation surface of the sample as the heat conductivity of water is low (0.6 W/(m·K)).
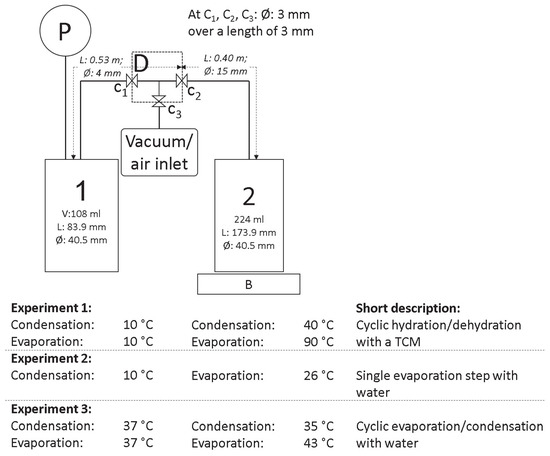
Figure 1.
Schematic overview of the -mass setup. Both vessels are temperature controlled, the tubing between the vessels is heated to avoid condensation. The symbols represent: P: pressure sensor, D: filling area, C valves, B: balance, 1 and 2: vessel 1 and 2. Vessel 1 always water, vessel 2 contains KCO (experiment 1) or water (experiment 2 and 3). The temperature of vessel 1 is controlled with help of a thermostatic bath, the temperature of vessel 2 is controlled with help of a heat resistor.
Before each experiment both vessels are cleaned and dried in the oven at 105 C to avoid introduction of water or NCG (attached at the surface of the sample holder into the system). Before the start of the experiment both vessels are evacuated for 5 min, using an Edwards RV8 vacuum pump. During the experiments the pump is not connected.
A pressure sensor (P) is placed above vessel 1 (A KOBOLD absolute pressure transmitter with 0.2 mbar accuracy), which measures in the range of 0 and 200 mbar (0.2 mbar accuracy). The tubing (stainless steel tubing, partly flexible) between the vessels is heated (around 45 C) above the dew point temperature of the water vapor during all experiments. Therefore condensation at the tubing between both vessels can be excluded. The exact dimensions are given in Figure 1. In the case of water transport of 0.5 g/minute (being the highest observed evaporation rate in the experiments), the pressure drop over the entire tubing between vessel 1 and 2 is calculated to be in the order of 0.12 mbar. Consequently, the pressures in vessel 1 and 2 are approximately equal, considering the measurement accuracy of 0.2 mbar. Vessel 2 is placed on a balance with an accuracy of 0.01 g (Mettler Toledo PG2002-S) to follow the evaporation/condensation process.
In this set of experiments two types of NCG are used. The first type are NCG from the atmosphere into water. In this case the composition of NCG is N:O:CO = 0.46:0.26:0.28 (based on Henry’s Law). This type is normally present in low pressure reactors in case the water in the system is not completely degassed The second type is based on the atmosphere, in that case the composition is N:O; others = 0.78:0.21:0.01. This is only present in the system in case of a small leakage or incomplete evacuation of the TCM reactor.
2.2. Dissolved Non-Condensable Gasses in Water
Other molecules can be dissolved in water, like N and CO. These molecules will be called non-condensable gasses (NCG) in case these will be released in the setup. The amount of NCG can be determined with help of Henry’s Law [27]:
wherein mol·m·Pa is the Henry solubility, is the concentration of a NCG in the aqueous phase and p the partial pressure of that species in the gas phase under equilibrium conditions. is 6.4 × 10 mol·m·Pa for N in water, 3.4 × 10 mol·m·Pa for CO in water and 1.3 × 10 mol·m·Pa for O in water. In the order of 27 mol of NCG will be present in 35 mL water in case this water is in equilibrium with the atmosphere (this is 0.6 mL of gas at a pressure of 1 bar), based on Henry’s Law.
During evacuation of the setup part of the NCG will be removed from the water vessel, but not all. In case not all NCG are removed during evacuation of the setup and this amount is fully released from the water into the setup during the hydration/dehydration experiments, a pressure increase in the order of 2 mbar will be observed in the setup. Dissolved NCG in water is therefor a source of NCG which can not be neglected.
2.3. Leakage Rate
As the effect of NCG is studied, the leakage rate of environment into the setup is crucial. in case the leakage rate of the setup is not equal to zero, this is a source of NCG. Therefore, the pressure in the setup is reduced to 2 mbar and a temperature profile is applied on the setup (vessel 1 at 10 C; vessel 2: 10 h at 40 C and 4 h at 90 C for 10 cycles). This temperature profile is applied to study the effect of temperature fluctuations in the setup on the leakage rate. This temperature profile is similar as used in experiment 1. Figure 2 shows a leakage of 0.25 mbar/day and a pressure difference of 0.2 ± 0.2 mbar between the situations where vessel 2 is 40 C and 90 C. Based on the ideal gas law, the pressure should increase with 16% as the temperature changes is 16% on Kelvin-scale. In the setup, only vessel 2 is heated, what means that only half of this 16% pressure increase should be observed, which is by approximation the case. Based on this experiment the average leakage rate is determined to be of 0.25 mbar/day (3.3 mol/day at 40 C).
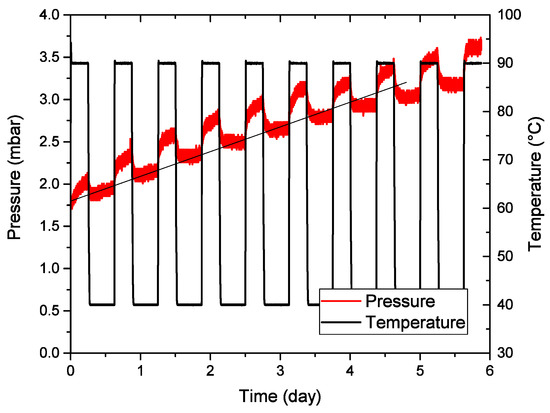
Figure 2.
Pressure during leakage test. The period is because the temperature jumps between 40 and 90 C. The higher pressures are at 90 C, the lower at 40 C.
As the two vessels have to be closed with a seal, a variation in leakage rate is observed between experiments. Therefore at the end of each long cyclic experiments, the leakage rate is determined without opening the seal in between.
2.4. Experimental Approach
Three types of experiments are discussed in this paper with their own sub goals, while keeping the overall goal in mind to understand the effect of NCG on the performance of a TCM reactor under vacuum conditions:
Experiment 1: Goal: To screen the potential NCG effect on the vacuum reactor performance in a hydration and dehydration experiment. The first experiment starts with a purified anhydrous KCO composite (produced by Caldic with an after treatment what removed all KHCO content) in vessel 2 and a limited amount of liquid water (35 mL) in vessel 1. The second started with a purified hydrated KCO1.5HO composite (produced by Caldic) in vessel 2 and initially an empty vessel 1. The temperature conditions in both experiments are similar: the temperature of vessel 2 varied between 40 and 90 C and vessel 1 was kept at 10 C. The exact hydration/dehydration conditions of KCO are described in more detail in the literature [25]).
Experiment 2: Goal: to determine the NCG effect on the performance of a model reactor system, using water as a well defined evaporation/condensation surface. This experiment uses a single evaporation/condensation run with is repeated five times with each time a well defined amount of NCG between 0 and 78 mol NCG. The NCG are added to vessel 2 after evacuating the entire setup. In this experiment, vessel 2 is kept at 26 C and vessel 1 at 10 C. The temperatures are selected to mimic the vapor pressures during dehydration of a TCM with a cold source of 10 C.
Experiment 3: Goal: to determine the effect of a small source of NCG on the performance of a model reactor system using water as a well defined evaporation/condensation surface and a constant supply of NCG (due to leakage) into the system. Within this experiment 15 evaporation/condensation cycles are performed with water in a closed system. The main source of NCG is due to leakage into the system. The leakage rate is stable over a long period of time within our measurement limits. The experiments are performed with a constant temperature of 37 C in vessel 1. The temperature in vessel 2 was varied between 35 C and 43 C. These temperatures are selected as it was not possible to cool vessel 2, without loosing the ability to measure the mass of vessel 2. Therefore a higher temperature is selected to be able to measure the mass variations and perform multiple evaporation/condensation cycles. In this cyclic evaporation/condensation run with water in a closed system, no NCG are present in the setup at the start of the experiment.
3. A Mathematic Model on Evaporation/Condensation with NCG
A numerical model was developed to understand the mass transport of the water vapor and of the NCG in the system. For developing this model, two issues should be investigated: 1. the transport of water vapor and NCG in the pipe; 2. the evaporation/condensation on the interface of the liquid water and the water vapor. In our model, we focus on gas transport under low pressure conditions in a geometry similar to that of the lab-experiments as a TCM vacuum reactor always contain water vapor resulting in a certain pressure depending on the exact working temperatures and active material. Evaporation and condensation is included via the boundary conditions. In this model, only the gaseous phases are considered: meaning that condensing or evaporating water in vessel 1 and 2 take place at the boundaries of the model (see Figure 3).
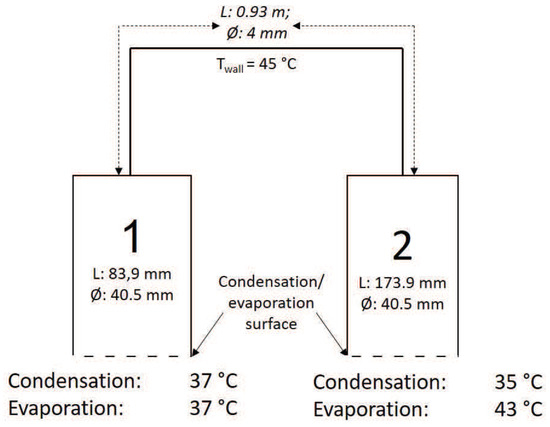
Figure 3.
A schematic overview of the system used in the mathecial model. In this model no liquid water is present in both vessels, what is transfered in/out of the system by at the bottom of both vessels (inlet/outlet).
The description of the mass transport of a multicomponent system depends on the characteristic length scales involved in the problem. At low vacuum conditions (∼10 mbar), the mean free path of a gas molecular can be around dozens of . In this paper, the length scale of the experiment set-up is around several mm which is much larger than the mean free path of the gas molecule. Therefore, the gas flow can still be considered as continuum and Navier-Stokes equations are still feasible. Otherwise, the theory of rarefied gas is required, as described in Reference [28]. On the other hand, the challenge of the second issue is a reliable description of the non-equilibrium state over the micro-meter-thick interface between the water and the vapor, because the continuous conditions of the thermodynamic variables such as the temperature and the pressure are not ensured as reported in the literature [29,30,31]. The classical Hertz-Knudsen-Schrage Equation [32,33] has been widely used for the evaporation/condensation process [34,35,36,37]. Moreover, its expression still agrees with a theoretical derivation based on Boltzmann equation for certain choices of the parameters [38,39]. One difficulty of the application of Hertz-Knudsen-Schrage Equation is to identify the evaporation and condensation coefficients, which are not necessarily the same and require dedicated experiments [31,34,40]. A sophisticated model investigating the evaporation/condensation process is not of the scope of this paper. Therefore, Hertz-Knudsen-Schrage Equation with a fitted condensation coefficient is adopted in this paper.
3.1. Mass Transport of the Gases
Mass conservation of a gas mixture is given by:
where (kg/m) is the total gas density and (m/s) is the velocity field of the mixture. The total density depends on the concentration of the gas components, that is,
where c (mol/m) represents the concentration, M (kg/mol) is the molar mass, the subscript w refers to water vapor and to NCG. Mass conservation of the NCG is written as
where the flux in mol/(ms) is the summation of the diffusion and convection fluxes, that is,
with D (m/s) the diffusion coefficient of the non-condensable gas in the water vapor. The source term (mol/(ms)) on the right hand side of Equation (5) represents the sources of the NCG, mainly due to the leakage of the system. Leakage in this model is considered as the only source of NCG during the experiment. Moreover, we assume that the NCG does not flow in/out the condensation/evaporation surfaces (inlet/outlet).
The Hertz-Knudsen-Schrage Equation [34] is adopted to describe the evaporation/condensation. In this equation, the mass flux per unit area flowing through the liquid to the vapor (kg/(ms)) is related to the states of both two phases,
Here, and (Pa) are the water vapor pressures in the liquid and the vapor phases, respectively and and (K), the temperatures in the liquid and the vapor, respectively. Moreover, R is the ideal gas constant. The coefficients and (-) are the evaporation coefficient and the condensation coefficient, respectively, represent the probabilities of molecular emission from the liquid to the vapor or vica versa and mainly depend on the temperature and the pressure [34]. They have been determined experimentally and reported in the literature [34,38]. Our model assumes that the NCG are not affecting the condensation/evaporation rate directly. As NCG might impact on the water transport from the surface to the vessel, they will indirectly affect the mass flux by changing the above the condensation/evaporation surface.
3.2. Momentum and Heat Transport
Just at the beginning of the experiments, the system is almost in vacuum and the mixture can not be considered a continuum, because of the large mean free path (±10–1000 mm). However, this low vacuum state quickly disappears as the large pressure difference leads to a very fast flow. Focusing on the later stage of the process, the mixture can be considered as a continuum. Assuming that the water and the NCG are well mixed, the flow velocity and the temperature of the mixture hold for both components. In this case, Navier-Stokes equations are adopted for the mixture
where p is the total pressure of the gas mixture and is the viscous stress tensor. As the gas mixture has a low viscosity, the mixture is considered as a Newtonian’s fluid and the viscous stress linearly depends on the strain rate:
where is the viscosity of the mixture and the strain rate tensor is:
At the inlet/outlet, the mass flux has been given through the condensation/evaporation, that is, Equation (7). Furthermore, the energy conservation of the mixture gives
where the first term on the right hand side is the pressure work and the second term is the viscous dissipation. Applying the ideal gas law to both the water vapor and the NCG, the total pressure is expressed as
3.3. Boundary Conditions
The temperature at the bottom of vessel 1 is fixed at 37 C and the temperature loading cycle in Experiment 2 is applied to vessel 2 (43 and 35 C). The temperatures at the walls of the tubing are fixed at 45 C to avoid condensation at locations other than the bottom of vessel 1 and 2. For the remaining boundaries, non-slip and thermal-isolated conditions are assumed. The properties (, , k, D and ) of dry air are used for the NCG.
The initial conditions and the main parameters in the simulations are listed in Table 1. The leakage rate is set at 2.5 mbar/day at 45 C, that is, , based on the leakage rate observed in the experiments. The diffusion coefficient of water vapor in the dry air at 1 bar () is adopted considering a pressure dependency () [41].

Table 1.
Initial conditions and parameters used in the simulation for experiment 3, which is also shown in Figure 3. (x = 1, 2 and T) is the length of vessel 1 and 2 and the tube length between vessel 1 and 2, respectively.
In this study, assumed to be identical to , that is, the probabilities of a molecular emission from the liquid to the vapor and reversely are the same. Therefore, the next discussion will use as condensation coefficient only. The condensation coefficient can be derived on the basic of the molecular dynamic simulations [38] or obtained through experimental measurements [34]. However, both methods are out of the scope of this paper. Once the values of the condensation coefficients are obtained by fitting the evaporation rate of the first cycle from experiment 3, the coefficients are assumed to be independent from the NCG concentration and to be only dependent on the temperature.
The partial differential equations are solved using COMSOL Multiphysics (version 5.3a, TNO, Eindhoven, The Netherlands).
4. Results
4.1. Experiment 1: Single Condensation Process with Controlled Amount of NCG
To show the effect of NCG on the performance of a TCM system, two cyclic tests are performed: one with anhydrous and one with hydrated KCO. In this experiment, the performance of a TCM system is determined by the hydration/dehydration rate over multiple cycles. To determine this, both samples are hydrated/dehydrated 10 times by changing the temperatures of vessel 2, as schematically indicated in Figure 1. In both experiments no additional evacuation or other treatment of the samples are performed.
4.1.1. Experiment 1A: Cyclic Experiments with Initially Anhydrous KCO
Figure 4 shows the results of the first tests (vessel 1 was filled with 35 ml demi-water, vessel 2 with 21.5 g dehydrated KCO grains) with KCO are given in Figure 4. The temperature, change in mass and pressure during the entire experiment are plotted. The pressure does not exceed the 12 mbar (equilibrium vapor pressure of water of vessel 1) during hydration. During dehydration the pressure does not reach the equilibrium pressure of KCO at 90 C (78 mbar), as the dehydration rate is lower than the condensation rate. The peaks in the curve in mass change at 0 and 12 h is a result of switching on and off from the heater. The heater interferes with the balance and gives a short offset in the measured mass.
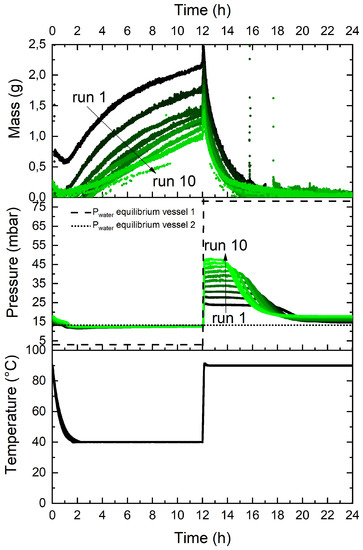
Figure 4.
The temperature, pressure and change in mass of a thermochemical material (TCM) with a mass of vessel 2 initially filled with 21.5 g dehydrated KCO and vessel 1 with water during 10 cycles of dehydration/hydration. The peak at 0 and 12 h in the change in mass curve is a result of the heater which is turned on and off as result of hydration and dehydration. Each run has its own color whereby the color tranforms from black to green by increased run number. The data of this graph is re-used from J. Houben et al. [42].
The two main sources of NCG are present in this experiment. Firstly, dissolved NCG in the 35 mL water, what results in a pressure increase of 2 mbar in the setup based on Henry’s Law (Equation (2)). Secondly, the leakage rate is determined during this experiment to be in the order of 4 mol/day (0.3 mbar/day).
During dehydration an increase in pressure is observed between each hydration/dehydration cycle. The increase of pressure during dehydration is nonlinear over the cycles. The hydration rate decreases every cycle, resulting in a smaller amount of water reacted with the TCM, what means a decrease of performance of the TCM reactor.
4.1.2. Experiment 1B: Cyclic Experiments with Initially Hydrated KCO
In a second experiment, starting with hydrated KCO, no extra water was added in vessel 1, consequently eliminating one of the sources of NCG of the first experiment. The leakage rate in this experiment is extremely low (0.05 mbar/day), so almost no NCG entered the experiment. The experiment is plotted in Figure 5. As can be seen, all mass curves during hydration/dehydration cycles are overlapping and only a small increase in vapor pressure is observed during hydration. The drop in pressure after 7 h is observed as all water of vessel 1 is hydrated on the TCM. Note that even after 8 cycles, the observed pressure during dehydration is significantly lower than that, of experiment 1A. The difference in observed pressure in the first run is most likely a result of the NCG dissolved in the water in experiment 1A, which was absent in experiment 1B. In addition, the low leakage rate of experiment 1B result in a low increase of pressure over the different cycles in experiment B compared to experiment A. The difference in performance over multiple cycles is significant, what according to us is a result of the different amount of NCG in the setup.
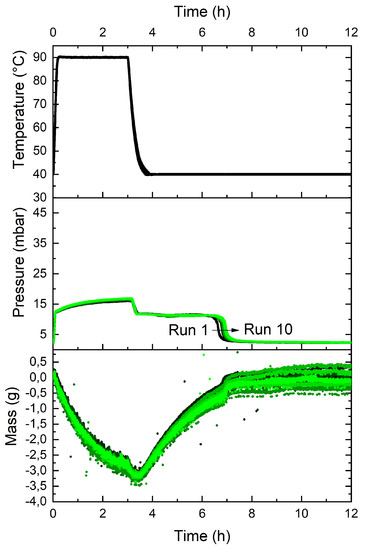
Figure 5.
The temperature, pressure and change in mass of a TCM with mass of vessel 2 initially filled with 21.5 mg hydrated KCO and vessel 1 with water during 10 cycles of dehydration/hydration. The peak at 0, 3 and 6 h in the change in mass curve is a result of the heater which is turned on and off as result of dehydration, hydration and stopped hydration. Each run has its own color whereby the color tranforms from black to green by increased run number. The data of this graph is re-used from J. Houben et al. [42].
4.2. Experiment 2A: Single Condensation Process with Controlled Amount of NCG
Experiment 1, indicates that NCG may strongly impact on the hydration/dehydration behavior of a TCM in a low pressure reactor. Considering that the KCO material properties may change during the previous experiment, thus its performance, subsequent experiments are carried out using a model system on the well defined water surface instead of the TCM material. Additional experiments on a water system will be performed for a more in depth analysis on the role of NCG. Single evaporation experiments are performed with a constant temperature of 26 C on the evaporator side (vessel 2) and 10 C on the condenser side of the setup (vessel 1).
In all cases, demineralised water is used, with no additional pretreatment to remove dissolved gasses.
Experiment 2B: Single Condensation Process without Artificial Added NCG
In the first single condensation experiment, no additional NCG is added to the system. The exact conditions are given in Section 2.4. Figure 6 shows the mass decrease in vessel 2 and pressure in the setup over time during an evaporation experiment without additional NCG. In vessel 2, 35 mL of water was added and in vessel 1 a small amount of water was initially present at the start of the experiment. This water generates the constant water surface whereon water vapor can condensate. Firstly, the mass in vessel 2 decreases almost linearly in time during the experiment. Secondly, an increasing vapor pressure is observed above vessel 1 during the condensation process. At the start of the evaporation/condensation period the pressure increased immediately to 14.8 mbar and increases to 24.6 mbar. Both pressures are in between the equilibrium pressures of vessel 1 and 2. Secondly, a clear periodic variation is observed in the pressure, which also occurs in the mass curve but smoothed out. This is due to the heater control. At the moment vessel 2 is empty, the pressure drops quickly but remains for a long time above the equilibrium pressure expected from vessel 1 as related to the temperature in this vessel. Finally the pressure is almost equal to the equilibrium water vapor pressure based on the temperature of vessel 1.
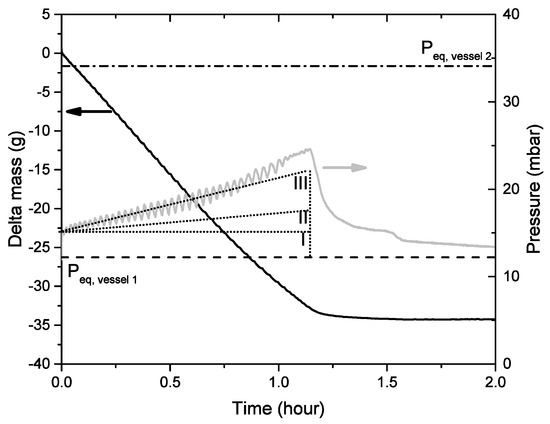
Figure 6.
Left axis: Mass change of vessel 2 during evaporation (solid line). Right axis: Pressure in setup during mass transport from vessel 2 into 1 (grey line). The equilibrium pressures of vessel 1 and 2 are indicated by the dashed (–) the and dot-dashed (·–) lines respectively. The three dotted (…) lines represents the thinking model (see Figure 7) explaining the pressure increase during the evaporation/condensation: case I ( no non-condensable gases (NCG) are present in the system), case II (only NCG as result of leakage of the setup) and case III (NCG as result of leakage and dissolved NCG).
The increase in pressure during the evaporation/condensation process is not expected in case no NCG are present throughout the entire experiment (case I). In Figure 7 a schematic representation of the evaporation/condensation process is drawn. This represent the situation after opening valve C of Figure 1. Figure 7 represents our thinking model what occurs during condensation/evaporation. The dashed lines represent the pressure of NCG and the solid lines the pressure of water vapor. At that moment, an equilibrium will be settled between the evaporation rate of the gas-liquid surface in vessel 2 and the condensation rate at the gas-liquid surface of vessel 1. This equilibrium will be settled almost instantaneously. We would, therefore, expect a steep pressure increase at opening the valve C and a steep pressure decrease at the moment vessel 2 is empty (case I in Figure 6. As the setup is not completely leak tight, a small amount of NCG will enter the system during the evaporation/condensation experiment. This probably results in a built up of NCG at the condensation surface in vessel 1, what is assumed that the NCG will be carried with the water vapor to this layer. Therefore, a small layer of gas appears at the surface, hindering water transport to the condensation surface and decreasing the condensation rate. As the condensation rate is lower but the evaporation surface is not affected by the NCG, the pressure in the system will slightly increase, till a new equilibrium is reached. This will result in a small increase in pressure over time during an evaporation/condensation experiment (see case II). As the leakage rate is in the order of 0.25 mbar/day and an experiment takes approximately 1.5 h, the average pressure of NCG due to leakage is in the order of 0.02 mbar. The other source of NCG is due to dissolved gasses in the water vessel. Based on Henry’s Law, the amount of NCG dissolved in the water can result in an estimated pressure in the order of 2 mbar on system level, strongly dependent on the degassing procedure before the experiment. Even if only 10% of the initial NCG dissolved in water contributes to such pressure built up, its contribution largely exceeds that of leakage. During the evaporation process, NCG will be released from the water resulting in a continuous increase of NCG at the condensation surface of vessel 1. This again will block the condensation surface, resulting in a decreased condensation rate, causing a higher equilibrium vapor pressure in the system (case III).
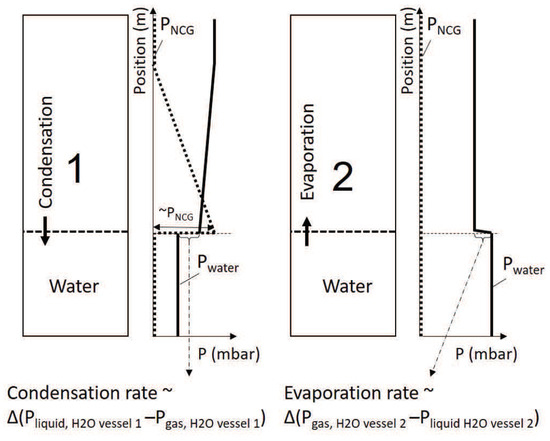
Figure 7.
A schematic representation of our thinking model on the pressures of the NCG and water in vessel 1 and 2 during evaporation in vessel 2 and condensation in vessel 1.
4.3. Single Condensation Process with Artificial Added NCG
In Figure 8 and Figure 9a,b, five experiments are summarized with different initial amounts of NCG (given in the legend) in the system whereby the same experimental conditions are used as in Section 4.3. The NCG is air from the atmosphere: mainly N and O. In Figure 9b, the pressure after opening valve C is plotted against the average P in the system. We assume the NCG in the system are directly transferred to vessel 1 after opening valve C. An almost linear relation between the measured average vapor pressure and the average initial amount of NCG is observed, fitting with the hypothesis that the NCG will influence the condensation rate and therefore increase the vapor pressure in the system. The evaporation rate (mass decrease) is strongly dependent on the amount of NCG in the system: it decreases rapidly with increasing initial NCG content in the system. At a NCG level of 78 mol (average = 5 mbar) in the setup, the condensation/evaporation process almost immediately stopped, wheras for 39 mol of NCG (average = 2.5 mbar) the process is blocked after 3.5 h. In case the mass transport stops (or decreases to a non-measurable value), the total vapor pressure in the setup is equal to the theoretical water vapor pressure of the evaporation vessel (vessel 2), implying that a high concentration of NCG is located at the condensation surface in vessel 1. From that moment on, the mass transport is dominated by diffusion and not driven by a pressure difference, this process is several orders slower, no mass loss is observed in vessel 2. As there is no pressure difference within the setup, the concentration of NCG at the condensation surface should be equal to the water vapor pressure difference between vessel 1 and 2. In that case, no net condensation will occur at that surface.
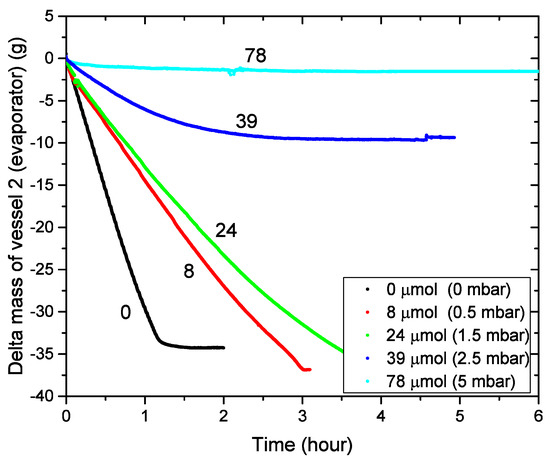
Figure 8.
Mass change of vessel 2 during evaporation.
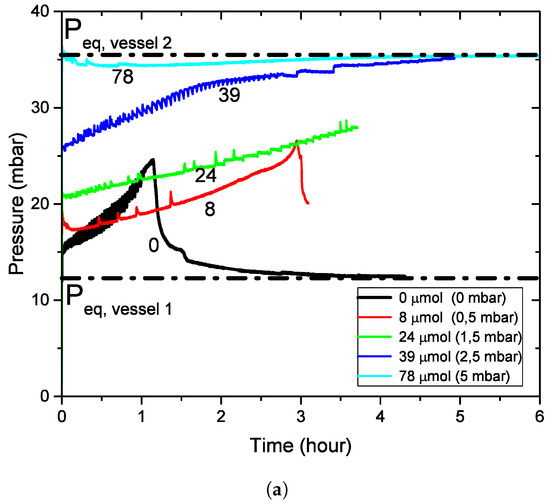
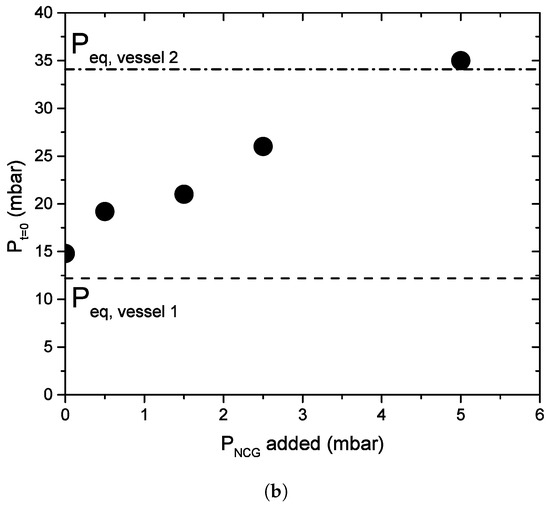
Figure 9.
(a) Pressure in setup during mass transport from vessel 2 into 1. (b) The pressure measured in the setup directly after opening the valve between vessel 1 and 2. The dot-dashed line is the equilibrium pressure of vessel 1 and the dashed line is the equilibrium pressure of vessel 2.
The experiments of 0, 8 and 24 mol NCG (average = 0, 0.5 and 1.5 mbar) have almost a linear mass decrease, with a slowly decreasing condensation rate in time. Note that the process is almost immediately stopped at a level of 78 mol (i.e., average P, with a small loss of mass in the first hour only. The experiment with 39 mol of NCG (average = 2.5 mbar) at the start of the experiment, shows a linear mass decrease initially but the evaporation rate quickly decreases and after 3.5 h no mass transport is observed. Except for the 78 mol experiment, all experiments show a pressure increase in time.
Based on this set of experiments, it can be concluded that a small amount of NCG in the current setup can already significantly decrease the condensation rate or even ‘stop’ it (still condensation but extremely slow).
4.4. Experiment 3: Cyclic Condensation/Evaporation with Water
Experiment 3 is performed to measure the impact of leakage of NCG on the performance of a condensation/evaporation system. In this experiment, water evaporates from vessel 1 and condensates in vessel 2, and the reverse. Fifteen cycles are performed, wherein a cycle consists of a full and single evaporation/condensation process in one vessel. Vessel 1 is initially empty and vessel 2 is filled with 10.8 mL demineralized water. Vessel 1 is kept at a temperature of 37 C and vessel 2 is varied between 35 and 43 C, respectively for 10 and 2 h. The leakage rate is determined to be of 0.25 mbar/day. In this experiment, the pressure within the system, the mass of vessel 2 and temperature of vessel 1 and 2 are recorded. In Figure 10, the results of the 7th cycle are shown. At the start of the condensation period, the temperature is decreased in 15 min from 43 to 35 C. The temperature is kept constant within 0.1 C range during the rest of the condensation period. After 10 h, the evaporation starts and the temperature is increased to 43 C. As a result of evaporation, the temperature of vessel 2 reaches only a constant temperature of 43 C only after 1 h. This is a result of a limited power source (30 W) and high evaporation rate resulting in a cooling power of 15 W. At the moment the evaporation process is finished (see the mass curve), the temperature of the vessel increases to a temperature above 43 C. As the temperature controller overshoots, because of an abrupt deletion of cooling power.
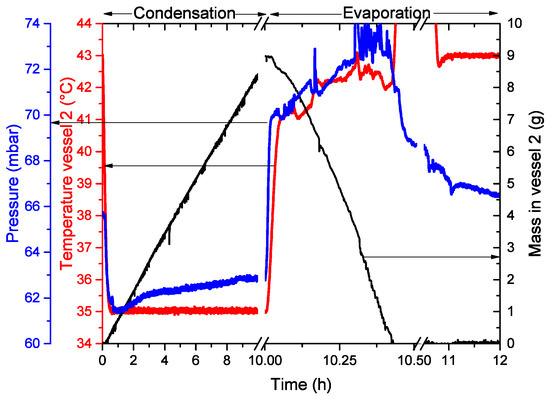
Figure 10.
The pressure (blue), temperature (red) and mass in vessel 2 (black) during the 7th cycle.
The mass curve indicates that condensation occurs at a constant rate, however the evaporation rate increases in time due to the increasing temperature of the water in vessel 2.
During condensation in vessel 2, the pressure is slowly reaching a pressure close to the water equilibrium pressure 62.6 mbar at 37 C. During evaporation from vessel 2 to vessel 1, the pressure is increasing in time, similar to the single evaporation experiments. This is a combination of the temperature increase of vessel 2 (both the entire vessel and the evaporation surface). The pressure after 12 h is above the equilibrium pressure of water at 37 C but still reducing.
15 condensation/evaporation cycles are performed, resulting in mass curves during condensation in vessel 2 shown in Figure 11. The condensation rate decreases each cycle. As the time of condensation is limited to 10 h the condensated mass in vessel 2 eventulally decreases too, as shown Figure 11. This might be due to the leakge rate of 0.25 mbar which will be deeper discussed in the next paragraph.
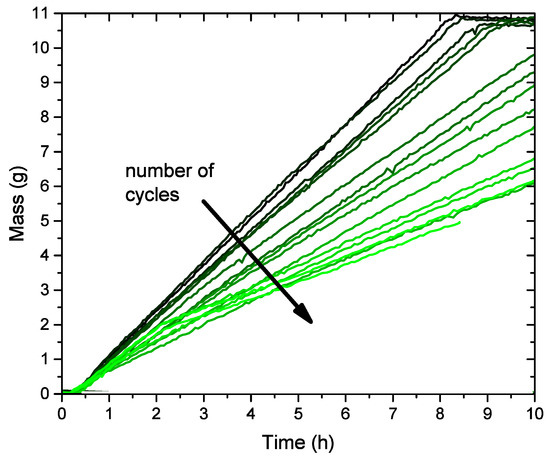
Figure 11.
The mass of vessel 2 during condensation of water. The temperature of vessel 1 and 2 is 37 C and 35 C, respectively.
4.5. Numerical Model of a Condensor/Evaporator with NCG
In this paragraph, the model is validated on the basis of the previous experimental results. Firstly the evaporation rate by different NCG contents is addressed. Secondly, a cyclic evaporation/ condensation experiment is addressed, similar to experiment 3, considering the boundary conditions listed in Table 1. Thirdly, a numerical analysis is made of the effect of experimental parameters on the performance of a low pressure reactor.
4.5.1. Evaporation Rate with NCG
In our model we assume that the evaporation/condensation rate only depends only on the applied temperature and pressure of the gas and liquid phases (see Equation (7)). The evaporation rate in vessel 2 from experiment 2 is plotted against the measured pressure in the system in Figure 12. As can be seen, the numerical results are in well agreement with those of the corresponding experiment 2. Firstly, all curves show a linear relation between the measured pressure and the evaporation rate. Secondly for all experiments, the evaporation rate is zero at a pressure equal to the equilibrium pressure of vessel 2. This fits with Equation (7), which shows that the evaporation rate is dependent on the pressure difference between the liquid and gaseous phases in case of equal temperature of the gaseous and liquid phase and equal and . Thirdly, the four experiments with added NCG nicely overlap, whereas the experiment without added NCG, has a significantly higher evaporation rate compared to the other experiments at the same system pressure. A full explanation is lacking at this moment for the difference between the experiments with and without added NCG. As in the other experiments NCG are always present, we accept the assumption that the evaporation/condensation rate depends only on the applied temperature and pressure of the gas and liquid phases.
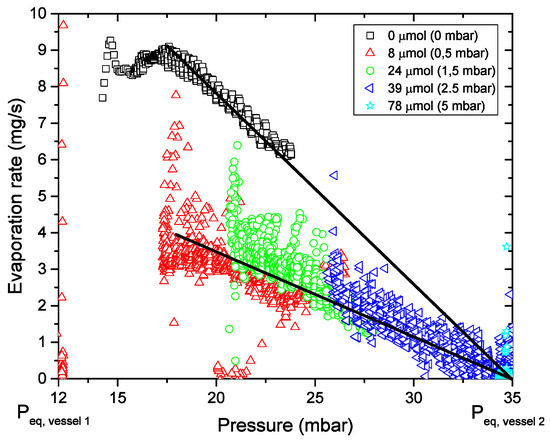
Figure 12.
The evaporation rate from vessel 2 plotted against the pressure measured in the system. All experiments with some initial NCG are overlapping, the one without initial NCG in the system has a way higher evaporation rate.
4.5.2. Constant Leakage as Source of NCG
Firstly, a cyclic evaporation/condensation similar to experiment 3 is modeled. Figure 13 shows the predicted mass of water in vessel 2 at different cycles. In this experiment, the upper limit of evaporated water from vessel 1 is set to 10.8 g (similar to experiment 3) and, if this is exceeded, the evaporation rate is set to zero. It is observed that the condensation rate in vessel 2 decreases with the cycles and, likewise, the evaporation rate.
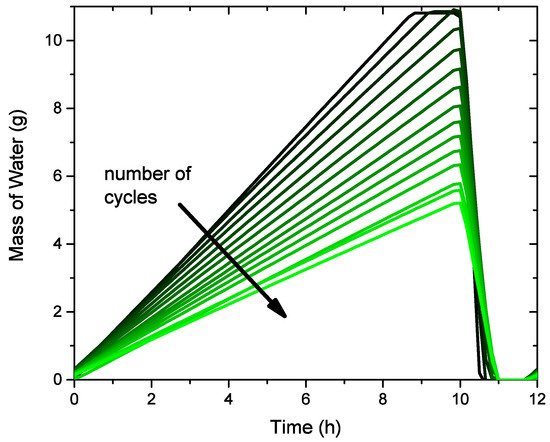
Figure 13.
Mass of the liquid water in Vessel 2 at different cycles during the simulation.
To clarify the drop in evaporation and condensation rates, Figure 14 shows the calculated pressure distribution along the central axis of vessel 2. The normalized distance equals 1 at the point, where the tube connects to the vessel. Obviously, most NCG appear in vessel 2 during condensation whereas in vessel 1 hardly no NCG are observed. According to the model, the flow leads to an accumulation of NCG in vessel 2. The tube between vessel 1 and 2 acts like a diode, as the high flow speed of water molecules herein prevents NCG to diffuse back to vessel 1. The total pressure level in vessel 2 increases due to the leakage of NCG. The maximum absolute pressure difference between vessel 1 and 2 is determined by the water vapor pressure difference in equilibrium of both vessels (in this case 6.5 mbar). Each pressure increase of NCG, implies a decrease of pressure between the water vapor pressure in the liquid and gaseous phase, reducing the condensation rate (see Equation (7)).
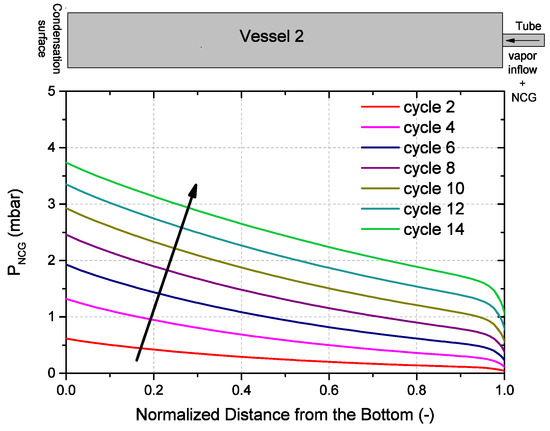
Figure 14.
Pressure along with the central axis of vessel 2 at the half-time point of each cycle, that is, the condensation period for vessel 2. The point where the normalized distance equals 1 represents the connection of tube and vessel.
The predicted and measured 8 h averaged condensation rates as a function of the cycle are plotted in Figure 15. Considering the obvious agreement, the model is used to explore hereafter the effects of experimental variables like tube diameter, condensation surface and temperature in the experiment.
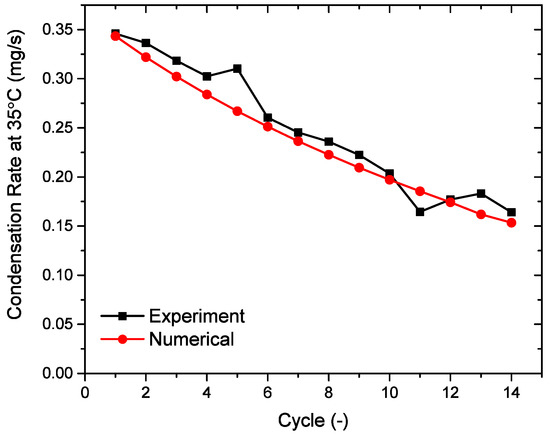
Figure 15.
A comparison of the 8-hour average condensation rate between the experiment and the numerical calculations of experiment 3.
4.5.3. The Roles of Experimental System Parameters on the Evaporation/Condensation Rate in a System with NCG
To explore the effects of NCG more profoundly, the diffusion coefficient of the water molecules (D) have been investigated. The parameter set used in Section 4.6 is used, except that a higher leakage rate of (i.e., 20 mbar at 45 C in 24 h) was used. This is done, to reduce the simulation time.
In Figure 16, the transient condensation flux rate, which is defined as the condensation rate divided by the water/air surface in vessel 2, is plotted against the pressure of the NCG at the bottom surface of vessel 2 during the condensation period. As shown in Figure 16, there is a sudden decrease in the slope around 6.5 mbar, which is equal to the difference between equilibrium water vapor pressures of vessel 1 and 2.
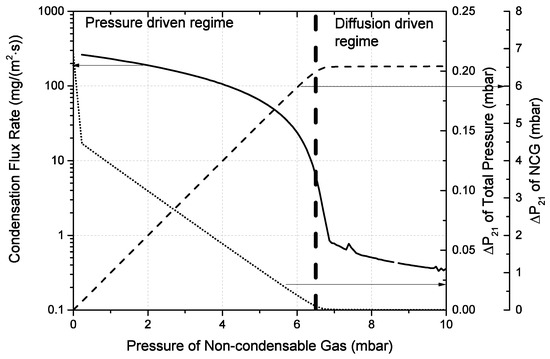
Figure 16.
Relation of condensation flux rate () and the pressure of the NCG at the bottom of vessel 2. In this experiment: evaporation in vessel 1 and condensation in vessel 2, with temperatures respectively 35 and 37 C. At 6.5 mbar a transition is observed between a pressure and diffusion driven mass transport process. On the right axis the pressure difference (Total and NCG) between two vessels during the simulation of a high leakage rate, both at the bottom of the vessels.
This indicates two regimes exist during evaporation/condensation. The first regime has a high condensation rate. In this case, the dominating mechanism on the mass transport is the total pressure difference between vessel 1 and 2 (see the total pressure line). The amount of NCG in the system is in this regime relatively low and will not significantly affect the condensation rate. A second regime dominates when the condensation rate drops steeply, that is., in the order of a factor of 1. In this case, the amount of NCG is raised till a level, whereby the total pressure drop over vessel 1 and 2 is not longer the dominating mechanism for mass transport. The pressure of the NCG completely compensates the difference between equilibrium water vapor pressure of vessel 1 and 2 (see the NCG pressure line), consequently fully reducing the total pressure difference. In this regime, diffusion driven by partial pressure differences dominates water transport as well as induces NCG transport to vessel 1.
Because the mass transport of the NCG depends on convection and diffusion, the influence of the diffusion coefficient is investigated. The diffusion coefficient is changed from to , as a sensitivity check. The condensation rate flux and the pressure difference are plotted with respect to the pressure of the NCG at the bottom surface of vessel 2 in Figure 17. When the diffusion coefficient changes two order of magnitude, that is, in the range from to , the performance of the system remains the same until the pressure of the NCG reaches a pressure of 6.5 mbar at the surface.
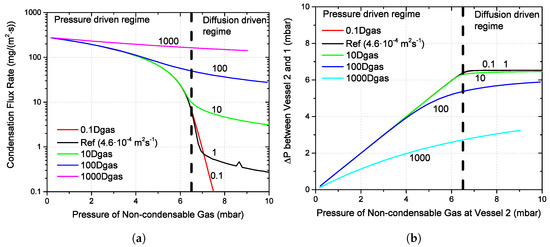
Figure 17.
Effects of the NCG diffusion coefficients on the condensation flux (a) and pressure difference (b) as a function of pressures of non-condensable gas at the condensation surface of vessel 2.
The so-called condensation coefficient may be sensitive to the diffusion coefficient. The fitting of the condensation coefficient is done in the first cycle when there is only a little amount of the NCG. Figure 17 shows that the diffusion coefficient needs to be as large as with the given experimental conditions so that the diffusion can influence the condensation rate when the pressure of the NCG at the bottom surface of vessel 2 is smaller than 1 mbar. However, is an unreasonable value for the diffusion of the dry air in the water vapor at low-pressure level around 10 mbar as it is 1000 times higher than what is given in literature (4.6 × 10 ms [41]). Therefore, the diffusion coefficient does not have significant influences on the condensation coefficient.
4.6. Design of the System
The pressure driven regime is the most interesting case for closed TCM reactors, because of the much higher condensation/evaporation ratse and therefor higher in/output powers of a TCM heat battery. However, this regime appear to be more sensitive to NCG. In this paragraph, design principles of the reactor system are investigated numerically to explore options to reduce this sensitivity.
Firstly, the dimensions of the system are addressed including: the diameter of the vessels (D), the height of Vessel 2 (H) and the diameter of the tube (). A high leakage rate is used as a starting point similar to the previous paragraph (8 times higher than in the real experiments). The results are plotted in Figure 18. Here, the reference indicates to the simulation with parameters given in Table 1. Changing the dimensions of the vessels does not change the pressure difference as shown in Figure 18a. Moreover, the condensation rate flux (= the condensation rate/the surface area) is shown in Figure 18b. The evaporation/condensation rates normalized by the surface area are not significantly affected by the different geometries. A variation is only observed in the range where the evaporation rate has already decreased by more than 90%, being an undesired situation anyhow for any heat battery system.
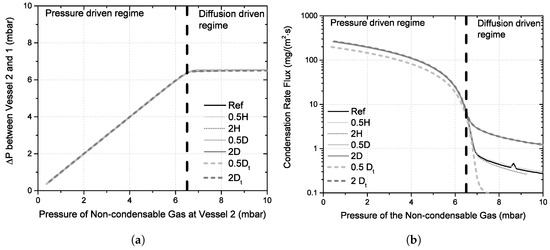
Figure 18.
Effects of the NCG with different dimensions during the condensation period on the pressure difference (a) and the condenation rate flux (b). H: the height of the vessel, D: thickness of the vessel and : thickness of the tubing between both vessels.
As a straight forward measure of the system performance we introduce a way to measure the performance:
where C is the condensation flux rate and P the pressure of NCG at the surface of vessel 2 during condensation. In Figure 19, the performance is plotted as a function of the ratio of the NCG pressure at the condensation surface and the equilibrium vapor pressure difference of evaporator and condensor. This graph shows a linear relation between this pressure ratio and the performance of the system. Consequently, the performance can be estimated according to:
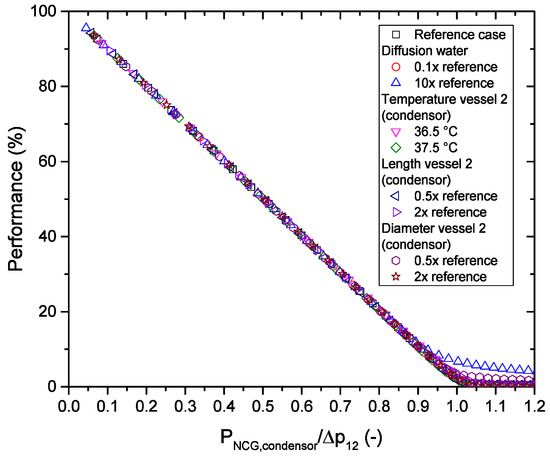
Figure 19.
The performance (ratio of condensation flux rate with and without NCG in the vacuum system) plotted against the ratio of the pressure of the NCG at the condensation surface and the water vapor pressure difference between the condensor and evaporator. A combination of different geometries and workingconditions are shown, resulting in one mastercurve.
4.7. Practical Implication
With help of the model and relations described in this paper, it is possible to make a translation from the performance of a TCM reactor on the long term. Equation (14) described the performance decrease as a function of the pressure of NCG at the condensation surface, which is hard to experimentally determine. A first approximation can be used to calculated this value. With help of the overall pressure measurement in a static situation, the total amount of NCG can be measured (p = p− p). Based on the model, all NCG in the system are located in the condenser vessel. As in vacuum the NCG will follow the ideal gas law, the average NCG pressure can be calculated in the condenser vessel (p = p). Hereby the and are the free volume in respectively the entire reactor and the condenser. Equation (14) gives the minimal reduction of performance as a result of introduction of NCG in the vacuum reactor. For a more accurate estimation, the model described in this paper can be used.
Based on these assumptions, a simple relation can be formulated to indicate how much NCG per free volume (Q) in the system in time t can be present in a system when a performance drop, , is observed:
In this equation, the pressure is given in Pa. This equation indicates the leakage rate and its is acceptable limits for a vacuum system.
For example, a system with a reactor of 300 L, with a free volume of 50 L wherein 40 L of the condenser. As KCO is used as TCM and the desired hydration temperature is 40 C (p = 0.3 kPa), = 0.3 kPa and = 1.2 kPa (the evaporator is 10 C). The reactor should work for 30 year and the performance should not drop more than 10%. This results in Q of 0.03 nmol/(ms). As only 50 L free volume is present in the reactor, the leakage rate to get to a maximal performance decrease (as result of NCG) of 10% can not be more than 2 pmol/s. This is similar to a pressure increase of no more than 0.7 mbar in 30 year in the system.
5. Conclusions
This paper quantifies the potential effect of NCGs on vacuum TCM reactor performance. With help of both lab experiments and numerical modeling, it is shown that a small amount of NCG in a vacuum setup will significantly reduce or even stop the evaporation/condensation rate, which is in good agreement with current literature.
The system performance is linearly related to the amount of NCG at the condensation surface based on the numerical model, which is validated with experiments on a system with water.
The decrease in performance is related to the water transport process, which is convection based at low NCG content into a diffusion based at high NCG content, whereby the transition point is reached when the NCG pressure at the condenser surface is equal to the difference between the equilibrium water pressure of the evaporator and condenser. The geometry on the other hand is of less importance for the performance as long as the tubing between the condenser/evaporator is wide enough that it will not result in a significant pressure drop over the tubing.
Author Contributions
Conceptualization, P.D., K.G. and B.E.; methodology, P.D. and J.H.; software, K.G. and B.E.; validation, P.D., K.G. and H.H.; formal analysis, P.D. and K.G. writing—original draft preparation, P.D. and K.G.; writing—review and editing, P.D., K.G., J.H., H.H., B.E. and O.A.; visualization, P.D. and K.G.; supervision, B.E., H.H. and O.A. All authors have read and agreed to the published version of the manuscript.
Funding
Part of the work is performed within TKI WINST and the CREATE project in the European Union’s Horizon 2020 research and innovation programme under grant agreement No. 680450. This paper only reflects the author’s view and the Commission is not responsible for any use that may be made of the information it contains.
Acknowledgments
We would like to thank Henry van der Meer of Caldic for providing us the studied TCM material.
Conflicts of Interest
The authors declare no conflict of interest.
References
- Donkers, P.; Sögütoglu, L.; Huinink, H.; Fischer, H.; Adan, O. A review of salt hydrates for seasonal heat storage in domestic applications. Appl. Energy 2017, 199, 45–68. [Google Scholar] [CrossRef]
- Donkers, P.; Pel, L.; Steiger, M.; Adan, O. Deammoniation and ammoniation processes with ammonia. AIMS Energy 2016, 4, 936–950. [Google Scholar] [CrossRef]
- N’Tsoukpoe, K.; Schmidt, T.; Rammelberg, H.; Watts, B.; Ruck, W. A systematic multi-step screening of numerous salt hydrates for low temperature thermochemical energy storage. Appl. Energy 2014, 124, 1–16. [Google Scholar] [CrossRef]
- Yan, T.; Wang, R.; Li, T.; Wang, L.; Fred, I. A review of promising candidate reactions for chemical heat storage. Renew. Sustain. Energy Rev. 2015, 43, 13–31. [Google Scholar] [CrossRef]
- Kousksou, T.; Bruel, P.; Jamil, A.; El Rhafiki, T.; Zeraouli, Y. Energy storage: Applications and challenges. Sol. Energy Mater. Sol. Cells 2014, 120, 59–80. [Google Scholar] [CrossRef]
- Sapienza, A.; Frazzica, A.; Freni, A.; Aristov, Y. Dramatic effect of residual gas on dynamics of isobaric adsorption stage of an adsorptive chiller. Appl. Therm. Eng. 2016, 96, 385–390. [Google Scholar] [CrossRef]
- Okunev, B.; Gromov, A.; Zelenko, V.; Glaznev, L.; Ovoshchnikov, D.; Heifets, L.; Aristov, Y. Effect of residual gas on the dynamics of water adsorption under isobaric stages of adsorption heat pumps: Mathematical modelling. Int. J. Heat Mass Transf. 2010, 53, 1283–1289. [Google Scholar] [CrossRef]
- Glaznev, I.; Aristov, Y. Kinetics of water adsorption on loose grains of SWS-1L under isobaric stages of adsorption heat pumps: The effect of residual air. Int. J. Heat Mass Transf. 2008, 51, 5823–5827. [Google Scholar] [CrossRef]
- Huang, J.; Zhang, J.; Wang, L. Review of vapor condensation heat and mass transfer in the presence of non-condensable gas. Appl. Therm. Eng. 2015, 89, 469–484. [Google Scholar] [CrossRef]
- Yi, Q.; Tian, M.; Yan, W.; Qu, X.; Chen, X. Visualization study of the influence of non-condensable gas on steam condensation heat transfer. Appl. Therm. Eng. 2016, 106, 13–21. [Google Scholar] [CrossRef]
- Wu, X.; Li, T.; Li, Q.; Chu, F. Approximate equations for film condensation in the presence of non-condensable gases. Int. Commun. Heat Mass Transf. 2017, 85, 124–130. [Google Scholar] [CrossRef]
- Cao, J.; Pei, G.; Bottarelli, M.; Chen, C.; Jiao, D.; Li, J. Effect of non-condensable gas on the behaviours of a controllable loop thermosyphon under active control. Appl. Therm. Eng. 2019, 146, 288–294. [Google Scholar] [CrossRef]
- Lee, K.-L.; Kadambi, J.; Kamotani, Y. The influence of non-condensable gas on an integral planar heat pipe radiators for space applications. Int. J. Heat Mass Transf. 2017, 110, 496–505. [Google Scholar] [CrossRef]
- Wu, X.; Chu, F.; Zhu, Y.; Li, Q. Vapor free convection film condensation heat transfer in the presence of non-condensable gases with smaller molecular weights than the vapor. Appl. Therm. Eng. 2018, 130, 1611–1618. [Google Scholar] [CrossRef]
- Yin, Z.; Wen, J.; Wu, Y.; Wang, Q.; Zeng, M. Effect of non-condensable gas on laminar film condensation of steam in horizontal minichannels with different cross-sectional shapes. Int. Commun. Heat Mass Transf. 2016, 70, 127–131. [Google Scholar] [CrossRef]
- He, J.; Miao, J.; Bai, L.; Lin, G.; Zhang, H.; Wen, D. Effect of non-condensable gas on the startup of a loop heat pipe. Appl. Therm. Eng. 2017, 111, 1507–1516. [Google Scholar] [CrossRef]
- Cai, J.; Jo, B.; Erkan, N.; Okamoto, K. Effect of non-condensable gas on thermal stratification and flow patterns in suppression pool. Nucl. Eng. Des. 2016, 300, 117–126. [Google Scholar] [CrossRef]
- De Jong, A.J.; Stevens, R.; Rentrop, C.; Hoegaerts, C. Coatings for Heat Storage Reactors with Hygroscopic Salts. Energy Procedia 2015, 70, 182–192. [Google Scholar] [CrossRef]
- N’Tsoukpoe, K.; Liu, N.; Le Pierres, N.; Luo, L. A review on long-term sorption solar energy storage. Renew. Sustain. Energy Rev. 2009, 13, 2385–2396. [Google Scholar] [CrossRef]
- Cot-Gores, J.; Castell, A.; Cabeza, L. Thermochemical energy storage and conversion: A-state-of-the-art review of the experimental research under practical conditions. Renew. Sustain. Energy Rev. 2012, 16, 5207–5224. [Google Scholar] [CrossRef]
- De Jong, A.-J.; Trausel, F.; Finck, C.; Van Vliet, L.; Cuypers, R. Thermochemical heat storage System design issues. Energy Procedia 2014, 48, 309–319. [Google Scholar] [CrossRef]
- De Boer, R.; Haije, W.; Veldhuis, J.; Smeding, S. Solid-Sorption Cooling With Integrated Thermal Storage: The SWEAT Prototype. Int. Conf. Heat Powered Cycles 2004, 8. [Google Scholar]
- Daguenet-Frick, X.; Gantenbein, E.; Frank, E.; Fumey, B.; Weber, R. Development of a numerical model for the reaction zone design of an aqueous sodium hydroxide seasonal thermal energy storage. Sol. Energy 2013, 121, 17–30. [Google Scholar] [CrossRef]
- Ferchaud, C. Experimental Study of Salt Hydrates for Thermochemical Seasonal Heat Storage. Ph.D. Thesis, Technische Universiteit Eindhoven, Eindhoven, The Netherlands, 2016. [Google Scholar]
- Sögütoglu, L.; Donkers, P.; Fischer, H.; Huinink, H.; Adan, O. In-depth investigation of thermochemical performance in a heat battery: Cyclic analysis of K2CO3, MgCl2 and Na2S. Appl. Energy 2018, 215, 159–173. [Google Scholar] [CrossRef]
- Sircar, S.; Kumar, R. Non-isothermal Surface Barrier Model for Gas Sorption Kinetics on Porous Adsorbents. J. Chem. Soc. Faraday Trans. 1 1984, 80, 2489–2507. [Google Scholar] [CrossRef]
- Sander, R. Compilation of Henry’s law constants (version 4.0) for water as solvent. Atmos. Chem. Phys. 2015, 15, 4399–4981. [Google Scholar] [CrossRef]
- Shen, C. Rarefied Gas Dynamics: Fundamentals, Simulations and Micro Flows; Springer: Heidelberg, Germany, 2005. [Google Scholar]
- Fang, G.; Ward, C. Temperature measured close to the interface of an evaporating liquid. Phys. Rev. E 1999, 59, 417–428. [Google Scholar] [CrossRef]
- Ward, C.; Stanga, D. Interfacial conditions during evaporation or condensation of water. Phys. Rev. E 1999, 64, 501–509. [Google Scholar]
- Badam, V.; Kumar, V.; Durst, F.; Danov, K. Experimental and theoretical investigations on interfacial temperature jumps during evaporation. Exp. Therm. Fluid Sci. 2007, 32, 276–292. [Google Scholar] [CrossRef]
- Knudsen, M.; Partington, J. The kinetic theory of gases: Some modern aspects. J. Phys. Chem. 1953, 39, 307. [Google Scholar] [CrossRef]
- Schrage, R. A Theorectical Study of Interphase Mass Transfer; Columbia University Press: New York, NY, USA, 1953. [Google Scholar]
- Marek, R.; Straub, J. Analysis of the evaporation coefficient and the condensation coefficient of water. Int. J. Heat Mass Transf. 2001, 44, 39–53. [Google Scholar] [CrossRef]
- Wang, H.; Garimella, S.V.; Murthy, J.Y. Characteristics of evaporating thin film in a microchannel. Int. J. Heat Mass Transf. 2007, 50, 3933–3942. [Google Scholar] [CrossRef]
- Kharangate, C.; Lee, H.; Mudawar, I. Computational modeling of turbulent evaporating falling films. Int. J. Heat Mass Transf. 2015, 81, 52–62. [Google Scholar] [CrossRef]
- Kharangate, C.; Mudawar, I. Review of computational studies on boiling and condensation. Int. J. Heat Mass Transf. 2017, 108, 1164–1196. [Google Scholar] [CrossRef]
- Bond, M.; Struchtrup, H. Mean evaporation and condensation coefficients based on energy dependent condensation probability. Phys. Rev. E 2004, 70, 601–605. [Google Scholar] [CrossRef]
- Kryukov, A.; Levashov, V. About evaporation-condensation coefficients on the vapor-liquid interface of high thermal conductivity matters. Int. J. Heat Mass Transf. 2011, 54, 3042–3048. [Google Scholar] [CrossRef]
- Popov, S.; Melling, A.; Durst, F.; Ward, C. Apparatus for investigation of evaporation at free liquid-vapour interfaces. Int. J. Heat Mass Transf. 2005, 48, 2299–2309. [Google Scholar] [CrossRef]
- Bird, R.B.; Stewart, W.E.; Lightfoot, E.N. Transport Phenomena, 2nd ed.; John Wiley and Sons: New York, NY, USA; Chichester, UK, 1924. [Google Scholar]
- Houben, J.; Huinink, H.; Sögütoglu, L.; Donkers, P.; Adan, O. K2CO3 a Suitable Material for Closed Heat Storage Systems. Energy 2019. submitted. [Google Scholar]


© 2020 by the authors. Licensee MDPI, Basel, Switzerland. This article is an open access article distributed under the terms and conditions of the Creative Commons Attribution (CC BY) license (http://creativecommons.org/licenses/by/4.0/).