Article

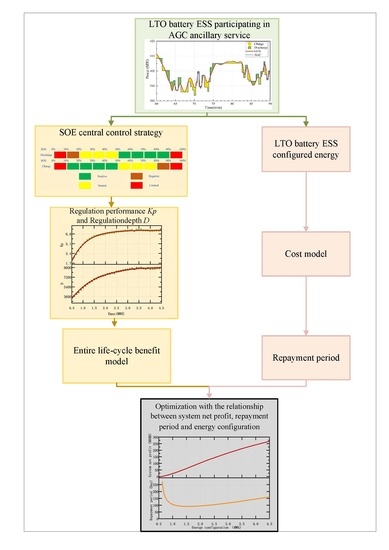
Control Strategies and Economic Analysis of an LTO Battery Energy Storage System for AGC Ancillary Service

1
National Active Distribution Network Technology Research Center (NANTEC), Beijing Jiaotong University, Beijing 100044, China
2
Collaborative Innovation Center of Electric Vehicles in Beijing, Beijing Jiaotong University, Beijing 100044, China
3
CHINT ESS Division, Shanghai 201614, China
4
Envision Energy, Shanghai 200051, China
5
Department of Electrical and Computer Engineering, University of Denver, Denver, CO 80208, USA
*
Author to whom correspondence should be addressed.
Energies 2020, 13(2), 505; https://doi.org/10.3390/en13020505
Submission received: 19 December 2019 / Revised: 8 January 2020 / Accepted: 16 January 2020 / Published: 20 January 2020
(This article belongs to the Special Issue Thermal and Energy Management of Battery-Operated Systems)

Abstract

:
With the rapid growth of renewable energy and the DC fast charge pile of the electric vehicle, their inherent volatility and randomness increase a power system’s unbalance of instantaneous power. The need for power grid frequency regulation is increasing. The energy storage system (ESS) can be used to assist the thermal power unit so that a better frequency regulation result is obtained without changing the original operating mode of the unit. In this paper, a set of different charging/discharging control strategies of the lithium titanate battery (LTO) is proposed, which are chosen according to the interval of the State of energy (SOE) to improve the utilization rate of the ESS. Finally, the cost-benefit model of the ESS participating in automatic generation control ancillary service is established. Case analysis proves that after a 1.75 MWh ESS is configured for a 600 MW thermal power unit, Kp and D is increased from 1.42 to 6.38 and 2857 to 6895 MW. The net daily income is increased from 20,284 yuan to 199,900 yuan with a repayment period of 93 days. The results show that the control strategies and the energy configuration method can improve the performance and economic return of the system.

Graphical Abstract

1. Introduction

With the development of the global economy, the energy, once one of the pillars of social development, has severely restricted sustainable development under the influence of various factors. From high-carbon to low-carbon [1], from low-efficiency to high-efficiency, from unsustainable to sustainable, it is a basic requirement for sustainable development that renewable energy replaces traditional energy to achieve energy storage and conversion. Conserving fossil energy, research and development and large-scale use of renewable energy have become important strategies for energy security and sustainable development in countries around the world [2]. Therefore, the new energy industry, especially the renewable energy industry, will become a new growth point for the global economy in the future. Various technologies have been developed to achieve the goals of energy conservation and sustainable development [3,4]. Meanwhile, energy storage technology which is the key to achieving sustainable energy development can be used in power, transportation, and industrial production. For the power grid, the energy supply on the power generation side and the power demand on the customer side must be balanced in real time. With the rapid growth of distributed photovoltaic power generation, wind power generation, and DC fast charging piles of electric vehicles, the volatility of renewable power system and random usage characteristics on the customer side increase the instability of instantaneous power in a power system [5,6]. The thermal power unit needs to adjust the output according to changes in the load. This function is called Automatic Generation Control (AGC) service, for the sake of ensuring that the frequency fluctuates within the allowed range. The AGC unit operating at the economic base value may sacrifice some of the profit opportunities in the electricity market. The lost power generation profit of this part is the opportunity cost of the AGC unit [7]. Therefore, the addition of energy storage equipment to AGC units can fully exploit the opportunity cost of this part which is the profit principle of the energy storage system (ESS) participating in the AGC ancillary service.
On the one hand, the AGC thermal power unit, with help from lithium-ion battery ESS, can significantly improve its regulation effect [8]. Further, the profitability of ESS from AGC service is much better than the peak load shifting [9]. In [10], a model dealing with the optimal operation of the wind-storage hybrid system was proposed to participate in secondary frequency regulation which is mainly by means of the AGC system. According to Reference [11], large-capacity thermal power units can perform almost all frequency regulation functions, but the efficiency of the unit will be reduced. Whereas, using only ESS for frequency regulation will cause the ESS to have excessive energy and high cost. Moreover, the continuous charging and discharging leads to high temperatures of the ESS. Therefore, the best performance and economy can be achieved if thermal power units are assisted by ESS.
With the development of power market reform in China, the market for ESS participating in AGC ancillary services is being developed and promising. A demonstration project with a 2 MW BESS (Battery Energy Storage System) has been commissioned at Shijingshan Thermal Power Plant, Beijing, which offers an excellent example case of utilizing BESS for improving AGC performance [12]. The North China Power Grid released two documents regarding the AGC service—The Implementation Rules of Interconnection and Operation of Power Plant in North China Power Grid and The Management and Implementation Rules of Ancillary Service of Power Plant in North China Power Grid. In the North China Power Grid, the regulation performance (Kp) and regulation depth (D) are used to measure the regulation effect, contribution, and the subsidy of the AGC unit. Reference [13] analyzed the theoretical principles, coordination strategies, and economy of the joint frequency project based on the engineering practice. After the energy storage system was added into the thermal power plant, the Kp was increased by 3×, the D was increased by 2.5×, and the profit was increased by 7.5×.
The control strategy of ESS participating in AGC was proposed in Reference [14], considering its rapid regulation characteristics. Reference [15] proposed five kinds of control strategies for frequency regulation, and proved that the depth of discharge in this application has a very limited impact on battery life. In Reference [16], a method was proposed to decompose the low (assigned to the thermal power unit) and the high (assigned to the ESS) frequency component of regulation requirement by means of discrete Fourier transform. A charge/discharge strategy and a capacity configuration method with an off-limit regression scheme of State of Charge (SOC) of ESS were proposed in Reference [17] to improve the AGC performance of a power plant on the basis of compensation policy of ancillary services in North China. Various factors including the suppression of reverse frequency regulation, dead zone oscillation, ESS over discharge, and forced SOC homing were considered by an optimal control strategy proposed in Reference [18]. And the simulation using actual operation data of a power station was conducted with particle swarm optimization (PSO) algorithm. The results showed that both the frequency regulation performance and the operation cost of the method were better than those of the conventional unit.
According to the “Annual Development Report of China Power Industry 2018”, China’s thermal power generation in 2017 accounted for 62.2% of total power capacity, of which the breakdown in terms of coal, gas, biomass, and waste heat/pressure/gas power generation is 55.2%, 4.3%, 0.9%, and 1.4%, respectively. In other words, the thermal power unit is still the dominant player for AGC frequency regulation. As a result, an effective economic model must consider the impact of configuration capacity, control strategy, and battery lifecycle. However, most of the existing economic models use LiFePO4 Li-ion batteries without considering the full life cycle.
In this paper, the LTO is used in ESS, which has better performance in terms of safety, C-rate and cycle life [19]. Based on characteristics and state of energy (SOE) of LTO ESS, the control strategy and capacity configuration are also developed. A cost-benefit model for ESS to participate in AGC ancillary services is established which benefits are maximized while the payback period is minimized. The real-time data of the thermal power generating unit is used in the simulation. The result shows that the control strategy and the capacity configuration method developed in this paper can improve the performance and economic return.

2. The Basic Principle of ESS Participating in AGC Ancillary Service

2.1. Compensation Standard for AGC Ancillary Service in the North China Power Grid

Compared with other paid services, the ancillary service from Automatic Generation Control (AGC) is more difficult, which requires the generator set tracking the command within its available output range and adjusting its power generation output in real time according to a specific regulation rate to help the power system frequency remain stable. In the relevant policies of the North China Power Grid, the compensation and assessment methods have been formulated in detail for thermal power units participating in AGC ancillary services, which include Kp (measure regulation effect), D (measure regulation depth), and the compensation policy.
Figure 1 shows a common AGC regulation process. The entire regulation process is described as follows: before time T0, the unit stably operated near the last command value P1. At time T0, the AGC control program in the Energy Management System (EMS) of the power system issued a command with a power of P2 to the unit. After receiving the command, the unit starts to increase the output. At time T1, the unit reliably crosses the response dead zone (Artificially set control dead zone to prevent the unit from error regulating due to disturbances) consistent with the regulation direction and continues to increase the output. At time T2, the unit enters the dead zone for the first time (The set area used to determine whether the unit’s current regulation is completed. When the unit enters the dead zone, it is considered that the regulation climbing process is completed). Then, it oscillates slightly around P2 until it is stable or the next AGC command is issued, and the regulation ends. At time T3, the AGC control program issues a new command to the unit with a power of P3 and the unit starts to decrease. When the unit receives the new AGC command, due to the unit’s inertia characteristics or artificially set delay, it takes a certain amount of time to make the unit output in the direction consistent with the regulation direction. The unit is out of the response dead zone at time T4 and continues to reduce the output. Until T5, it enters the regulation dead zone of P3 and runs stably near it. The Kp consists of three parts. The regulation performance index K1 is established for the unit’s regulation rate (climbing/downhill rate), the regulation performance index K2 is created for the accuracy of the unit’s regulation output, and the regulation K3 is set for the speed of the unit’s response to the AGC command. The relationship between Kp, K1, K2, and K3 is as Equation (1):
K p = K 1 * K 2 * K 3
The regulation depth D is used in the compensation standard to indicate the unit regulation contribution, which means the amount of output power that is meaningful to the grid during the unit regulation process. When the thermal power unit is tracking the AGC command to regulate the power generation output in real time, it cannot meet the requirements due to its limited flexibility all the time. In order to ensure the regulation performance and the reliability of regulation depth calculation, there are three common situations: normal situation, delay situation, and reverse situation.

2.1.1. Normal Situation

The normal situation means that the unit responds to the AGC command correctly and passes the dead zone and the unit climbs or decreases to the AGC command value finally. In this state, K1, K2, and K3 are respectively calculated according to the formula in the standard, and Kp can be calculated. D in this state is the absolute value of the AGC command value minus the unit output at the start of the effective range.

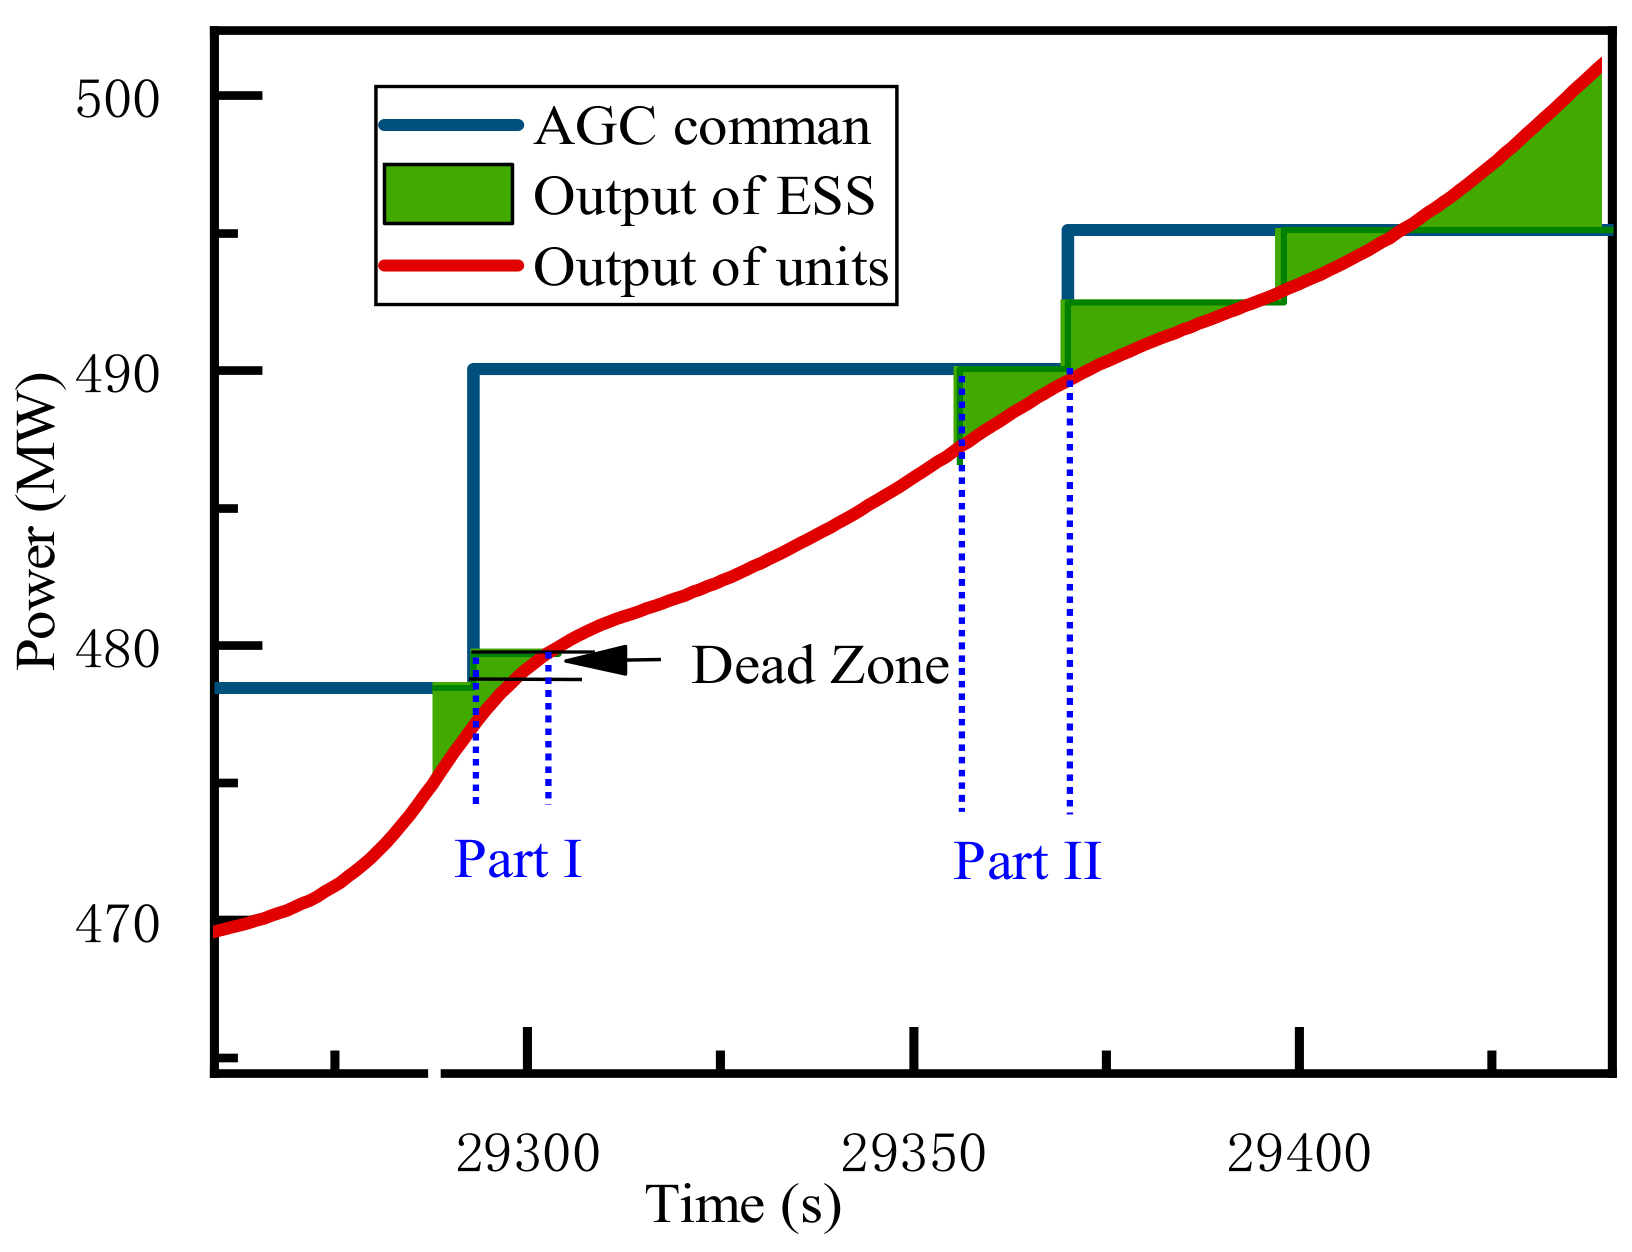
2.1.2. Delay Situation

Under the delay situation, the unit responds to the AGC command correctly, however, the output does not reach the command value at the end of the command interval. In this state, since the unit does not enter the dead zone, the K2 cannot be calculated. Kp equals to the product of K1 and K3. D is the difference of the unit output in the AGC regulation effective range.

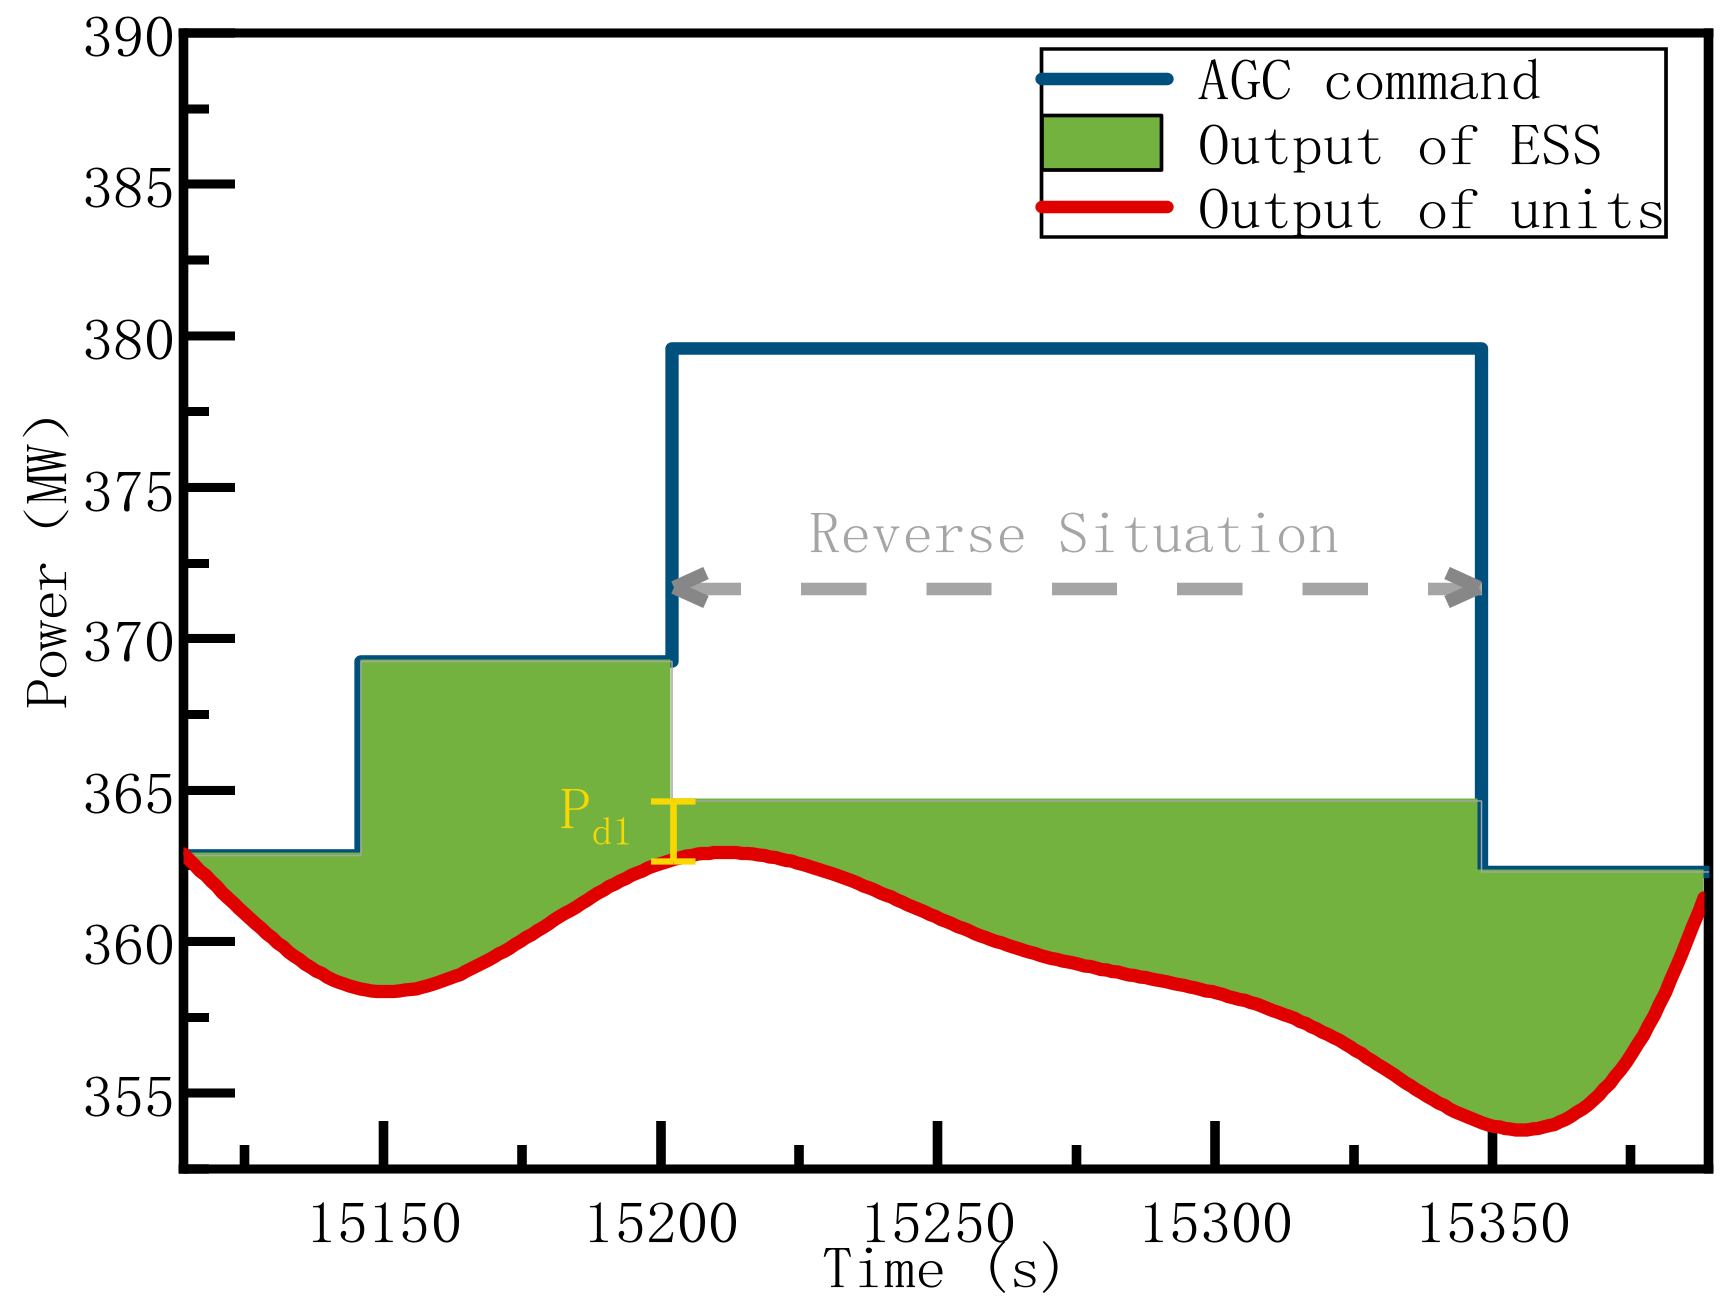
2.1.3. Reverse Situation

The reverse situation means that the unit is opposite the unit output in the AGC command. In this state, K1 = K2 = K3 = 0.1. D is the opposite of the unit output at the end of the effective range minus the output of the unit at the start of the effective range.

2.2. Compensation Fee for AGC Ancillary Services

According to the “Regulations on Shanxi Power Frequency Ancillary Service Market”, market should minimize the cost of AGC ancillary services. In the bidding day, the AGC ancillary service market will be cleared, and the service price YAGC will be determined. The daily income of the unit that participates in the AGC ancillary services can be calculated as Equation (2):
I d a y = D d a y * K p , d a y * Y A G C .

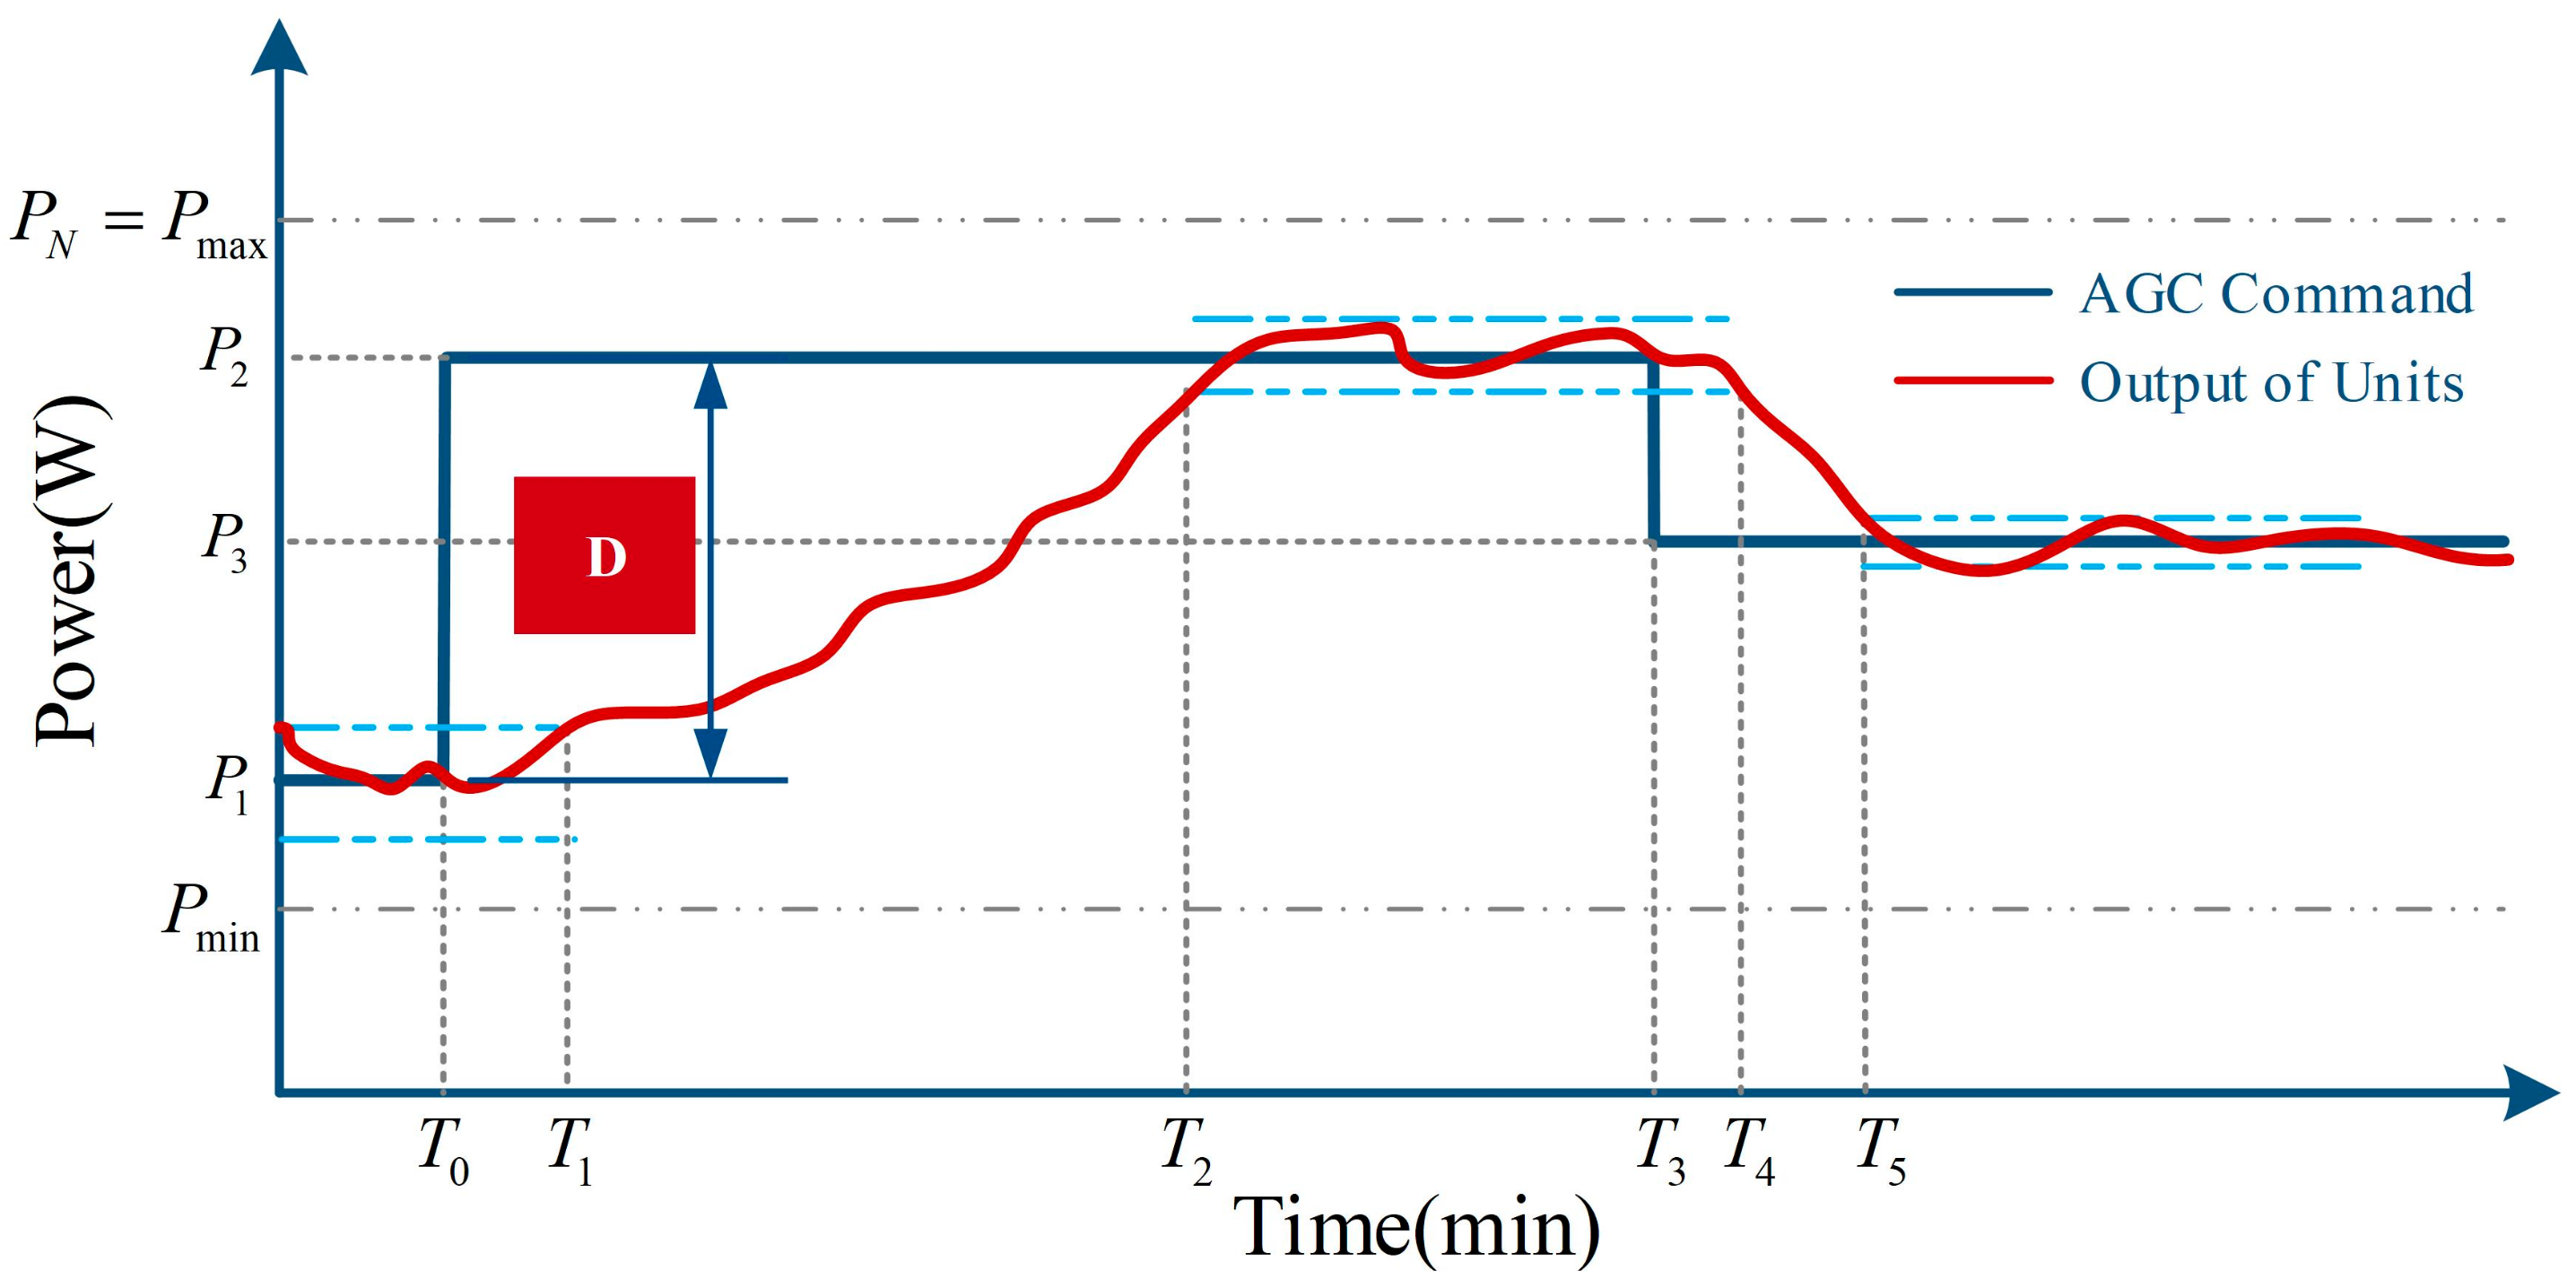
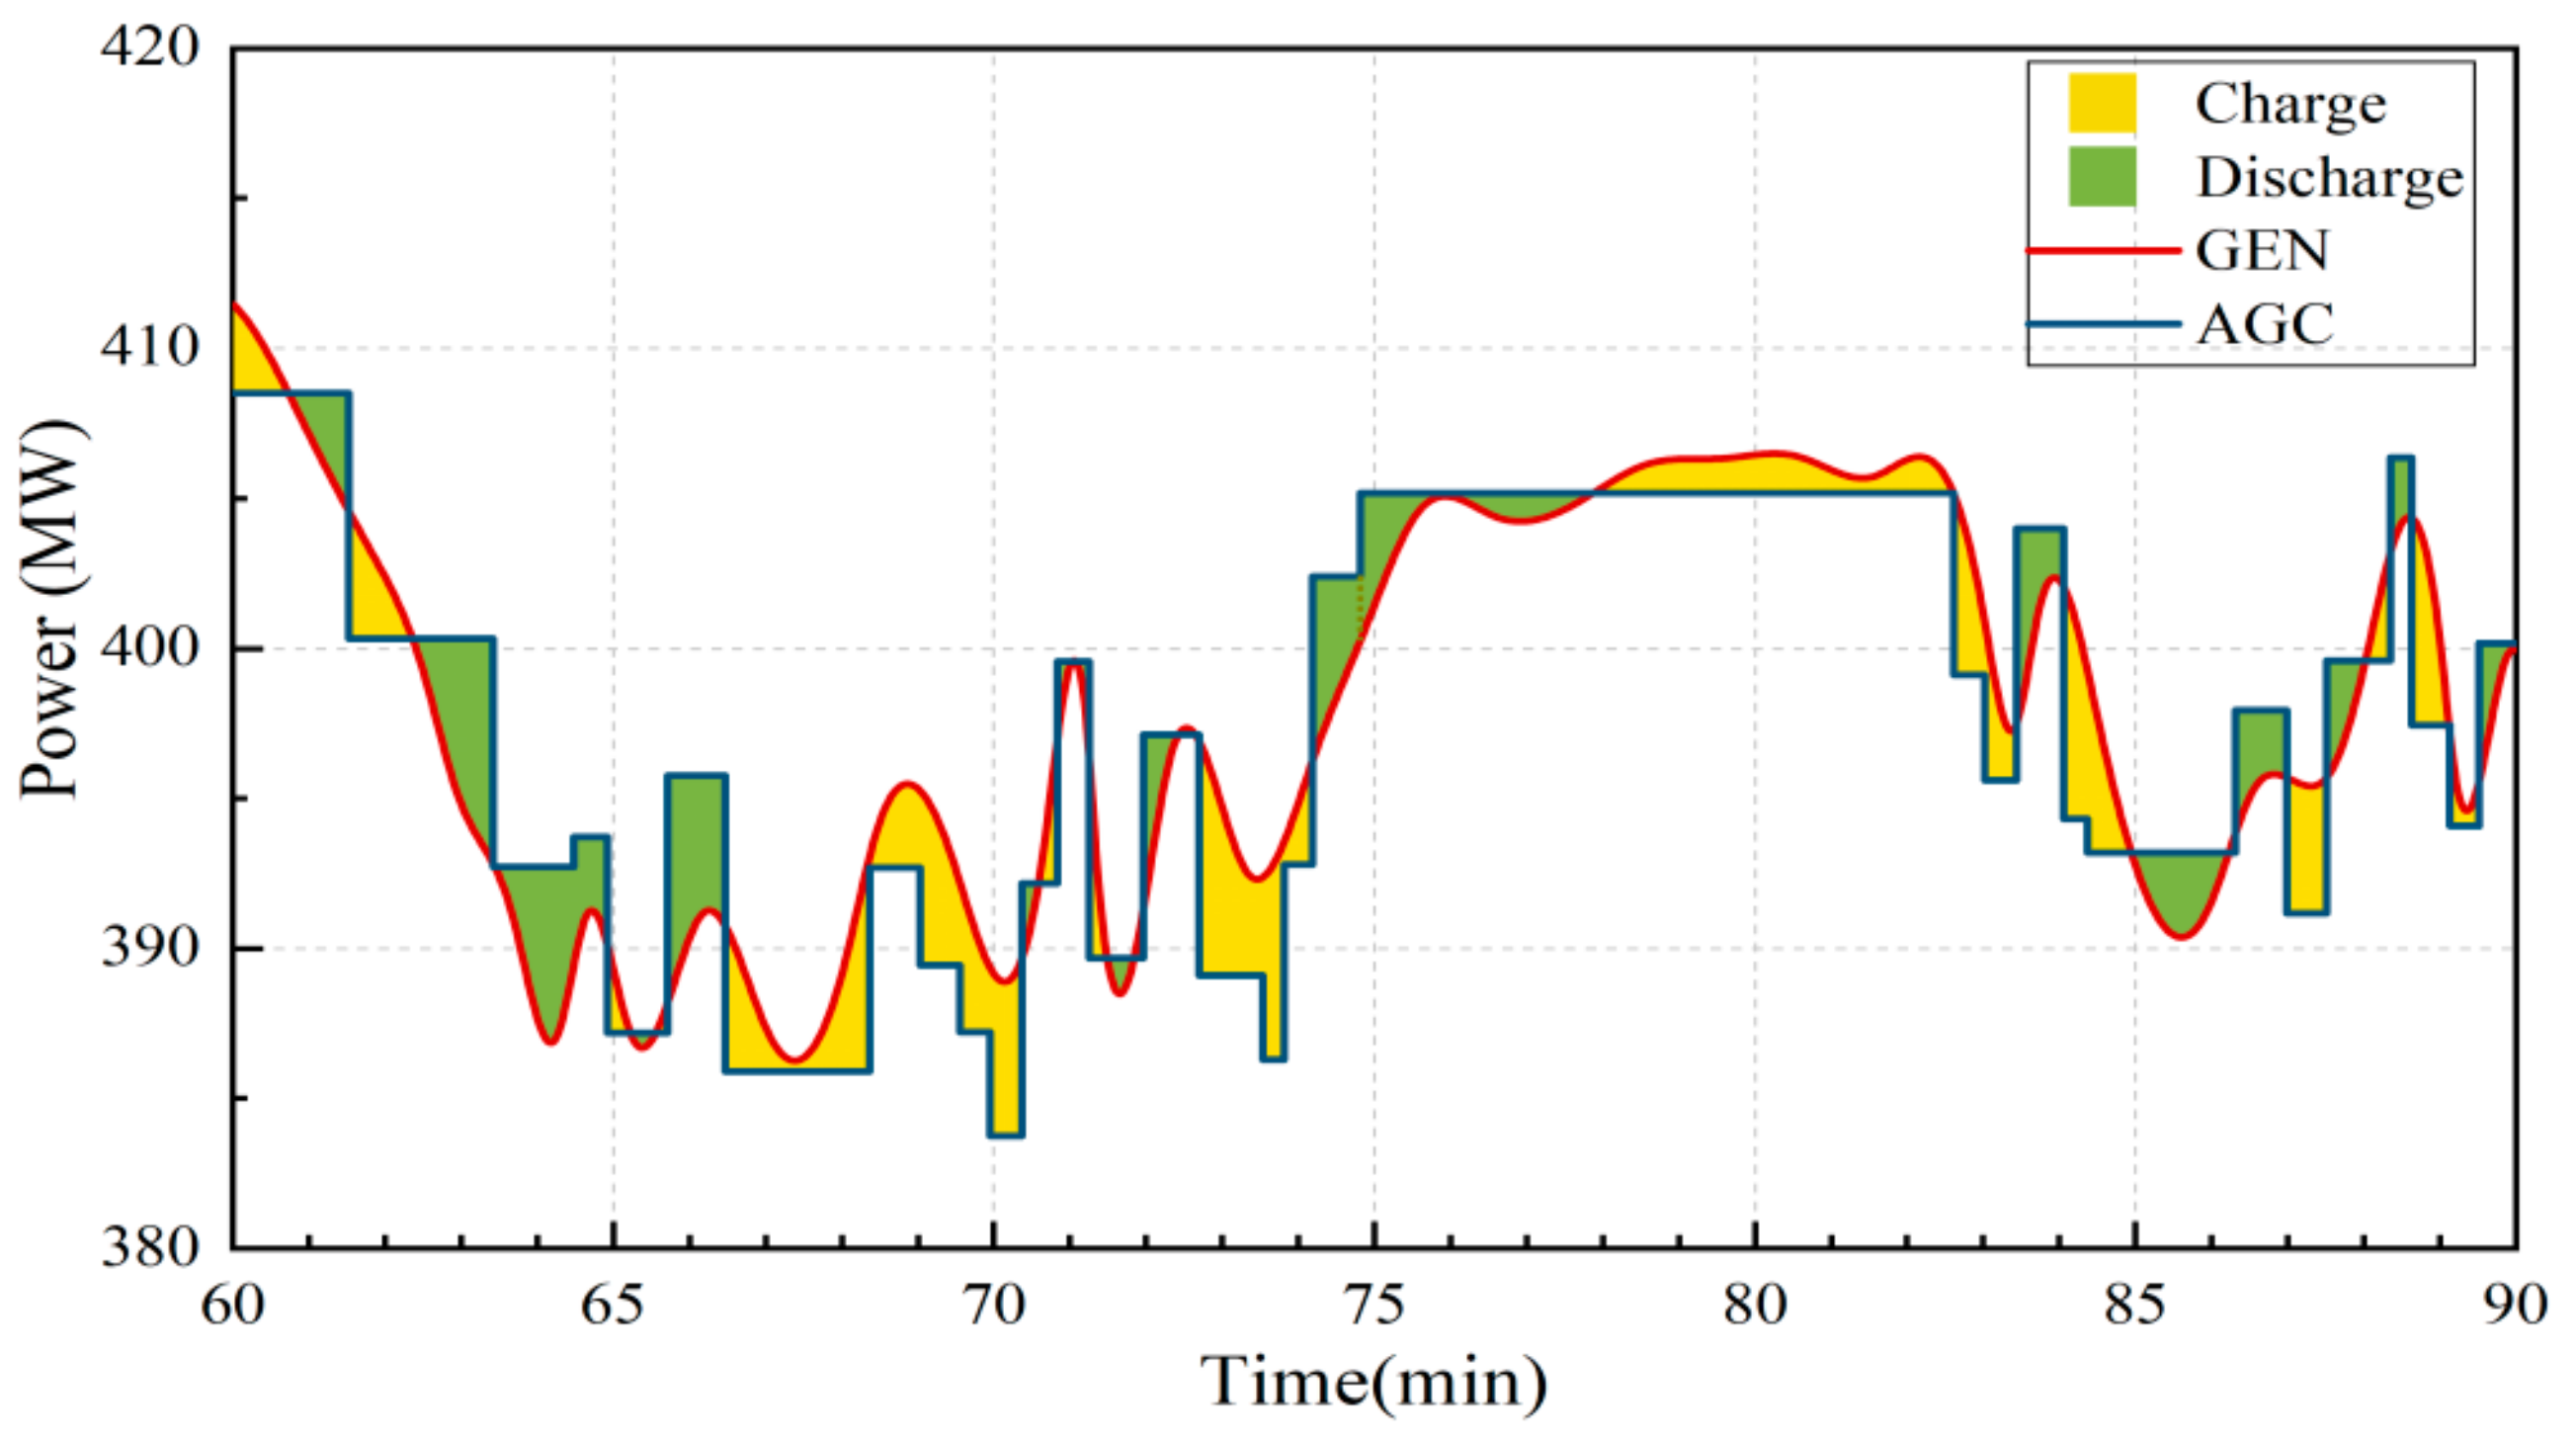
2.3. The Principle of ESS Helps Thermal Power Units Provide AGC Ancillary Services

Many studies [20,21,22] considered the rapid regulation characteristics of the ESS, and proposed control strategies for the ESS to participate in AGC. Literature [21] proposed the concept of AGC dynamic availability based on area control error (ACE), and proposed a control strategy for energy storage devices to participate in regional AGC services. The results show that the frequency modulation effect of energy storage devices can replace 3.6 times that of the conventional unit. In literature [22], the Fourier analysis of the AGC signal was decomposed into high-frequency and low-frequency components, and the charging and discharging strategy of the ESS was determined based on area regulation requirement (ARR). Simulation results show that the energy storage device can improve regulation effect. Because LTO battery has the advantages of superior low temperature performance and power performance, long cycle-life, superior and excellent safety performance an LTO battery is used as the energy storage element. However, there are few studies on ESS with LTO battery. In this paper, a model of battery life is established, and SOE central control strategy of LTO battery system is proposed. The principle of ESS helps thermal power units provide AGC ancillary services can be shown in Figure 2. AGC represents the AGC command, GEN represents the actual output of the unit. The yellow shaded portion represents the ESS absorb energy from the unit to reduce output power (ESS charges), and the green shaded represents the ESS release energy to increase the output power (ESS discharges).
In this paper, ESS does not change the original operation mode of the thermal power unit. When the unit receives a new AGC command, the unit follows the command according to its previous regulation mode (without the help of ESS). The ESS judges the charging or discharging depth according to the AGC command and the real-time output power of the unit so that the output of such a composite system (the ESS and the unit) can be as close as possible to the AGC command.

3. Performance of the LTO Battery

3.1. LTO Battery

The Li-ion battery with anode material of LTO lithium-ion has the advantages of higher discharge rate, longer cycle life, and higher safety. For ESS that provides AGC services, the ratio performance and the cycle performance are important, so the LTO battery is one kind of the most suitable batteries in this field. In this paper, the capacity of selected LTO battery is 25 Ah. The maximum continuous charging current of the battery is up to 200 A (8 C), while its maximum continuous discharge current is 300 A (12 C), which highly satisfies with the need for ESS to participate in AGC services.

3.2. Estimation of State of Energy

In the AGC service, using SOC as a reference is not reliable. The open circuit voltage (OCV) of battery is higher when the battery SOC gets higher. Only using the SOC to estimate the remaining available capacity of the battery cannot fully characterize the actual remaining available energy of the system. Battery discharging at different SOC with the same C-rate and same depth of discharge (DOD) has the same discharge capacity while the discharge energy is different as the voltage varies under different SOC. Therefore, using the state of energy (SOE) is more practical. In this paper, batteries are charged from SOC = 0% to 100% with a charging capacity of 5% SOC each time. After charging, battery rests for 1 h to get OCV data, do that work again but discharge batteries from SOC = 100% to 0%. Then there are two curves about that LTO battery are obtained, which are shown in Figure 3. As is shown in the graph, SOE and SOC are linear. This is because the real-time voltage while charging or discharging is affected by the charging or discharging resistor.

4. Control Strategy for ESS

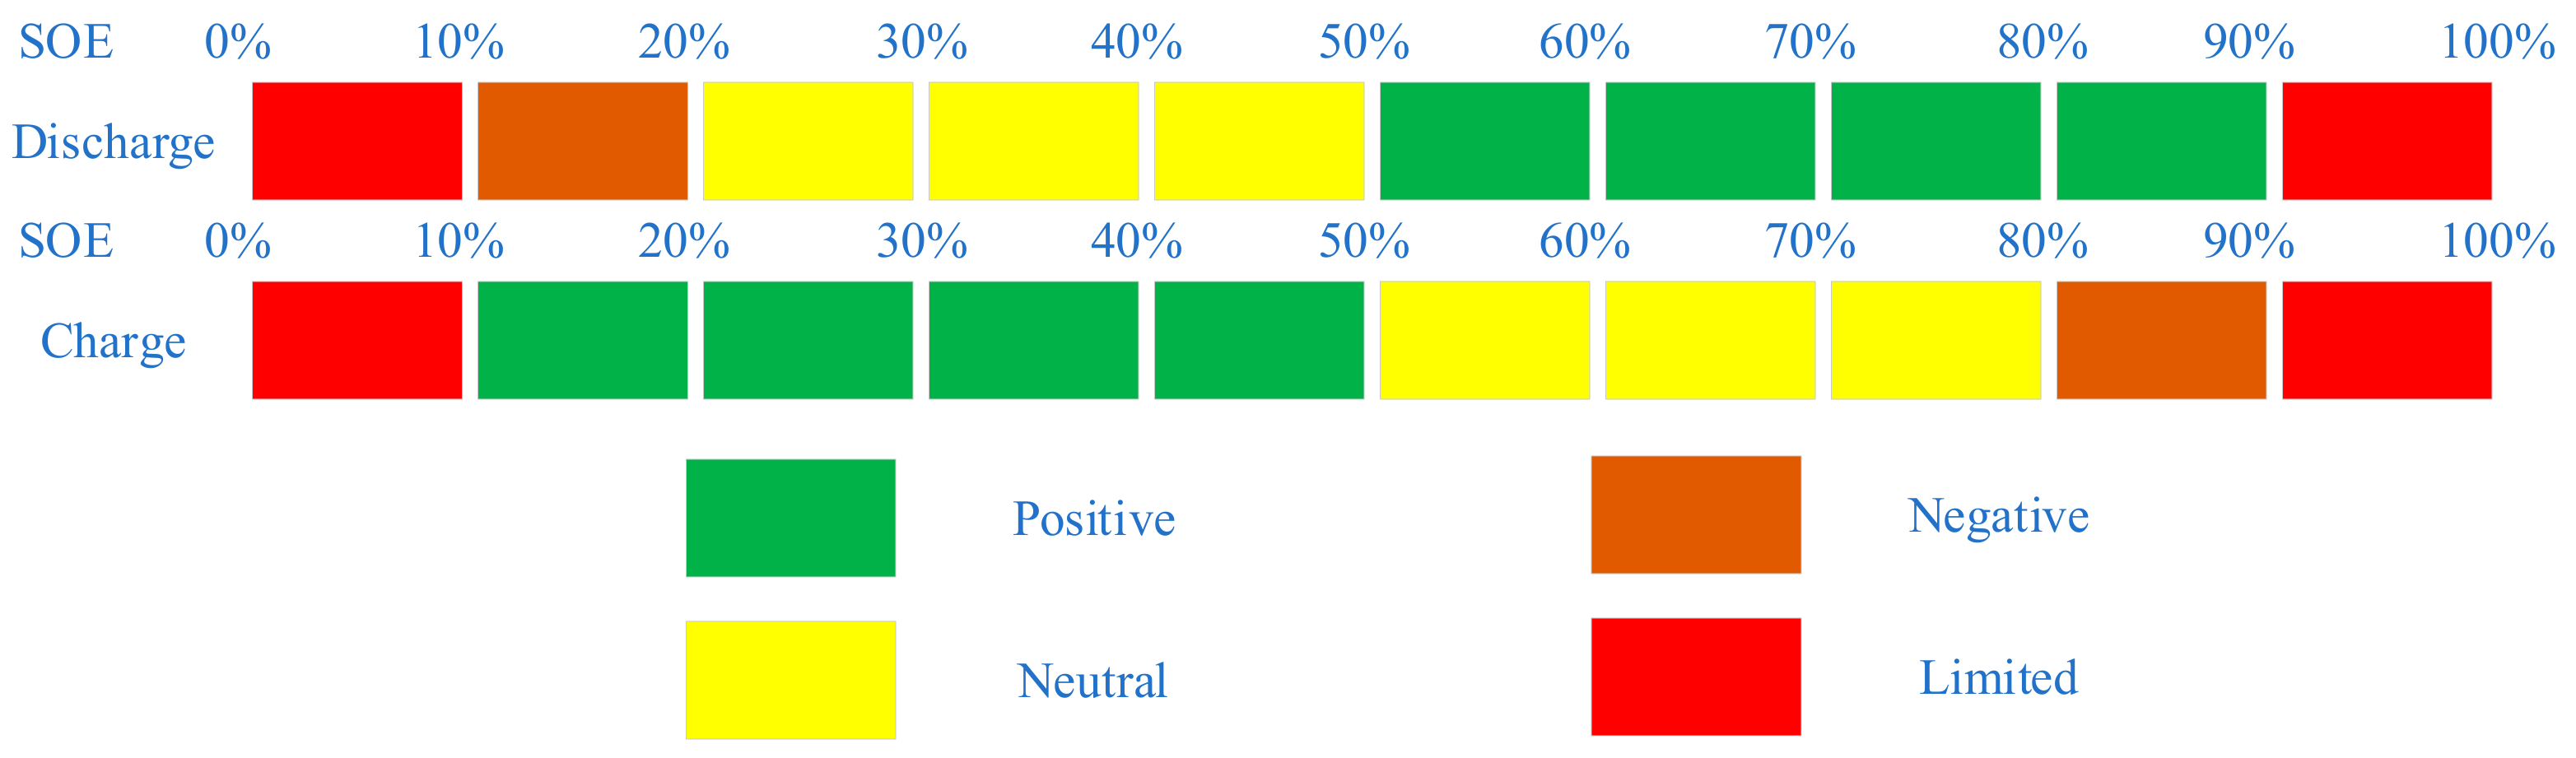
4.1. Design of Control Strategy

The available energy of the ESS is limited, which means that it cannot charge or discharge for a long time. For ESS, safety, high utilization and good returns are very important. To avoid over-charging and over-discharging, a safe SOE range should be set for ESS. The DOD of LTO battery in this paper can achieve 80% (from 90% SOE to 10% SOE). After that, the maximum charge/discharge current of the battery is also limited: the maximum continuous discharging C-rate is set to 4 C; the maximum short-time discharge C-rate is set to 6 C (20 s); the maximum continuous charging C-rate is set to 6 C.
After ensuring the safe operation of ESS, how to achieve the best regulation performance is the focus of the design. In daily regulation, the SOE of the battery system should be maintained at around 50%, which is the most ideal SOE point. In Reference [23], a penalty function similar to that of the HEV EMS is introduced into the SOC feedback control loop, which keeps the SOC around 50%. In this paper, a central control strategy that the output of the ESS is determined based on SOE is designed to keep SOE around 50%.
There are four kinds of strategies showed in Figure 4: the positive strategy, the neutral strategy, the negative strategy, and the limited strategy. The correspondence between SOE ranges and charging/discharging strategies is also illustrated as Figure 4. For example, When ESS receives the discharging command while the SOE goes between 90% and 50%, it takes the positive strategy to reduce SOE. A discharging process is taken as an example to demonstrate how the ESS works with these strategies.

4.1.1. Positive Strategy

The positive strategy means that the power of ESS should be as large as possible while satisfying the AGC command. The output discharge power is shown in Equation (3).
P dis ( t i ) = min η PCS P dis , max , P a ( t i ) P g ( t i ) η PCS

4.1.2. Neutral Strategy

Neutral strategy means that the unit should adopt a neutral discharge strategy while it is in the reverse situation, but the discharge strategy is consistent in normal situation, shown as Equation (4). When the unit needs reverse regulation, as shown in Figure 5, the difference in power is significantly increased compared to other states. If the ESS makes up for the entire power difference through discharge, it will cause excessive discharge in this regulation, causing the SOE to deviate by the set point. This situation is inconsistent with the principles of the control strategy. Therefore, the control strategy designed in this paper will be optimized for the unit’s reverse regulation. When the unit is subject to reverse regulation, the control strategy will not aim at maximizing the regulation performance, and adjust the regulation goal to stabilize the unit’s reverse regulation, that is, the output power of the ESS is no longer the difference between the AGC command and the unit output, but is adjusted to the difference between the unit output at the start of the regulation plus the difference of response dead zone threshold power and the unit thereafter output.
P dis ( t i ) = min η PCS P dis , max , P g ( t 0 i ) + P d 1 P g ( t i ) η PCS   ,   I n   t h e   R e v e r s e   S i t u a t i o n min η PCS P dis , max , P a ( t i ) P g ( t i ) η PCS    ,   I n   t h e   N o r m a l   S i t u a t i o n  

4.1.3. Negative Strategy

The negative strategy is adopted while SOE of ESS is between 20% and 10% in discharging. If the system discharges as the previous strategy, it may cause the system to over-discharge or reach the lower discharge limit. As a result, the system cannot participate in the next regulation and it even accelerates the degradation of battery remaining useful life. In order to allow the ESS participating in the next regulation, the output power should be reduced. In this case, ESS can be used to shorten the response time and improve the regulation accuracy. As shown in Figure 6, there are two parts in this strategy. Firstly, the ESS immediately discharges after receiving the command and keeps the output of the hybrid system larger than the dead zone (Part I). Then, the ESS will operate again to improve the regulation accuracy to increase K3 when the output of units enters the dead zone (Part II). The output power of the entire discharge strategy is described in Equations (5) and (6).
P dis ( t i ) = P g ( t 0 i ) + P d 1 P g ( t i ) η PCS   ,   P a r t   I
P dis ( t i ) = min { η PCS P dis , max , P a ( t i ) P g ( t i ) η PCS }   ,   P a r t   I I

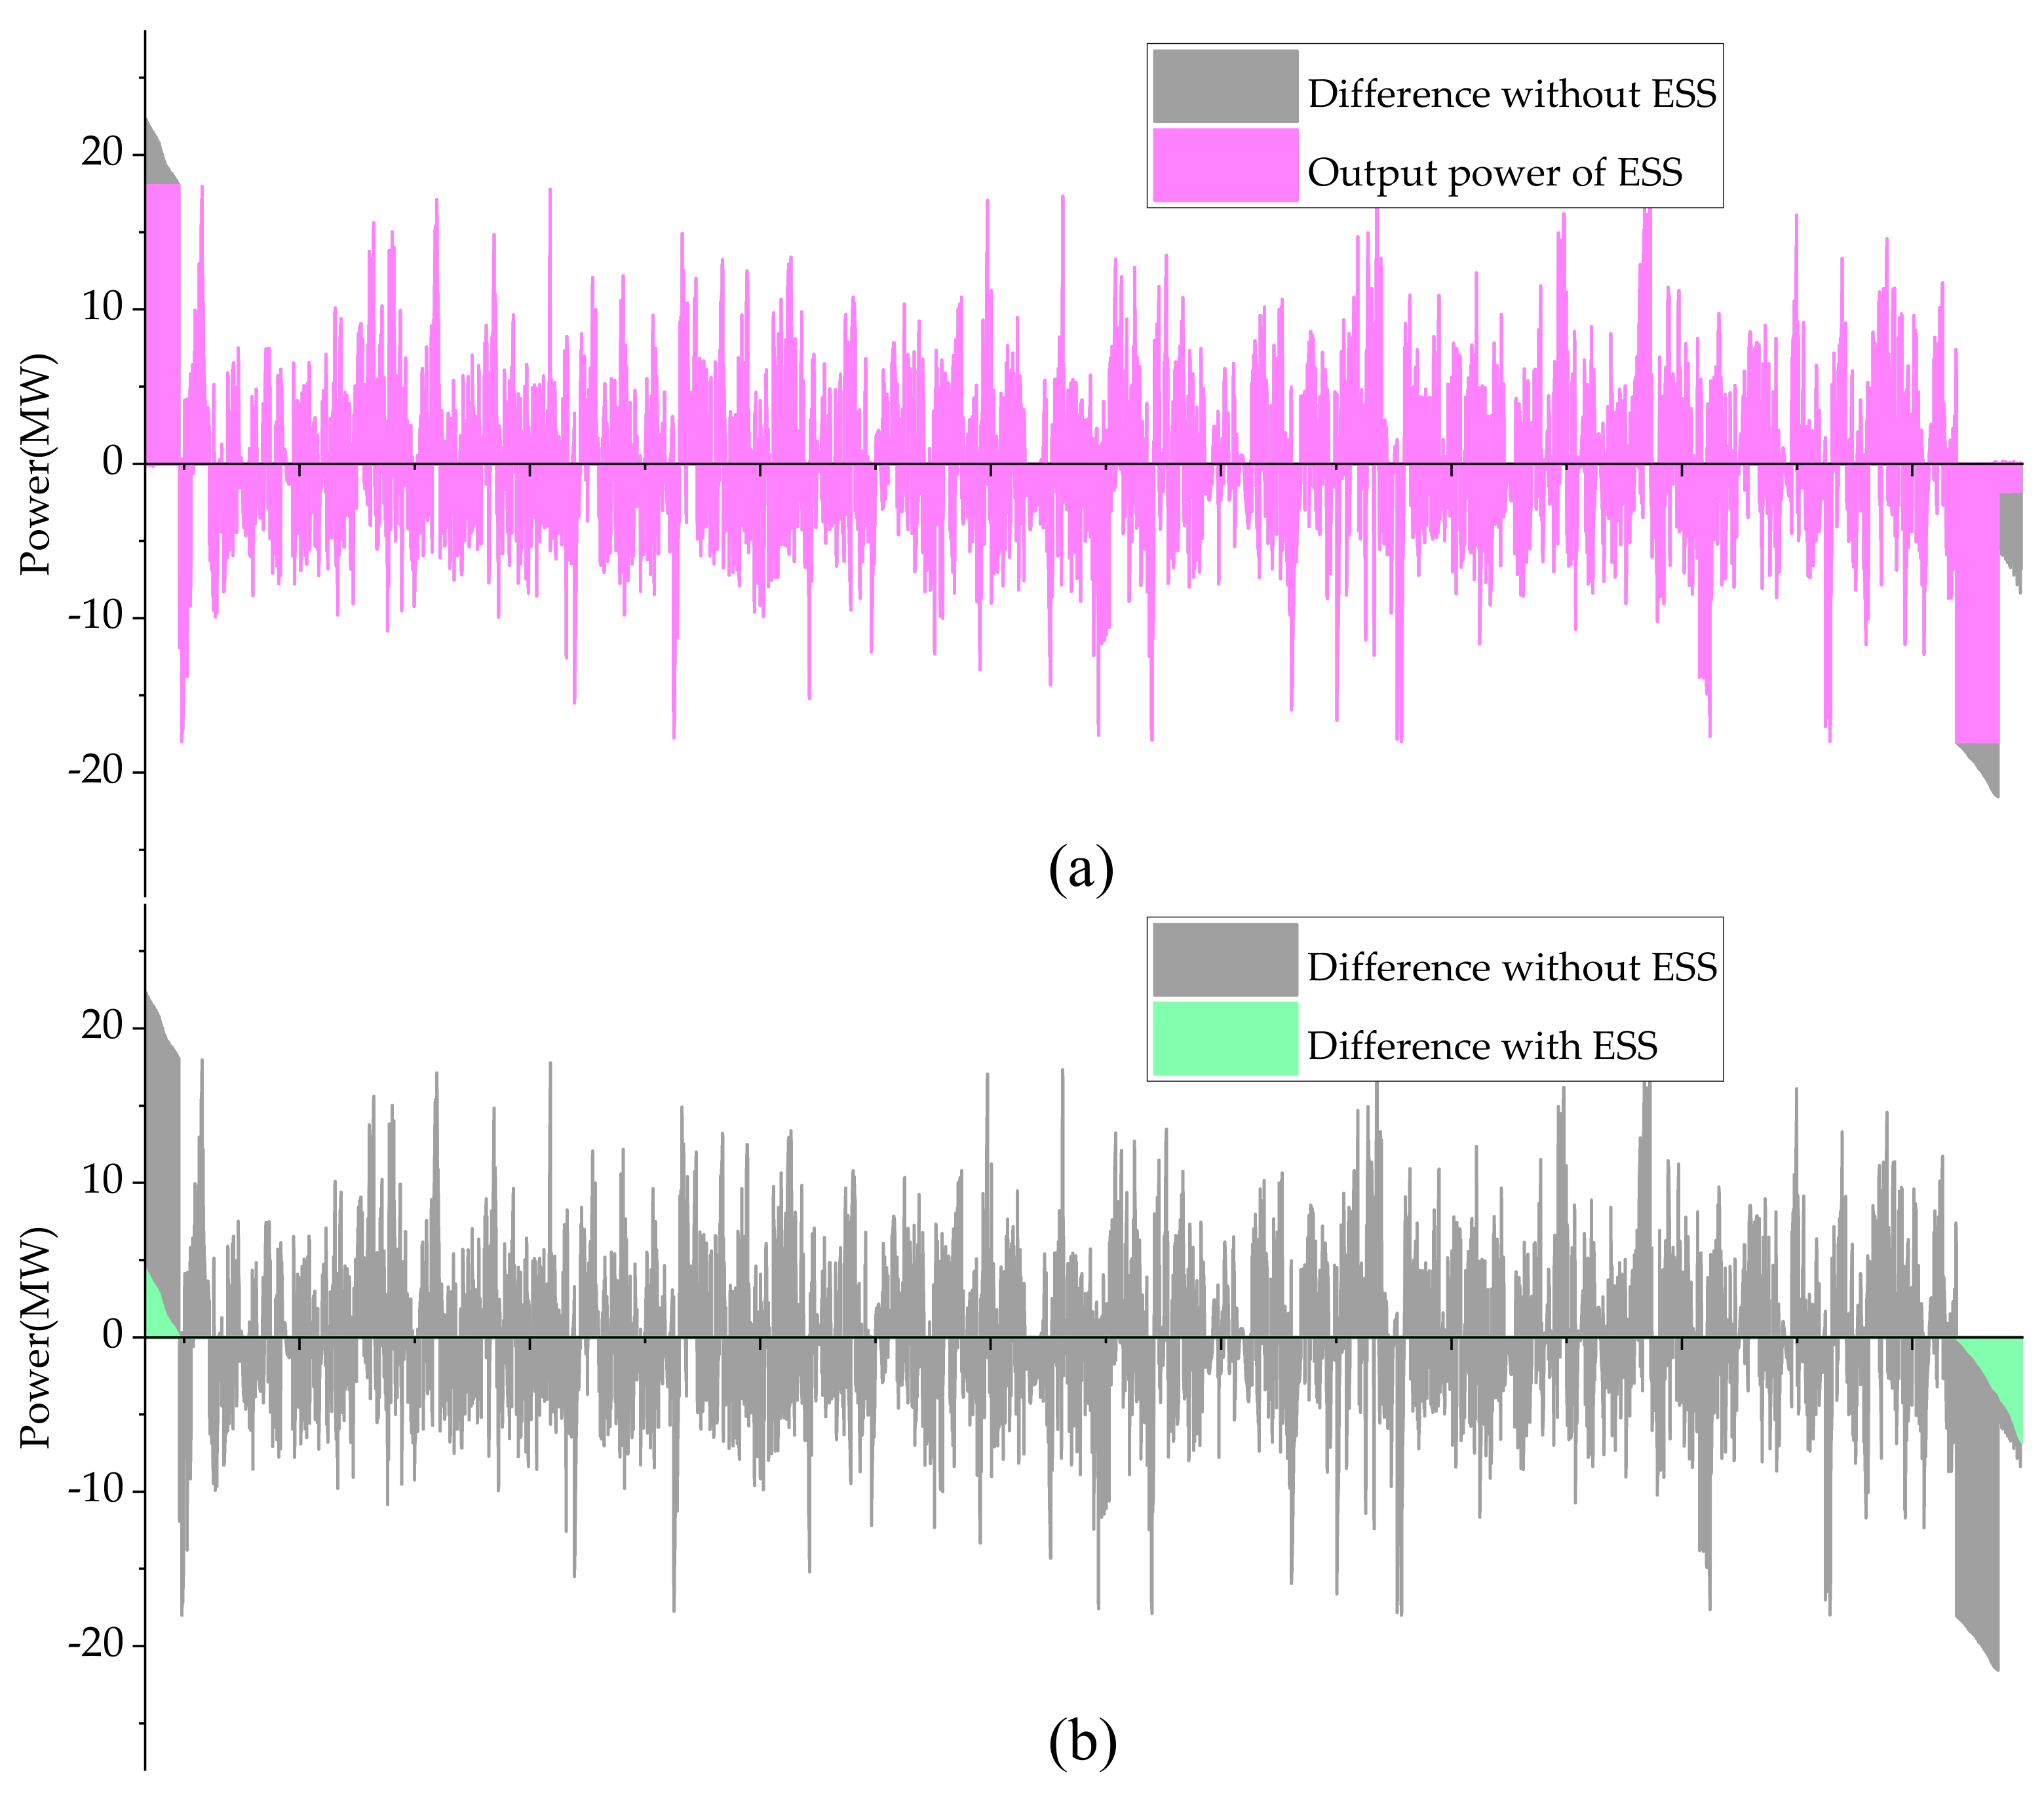
4.2. Results of the Strategy

The actual data of a 600 MW unit of a power plant is utilized as an example. The power system sent 1762 AGC setpoint commands to the units within 24 h, and the simulation of the 3 MWh ESS is shown in Figure 7. In Figure 7a, AGC represents the AGC command, and GEN represents the actual output of the unit. ALL represents the output of the whole system. It is seen that the system can basically satisfy the needs of the AGC ancillary service. In Figure 7b, it is demonstrated that the ESS is in an alternating charge and discharge state. Most of the output is less than 9 MW, only 1/2 of the rated power. In Figure 7c, the SOE is maintained within the range of 10–90%. During the simulation, the SOE only reaches the upper limit of output once. After reaching the upper limit, the strategy of active discharge and negative charging are adopted making the SOE quickly returned to about 50%, which means that the control strategy of this paper is very intelligent to effectively control the SOE.

5. The Economic Model and Case Analysis

5.1. The Cost-Benefit Model

The cost-benefit model is widely used to analyze the profitability of commercial projects.

5.1.1. The Cost Model

The cost of the ESS consists of initial investment costs and maintenance costs, shown as Equation (7). The initial investment is mainly composed of the cost of the battery module, the energy conversion equipment (such as PCS), the ancillary equipment (such as air conditioners, fire protection, etc.) and the construction cost. The calculation of investment cost is shown in Equation (8). All the elements in Equation (8) can be calculated by using unit price and quantity with Equations (9)–(12). Since the hardware devices are mature technology, the operating cost are mainly concentrated on the battery system. Moreover, because the energy storage equipment investors have no need to pay electricity bill to the power plant, the operating cost can be expressed by Equation (13).
C A L L = C I N T + C O M
C I N T = C B A T + C C E + C A E + C C C
C B A T = U B A T * E N
C C E = U C E * P N
C A E = U A E * E N
C C C = U C C * E N
C O M = U O M * E N

5.1.2. The Benefit Model

This paper establishes a cost-benefit model for the ESS of LTO battery which participates in AGC ancillary services. The energy configuration of the ESS is used as the decision variable, and the shortest payback period is used as the objective function. Meanwhile, the optimization of the maximum life-cycle benefit is taken into consideration. The benefit generated by the ESS mainly comes from the increased AGC ancillary service fees with the increment of the unit’s regulation performance and regulation depth. However, it must be clear that thermal power units will also receive fees for participating in the AGC ancillary services before the ESS is configured. Some scholars ignore this detail in their research, and the benefit model proposed in this paper takes this detail into account. Therefore, Equation (14) shows that the actual daily income of ESS (IAGC) is the difference between the daily income of the AGC system (IALL) and the daily income of the thermal power unit when it works alone (IGEN). Besides, IALL and IGEN are the functions of the maximum available capacity EMAX of the ESS. The IALL and IGEN can be calculated by Equations (15) and (16), respectively. Since IAGC decreases as the EMAX declines, the annual benefit is shown in Equation (17).
I AGC ( E MAX ) = I ALL ( E MAX ) I GEN
I A L L ( E M A X ) = K P ( E M A X ) * D ( E M A X ) * Y A G C
I G E N = K P , G E N * D G E N * Y A G C
I A G C , y e a r = t = i C cycle I A G C t ( E M A X )
At the same time, the full life cycle benefit of the ESS is constrained by the life of the ESS. When the maximum available energy of the battery declines to 80% of the rated energy, the battery is considered to be out of service. The more difficult problem is that with the change in the energy of configured ESS, the life of the ESS is constantly changing. In addition, the working profiles of the ESS participating in the AGC ancillary services are very complicated, which makes it difficult to estimate the battery life. The above two points make it arduous to calculate the whole life-cycle benefits. As a result, a life estimation method based on the energy throughput of the entire life cycle is proposed.
Battery companies have the code of quality assurance of their products to ensure that the battery can operates normally for a certain number of cycles. In this paper, throughput capacity of energy is used as a life standard to evaluate whether the ESS should be retired. According to the battery energy, the number of life cycles, the cut-off capacity and the depth of discharge (DOD) specified in the technical agreement, the total throughput capacity of energy of the LTO battery can be calculated by Equation (18). When the cumulative energy throughput of the battery in actual use reaches this value, it can be judged that the battery should be out of service, as shown in Equation (19). At the same time, the decline of the battery life can also be roughly judged based on the used energy throughput.
E l i f e = 2 * E N * N c y c l e * 1 + R c u t o f f 2 * D O D
i = 1 t c u t o f f E a d d i E l i f e
Battery aging can also degrade the performance of ESS, such as the available capacity. This means that the maximum available capacity of the battery needs to be estimated by using Equation (20) in the beginning of each regulation process while doing the simulation. Due to currency depreciation or inflation, the time value of funds also needs to be considered. If the initial investment does not consider loans, it is a present value investment, and the return is non-present value, which needs to be discounted according to a certain discount rate. Considering the time value of money, Equation (21) can be used to evaluate the value by discounting the future payment. The life cycle income of ESS can be expressed by Equation (22).
E M A X t = E N 1 ( 1 R c u t o f f ) * i = 1 t 1 E a d d i E l i f e
P V = A 1 ( 1 + r ) + A 2 ( 1 + r ) 2 + + A n ( 1 + r ) n
P n e t = P V ( I A G C , y e a r C O M ) C I N T

5.2. Case Analysis

This section includes case analysis and simulation to find the optimal capacity of ESS. Then the project’s profit forecast can be obtained. This paper presents a case study of a 600 MW unit in a thermal power plant in Shanxi Province, China. Figure 8 is the output curve of the unit providing the AGC ancillary services. Due to the slow response of the thermal power unit, there are some delay situations and reverse situations in the regulation process.

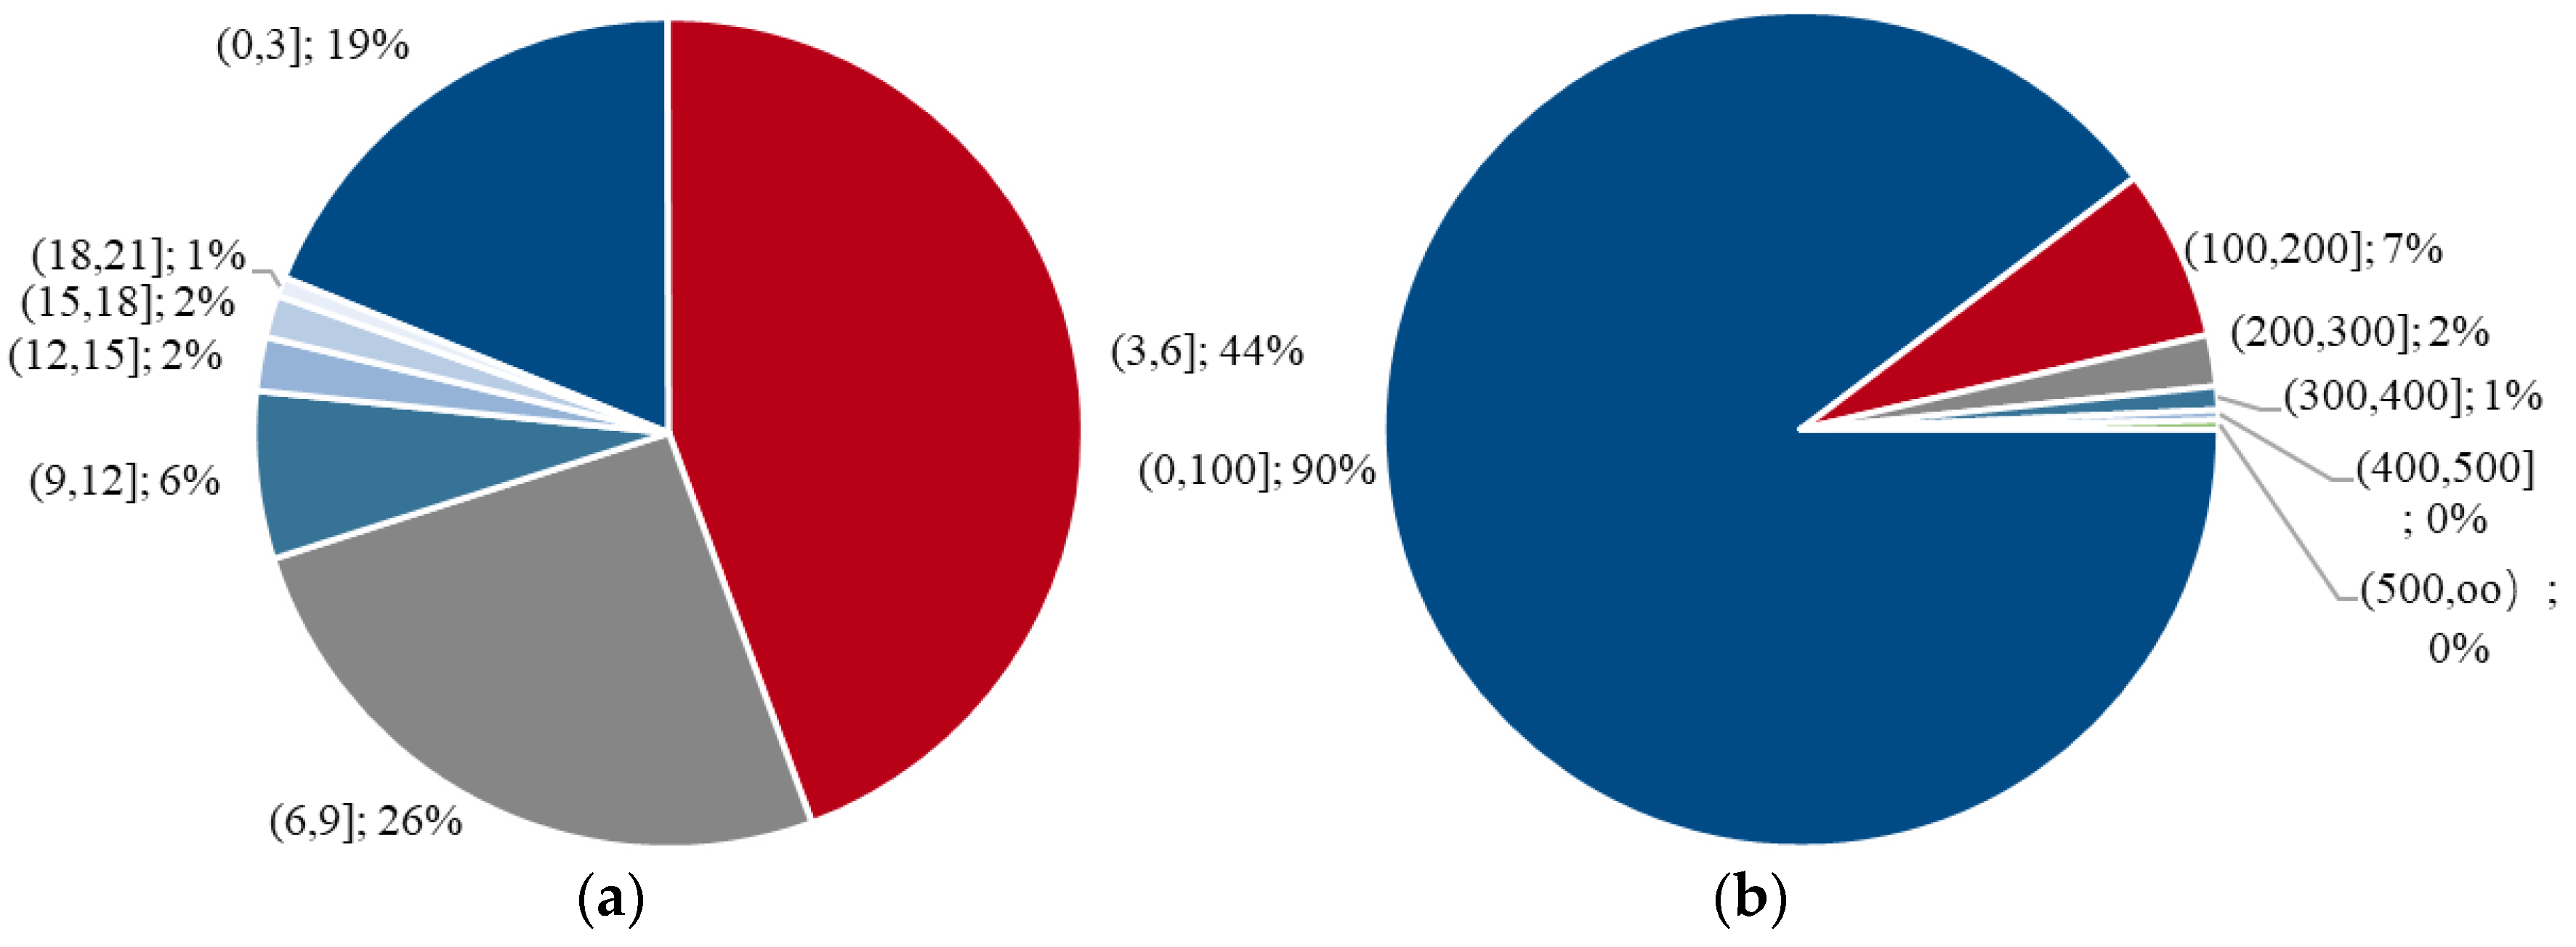
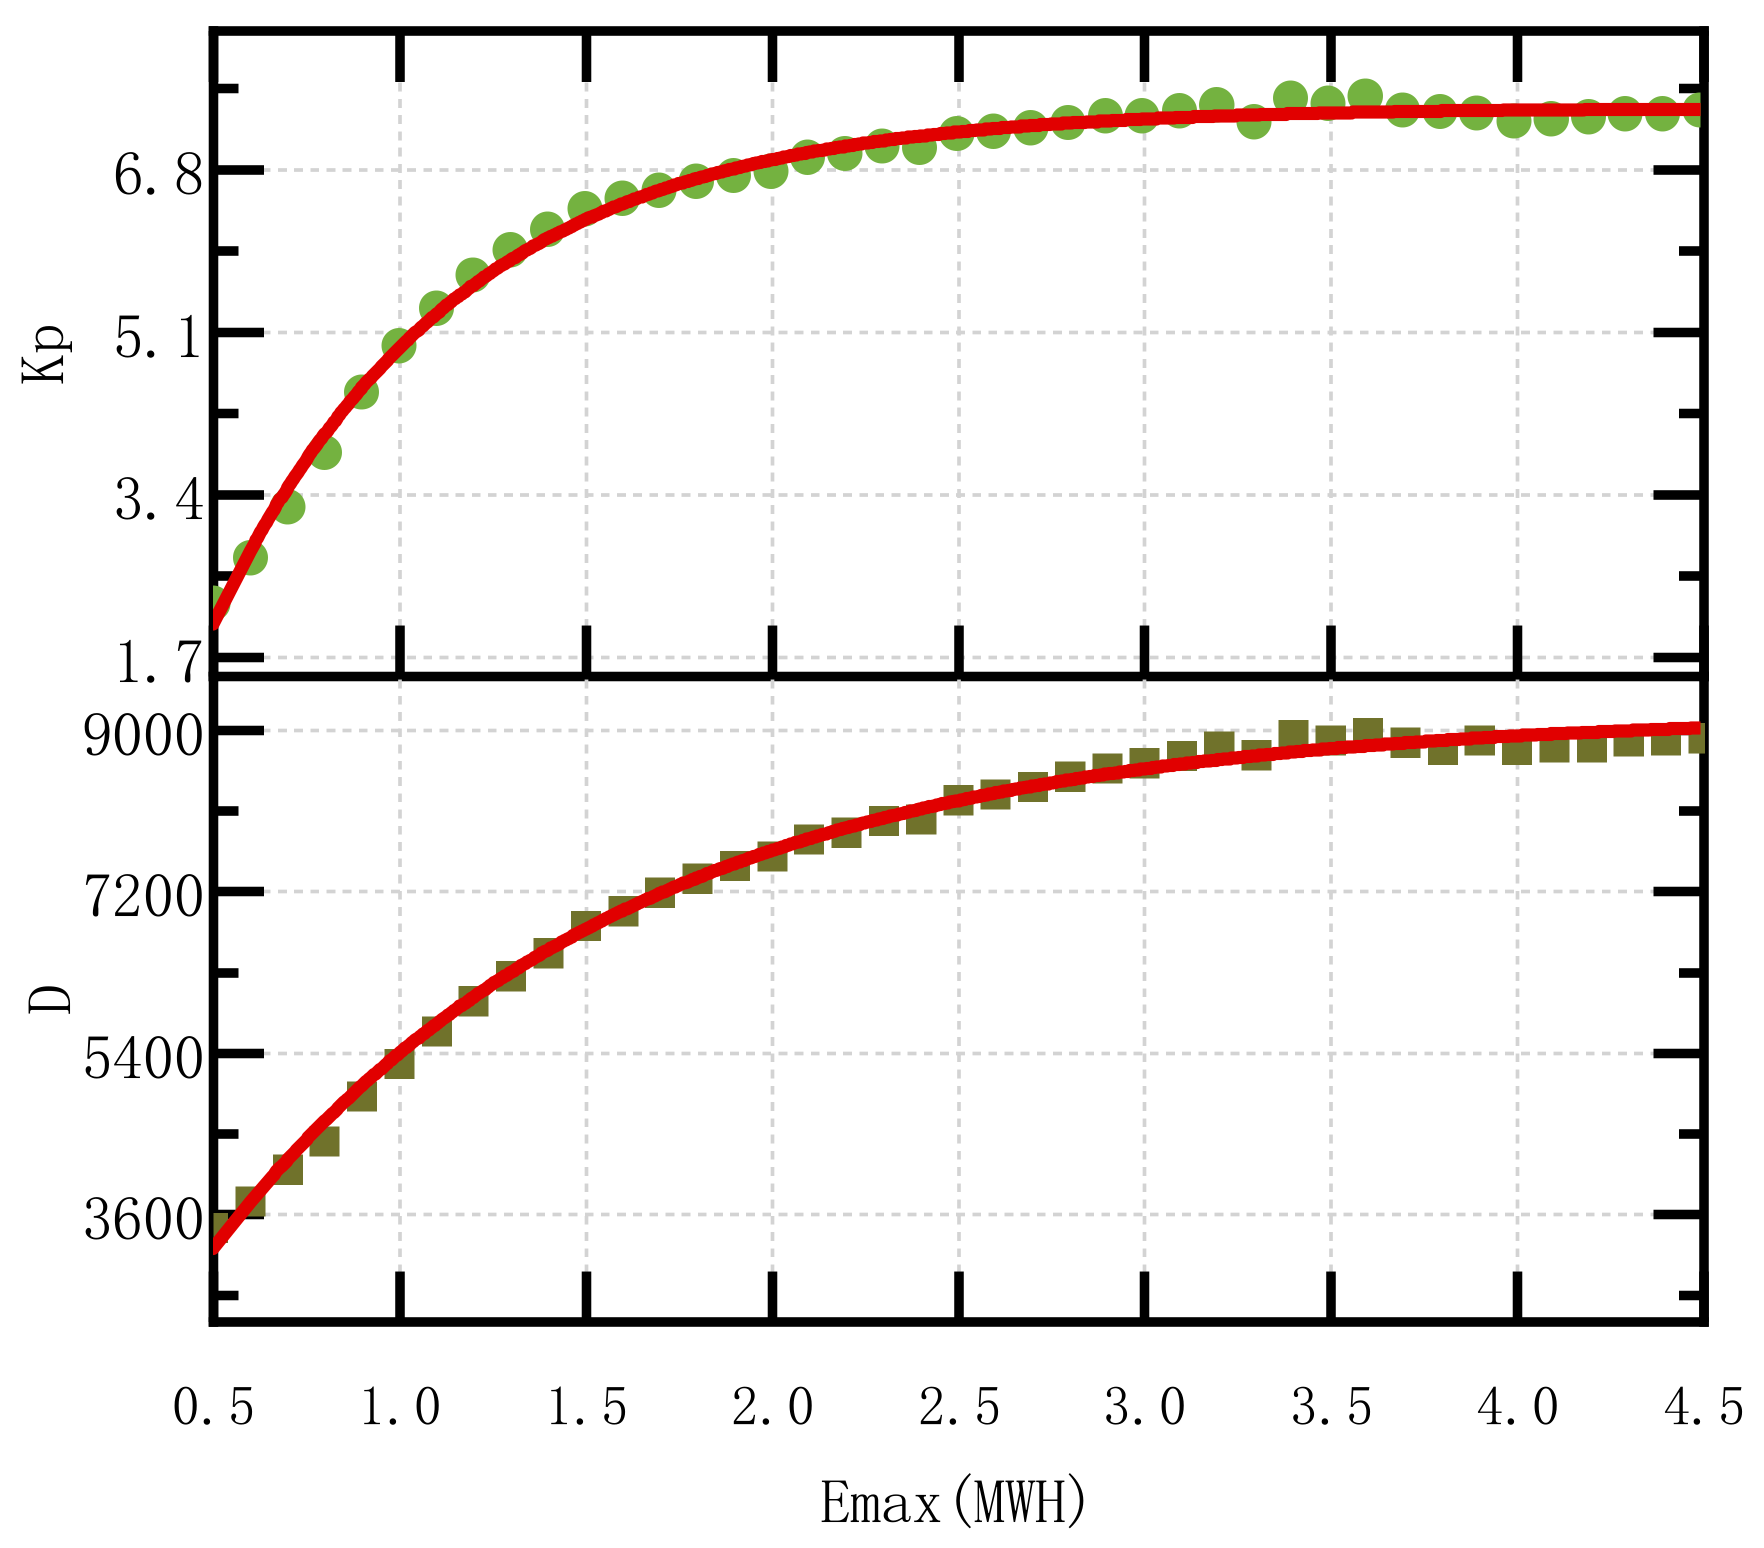
5.2.1. Energy of the ESS

The daily average value of units without ESS is as follows: K1 = 0.76, K2 = 1.19, K3 = 1.03, and Kp = 1.42. According to the analysis showed in Figure 9a, the maximum power output requirement is 21 MW. However, output requirement in the range from 0 to 12 MW is as high as 95.6%. This means that the 12 MW ESS will meet most of the day’s regulation needs. From Figure 9b, it is seen that most of the energy requirements in AGC ancillary services are less than 100 kWh and the portion of (0,200] kWh accounts for 97% of the day. However, the energy of ESS cannot be too small, which avoids configuring the battery capacity so small that the energy storage performance will not meet the requirements. Furthermore, due to fluctuations in the power system load, EMS requires units ramping continuously, resulting in continuous charging or discharging of the ESS.
On the other hand, too much energy will lead to an increase in initial investment costs. The relationship between Kp, D, and energy of ESS is shown in Figure 10. As the energy of the ESS increases, Kp and D continue to increase, but the ramping rate gradually slows down. When the energy of the ESS is too large, the advantages of this strategy will not so remarkable. In summary, a better energy configuration can be obtained through simulation.

5.2.2. Simulation Parameter

The costs and benefits used in this paper are based on relevant policies and our research in the Chinese electricity market. All the simulation parameters are shown in Table 1.

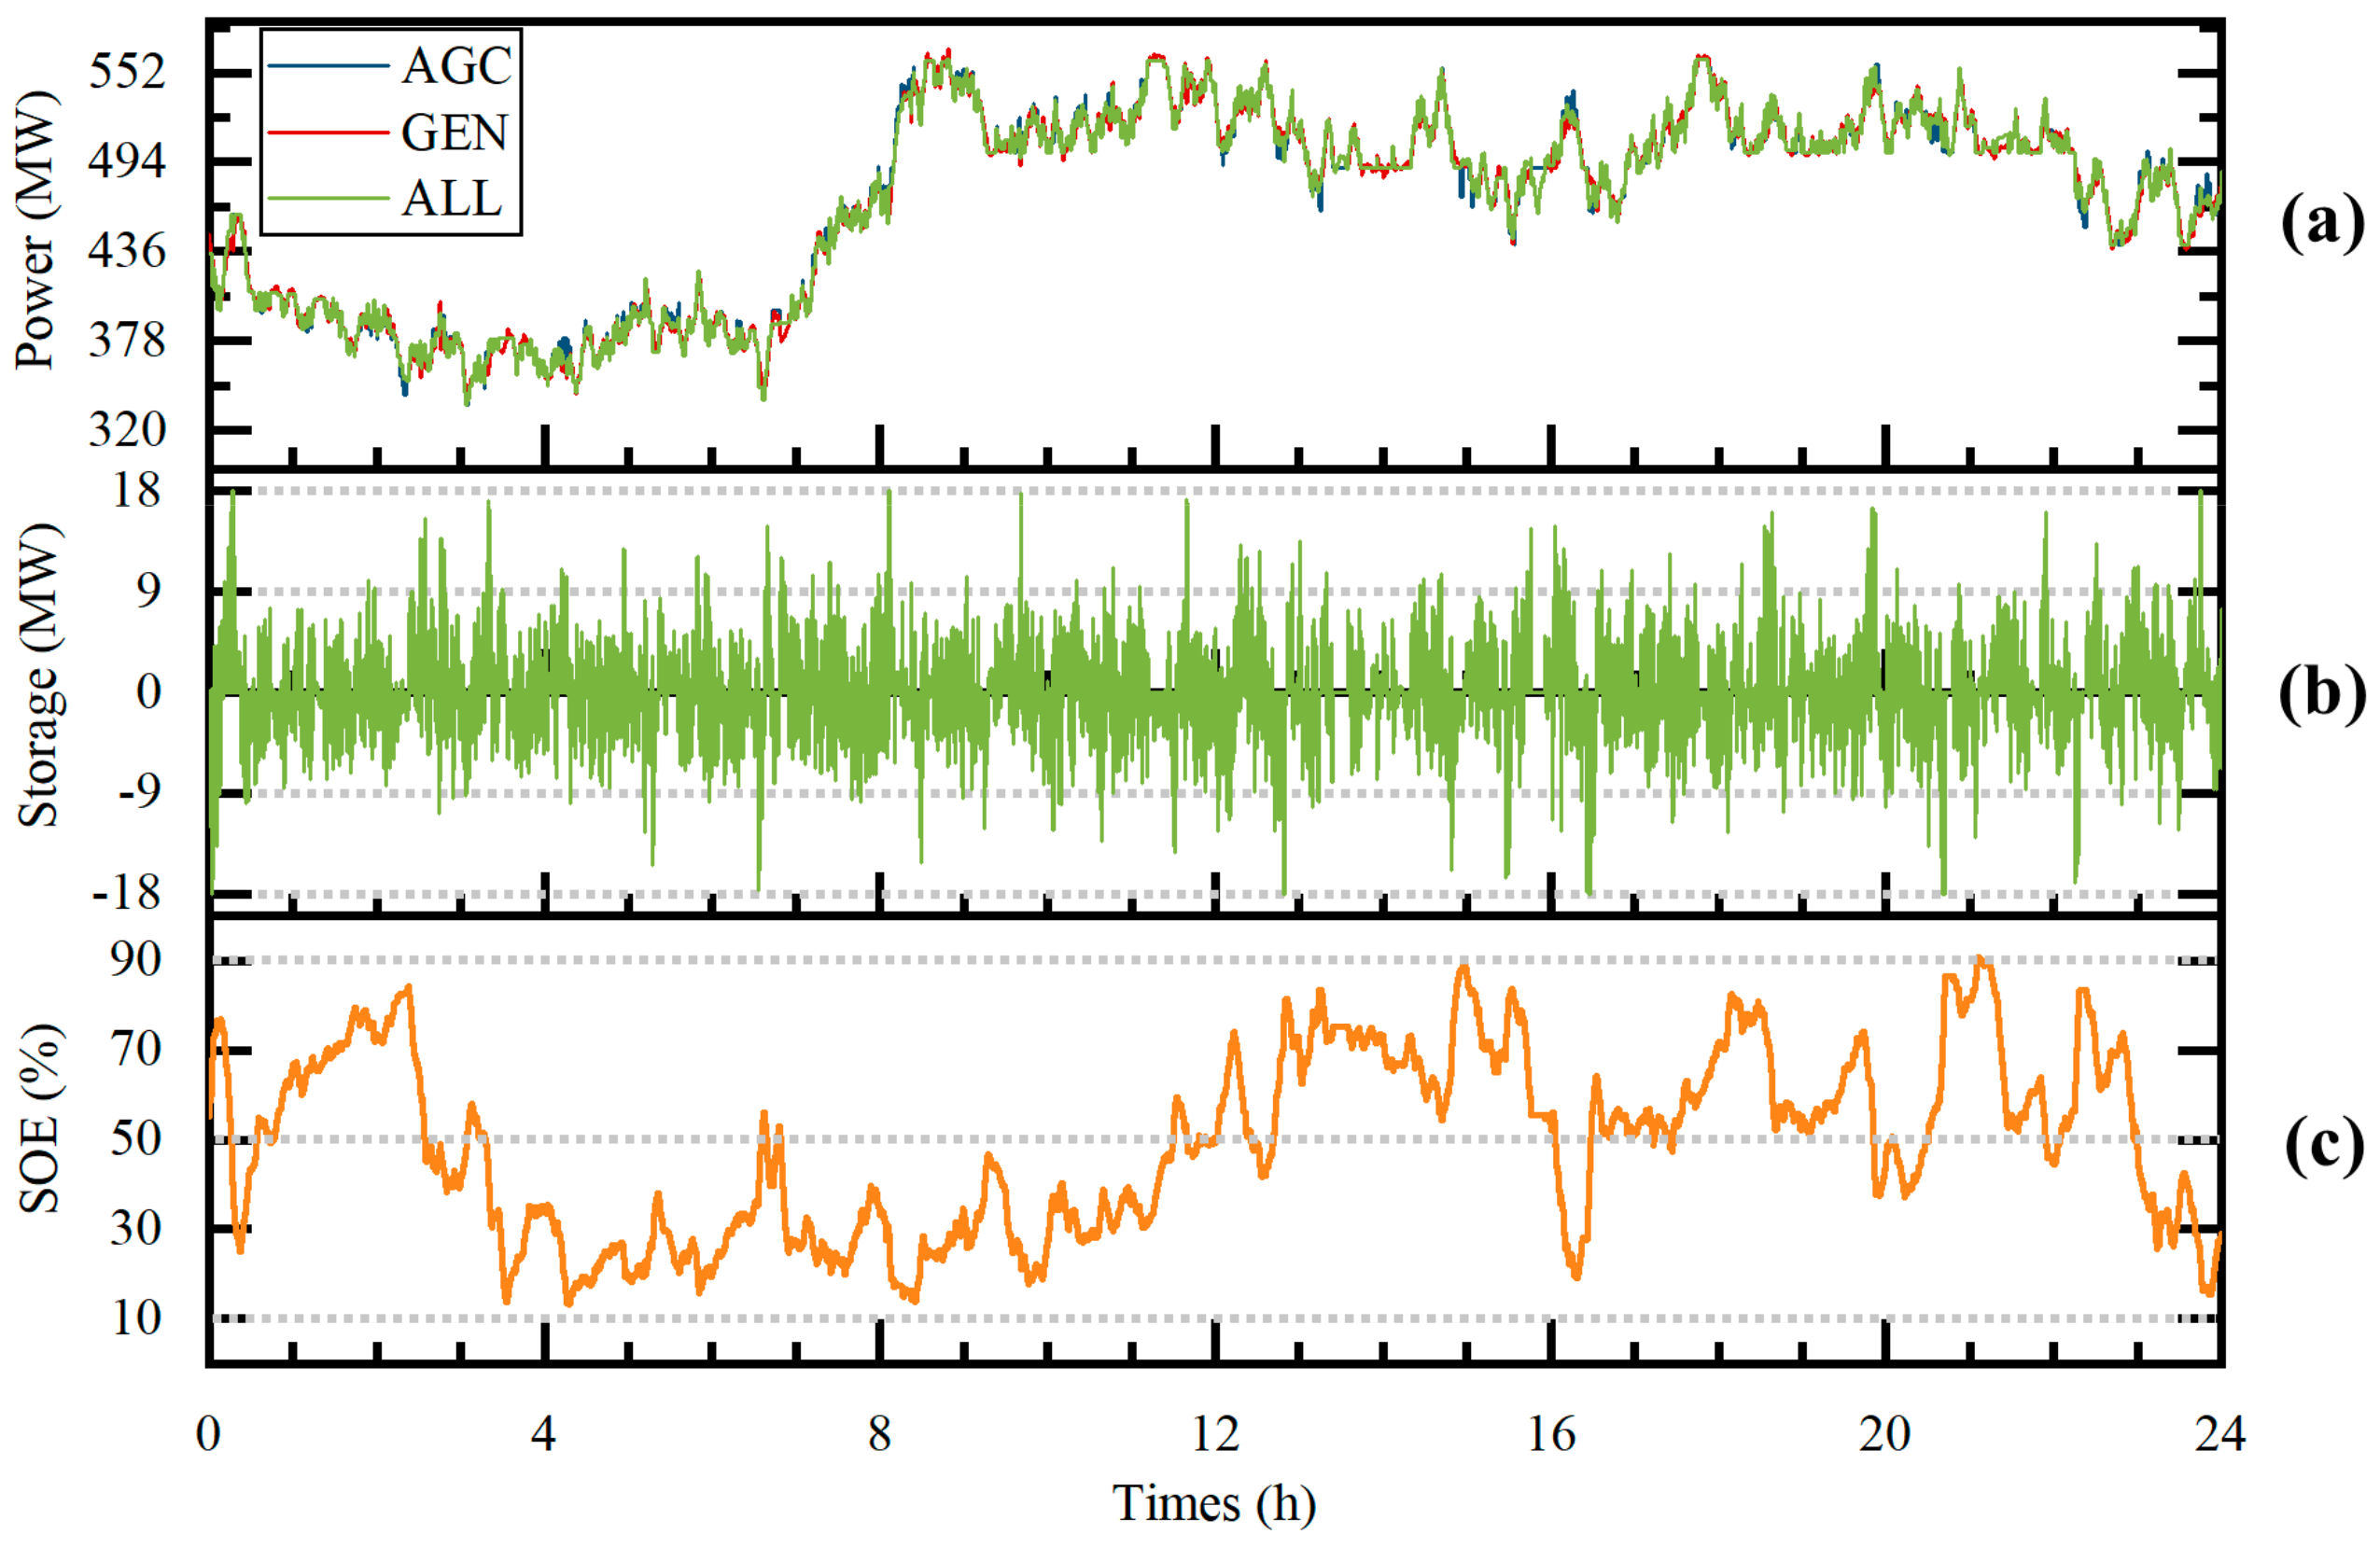
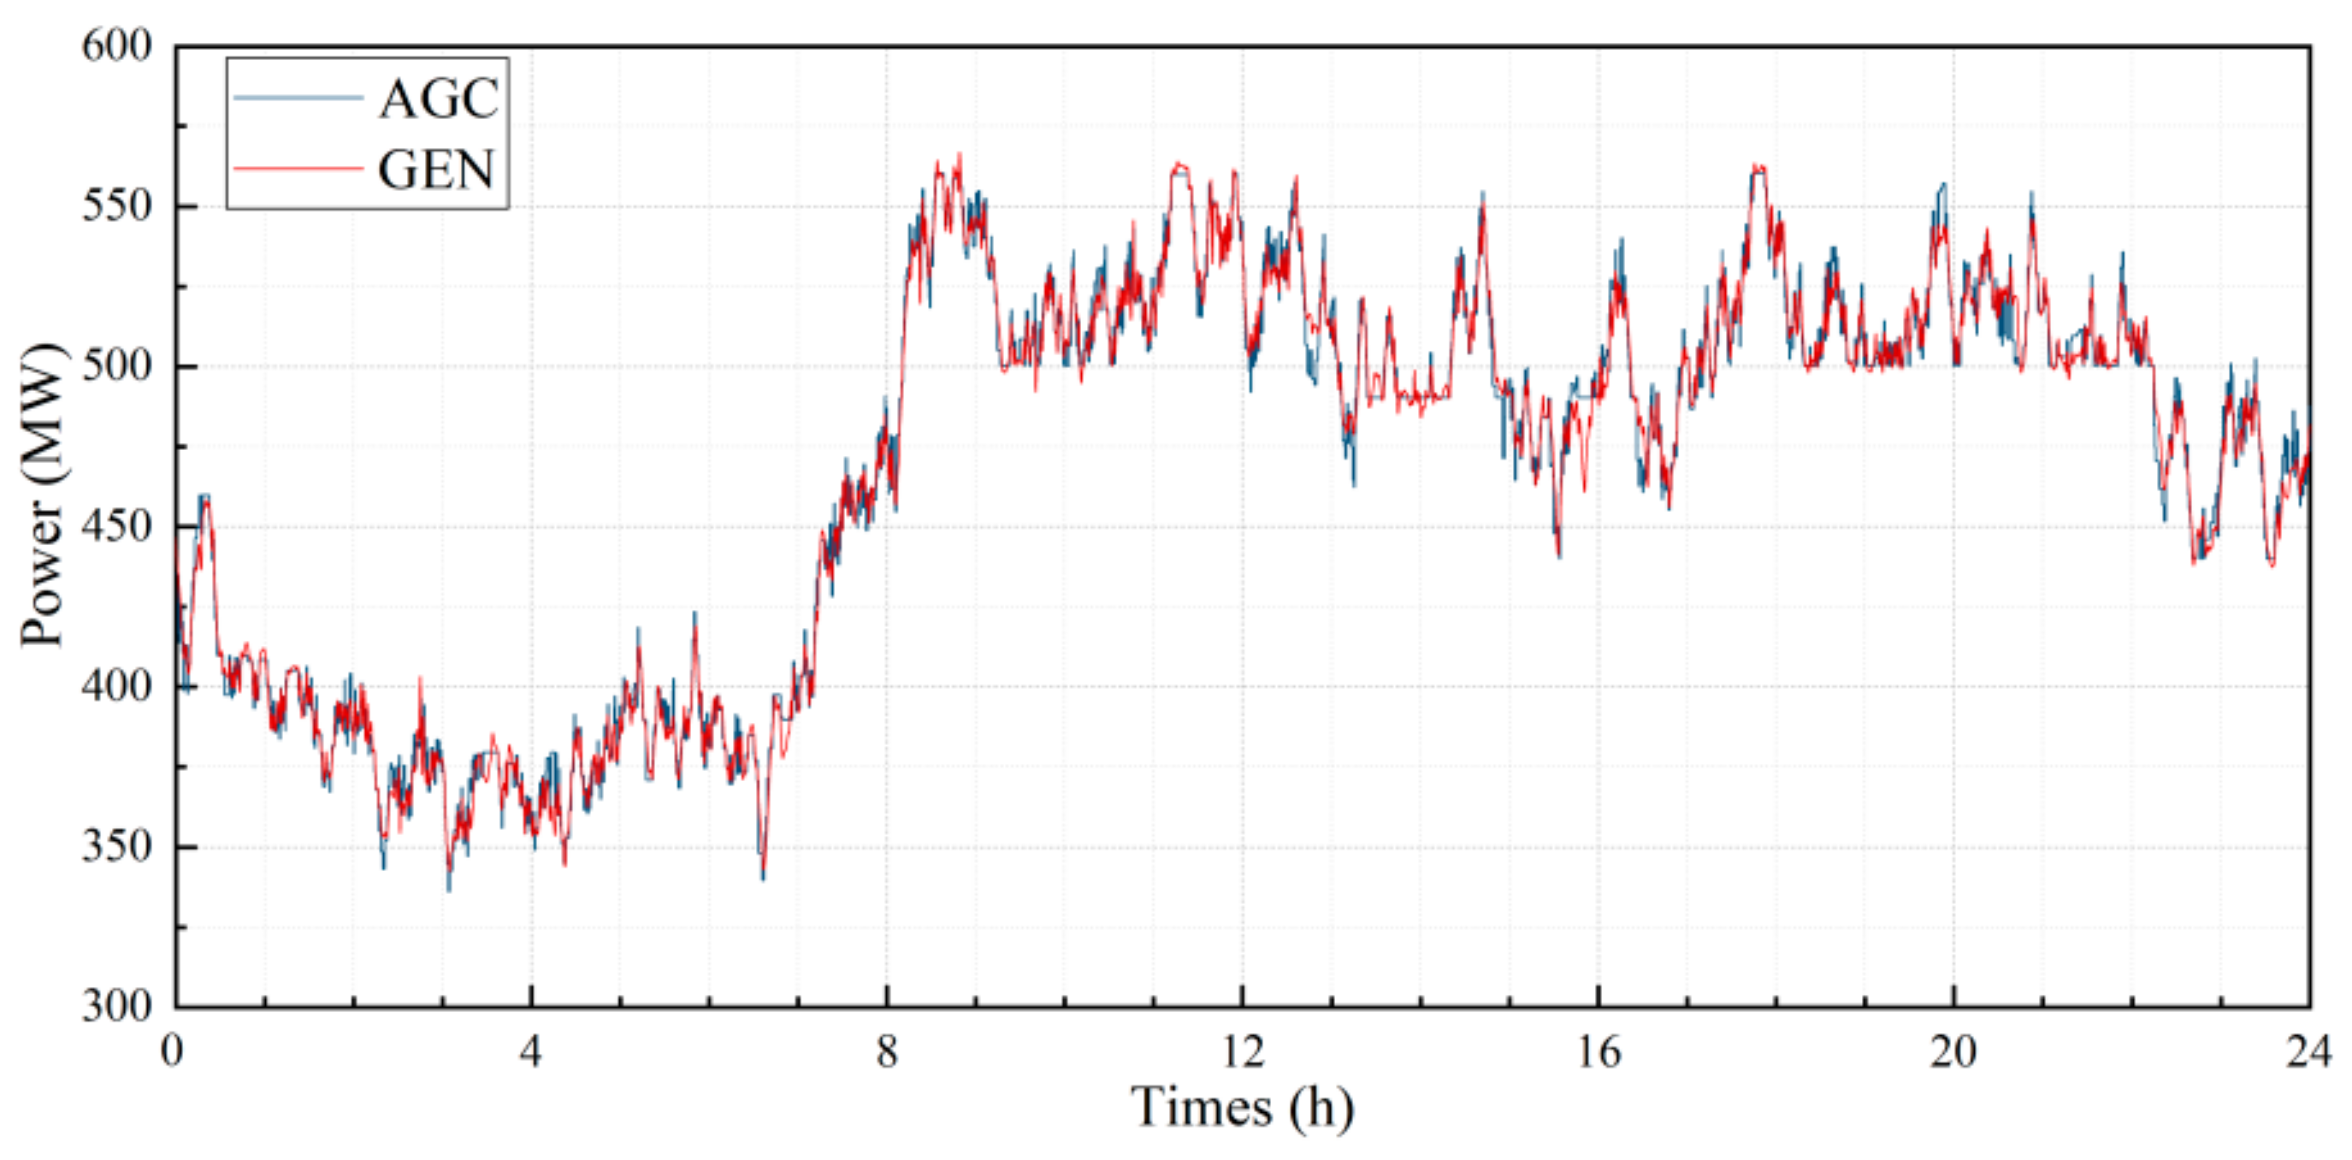
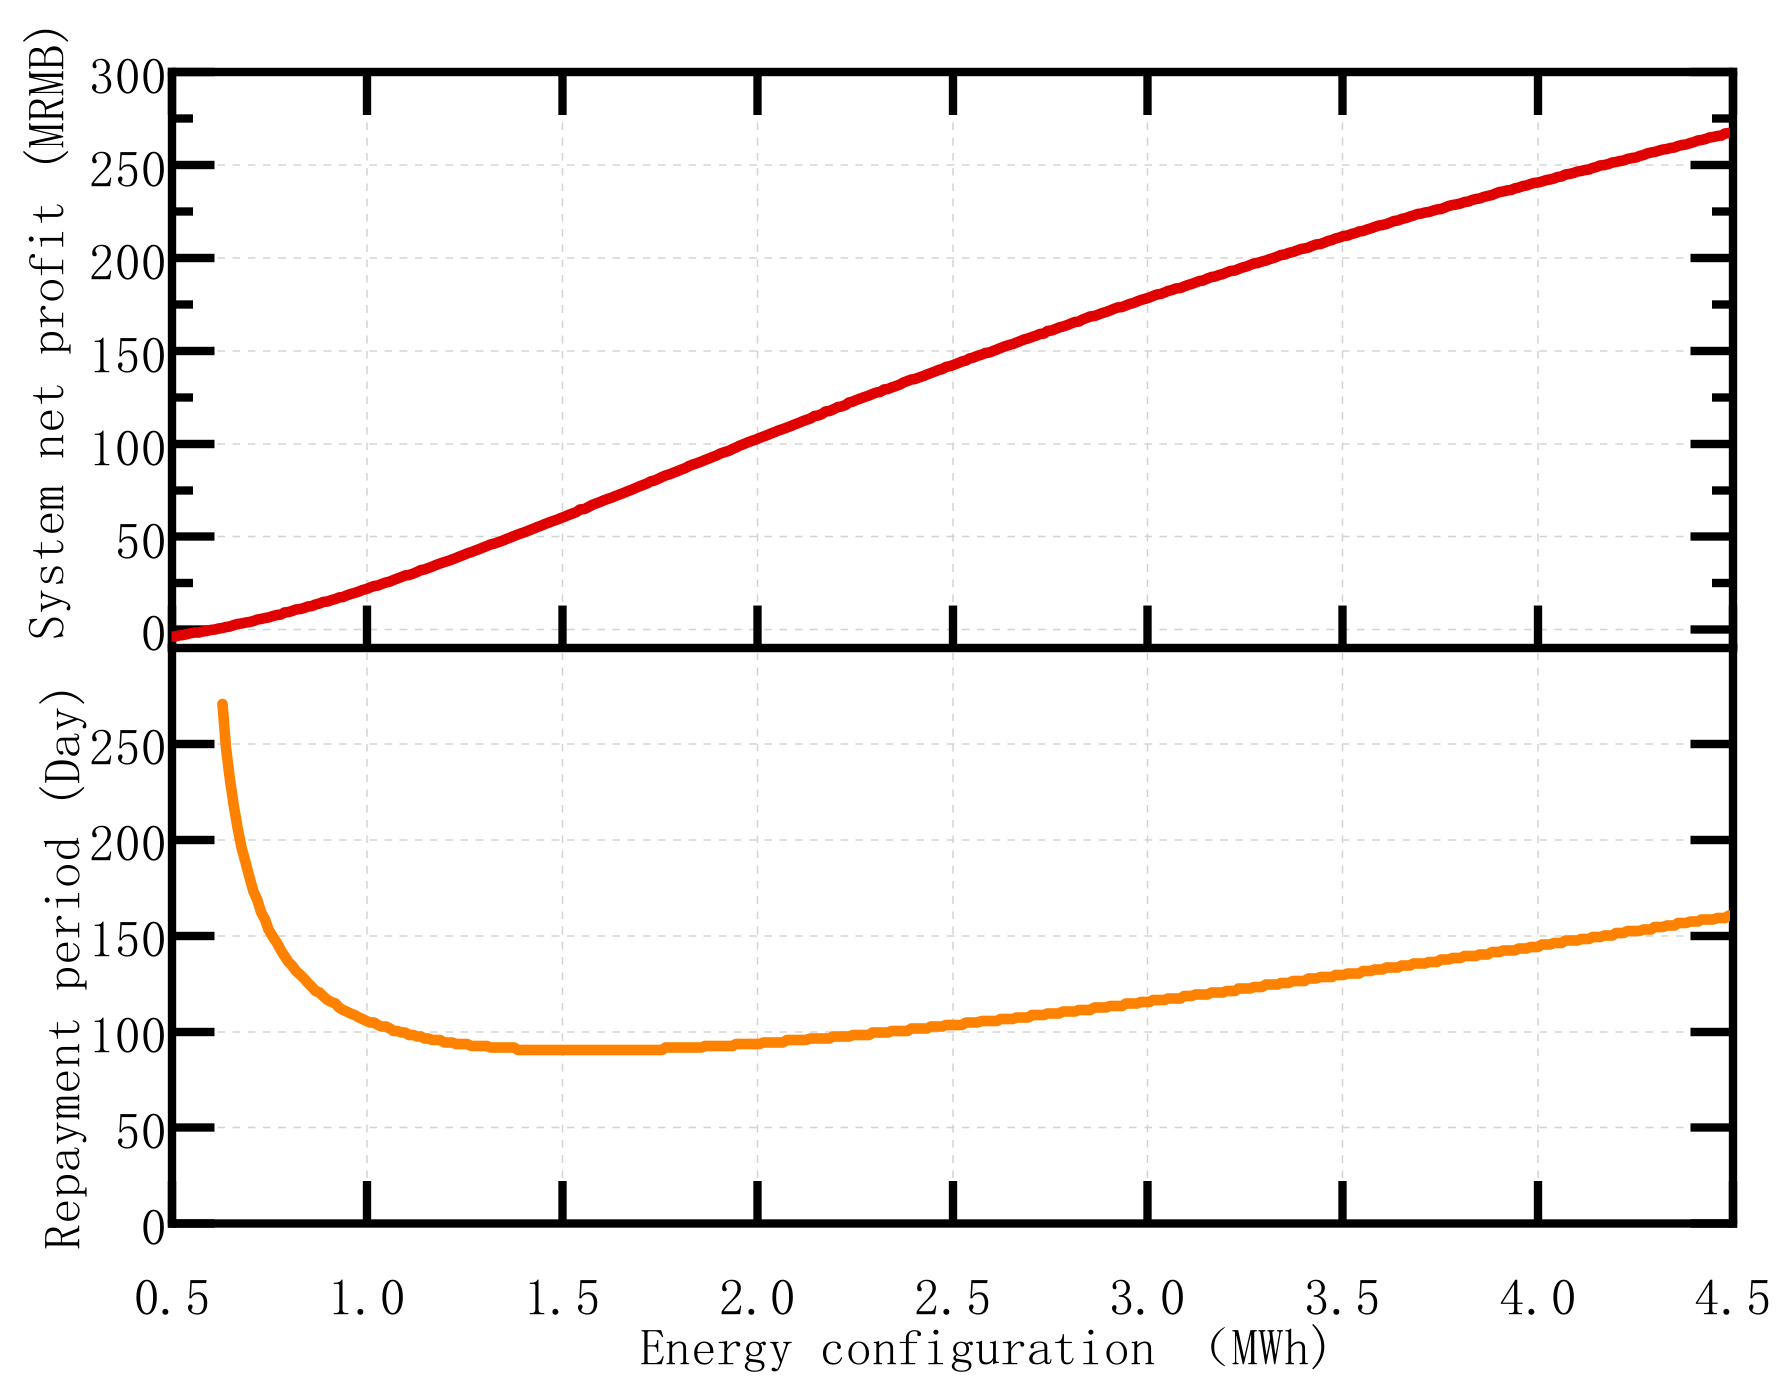
5.2.3. Result of the Simulation

As battery technology is rapidly developing, costs of batteries are reducing significantly. Therefore, the repayment period of the ESS should be minimized to get more profit. The relationships between system net profit, repayment period, and energy configuration are shown in Figure 11. According to the simulation results, the repayment period of ESS is 93 days when the ESS energy is configured between 1.4 MWh and 1.75 MWh. For the thermal power unit, the shortest payback period and the largest net profit can be achieved when the energy of ESS is 1.75 MWh which is the optimal decision.
Figure 12 shows the effect of ESS’s addition to the difference between the AGC command and the output of the unit. Although there is still some difference between the actual outputs of the system and the AGC command when the requirement is too large, the ESS satisfies most of the requirement.
The economic indicator of ESS is shown in the Table 2. The initial investment of ESS is 20.13 million RMB. Its life expectancy is 541 days while participating in the ancillary service 24 h a day. The average daily income is 199,900 RMB, and the net profit for the whole life cycle is 79.79 million RMB.

6. Conclusions

This paper is aimed at the control strategies and economic analysis of LTO energy storage system assisting the thermal power unit to participate in the AGC ancillary service. Firstly, according to the AGC policy of North China grid, the specific calculation method for regulation performance index (Kp) is proposed. Then the SOE-based charging and discharging strategies are developed according to the characteristics of the LTO battery, which ensures that the system runs around 50% SOE as much as possible to avoid over charging or over discharging and increase its availability. In the end, the unit’s self-regulating benefits were excluded that is different from other researches, and this paper establishes an economic model of the energy storage system to achieve the shortest payback period. The case study proves that the Kp has increased from 1.42 to 6.38, the depth of regulation has increased from 2857 to 6895.29 MW, and the net income per day has increased from 20,200 to 199,900 RMB with the help of the 1 MW/1.75 MWh ESS. The payback period of the project is 93 days, which means that the cost can be recovered in 93 days. It only accounts for 17.19% of the life expectancy of 541 days.

Author Contributions

Conceptualization, B.S. and W.Z.; Investigation, X.S. and Z.Z.; Project administration, M.G.; Validation, Y.Y.; Writing—original draft, Y.L.; Writing—review & editing, X.H. and W.G. All authors have read and agreed to the published version of the manuscript.

Funding

This research was funded by the National Natural Science Foundation of China (Grant No. 51907005, U1664255) and the 111 project (Grant No. B14005).

Conflicts of Interest

The authors declare no conflict of interest.

Nomenclature

SymbolMeaning
IdayDaily income of the unit in AGC ancillary services
YAGCService price of AGC market
DdayDaily regulation depth
KpIndex of regulation performance
PdisOutput power of ESS
ηPCSConversion efficiency of PCS and isolation transformer
PaAGC command
PgOutput power of the unit
tii-th AGC regulation
Pd1Threshold of effective regulation rate
CALLESS costs
CINTInitial investment cost
COMMaintenance cost
CBATBattery module cost
CCEEnergy conversion equipment cost
CAEAncillary equipment cost
CCCConstruction cost
UBATUnit price of battery module cost
ENRated energy of ESS
UCEUnit price of energy conversion equipment
PNRated power of ESS
UAEUnit price of ancillary equipment
UCCUnit price of construction
UOMUnit price of maintenance
EMAXMaximum available energy of ESS
IAGCIncome of ESS
IALLIncome of AGC system (ESS and units)
IGENIncome of units
Kp,GENIndex of regulation performance without ESS
DGENRegulation depth without ESS
IAGC, yearAnnual income of ESS
CcycleEffective days of ESS in the year
ElifeEnergy throughput in Total Life Cycle of ESS
NcycleCycles in Total Life Cycle of ESS
Rcut-offThe ratio of the maximum available capacity to the rated capacity at the end of the cycle life
EiaddEnergy throughput of ESS at day i
tcut-offBattery cycle life
EtMAXMaximum available energy at day t of ESS
Pnetlife cycle net profit of ESS

References

  1. Sher, F.; Kawai, A.; Güleç, F.; Sadiq, H. Sustainable energy saving alternatives in small buildings. Sustain. Energy Technol. Assess. 2019, 32, 92–99. [Google Scholar] [CrossRef]
  2. Cuce, E.; Nachan, Z.; Cuce, P.M.; Sher, F.; Neighbour, G.B. Strategies for ideal indoor environments towards low/zero carbon buildings through a biomimetic approach. Int. J. Ambient Energy 2019, 40, 86–95. [Google Scholar] [CrossRef]
  3. Cuce, E.; Sher, F.; Sadiq, H.; Cuce, P.M.; Guclu, T.; Besir, A.B. Sustainable ventilation strategies in buildings: CFD research. Sustain. Energy Technol. Assess. 2019, 36, 100540. [Google Scholar] [CrossRef]
  4. Daneshazarian, R.; Cuce, E.; Cuce, P.M.; Sher, F. Concentrating photovoltaic thermal (CPVT) collectors and systems: Theory, performance assessment and applications. Renew. Sustain. Energy Rev. 2018, 81, 473–492. [Google Scholar] [CrossRef]
  5. Miao, F.; Tang, X.; Qi, Z. Fluctuation feature extraction of wind power. In Proceedings of the 2012 IEEE Innovative Smart Grid Technologies, Tianjin, China, 21–24 May 2012; pp. 1–5. [Google Scholar]
  6. Datta, M.; Senjyu, T. Fuzzy control of distributed PV inverters/energy storage systems/electric vehicles for frequency regulation in a large power system. IEEE Trans. Smart Grid 2013, 4, 479–488. [Google Scholar] [CrossRef]
  7. Junwei, D.; Yu, S.; Yonghao, H.; Yuanjing, M.; Jincheng, S.; Qing, X.; Chongqing, K. Competition models for automatic generation control in deregulated power systems. J. Tsinghua Univ. Sci. Technol. 2003, 9, 1191–1194. [Google Scholar]
  8. Xinran, L.; Jiyuan, H.; Yuanyang, C.; Weijian, L. Review on large-scale involvement of energy storage in power grid fast frequency regulation. Power Syst. Prot. Control 2016, 44, 145–153. [Google Scholar]
  9. Yangtian, N. Research on Energy Storage System Dispatch Model Based on Peak Load Shift. Master’s Thesis, North China Electric Power University, Beijing, China, 2015. [Google Scholar]
  10. Zechun, H.; Rui, X.; Linlin, W.; Hui, L. Joint Operation Optimization of Wind-Storage Union with Energy Storage Participating Frequency Regulation. Power Syst. Technol. 2016, 40, 2251–2257. [Google Scholar]
  11. Leitermann, O. Energy Storage for Frequency Regulation on the Electric Grid. Ph. D. Thesis, Massachusetts Institute of Technology, Cambridge, MA, USA, 2012. [Google Scholar]
  12. Xie, X.; Guo, Y.; Wang, B.; Dong, Y.; Mou, L.; Xue, F. Improving AGC performance of coal-fueled thermal generators using multi-MW scale BESS: A practical application. IEEE Trans. Smart Grid 2018, 9, 1769–1777. [Google Scholar] [CrossRef]
  13. Zhongwei, S.; Guoliang, L.; Wenwei, L. Research and Application of BESS-aided Thermal Power Frequency-regulation Technology. Shanxi Electr. Power 2017, 6, 62–66. [Google Scholar]
  14. Cheng, Y.; Tabrizi, M.; Sahni, M.; Povedano, A.; Nichols, D. Dynamic available AGC based approach for enhancing utility scale energy storage performance. IEEE Trans. Smart Grid 2014, 5, 1070–1078. [Google Scholar] [CrossRef]
  15. Stroe, D.I.; Knap, V.; Swierczynski, M.; Stroe, A.I.; Teodorescu, R. Operation of a grid-connected lithium-ion battery energy storage system for primary frequency regulation: A battery lifetime perspective. IEEE Trans. Ind. Appl. 2017, 53, 430–438. [Google Scholar] [CrossRef]
  16. Zechun, H.; Xu, X.; Fang, Z.; Jing, Z.; Yonghua, S. Research on Automatic Generation Control Strategy Incorporating Energy Storage Resources. Proc. CSEE 2014, 34, 5080–5087. [Google Scholar]
  17. Lijuan, C.; Yuxuan, J.; Chun, W. Strategy and capacity of energy storage for improving AGC performance of power plant. Electr. Power Autom. Equip. 2017, 37, 52–59. [Google Scholar]
  18. Yang, N.; Feng, Z.; Hui, Z.; Jun, L.; Libin, Y.; Guanghui, S. Optimal Control Strategy and Capacity Pianning of Hybrid Energy Storage System for Improving AGC Performance of Thermal Power Units. Autom. Electr. Power Syst. 2016, 40, 38–45. [Google Scholar]
  19. Swierczynski, M.; Stroe, D.I.; Stan, A.I.; Teodorescu, R.; Sauer, D.U. Selection and performance-degradation modeling of limo2/li 4ti5o12 and lifepo4/c battery cells as suitable energy storage systems for grid integration with wind power plants: An example for the primary frequency regulation service. IEEE Trans. Sustain. Energy 2014, 5, 90–101. [Google Scholar] [CrossRef]
  20. Krishnan, V.; Das, T.; McCalley, J.D. Impact of short-term storage on frequency response under increasing wind penetration. J. Power Sources 2014, 257, 111–119. [Google Scholar] [CrossRef]
  21. Hu, J.; He, Y.; Xu, L.; Williams, B.W. Improved control of DFIG systems during network unbalance using PI-R current regulators. IEEE Trans. Ind. Electron. 2009, 56, 439–451. [Google Scholar] [CrossRef]
  22. Sun, J. Impedance-based stability criterion for grid-connected inverters. IEEE Trans. Power Electron. 2011, 26, 3075–3078. [Google Scholar] [CrossRef]
  23. Jie, D.; Seuss, J.; Suneja, L.; Harley, R.G. SoC feedback control for wind and ess hybrid power system frequency regulation. IEEE J. Emerg. Sel. Top. Power Electron. 2014, 2, 79–86. [Google Scholar]
Figure 1. The setting point control process of automatic generation control (AGC) generator.
Energies 13 00505 g001
Figure 2. The energy storage system (ESS) participates in AGC ancillary service.
Energies 13 00505 g002
Figure 3. The curve of (a) State of Charge (SOC)–open circuit voltage (OCV) and (b) SOC–state of energy (SOE).
Energies 13 00505 g003
Figure 4. Strategy of charging and discharging.
Energies 13 00505 g004
Figure 5. The strategy of ESS when the thermal power unit is in reverse.
Energies 13 00505 g005
Figure 6. The Negative Strategy of ESS.
Energies 13 00505 g006
Figure 7. The simulation results of the 3 MWh energy storage system: (a) Power, (b) Storage, and (c) SOE.
Energies 13 00505 g007
Figure 8. The generator follows the AGC instruction curve for 24 h.
Energies 13 00505 g008
Figure 9. Analysis of output deviation and regulating energy (a) The output deviation between AGC command and units (MW) (b) Energy required for each regulation (kWh).
Energies 13 00505 g009
Figure 10. The relationship between Kp, D, and energy of ESS.
Energies 13 00505 g010
Figure 11. The relationships between system net profit, repayment period, and energy configuration.
Energies 13 00505 g011
Figure 12. Data perspective of the output difference: (a) difference of power without ESS and output power of ESS and (b) difference of power without ESS and difference of power with ESS.
Energies 13 00505 g012
Table 1. Simulation parameter.
ParameterUnitValue
Battery module costRMB/Wh7
Energy conversion equipment costMRMB/MW0.5
Ancillary equipment costMRMB/MWh1
Construction costMRMB/MWh0.5
Operating costMRMB/MWh0.1
Ancillary service incomeRMB/MW5
Discount rate-6%
Efficiency of battery-96%
Efficiency of energy conversion equipment-93%
Life cycle numberCycle15,000
Capacity ratio of retirement battery-80%
Depth of discharge-80%
Running days per yearDay330
Table 2. The indicator of 10.5 MW/1.75 MWh BESS (Battery Energy Storage System).
IndicatorsUnitValue
Rated powerMW10.50
Rated energyMWh1.75
Initial investmentMRMB20.13
Average daily incomeRMB199,900
Net profit for the whole life cycleMRMB79.79
Payback periodDay93
Life expectancyDay541

