Abstract
The electric power sector in countries suffering from crises and wars such as Syria, Iraq, Yemen, Libya, etc., is among the most affected infrastructures. Since this sector plays a vital role in the economic growth and in improving people’s quality of life, the post-crisis reconstruction of this sector must take into account the requirements and concepts of sustainable development (SD) in addition to technical and economic considerations. This article discusses the role that renewable energy sources (RES) can play in achieving SD in the post-crisis reconstruction phase of the Syrian Electric Power Sector (SEPS) as a case study. Based on the available data, the study period was chosen from 2005 to 2017 and divided into two periods. In the first period (2005–2010), which is the pre-crisis period, the structure of the SEPS and its main characteristics were described while the adoption of RES solutions and SD concepts were investigated. In the second period (2011–2017), the crisis period, the satiation of the SEPS and impact of the crisis were evaluated. The challenges that faced the adoption of SD concepts and RES solution were also addressed at this stage. Based on analysis and comparison of the available data, several scenarios were discussed to evaluate the role of RES in achieving SD in the post-crisis reconstruction phase of the SEPS. EnergyPLAN software was used for the techno and socio-economic evaluation of these scenarios. Our results emphasize the importance of the adoption of RES solutions in the reconstruction phase, as these can help promote SD concepts (reducing greenhouse gas emissions, protecting the environment, increasing energy efficiency, creating jobs, etc.) and securing the electric supply of the SEPS while enhancing its stability.
1. Introduction
There is no doubt that the electric power sector, in any country, contributes significantly to the country’s development (from a socio-economic point of view), adding to the improvement of the people’s lives, and raising the welfare level. The operational principle of this sector depends on converting traditional primary available energy sources such as fossil fuels (natural gas, oil, etc.) into electricity, by burning them. However, this process results in gas emissions that are harmful to both the environment and health. In addition, the limitation of the available fossil fuel sources and their unsustainable exploitation are among the biggest challenges facing the development of this sector. The world has been alerted early, with the emergence of the global warming phenomenon, to the necessity of adopting sustainable development (SD) concepts in the planning, operating, and development of this sector. SD has been defined thus: “Humanity has the ability to make development sustainable to ensure that it meets the needs of the present without compromising the ability of future generations to meet their own needs” [1]. In other words, SD can be thought of as a development (which includes social, environmental, and economic considerations) that lasts to enhance the welfare of current generations without bringing about a decline in the welfare of future generations. Several international conferences (The Earth Summit-1992, The Millennium Summit-2000, WSSD-2002, Rio+20-2012, 2030 The Agenda for Sustainable Development-2015, etc.) have been held under the auspices of the United Nations (UN) to promote SD concepts and goals [2]. At these conferences, based on decades of work by different countries and the UN, the Sustainable Development Goals (SDGs) were formulated, modified and developed, and international, regional and local plans and programs were adopted to implement and realize these goals. The 7th Goal of the SDGs is defined as to “ensure access to affordable, reliable, sustainable, and modern energy for all” [2]. Worldwide, renewable energy sources (RES) such as wind, solar, biomass, etc. with their great advantages (sustainability, environmentally friendly, etc.) are among the most globally supported effective solutions to achieve development in the electric power sector according to SDGs requirements. Many countries worldwide have made great strides in this area and the culture of RESs has become tangible on the ground [3]. If this is the case for countries that are politically and security-stable, then it is rather for countries that suffer from wars, conflicts and crises such as Syria, Iraq, Yemen, Libya, etc., to adopt RES solutions in the post-crisis reconstruction phase of their electric power sectors, especially, if we know that the electric power sector in such countries has been among the most affected infrastructure sectors. The post-crisis/conflict reconstruction of this sector requires creative solutions that take into account, not only consideration of the technical and economical standards, but also the SDGs. Therefore, the adoption of such solutions requires amending existing legislation and creating and drafting new legislation and policy frameworks that allow reliance on RESs as an effective part of the electric power system.
Many articles have been published in the open literature, regarding the policy frameworks, legislation, and sustainability issues of RES solutions. Our literature review is focused on these three issues as to how what has already been done in this area. Reference [4] investigated the state support policy of promoting RES development in Ukraine’s household sector and analyzed the impact of this policy in encouraging electricity generation from RES and deployment of small RE plants as well. The results of this work indicated that the adopted policy has some shortcomings that should be eliminated.
To enhance policy decision-making, the work in [5] used three sustainability pillars in SADC countries to assess the progress of the electric sector sustainability. The results obtained in this assessment can significantly contribute in offering guidance in policymaking.
To establish a rational development of Ghana’s RES, reference [6], mentioned that the energy sector in Ghana has initiated several electrification and RES development programs to assess the availability, technical-feasibility, cost-effectiveness, and efficient-production of RES which can help the national-decision-making and policy framework formulation.
The authors in [7] evaluated the PV power production from the generation point of view and its limitations in the market of Brazil. The main challenge that the case study faced is the need for clear legislation regarding the power generation model.
Reference [8] proposed a scientific framework for promoting the 7th SD Goal, designing, and delivering a full functional eco-system to optimize the electric supply chain. The model was expected to support the decision makers in their work of finding renewable alternatives in the electric supply chain. Reference [9], investigated the role of RES in achieving SD in French Guiana by identifying the difficulties that restrict the spread of RES use and proposing recommendations for SD realization. The current energy profile in Rwanda was discussed in [10]; the discussion focused on the status of the electric energy system to assess the availability of power generation and to identify the needs of the country so as to integrate the most efficient renewable energy generation scenario. Reference [11], explored the need for delivering the appropriate amount of energy, with the emphasis on the contribution of indigenous people in developing their future needs. The author studied the sustainability of Togo RE by employing qualitative and quantitative research.
Reference [12] proposed a new sustainable business model of RE with a 100% rural electrification target at the end consumer in Perú. The authors of reference [13] developed a sustainable framework based on innovative energy investment to select the best viable economic option. Reference [14] presented the results of the sustainability indicators assessment of RE systems. In order to investigate the feasibility of the current and future situations of the RES in Pakistan, the authors in [15] performed a SWOT (Strengths, Weaknesses, Opportunities, and Threats) analysis. Reference [16] illustrated the relationship between the RES and rural development in the context of current trends in energy transition. The analysis of the energy transition from centralized large power plants towards the distributed RES in Australia was presented in [17]. The authors studied the onshore PV and wind options in addition to the time series of coal and gas consumption. Aiming to increase the percentage of RES utilization share in the power generation mix by 2050, the authors in [18] studied three developed strategies (in-house). A 100% optimistic scenario and 50% practical scenario were proposed based on national policies.
The barriers to renewable energy development were identified and ranked in Ghana’s power mix as twenty-three barriers which included technical, economic and financial, social, political and regulatory, institutional, and geographical barriers in [19]. The authors in [20] investigated the RES consumption dynamic effects and the growth of the economy. The trade on the policy of environment degradation in US between 1985 and 2014 was also investigated. Reference [21] presented a roadmap of the SD in the South Korean energy system by developing some scenarios for the transitions from traditional to the RES system on both the supply and demand sides. The authors of reference [22] showed that understanding the behavior of energy systems, the implication of their policy, and the transformation from an unsustainable to sustainable system crucially depends on the so called “system thinking”. To help in achieving sustainable energy decision making, the study in [23] ranked seven technologies for electricity generation in Turkey based on their performance scores with regard to techno- economic, and socio-environmental criteria.
In order to face unexpected emergency situations, the authors of reference [24] developed and presented a strategic plan based on RES deployment (case study, Latakia city, Syria). Reference [25] presented an assessment strategy of the foreign investment in Iraq’s energy system based on a qualitative case study. A viewpoint about the post-conflict energy planning in the Middle East was presented in [26]. It was concluded that renewable energy systems have great potential to remedy the energy crisis post-conflict. The study in [27] presented a post conflict reconstruction strategy for the electricity and energy sector of Yemen.
From the conducted literature review, we can conclude the following:
- Policy framework and upgraded legislative and legal environment are key factors and a must to ease the construction and participation of RES as an essential part of the power system.
- The transition of electric power systems towards sustainable systems depends largely on a RES contribution.
- RES can play a significant role in the post-conflict reconstruction phase of energy systems.
Based on the fact that achieving the SDGs, adopted in the 2030 Agenda for Sustainable Development-2015, poses a real challenge to many countries in the world in normal situation, then this challenge becomes more acute and difficult when such countries suffer from crises, wars and conflicts where talking about SD concepts becomes a secondary matter in such circumstances. Therefore, this article comes as an attempt to investigate the importance of adopting SD concepts, especially in the conditions of wars, conflicts and crises, through the use of RES to re-construct the electric power sector which is one of the most important infrastructure sectors and the main driving engine for development and modernization in any country. The work starts with the analysis and assessment of the SEPS’s status, renewable energy implementation, and sustainable development realization in a specific study period (before and during the crisis) based on publicly available data. It, also, discusses a set of scenarios that simulate the use of RES in the SD of the post-crisis reconstruction phase of this sector. The main contributions of this article can be summarized as:
- -
- Providing a clear, accurate and comprehensive picture (to the greatest possible degree of accuracy) of the SEPS in the studied period in terms of the exact number of electric power generation stations, the installed capacity, the annual amount of electrical energy generated and the annual amount of electrical energy consumed.
- -
- Evaluating the realization of SD concepts in the SEPS during the study period.
- -
- Assessing the contribution of RES in the SEPS during the study period.
Investigating the role that RES can play in achieving SD of the SEPS in the post-crisis reconstruction phase.
2. Methodology
Methodology adopted in this work is based on:
- 1-
- Collecting, reviewing, analyzing, and comparing the publicly available SEPS’s data and information from different open-sources including the available statistical reports, studies, published articles, declarations of experts and politicians, etc. mainly from the following sources [28,29,30,31,32]:
- Ministry of Electricity (MOE), Syria;
- International Energy Agency (IEA);
- International Atomic Energy Agency (IAEA);
- Middle East and North Africa (MENA);
- Regional Center for Renewable Energy and Energy Efficiency (RCREEE), etc.
With the aim of providing:- A clear, complete, and comprehensive view of the SEPS structure and its characteristics before and during the crisis;
- An assessment of the extent to which sustainable development concepts have been adopted in this sector before and during the crisis;
- An assessment of the extent to which the applications of renewable energies has been realized in this sector before and during the crisis;
- 2-
- Investigating the role that RES can play in the SD of the post-crisis SEPS’ reconstruction phase up to 2030 through the discussion and evaluation of several scenarios using the EnergyPLAN software (free license) [33].
- Firstly, a reference year model (2010) was established and verified for accuracy.
- Secondly, four different scenarios were simulated, evaluated, and compared with the proposed optimal (technical-economic) scenario.
Results obtained from all simulations were then compiled and analyzed. Due to the fact that, there was no complete and comprehensive single data source publicly available, we have conducted a thorough and intensive process to collect, review, analyze and compare the data available from different sources. Because of the incompleteness and lack of data, the study period was limited to the period from 2005 until 2017. This period was divided into two periods, the first one from 2005 to 2010 (pre-crisis period) and the second one from 2011 to 2017 (crisis-phase). The following sections present our efforts to establish clear and comprehensive view of the SEPS’s structure and characteristics, as well as the adoption and realization of SD and RES in this sector. Figure 1 shows a summary of the adopted methodology in this work.
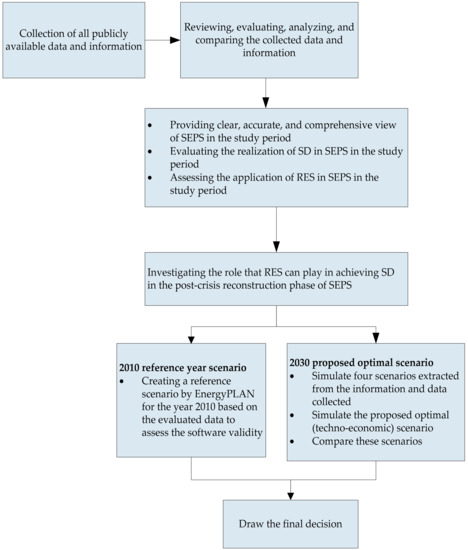
Figure 1.
Summary of the adopted methodology.
2.1. Syrian Electrical Power Sector (SEPS) Structure and Characteristics, Sustainable Development, and Renewable Energies
2.1.1. The Pre-Crisis Phase (2005–2010)
- A. SEPS sturcture and characteristics (2005–2010):
The Syrian Electrical Power Sector (SEPS) is composed of:
- Eleven generation stations (power plants) mainly operating on Heavy Fuel Oil (HFO) and Natural Gas (NG) depending on the availability of these resources and using steam, gas, and combined cycle technologies.
- A transmission network operating on high voltage levels: 400, 230 and 66 kV; and
- A distribution network operating on medium and low voltage levels: 20 and 0.4 kV (0.22 kV for single-phase).
The Ministry of Electricity (MOE) operates, controls, administrates, and manages the SEPS via the Public Establishment for Electricity Generation and Transmission (PEEGT) and the Public Establishment for the Distribution and Exploitation of Electrical Energy (PEDEE). PEEGT controls the generation and transmission of electricity (including 400 and 230 kV networks), producing 92% of the total electricity generated in 2010 (end of this study period). While the PEDEE is responsible for the sales and distribution sector (including 66, 20, 0.4, and 0.22 kV networks).
Table 1 shows the year of installation, installed capacity of the generation stations, and expansion capacity of the SEPS until 2010.

Table 1.
Year of installation, installed capacity, year of expansion, and expansion capacity of the SEPS’s generation stations until 2010.
Figure 2 shows the increasing trend of the installed generation capacity of SEPS between 2005 and 2010.
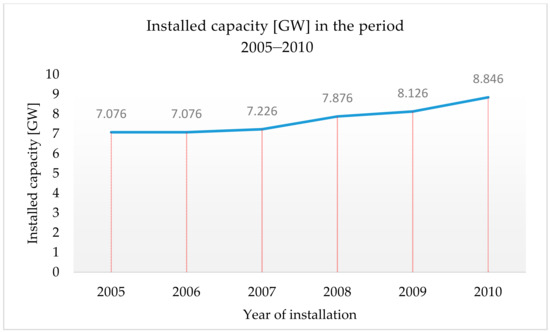
Figure 2.
Installed capacity [MW] in the period 2005–2010.
The Ministry of Irrigation (MOI) and Ministry of Petroleum and Minerals Resources (MPMR), also, generate electricity as part of the SEPS. The MOI manages water resources and hydro power plants located on the Euphrates River (Euphrates, Al-Thawra, Baath, and Tishreen). Figure 3 shows the percentage share of the generated electricity of the SEPS between PEDEE, MOI, and MPMR.
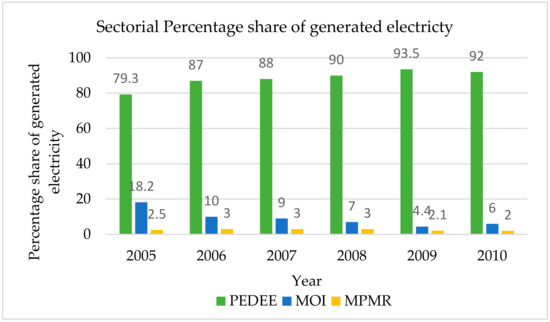
Figure 3.
Sectorial percentage share of generated electricity in the period (2005–2010).
According to the available statistical data, the average growth rate of the annual generated electric energy from 2005 to 2010 is 6.3%. While the average growth rate of the annual consumed electric energy in the same period is 5.6%.
Table 2 shows the installed capacity, available power at generation stations, annual energy generated, peak power demand, annual energy consumed and the annual energy growth rate of the SEPS in the period (2005–2010).
Table 2.
Installed capacity, available power, generated energy, peak demand, and consumed energy of the SEPS in the period (2005–2010).
Figure 4 shows the electric energy generation of different types of technologies used in the SEPS, namely, steam, gas, combined cycle, and hydro in the period (2005–2010).
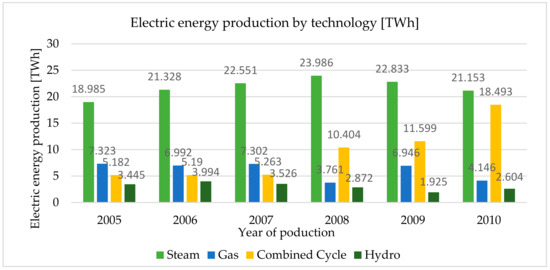
Figure 4.
Electric energy production by technology in the period 2005–2010.
In 2010, steam technology contributed 45% of the generated electric energy and CC technology contributed 40%. While gas technology contributed only 9%. The remaining 6% was the contribution of hydro technology.
Electrification rates and rural electrification in Syria (2005–2010) are shown in Table 3.
Table 3.
Electrification rate and rural electrification in Syria (2005–2010).
During the period (2005–2010), the main difficulties facing the SEPS were a high consumption growth rate, technical and commercial losses, and old technology (generation, substation, etc.). Technical and commercial losses (up to 27 percent) were also leading characteristics of the Syrian grid during the same period resulting in several blackouts.
The electric power sector policy is regulated by the MOE including the tariffs and reform of the sector.
- B. Sustainable development concept realization in SEPS (2005–2010):
Syria signed and ratified most of the international treaties, conventions and protocols on climate change and SD [34]. It, also, committed to implementing the outcomes of the UN conferences on SD very early. Within its framework of planning and strengthening the concepts of SD, Syria undertook serious endeavors through:
- Establishing institutional structures such as the Ministry of State for Environmental Affairs, the National Energy Research Center (NERC), etc.;
- Developing national framework strategies for SD, environmental protection, climate change, pollution in the Mediterranean Sea, RES in Syria, etc.; and
- Developing a legislative and policy framework and integrating these issues into the state Five-Year plans.
UNDP, also, implemented a project on the efficiency of the supply side and energy conversion between 1999 and 2005 in Syria. The project resulted in the establishment of NERC.
In its tenth Five-Year Plan (2006–2010), Syria dedicated a special attention to SD concept implementation and its realization in the SEPS. In 2009, the MOE enacted the Syrian Energy Conservation Law (SECL). The law aims to fulfil the requirement of Syria in regard to SD, encourage the conversion and efficiency of energy practice, and the implementation of various RES solutions. According to the law, private and public institutions must commit to energy efficiency practices and use renewables and high energy- efficiency equipment as well. The law also gives the NERC the right to work to encourage measures that promote energy efficiency and a renewable energy culture and proposed laws relate to the applications of RES in the industrial and agricultural sectors. In addition, the center supports the cooperation with private sector partners to encourage their contribution in generating electricity from RES. The Center also supervises the guidance of local importers and industrialists to work on improving the efficiency of produced or imported electrical devices, and to cooperate with state institutions to obtain tax and customs exemption in relation to RES projects. It also supports the establishment of new research centers and promotes the culture of RES and energy conservation programs.
The results of SD concept adoption and application in the SEPS appeared as follows:
- Access to electricity for all (more than 97% of the country was covered by 2010);
- Exploitation of water resources to generate electricity;
- Use of gas as a clean source of energy;
- Use of combined cycle technology;
- Updates of the wind atlas and solar radiation map of Syria;
- Initiation of a number of renewable energy projects (wind and solar);
- National strategy for improving energy efficiency.
In the pre-crisis phase, the implementation and realization of the SD concept in the SEPS were hampered by the following difficulties: institutional, legislative, financial, policies, ineffective exploitation of full and potential capacities, expertise needed, access to advanced technology, etc. [34].
- C. Renewable energies in SEPS (2005–2010):
There is no doubt that the trend towards RES has become a global trend in terms of achieving energy security and preserving the environment through reducing the harmful effects of gas emission due to the use of traditional fuel sources.
Therefore, RES have been part of the overall SEPS plans since 2002. A 4.3% target of renewable energy generation mix was set to be achieved by 2011 [35] (unfortunately it has not been achieved because of the crisis).
In 2002, the MOE collaborated with the UN to launch the Renewable Energy Master plan (REMP) with the objective to:
- Increase the contribution of RES in the generation mix;
- Establish governmental organizations and carry out survey works that help make better use of RES;
- Complete all studies and research to assess the available potential wind energy through installing/17/wind monitoring stations in several regions, and as a result, a wind power map is to be developed (Technically and economically feasible sites and locations were identified).
- Achieve an estimated 1012 KTOE of renewable energy production by 2011.
At the end of 2010, the total RES installed capacity in the SEPS was about 1528.84 MW (hydro). Total installed capacity and estimated potential of various RES are shown in Table 4.
Table 4.
Total installed capacity and estimated potential of renewable energies in SEPS at the end of 2010.
Syria also joined both the International Renewable Energy Agency (IRENA) and the Regional Center for Renewable Energies and Energy Efficiency (RCREEE), as a founding member.
By 2010, a few wind and solar power projects were announced, but unfortunately not completed due to unilateral sanctions on Syria. The projects are:
- A project of 100 MW wind power to be established in Al-Sukhna, Homs (2009);
- A project of 50 MW wind power to be established on the shores of Qattian lake, Homs (2010);
- A project of 50–100 MW wind power to be established in Al Hijana, Damascus (2010).
- A project aiming to introduce solar street lighting was announced by Japan International Cooperation Agency (JICA) in 2010 in cooperation with NERC.
Less than 8% of the total electric energy supply of the SEPS is contributed by hydropower sources. According to its estimated potential, the percentage should be 25%. However, it was expected that the sharing percentage would even decrease to less than 3% by 2020.
Syrian electric energy prices are highly subsidized. The Syrian tariff is US$0.03/kWh for household consumers and US$0.10/kWh for industrial and other consumers.
The main factors which affected the spread of renewable energy applications in the SEPS until 2010 can be summarized as [36]:
- The availability of governmental subsidized and low-cost conventional energy resources;
- The high cost of renewable energy manufacturing and installations;
- The general public is not aware of the benefits of RES
- The fact that buildings in Syria are not designed to suit RES installations.
2.1.2. The Crisis Phase (2011–2017):
- A. SEPS structure and characteristics (2011–2017):
During the crisis phase (2011 up till now), the SEPS was one of the infrastructure sectors most effected by the crisis. The damage to the SEPS involved all parts (generation, transmission, and mainly distribution networks and substations). As an example, Figure 5 shows the damaged to the Kapoon substation in 2017 compared with 2012 [37].
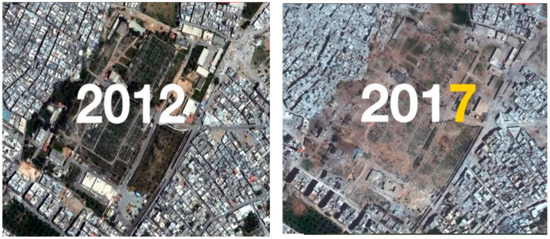
Figure 5.
Damage to Kapoon substation in 2017 compared to 2012 [37].
Three generation stations (power plants), namely, Aleppo, Zezoun, and Al-Tayyem have been, almost, completely destroyed. The remaining stations were also affected partially, and so the installed capacity of the SEPS decreased significantly. Transmission and distribution substations and networks (with different voltage levels), were also severely affected.
In 2013, more than 30 of SEPS power stations were inactive and at least 40% of the SEPS high voltage lines had been attacked. As the crisis worsens and continues, electricity generation has fallen to more than 50 percent. Power cuts, complete blackouts, and severe rationing of the electricity supply have become prominent features of life in Syria.
Table 5 shows the installed capacity in 2011, a year of the expansion, and expansion capacity of the SEPS generation stations until 2017
Table 5.
Installed capacity in 2011, a year of expansion, and the expansion capacity of the SEPS’s generation stations until 2017.
Table 6 shows the installed capacity, available power, generated energy, peak demand, and consumed energy of the SEPS in the period (2011–2017).
Table 6.
Installed capacity, available power, generated energy, peak demand, and consumed energy of the SEPS in the period (2011–2017).
As can be seen from the table above, instead of reaching an expected electric energy production of 63 TWh in 2015, production has fallen to 18.98 TWh. Figure 6 shows the installed capacity in the period 2011–2017.
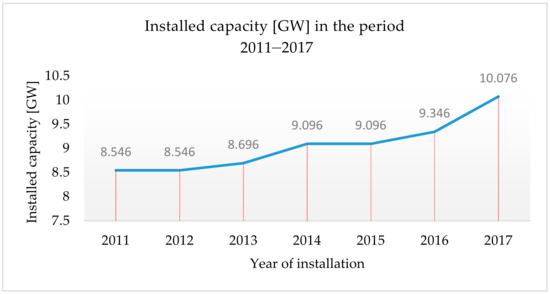
Figure 6.
Installed capacity in the period 2011–2017.
The total losses of the SEPS were estimated at more than US$ 4 billion at the end of 2019 and about 70% of the SEPS substations and supplying fuel pipelines are still inactive according to MOE.
- B. Sustainable development of SEPS (2011–2017):
In this tough and difficult period, and as a result of what the Syrian crisis led to, the adoption of SD concepts has become more urgent than any time before.
Although the situation in Syria has got progressively complicated year after year, Syria has continued, under these difficult circumstances, to adopt and implement the concepts of SD and participate in international conferences (Rio+20-2012, 2030 Agenda for Sustainable Development-2015). However, due to the harsh conditions of war, SD realization was not clearly reflected in the SEPS, especially since this sector was one of the most vulnerable to destruction sectors. Therefore, there were no opportunities to integrate the concepts of SD into the operation and development of this sector.
In its first national report on SDGs, Syria addressed the challenges and progress of SD realization in the SEPS as [38]:
Challenges:
- Decrease in oil and gas production and as a result decrease in fuel supply to electric power stations;
- Damage of pipe lines and transportation facilities;
- Drop of electric power generation from 49 TWh in 2011 to 24 TWh in 2014 and to 20 TWh in 2015 (20% annual reduction rate);
- Drop of peak capacity from 9 GW in 2011 to 3.5 GW in 2015;
- Decrease in grants and subsidies for the SEPS (support was limited to relief projects only);
- Need for international cooperation for updating renewable energy plans and studies;
- Contracts for the improvement and development of power plant - have stalled;
- Loans were suspended;
- Unavailability of spare parts for maintenance; and
- International companies refrained from responding tenders and bids by the MOE and its institutions.
Progress:
- The NREC established a strategy for RES supply sharing of 4% by 2030. This strategy was updated in 2016.
- The MOE plans to enhance the share of RES in the generation resources mix; and
- Investment in renewable energy reached (0.38%) between 2010 and 2015, while it was expected to reach up to 44% of total energy investments between 2021–2025 and 24% between 2026–2030.
- C. Renewable energies in the SEPS (2011–2017):
In 2010, Syria in partnership with Deutsche Gesellschaft International Zusammenarbeit (GTZ) updated the (REMP) to Master Plan for Energy Efficiency and Renewable Energies (MPEEREs) [39]. The main objective of this project was to propose an action plan that would assist in the long-term sustainable planning of the SEPS, through the combination of energy efficiency and the use of RES. This plan was proposed as a guideline until 2030, as its objectives are to be implemented in specific time periods (five-year plans) starting from the year 2010. The goals of this plan were to save energy, improve its efficiency and increase the contribution of RES. The targets of the plan for increased renewable energy sharing were set as:
- 1000–1500 MW of wind power;
- 250 MW of biomass-based plant power;
- 250 MW of photovoltaic plant power; and
In addition, the NERC was obligated to invest at least $8 million in RES projects according to the five-year plan. As well as this, an investment of about $1.48 billion in RES projects, with a focus on solar energy projects, wind energy, biomass energy, and solar water heating systems was called for in the plan.
Law 32, issued by presidential decree in 2010, allowed the private sector to invest in generating electricity from both conventional and RES. This law emphasized the importance of partnership between the public and private sectors. It also allowed the Independent Power Producers (IPPs) to generate electric energy and sell it directly to the customers. As for tariffs, the law emphasized that the MOE should determine the tariff. The MOE also established the legal and legislative framework necessary to encourage private investment in RES.
In 2011, the Energy Efficiency Code project document was signed with the UNDP between the MOE and the Planning and International Cooperation Committee (PICC). The main objective of the project was to reduce gaseous emissions from the Syrian energy sector through the improvement of the energy efficiency in buildings by adopting a new code and thus reducing energy demand.
The MPEERE plan was updated in 2016 by setting the contribution of RES in electric power generation mix to 5 percent in 2025. Encouraging promotional prices wereset for the purchase of electrical energy generated from renewable energy projects that can be linked to public distribution networks, according to Council of Ministers Resolution No. 1736.
Approximately, 20 solar PV projects have been implemented, and these projects are currently in service in Damascus, Rural Damascus, Sweida, Homs, Hama, and Tartous. The time default for the project is 20 years for wind projects and 25 years for photovoltaic projects.
Table 7 shows a list of already installed and operational solar PV projects in Syria by 2017.
Table 7.
List of already installed and operational solar PV projects by 2017.
In its 2019 report entitled “Arab Future Energy Index AFEX” [32], the RCREEE indicated that Syria has an overall score of 26% among the RCREEE countries and has an 18 percent score for its market structure and 19 percent score for its policy framework. Also, Syria has a 39 percent score for its institutional capacity and 26 percent score for its finance and investment.
Figure 7 shows the evaluation of Syria’s progress in RES regarding its policy framework, market structure, finance and investment, and institutional capacity.
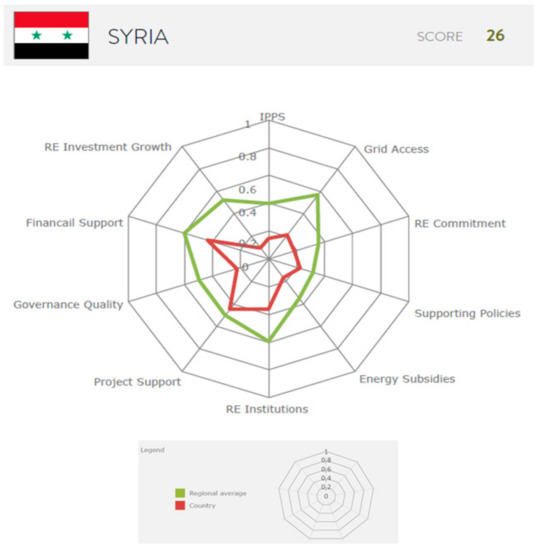
Figure 7.
The assessment of Syria’ progress in renewable energy until 2019 [32].
A 5–7 GW wind power capacity is projected in the promising areas that are windy and that extend from the Al-Ghab Plain to the Homs slot up to the administrative borders of the Governorates of Deir Al-Zour, Raqqa, Qalamoun, Quneitra and the eastern regions of Rural Damascus and Sweida.
The first grid-connected wind turbine in Syria was built and installed in the Homs countryside of Al-Sendianah with a 2.5 MW capacity in 2018.
Table 8 shows the SEPS performance indices in terms of renewable energy.
Table 8.
The SEPS performance indices in terms of renewable energy.
2.2. Role of RES in the SD of Post-Conflict SEPS Reconstruction
During the past several years of the Syrian crisis, the SEPS’s infrastructure has been severely damaged and this damage includes:
- Three out of eleven generation stations have been destroyed (Aleppo, Zezoun, and Al-Tayyem) and one of these three stations has been completely dismantled, namely, Zezoun station;
- Several hundred kilometers of 400 and 230 kV networks and a thousand kilometers of 66, 20, 0.4, and 0.22 kV networks have been destroyed; and
- Several hundreds of substations have been completely destroyed as well.
In addition, a severe acute shortage of fuel and gas supply as a primary source of energy due to the damage caused to the oil and gas mining facilities and the transportation pipelines of these two materials has occurred. Therefore, the SD concept must be given the highest priority in the reconstruction phase of the SEPS. This requires serious and realistic thinking about exploiting RES that Syria enjoys (solar and wind energy in particular). Syria, among several countries worldwide, possesses a significant potential of RES, whether with regard to wind or solar energy at the regional and international levels. Adopting the RES solution can play a vital role from the generation diversity and supply security point of view and the SD realization as well.
In order to assess the role that RES can play in achieving SD of the SEPS during the reconstruction phase until 2030, we discussed four different scenarios. These scenarios are extracted from the documents in hand (these are just the scenarios that have been found in the collected data) and they are as follows:
The first scenario (MPEERE 2010 scenario):
With an annual electricity consumption growth rate of 5.6%, it was expected that, by 2030, the annual electricity consumption would reach 140.48 TWh and the total installed capacity would reach 26.45 GW. According to the MPEERE scenario, only 2.00 GW (7.6%) of solar and wind power installation was projected in this scenario.
The second scenario (AECS scenario):
This scenario is based on the results published by the Energy Planning Group, Nuclear Engineering Department, Atomic Energy Commission of Syria (AECS) in 2010 [40]. According to this scenario, it was expected that the projected total electricity demand by 2030 would reach 103.9 TWh and the total installed capacity would reach 19.5 GW. According to the AECS scenario, only 40 MW of wind power was projected to be installed by 2030.
The third scenario (MOE 2019 strategy scenario):
This scenario is based on the strategy of the Syrian MOE for RES launched in 2019 [41]. According to this scenario, the projected total electricity demand by 2030 would reach 80 TWh and the total installed capacity would reach 16.32 GW. It was expected that the contribution of RES to the energy balance for 2030 would reach 5% of the total primary energy demand and 6% of total electricity demand by 2030. According to the MOE 2019 strategy scenario, only 1200 MW of wind and 1500 MW of solar power installation was projected in this scenario.
The fourth scenario (RCREEE 2019 scenario):
This scenario is based on the Arab Future Energy Index-AFEX-2019 report published in 2019 by the RCREEE [32]. According to this scenario, the projected total electricity demand by 2030 would reach 96 TWh and the total installed capacity would reach 20.63 GW. According to the RCREEE 2019 strategy scenario, Syria’s plan is to install up to 7.76 GW of renewable energies (37%) including 2050 GW of wind and 5710 of PV and CSP by 2030.
The inputs for these four scenarios regarding the projected total electric power demand, installed capacities (from various generation sources until 2030), and the fuel consumption were taken from the publicly available data. Table 9 shows the inputs for the studied different scenarios. These scenarios have also been compared with the proposed optimal scenario in this article from a technical and economic point of view, using the EnergyPLAN program. EnergyPLAN is a free license input/output computer modeling tool for power and energy systems design [33]. The advantages of EnergyPLAN have been mentioned in many references and the program has been used successfully in modelling energy systems with a significant contribution from renewable energies in many countries. The methodology of this program is based on modeling energy systems planning strategies at the local, regional and global levels, depending on economic and technical analysis. The program represents an input/output model. The inputs are energy demand, renewable energy sources, power plant capacity, and cost with a number of different simulation strategies. The outputs are the annual production, fuel consumption, import and export costs for energy exchange.
Table 9.
Fuel consumption and installed capacity by technology for the studied four scenarios.
It was expected that by 2030, only 3.09 GW out of the installed 8.85 GW in 2010 would be available due to older power plants shutting down.
Proposed optimal (technical and economic) scenario:
Syria possesses great potential for renewable energies especially solar and wind energy. A daily average of 5.1 kWh/kWp and a yearly average of 1850 kWh/kWp are available in Syria according to the global solar atlas as it can be observed in Figure 8.
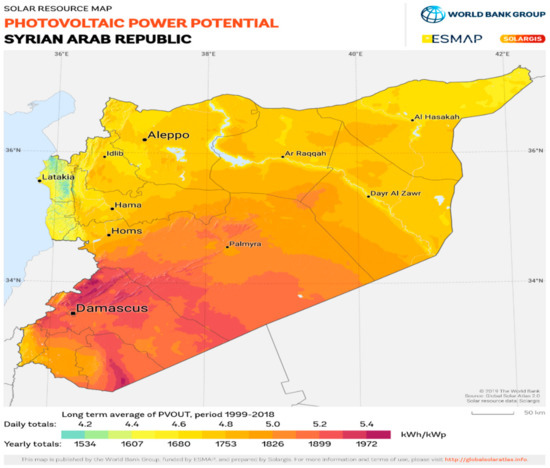
Figure 8.
Photovoltaic power potential in Syria [42].
Wind speeds with an average of 6.3 m/s and a potential of 337 W/m2 are available in Syria according to the global wind atlas as can be observed in Figure 9.
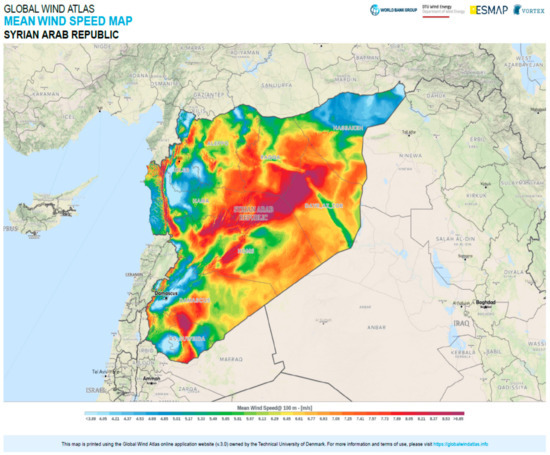
Figure 9.
Mean wind speed in Syria [43].
To effectively participate in the post-crisis reconstruction phase of the SEPS, we proposed an average of 20% of the total electric demand to be supplied by RES in 2030. Therefore, 6 GW of wind power and 5 GW of solar PV power capacities are proposed to be installed by 2030 for enhancing the realization of SD concepts adoption (reducing emissions, protecting the environment, balancing socio-economic development, creating jobs, etc.).
With the presence of legislative and legal structures to encourage investment in electrical energy (Law No. 32 of 2010), legislation that help investors (normal people, public and private sectors, local investors, regional investors, and international investors) is being promoted in Syria. The legislation environment allows private sales of electric energy produced from renewable energies, secures loans to individual persons and local investors to invest in the renewable energy sector, and encourages international investors as well.
Fortunately, and due to the following factors:
- The culture of RE has begun to spread in Syria (dozens of projects have already been implemented);
- The legislative and legal environment is quite encouraging; and
- Local and regional investors are ready to invest in large-scale projects;
The proposed scenario can be realized easily.
Reference-year model:
To verify the accuracy of EnergyPLAN, firstly, we established a reference-year model for the SEPS in 2010, the input data for this reference-year model was taken from the verified data we presented in this paper (after analysis and comparison). In 2010, the total installed capacity in the SEPS was 8.85 GW and only an 8.20 GW of this capacity was available. Table 10 shows the available installed capacity by technology and the actual fuel consumption of the SEPS in 2010. Hourly distribution power demand, hourly distribution solar power, and hourly distribution wind power for SEPS case study are all prepared by the authors based on verified data presented in this paper. Default fuel cost distribution is taken from the EnergyPLAN database.
Table 10.
Available installed capacity by technology and actual fuel consumption of the SEPS in 2010.
In EnergyPLAN, this capacity was dealt with as a concentrated single power plant capacity. The total demand of the SEPS, in 2010, was 47.242 TWh. Table 11 shows the actual electricity production and the EnergyPLAN estimated fuel consumption, cost of fuel, CO2 emission, and CO2 cost of the SEPS in 2010.
Table 11.
Actual electricity production and the EnergyPLAN estimated fuel consumption, cost of fuel, CO2 emission, and CO2 cost of the SEPS in 2010.
No heating, cooling or transportation were considered in our model because there is no information about the energy consumption of these kinds in the available database. From the table above it can be observed that the accuracy of EnergyPLAN is quite high.
3. Results and Discussion
3.1. Electricity Generation Trend of the SEPS in the Study Period (2005–2017)
By analyzing and comparing the available data of the SEPS in the period 2005–2017, we have noticed that the electricity production of this system has decreased from 34.96 TWh in 2005 (the beginning of the study period) to 17.60 TWh in 2016 (the least electricity production in the entire period i.e., 49.6% decrease) and decreased by 64% compared to 2011 (peak production) when the crisis started as shown in Figure 10.
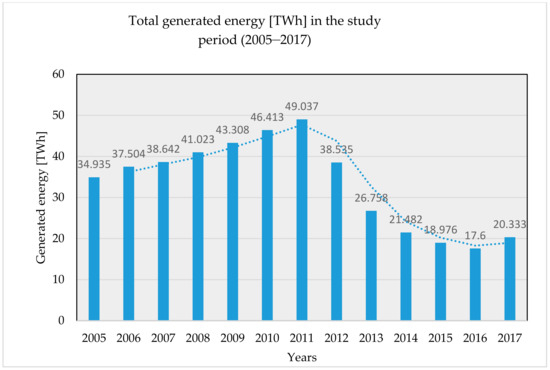
Figure 10.
Generated energy in the study period (2005–2017).
3.2. Evaluation of RES Role in the SD of Post-Conflict the SEPS Reconstruction
We have evaluated the four studied scenarios from technical and economic points of view using the EnergyPLAN computer modelling tool and compared these scenarios with the proposed optimal scenario.
The first scenario (MPEERE 2010 scenario):
We have used EnergyPLAN to evaluate this scenario from a technical and economic point of view and compared it with the proposed optimal (technical and economic) scenario. Table 12 shows the electricity production, fuel consumption, cost of fuel, CO2 emission, and cost of CO2 for the MPEERE scenario and proposed scenarios.
Table 12.
Electricity production, fuel consumption, cost of fuel, CO2 emission, and cost of CO2 for the MPEERE 2010 and proposed scenarios.
From this table it can be observed that:
- The fuel consumption was reduced from 322.49 TWh in the MPEERE scenario to 289.1 TWh in the proposed optimal technical scenario (10.35% reduction);
- The cost also reduced from 13,563 MUSD to 12,180 MUSD (10.2% reduction);
- CO2 emission was reduced from 73.15 Mt to 65.76 Mt (10.10% reduction); and
- The cost of CO2 was reduced also from 2531 MUSD to 2272 MUSD (10.23% reduction).
However, compared to the proposed economic scenario, these numbers represented an increase but the total annual cost decreased due to the electricity exchange (import/export) option as can be seen in Table 13, which shows a comparison of the costs of fuel, CO2 emission, marginal and fixed operations, annual investment, electricity exchange, and the total of the discussed four scenarios compared with the proposed optimal (technical and economic) scenario.
Table 13.
Comparison of fuel, CO2 emission, marginal and fixed operations, annual investment, electricity exchange, and total costs of the various scenarios discussed.
Figure 11 shows the monthly demand and generation (using various technologies) of the proposed optimal technical scenario.
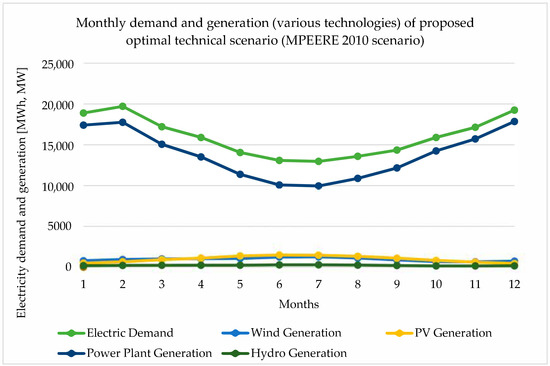
Figure 11.
Monthly demand and generation of proposed optimal technical scenario (MPEERE 2010 scenario).
The second scenario (AECS scenario):
EnergyPLAN software was used to evaluate this scenario from a technical and economic point of view. The simulation results of this scenario are shown in Table 14. This scenario was also compared with the proposed optimal (technical and economic) scenario. From Table 14, it can be observed that:
Table 14.
Electricity production, fuel consumption, cost of fuel, CO2 emission, and cost of CO2 for the AECS and proposed scenarios.
- The fuel consumption was reduced from 244.17 TWh in the first scenario to 201.56 TWh in the proposed optimal technical scenario (17.45% reduction);
- The cost also reduced from 11,242 MUSD to 9172 MUSD (18.41% reduction);
- CO2 emission was reduced from 60.96Mt to 51.74Mt (15.13% reduction); and
- The cost of CO2 was reduced also from 2110 MUSD to 1719 MUSD (15.53% reduction).
Figure 12 shows the monthly demand and generation (using various technologies) of the propsed optimal technical scenario.
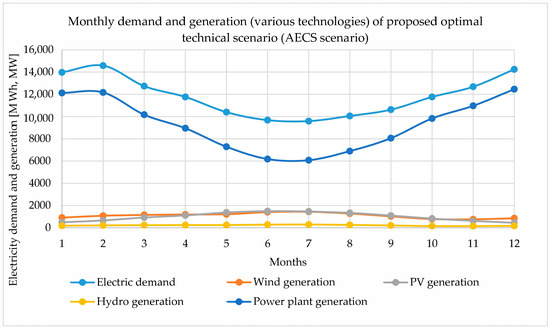
Figure 12.
Monthly demand and generation of the proposed optimal technical scenario (AECS scenario).
However, compared to the proposed economic scenario, fuel consumption, cost of fuel, CO2 emission, and cost of CO2 values increased but the total annual cost decreased due to electricity exchange (import/export) option as can be seen in Table 13.
The third scenario (MOE 2019 strategy scenario):
We have used EnergyPLAN to evaluate this scenario from a technical and economic point of view and compare it with the proposed optimal (technical and economic) scenario. Table 15 shows the electricity production, fuel consumption, cost of fuel, CO2 emission, and cost of CO2 for the first and proposed scenarios.
Table 15.
Electricity production, fuel consumption, cost of fuel, CO2 emission, and cost of CO2 for the first and proposed scenarios.
From this table it can be observed that:
- The fuel consumption was reduced from 174.61 TWh in the first scenario to 143.68 TWh in the proposed optimal technical scenario (17.71% reduction);
- The cost also reduced from 7337 MUSD to 6040 MUSD (17.68% reduction);
- CO2 emission was reduced from 39.56 Mt to 32.55Mt (17.72% reduction); and
- The cost of CO2 was reduced also from 1369 MUSD to 1126 MUSD (17.75% reduction).
Figure 13 shows the monthly demand and generation (using various technologies) of the proposed optimal technical scenario.
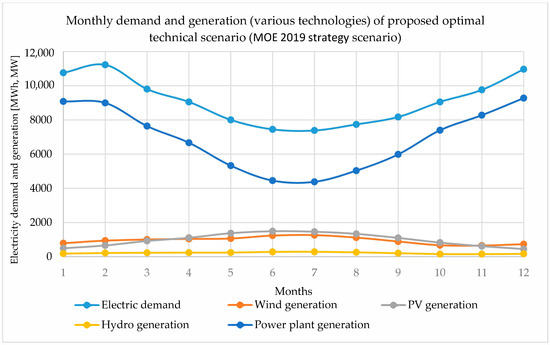
Figure 13.
Monthly demand and generation (various technologies) of the proposed optimal technical scenario (MOE 2019 strategy scenario).
However, compared to the proposed economic scenario, fuel consumption, cost of fuel, CO2 emission, and cost of CO2 values increased but the total annual cost decreased due to the electricity exchange (import/export) option as can be seen in Table 13.
The fourth scenario (RCREEE 2019 scenario):
EnergyPLAN software was used to evaluate this scenario from a technical and economic point of view. The simulation results of this scenario are shown in Table 16. This scenario was also compared with the proposed optimal (technical and economic) scenario. From Table 16, it can be observed that:
Table 16.
Electricity production, fuel consumption, cost of fuel, CO2 emission, and cost of CO2 for the RCREEE 2019 and proposed scenarios.
- The fuel consumption was reduced from 205.54 TWh in the first scenario to 176.96 TWh in the proposed optimal technical scenario (13.90% reduction);
- The cost also reduced from 8635 MUSD to 7436 MUSD (13.86% reduction);
- CO2 emission was reduced from 46.55 Mt to 40.08 Mt (13.90% reduction); and
- The cost of CO2 was reduced also from 1611 MUSD to 1387 MUSD (13.90% reduction).
However, compared to the proposed economic scenario, these numbers increased but the total annual cost decreased due to the electricity exchange (import/export) option as can be seen in Table 13.
Figure 14 shows the monthly demand and generation (using various technologies) of the proposed optimal technical scenario
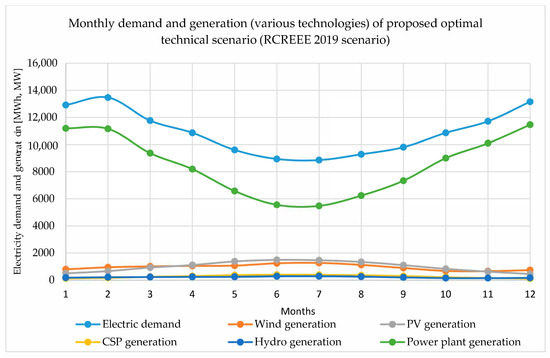
Figure 14.
Monthly demand and generation (using various technologies) of the proposed optimal technical scenario (RCREEE 2019 scenario).
It can be observed, from Table 13, that:
- The total cost of the first scenario is reduced from 18,830 MUSD to 17,634 MUSD in the proposed optimal technical scenario and to 15,885 MUSD in the proposed optimal economic scenario with a reduction percentage of 6.35% and 15.64%, respectively.
- The total cost of the second scenario is reduced from 15,722 MUSD to 13,970 MUSD in the proposed optimal technical scenario and to 12,308 MUSD in the proposed optimal economic scenario with a reduction percentage of 11.14% and 21.71%, respectively.
- The total cost of the third scenario is reduced from 10,383 MUSD to 9483 MUSD in the proposed optimal technical scenario and to 7845 MUSD in the proposed optimal economic scenario with a reduction percentage of 8.67% and 24.44%, respectively.
- The total cost of the fourth scenario is reduced from 13,276 MUSD to 12,427 MUSD in the proposed optimal technical scenario and to 10,651 MUSD in the proposed optimal economic scenario with a reduction percentage of 6.4% and 19.77, respectively.
Table 17 shows a comparison between the RES share as a percentage of primary electricity energies and the actual electricity production of the RES for the various scenarios.
Table 17.
Percentage of primary energy, percentage of electricity, and actual production of electricity of the-various scenarios discussed.
4. Conclusions
The results obtained in this research indicate that the proper and systematic planning of the SEPS in the post-crisis reconstruction phase will contribute significantly and effectively to securing the demand for electric energy in the year 2030 at 23.6%. It will also contribute to reducing fossil fuel consumption by up to 17.7 percent, which means a reduction in fuel consumption costs by up to 18.14 percent. Likewise, it will contribute to reducing the amount of CO2 emission and the cost of this emission by 17.72 and 17.52 percent, respectively. All this will contribute to protecting the environment, improving the diversity of electric power generation sources, and creating new job opportunities (in other words, prompting the realization of SD concepts). Therefore, in line with the legislative and legal environment available in Syria, an organized framework based on the deployment of a renewable energy culture among all groups of people, encouraging and supporting local investors, facilitating procedures for regional and foreign investments, encouraging the localization of renewable energy technology in the long-term, reducing incentives to depend on traditional energy resources, and increasing subsidies and incentives to use renewable energies and environmental protection solutions is required to realize such scenario on the ground. This work can be improved in the future by proposing heating, cooling, and transportation energy systems which contribute to the electric system to achieve the overall sustainable development of the Syrian energy system.
Author Contributions
For all the authors contributed equally to the other parts of the work. All authors have read and agreed to the published version of the manuscript.
Funding
This research was supported by the Internal Grant Agency (IGA) of the Faculty of Economics and Management, Czech University of Life Sciences Prague, grant no. 2019B0011 “Economic analysis of water balance of the current agricultural commodities production mix in the Czech Republic, the Internal Grant Agency of the Faculty of Tropical AgriSciences, Czech University of Life Sciences Prague [grant number 20205012] and Grant Agency of the Czech Technical University in Prague (grant No. SGS17/181/OHK3/3T/13).
Acknowledgments
We would like to express our special gratitude to Mohammed H Albadi and Abdullah H AL-BADI from the Department of Electrical and Computer Engineering, College of Engineering, Sultan Qaboos University, Muscat-Oman. For their advice and helpful discussions.
Conflicts of Interest
The authors declare no conflict of interest.
References
- Sustainable Development Goals. Available online: https://sustainabledevelopment.un.org/conferences (accessed on 26 May 2020).
- Sustainable Development Goals. Available online: https://sdgs.un.org/ (accessed on 26 May 2020).
- Qazi, A.; Hussain, F.; Rahim, N.A.; Hardaker, G.; Alghazzawi, D.; Shaban, K.; Haruna, K. Towards Sustainable Energy: A Systematic Review of Renewable Energy Sources, Technologies, and Public Opinions. IEEE Access 2019, 7, 63837–63851. [Google Scholar] [CrossRef]
- Kurbatova, T.; Skibina, T. Renewable Energy Policy in Ukraine’s Household Sector: Measures, Outcomes and Challenges. In Proceedings of the 2019 IEEE International Conference on Modern Electrical and Energy Systems (MEES), Kremenchuk, Ukraine, 23–25 September 2019; pp. 234–237. [Google Scholar] [CrossRef]
- Bowa, K.C.; Mwanza, M.; Sumbwanyambe, M.; Ulgen, K.; Pretorius, J.H. Comparative Sustainability Assessment of Electricity Industries in Sadc Region: The Role of Renewable Energy in Regional and National Energy Diversification. In Proceedings of the 2019 IEEE 2nd International Conference on Renewable Energy and Power Engineering (REPE), Toronto, ON, Canada, 2–4 November 2019; pp. 260–268. [Google Scholar] [CrossRef]
- Samuel, A.-S.; Phebe, A.-O. A review of Ghana’s energy sector national energy statistics and policy framework. Cogent Eng. 2016, 3, 1155274. [Google Scholar]
- Consulo, M.T.; Gimenes, A.L.V.; Relva, S.G.; Udaeta, M.E.M. Basics on Energy Economics of Renewable Power Generation Projects: A focus on utility-scale PV plants inclusion on national grid. In Proceedings of the 2019 10th International Renewable Energy Congress (IREC), Sousse, Tunisia, 26–28 March 2019; pp. 1–6. [Google Scholar] [CrossRef]
- Al-Nory, M.T. Optimal Decision Guidance for the Electricity Supply Chain Integration with Renewable Energy: Aligning Smart Cities Research with Sustainable Development Goals. IEEE Access 2019, 7, 74996–75006. [Google Scholar] [CrossRef]
- Lesperance, W.; Kamdem, J.S.; Linguet, L.; Albarelo, T. Renewable Energy in French Guiana: Prospects towards a Sustainable Development Scenario. In Proceedings of the 2018 2nd International Conference on Smart Grid and Smart Cities (ICSGSC), Kuala Lumpur, Malaysia, 12–14 August 2018; pp. 133–136. [Google Scholar] [CrossRef]
- Mudaheranwa, E.; Udoakah, Y.; Cipcigan, L. Rwanda’s Energy Profile and Potential Renewable Energy Resources Mapping toward Sustainable Development Goals. In Proceedings of the 2019 IEEE PES/IAS PowerAfrica, Abuja, Nigeria, 20–23 August 2019; pp. 533–538. [Google Scholar] [CrossRef]
- Kansongue, N.; Njuguna, J.; Vertigans, S. Sustainable Energy for Emerging Nations Development—A Case Study on Togo Renewable Energy. In Proceedings of the 2018 IEEE PES/IAS PowerAfrica, Cape Town, South Africa, 28–29 June 2018; pp. 137–141. [Google Scholar] [CrossRef]
- Holguín, E.S.; Chacón, R.F.; Gamarra, P.S. Sustainable and Renewable Business Model to Achieve 100% Rural Electrification in Perú by 2021. In Proceedings of the 2019 IEEE PES Innovative Smart Grid Technologies Conference—Latin America (ISGT Latin America), Gramado, Brazil, 15–18 September 2019; pp. 1–5. [Google Scholar] [CrossRef]
- Mohseni, S.; Brent, A.C.; Burmester, D. A Sustainable Energy Investment Planning Model Based on the Micro-Grid Concept Using Recent Metaheuristic Optimization Algorithms. In Proceedings of the 2019 IEEE Congress on Evolutionary Computation (CEC), Wellington, New Zealand, 10–13 June 2019; pp. 219–226. [Google Scholar] [CrossRef]
- Ghenai, C.; Albawab, M.; Bettayeb, M. Sustainability indicators for renewable energy systems using multicriteria decision-making model and extended SWARA/ARAS hybrid method. Renew. Energy 2020, 146, 580–597. [Google Scholar] [CrossRef]
- Kamran, M.; Fazal, M.R.; Mudassar, M. Towards empowerment of the renewable energy sector in Pakistan for sustainable energy evolution: SWOT analysis. Renew. Energy 2020, 146, 543–558. [Google Scholar] [CrossRef]
- TolnovClausen, L.; Rudolph, D. Renewable energy for sustainable rural development: Synergies and mismatches. Energy Policy 2020, 138, 111289. [Google Scholar]
- Guidolin, M.; Alpcan, T. Transition to sustainable energy generation in Australia: Interplay between coal, gas and renewables. Renew. Energy 2019, 139, 359–367. [Google Scholar] [CrossRef]
- Tavana, A.; Javid, A.E.; Houshfar, E.; Andwari, A.M.; Ashjaee, M.; Shoaee, S.; Maghmoomi, A.; Marashi, F. Toward renewable and sustainable energies perspective in Iran. Renew. Energy 2019, 139, 1194–1216. [Google Scholar] [CrossRef]
- Asante, D.; He, Z.; Adjei, N.O.; Asante, B. Exploring the barriers to renewable energy adoption utilising MULTIMOORA- EDAS method. Energy Policy 2020, 142, 425–437. [Google Scholar] [CrossRef]
- Usman, O.; Alola, A.A.; Sarkodie, S.A. Assessment of the role of renewable energy consumption and trade policy on environmental degradation using innovation accounting: Evidence from the US. Renew. Energy 2020. [Google Scholar] [CrossRef]
- Hong, H.J.; Kim, J.; Son, W.; Shin, H.; Kim, N.; Lee, W.K.; Kim, J. Long-term energy strategy scenarios for South Korea: Transition to a sustainable energy system. Energy Policy 2019, 127, 425–437. [Google Scholar] [CrossRef]
- Munro, F.R.; Cairney, P. A systematic review of energy systems: The role of policymaking in sustainable transitions. Renew. Sustain. Energy Rev. 2019, 119, 109598. [Google Scholar] [CrossRef]
- Yilan, G.; Kadirgan, M.N.; Çiftçioğlu, G.A. Analysis of electricity generation options for sustainable energy decision making: The case of Turkey. Renew. Energy 2020, 146, 519–529. [Google Scholar] [CrossRef]
- Fandi, G.; Krepl, V.; Ahmad, I.; Igbinovia, F.O.; Ivanova, T.; Fandie, S.; Muller, Z.; Tlusty, J. Design of an Emergency Energy System for a CityAssisted by Renewable Energy, Case Study: Latakia, Syria. Energies 2018, 11, 3138. [Google Scholar] [CrossRef]
- Hanna, G.F.; Hammoud, M.S.; Russo-Converso, J.A. Foreign Direct Investment in Post-Conflict Countries: The Case of Iraq’s Oil and Electricity Sectors. Int. J. Energy Econ. Policy 2014, 4, 137–148. [Google Scholar]
- American University of Beirut. Available online: https://www.aub.edu.lb/ifi/Documents/programs/energy_policy_and_security/articles/20191105_post_conflict_energy_planning_in_middle_east.pdf/ (accessed on 26 May 2020).
- Energy Charter. Available online: https://www.energycharter.org/fileadmin/DocumentsMedia/Occasional/2019-Yemen_paper_final.pdf/ (accessed on 26 May 2020).
- Ministry of Electricity (Syria). Available online: http://www.moe.gov.sy/ar/ (accessed on 26 May 2020).
- IEA. Syria. Available online: https://www.iea.org/countries/syria (accessed on 26 May 2020).
- Country Nuclear Power Profiles 2018 Edition—Syrian Arab Republic. 2018. Available online: https://www-pub.iaea.org/MTCD/Publications/PDF/cnpp2018/countryprofiles/SyrianArabRepublic/SyrianArabRepublic.htm (accessed on 26 May 2020).
- REN21. 2013 MENA Renewables Status Report. Available online: https://www.ren21.net/2013-mena-renewables-status-report/ (accessed on 26 May 2020).
- RCREEE. Arab Future Energy Index—Renewable Energy 2019 Report. Available online: https://www.rcreee.org/content/arab-future-energy-index-renewable-energy-2019-report (accessed on 26 May 2020).
- Lund, H. EnergyPLAN. Advanced Energy System Analysis Computer Model. Available online: http://www.energyplan.eu/ (accessed on 25 September 2020).
- Syrian Arab Republic Ministry of State for Environment Affairs. National report of the Syrian Arab Republic. Available online: https://sustainabledevelopment.un.org/content/documents/982syria.pdf (accessed on 26 May 2020).
- REEEP. Syria (2012). Available online: https://www.reeep.org/syria-2012 (accessed on 26 May 2020).
- Al-Mohamad, A. Renewable energy resources in Syria. Renew. Energy 2001, 24, 356–371. [Google Scholar] [CrossRef]
- BBC News. Syria from Space. Available online: https://www.bbc.co.uk/news/resources/idt-sh/syria_from_space_english (accessed on 26 May 2020).
- The First National Report on Sustainable Development Goals SDGs-Executive Summary. Available online: https://www.arabdevelopmentportal.com/publication/first-national-report-sustainable-development-goals-sdgs (accessed on 26 May 2020).
- PEI. Syria’s Renewable Energy Potential. Available online: https://www.powerengineeringint.com/uncategorized/syrias-renewable-energy-potential/ (accessed on 26 May 2020).
- Global Solar Atlas. Available online: https://globalsolaratlas.info/download/syrian-arab-republic (accessed on 26 May 2020).
- Global Wind Atlas. Available online: https://www.globalwindatlas.info/area/Syrian%20Arab%20Republic (accessed on 26 May 2020).
- Hainoun, A.; Seif-Eldin, M.K.; Almoustafa, S. Formulating an optimal long-term energy supply strategy for Syria using MESSAGE model. Energy Policy 2010, 38, 1701–1714. [Google Scholar] [CrossRef]
- Syrian Arabic Rebublic Presidency of the Council of Ministers. Available online: http://www.pministry.gov.sy/contents/15284/<>استراتيجية-وزارة-الكهرباء-للطاقات-المتجددة-حتى-العام (accessed on 26 May 2020).


Publisher’s Note: MDPI stays neutral with regard to jurisdictional claims in published maps and institutional affiliations. |
© 2020 by the authors. Licensee MDPI, Basel, Switzerland. This article is an open access article distributed under the terms and conditions of the Creative Commons Attribution (CC BY) license (http://creativecommons.org/licenses/by/4.0/).