Abstract
Bipolar lightning strokes are associated with multiple polarity electrical discharge with no current intervals in between, making their behavior quite peculiar. This work presents a fast front analysis of a mixed high voltage direct current (HVDC) transmission link, evaluating the factors that influence the line transients due to shielding failures and backflashovers (BFOs), considering both overvoltage and repeated polarity reversal at the cable sending terminal. The research process includes a detailed modeling of a bipolar lightning stroke, frequency-dependent HVDC overhead, and underground transmission line sections. Noticeable findings include the occurrence of only a positive polarity insulator BFO for the adjacent and subsequent tower, despite the dual polarity of the lightning stroke with relatively small values for the lightning parameters. The influence of traveling waves on the insulator flashover performance of the line with varying parameters (such as the riser section length, the tower grounding impedance, and the location of the lightning stroke) is recorded and explained.
1. Introduction
There is increasing attention being paid to the significance of high voltage direct current (HVDC) interconnections in bulk power transmission, driven by their lower power losses, capacity, resilience to power outages, power flow controllability, and association with green energy sources [1]. Previously, overhead lines (OHLs) and cable systems were separately designed and established for transmission. Underground cables (UGCs) have lower environmental and visual effects compared to OHLs and can cover large distances in metropolitan areas [2]. However, the high economical and technical installation requirements associated with them cannot be overlooked. This led to the advent of more prevalent mixed HVDC links, containing both OHL and UGC sections. Therefore, the effect of lightning overvoltages on OHLs in such links can easily traverse to the UGC section [3].
Fast front overvoltages on OHLs due to lightning is a subject of major interest, especially with the trends of improving power quality [4]. Bipolar lightning strokes are less frequent, and overall bipolar flashes constitute 6% to 14% of summer lightning in Switzerland, Russia, and the USA. Many bipolar current waveforms have been observed in winter lightning studies in Japan, with the reported frequency of occurrence ranging from 5% to 33% [5]. Transients due to bipolar strokes have usually asymmetrical magnitude characteristics and have several zero crossings. Moreover transients in transmission lines due to a unipolar direct lightning stroke with multiple flashovers and changing contact points within the riser section pertain to similar surge characteristics as that of the transients produced due to bipolar lightning strokes [6]. However, to date, there is little understanding of bipolar lightning flashes, especially compared to positive and negative lightning strokes [7]. Analysis of how the overvoltage stress affects surge arresters (SAs) due to bipolar lightning on AC distribution transmission systems has been performed, and the influences of channel impedance and footing resistance on SA energy have been discussed [8,9,10]. However, the effect of multi-component flashes on high voltage (HV) transmission lines is not well understood. Transmission lines that carry high power over long distances usually pass through various terrain configurations, which can lead to the footing resistance of towers not remaining constant throughout the line length [11]. The higher soil resistivity of rocky terrains along with the effective height (i.e., the height of the rocky terrain from the plain level + height of the tower) of tower structures are adept at catching bipolar lightning strokes.
Early studies on the growth of over voltages in mixed transmission lines that consider the cable insulation level are accounted for [12,13]. Some studies [14,15,16] have provided parametric analysis and formulations to explain the traveling wave behavior. Nonetheless, bipolar lightning is a multi-flash phenomenon, and transient overvoltages due to subsequent lightning strokes and the response of traveling waves in a mixed HVDC link have been overgeneralized in the literature.
The limitations found in the literature survey above are as follows: (a) in the case of HV transmission lines, the behavior of bipolar strokes is unaddressed, as most cloud-to-ground lightning events consist of negative polarity; (b) the impact of voltage surges at the OHL and cable intersection in a multi-flash lightning stroke is not considered; consequently, (c) there is a gap in modeling the response of traveling waves along the line as multi-flash lightning strokes hit the OHL section several times with short, no-current intervals in between.
Unlike a unipolar lightning stroke, when a bipolar lightning stroke hits the OHL section, it can cause overvoltage and polarity reversal simultaneously inside the cable section. Therefore, the aim of this paper is to highlight the serious threats that multi-flash strokes with different polarities can cause. The transient responses of a mixed HVDC line for direct lightning strokes to the overhead pole conductor (OHPC) and ground wire are considered. Lightning currents for shielding failure are calculated using the electrogeometric model (EGM). We have analyzed the reasons for the high-risk positive pole insulator flashover of adjacent and subsequent towers. Moreover, the impacts of the tower grounding resistance, the riser section length, and the cable length are discussed.
This paper is laid out as follows: Section 2 explains the underlying modeling strategy and choices. Case studies and simulation results on the effects of direct bipolar lightning strokes hitting the HVDC transmission link are given in Section 3. Final remarks and recommendations for future prospects of this work are presented in Section 4.
2. Modeling Methodology
The overvoltage withstand capability of HVDC system due to bipolar lightning strokes can be examined by modeling the detailed tower and cable structures with footing resistances, insulators and conductors.
The frequency dependence of conductors and ground wires result in the nonlinear behavior of the transmission lines. The frequency-dependent phase model (FDPM) quantifies the frequency dependence of all distributed parameters of the line, and its PSCAD implementation is given by [17,18]. This model is the most accurate choice for analyzing the maximum cable core to ground overvoltages in the case of shielding failure (SF). This model is also appropriate for understanding the BFO of subsequent and adjacent towers with varying footing resistance, the riser section length, and the cable section length. Lightning is a high frequency phenomena, which brings the HVDC transmission system from a steady to transient state. Thus, the frequency used for the transformation matrix in this study is 1 MHz. Wave propagation theory is used to understand the behavior of the voltage and current along the conductor, and the line constant program (LCP) of PSCAD was used to quantify various parameters. Considering the fact that it is a very long transmission line, the impedance at both ends is matched using terminating impedance. A total length of 2 km on each side of the cable section has been modeled, which constitutes 10 DC bipolar towers of a 500 kV rating, five on each side, with a 485 m span between towers (see Figure 1).
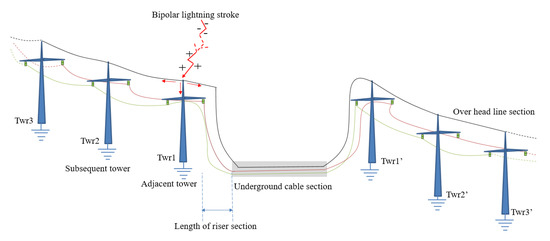
Figure 1.
Graphical representation of the HDVC transmission system.
2.1. Line Insulation
Power line conductors are suspended by means of insulators and are thus isolated electrically from the tower. The insulators used in this study are modeled using stray capacitance, parallel to the circuit breaker. This circuit breaker is operated using volt time characteristics as defined by the leader progression model (LPM) [19,20,21]. Here, is the time taken to break down, given by Equation (1):
where is the corona inception time (which is approximated as 0), and and are the streamer propagation time and leader propagation time, respectively. A streamer begins to grow and crosses the gap after if the voltage still increases after the inception of corona. is given as (2):
For negative polarity voltage,
and for positive polarity voltage,
is the voltage on the insulator in kV, and g is the gap length in m.
The leader will start to grow from both sides after until the voltage gradient across the un-bridged gap is larger than the critical leader inception gradient . The leader progression velocity v in ms proposed by CIGRE is given by Equation (5):
where l is the leader length in m, is the leader coefficient, and and are the arc horns and cap pin insulator, respectively, as given in Table 1 [21].

Table 1.
Practical configuration values.
2.2. Line Design
The line material and size are selected for a power rating of 1.5 GW per pole. In this study, high strength steel is used to model the overhead ground wire (OHGW), and an 806-A4-61 all-aluminum alloy conductor (AAAC) is used to model the OHPC. The same conductor geometry is applied to model the riser section, as there are no standard guidelines available in the literature for its modeling. However, the span of transmission lines adjacent to cable terminals is set to 100 m, which is different from the rest of the line.
2.3. Tower Representation
The tower structure and geometry are mostly site-dependent factors and have a minute impact on the simulation results [22]. Each major section of the ±500 kV HVDC tower is modeled in Figure 2, as a combination of four short transmission lines using FDPM.
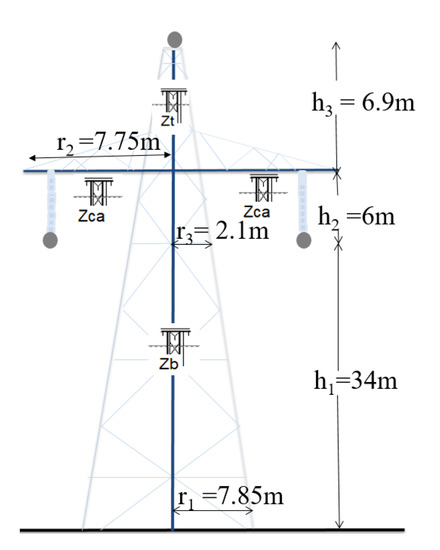
Figure 2.
Tower geometry with its simulation model.
The wave propagation velocity along the tower is 85% of the velocity of the light. A single shielding wire tower is selected to cater the worst case scenario. Further details of the tower geometry are given in Table 2.
Table 2.
Characteristics of the electromagnetic transient (EMT) simulation model of OHLs.
2.4. Tower Footing Resistance
A voltage surge was produced due to the lightning partially running along the OHGW, while the rest of it propagated towards the ground via the tower structure. Low values for tower footing impedance are desired in grounding of the tower. This parameter is strongly influenced by seasonal variations, geography, and the conduction properties of the soil [21]. As explained in [24], the current-dependent resistance model has been used herein, given by Equations (9) and (10).
is the footing resistance in , and the footing resistance at a low frequency and current is , given by 10 . is the limiting current to start soil ionization, and I is the lightning current from the footing resistance. Both are measured in A. is the soil ionization gradient given by 300 kV/m, and the typical grounding resistance used in this study is 10 . The soil resistivity is 300 m, where this parameter is directly related to the footing impedance. In this study, this parameter is kept high to consider the effect of the increased effective height of the tower structure due to rocky terrain.
2.5. Cable Line
In between the two sections of OHLs, an extruded HVDC underground cable section of copper core and steal sheath with a cross-sectional area of 3000 mm, as described in [25], is inserted, considering the effect of lightning overvoltage. The cables are laid horizontally 0.75 m apart from each other, at a depth of 1 m from the ground level. The lightning impulse withstand level (LIWL) of the cable is 2.7 pu. Further specifications of the UGC are listed in Table 3.
Table 3.
Characteristics of the EMT simulation model of the underground cable.
2.6. Surge Arrester Model
In the case of a mixed HVDC transmission line, excessive lightning overvoltage stress on the OHL section can cause permanent failure of the cable insulation, as the cable insulation is more fragile compared to the OHL insulators. To prevent such failure, the cable section should be protected by SAs. As per the instructions for cable overvoltages in [2], a frequency-dependent surge arrester with a maximum continuous operation voltage (MCOV) of 1.5 pu for the rated system voltage is modeled in this work, as shown in Figure 3a. An inductance of 6.55 H is connected in series with the surge arrester to represent the connection leads [26]. The lightning impulse protective level (LIPL) is 2.25 pu for 10 kA, an 20 s discharge current impulse, offering a protective margin of 20%. The surge arrester is 7 m in height and has one parallel-connected metal oxide block, composed of an RLC circuit and two nonlinear resistances, and . The desired VI characteristic of the metal oxide surge arrester is given using nonlinear resistors, as illustrated in Figure 3b, and the lumped parameter values are given in Table 4, using [27].
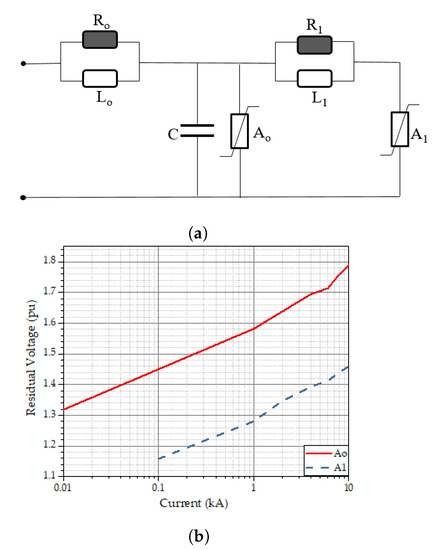
Figure 3.
Frequency-dependent metal oxide surge arrester: (a) Model. (b) VI characteristics of the nonlinear resistances.
Table 4.
Lumped parameters of the frequency-dependent surge arrester model.
2.7. Bipolar Lightning Stroke Parameters
The bipolar lightning source model presented in this research abide by the parametric values and the pattern of data available on the subject in the literature. The positive peak current was found to be comparatively higher than the negative peak current in most cases and 76% of bipolar lightning strokes change their polarity from positive to negative [28]. Bipolar lightning flashes have been divided into a four-step process (see Figure 4).
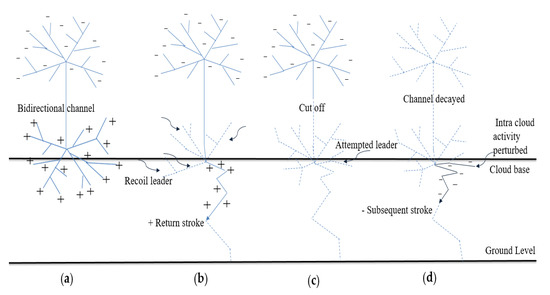
Figure 4.
Illustration of a bipolar lightning stroke event. (a) A bidirectional flash start developing inside the cloud, which has accumulated negative charges on the upper side of the cloud and the positive charges at its base. (b) A positive return stroke to a grounded object takes place; when in the lower end of the cloud, recoil leaders form a dense positive lightning tree. (c) After this incident, the bidirectional flash is cut into half. (d) The subsequent stroke of the negative polarity is caused by the attempted leader, which is formed when the inactive recoil leader outside the cloud comes into contact with the active recoil negative leader in the cloud.
For the dimensioning of the modeled bipolar lightning stroke, the following parameters are of prime significance, which are as follows:
- two peak current magnitudes of lightning strokes (positive and negative);
- two rise and decay times;
- the mid-interval between the first and the subsequent stroke;
After the modeled HVDC system reached its steady state value of ±500 kV, at 6.5 ms the first positive stroke of the bipolar lightning is initiated, which is then followed by a negative stroke that is 3 ms apart from the previous stroke. As shown in Figure 5, a time delay is created, representing the mid-interval.
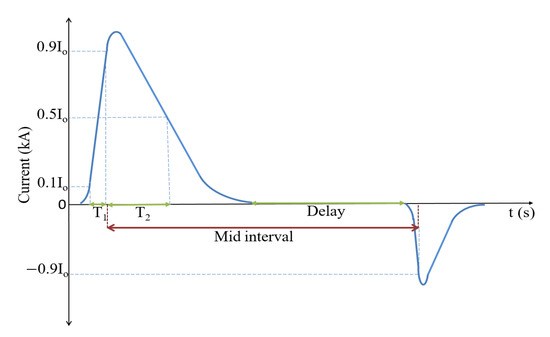
Figure 5.
Graphical representation of the modeled bipolar lightning stroke.
Lightning strokes are modeled conventionally as current sources. Two Hiedler functions [29] have been used to simulate two strokes of bipolar lightning sequentially, as given by Equation (11):
controls the amplitude of the peak current, is the correction factor, and define the current rise and decay times, respectively, and n is the concave factor, which controls the waveform steepness. The values of these constants for stroke on the OHPC and OHGW are listed in Table 5.
Table 5.
Parameters for the lightning current impulse.
The current correction factor has been chosen as equivalent to 1 because it is a function of the current time parameters, and the ratio between the time constants () is set such that it is greater than 10. These sets of values reduced the error rate to less than 1%, demonstrating the validity of the selection criteria. The modeled bipolar lightning waveform has coherence with a naturally recorded one, as is evident from [30]. The lightning channel impedance is estimated by connecting a resistance of 400 in parallel to the lightning source [31].
3. Results and Discussion
3.1. Case Study 1: Stroke on OHPC
OHGW provides a shadow over the pole conductors for the sake of protection against lightning strokes in proximity of the transmission line. However, lightning strokes of comparatively lesser magnitudes bypass the shielding wire and hit the underneath conductor. This phenomena is illustrated in Figure 6 in which A, B and C represent the names of imaginary circles to better illustrate the concept behind attractive radius.
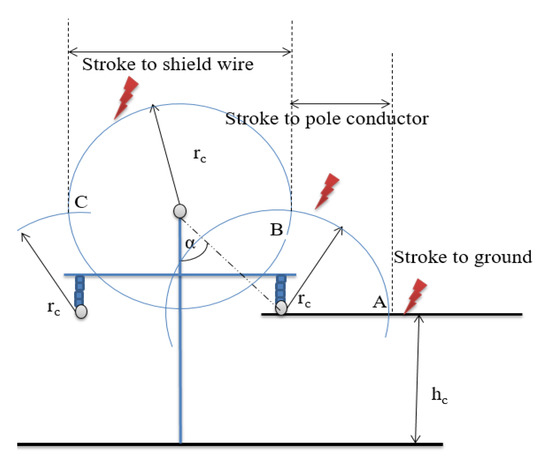
Figure 6.
Striking distance and shielding effect in the electrogeometric model of the tower.
The attractive radius of the tower is dependent upon the power rating and height of the tower [32]. The high power rating and tower’s height make the line more vulnerable to shielding failures and the effectiveness of the grounding wires become frail. To mitigate this, the height of the tower is increased and the shielding angle is decreased [33]. To study shielding failure, the EGM is used. According to the guidelines in [34], the maximum shielding failure current () for the given tower geometry is 36 kA, using Equation (12):
is the shielding angle, the constants X and Y take values of 10 and 0.65, respectively, is the conductor height in m, and is the ground wire height in m. As a result of SF, when the bipolar stroke hits the positive OHPC of the transition tower; overvoltage increases up to 3 pu due to the first stroke, and minor polarity reversal is seen due to the subsequent stroke, as shown in Figure 7a. In the case of a bipolar lightning stroke to the negative pole, critical voltage polarity reversal can be seen as in Figure 7b due to the first stroke, while the subsequent stroke causes overvoltage.
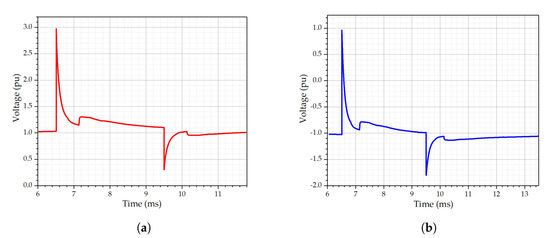
Figure 7.
Voltage at the sending end of the cable as lightning hits: (a) Positive OHPC. (b) Negative OHPC.
When lightning hits the negative OHPC, critical polarity reversal takes place due to the first lightning stroke (−1 pu to 1 pu at 60 km cable length), while the subsequent stroke causes overvoltage in UGC, as seen in Figure 8a,b. The cable will accumulate space charge due to this polarity reversal, accompanying enhancement in the local fields in its insulation, which will have a severe impact on its electrical strength. The voltage levels at the cable terminals in the cases of overvoltage produced due to subsequent stroke stay within a safe range, but there exists a potential threat of cable insulation breakdown due to polarity reversal. At the receiving end of long cable sections, polarity reversal due to the first stroke is sufficiently reduced compared to the overvoltage due to the subsequent stroke, as shown in Figure 8c,d. In shorter cables, the subsequent stroke arrives before the voltage returns to the system rated voltage after the first stroke, where the system voltage takes longer to normalize because the propagation constant of the cable is short compared to the tail time of the lightning stroke; this causes a constructive super position of the forward and backward traveling waves. Thus, the disturbances persist for longer times at cable terminals.
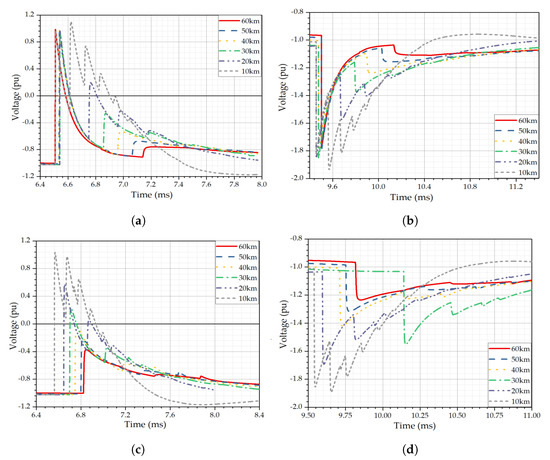
Figure 8.
Pole-to-ground voltage at cable terminals due to the SF of the negative pole conductor. (a) Voltage at the cable sending end due to the 1st stroke. (b) Voltage at the cable sending end due to the subsequent stroke. (c) Voltage at the cable receiving end due to the 1st stroke. (d) Voltage at the cable receiving end due to the subsequent stroke.
Direct stroke onto the positive pole conductor resulted in a buildup of overvoltage due to the first stroke and the small polarity reversal in the case of the subsequent stroke. The overvoltage due to the first stroke at cable terminals is above the LIWL of the cable, as shown in Figure 9. Therefore, the application of SA is unavoidable for the protection of the cable insulation from permanent failure.
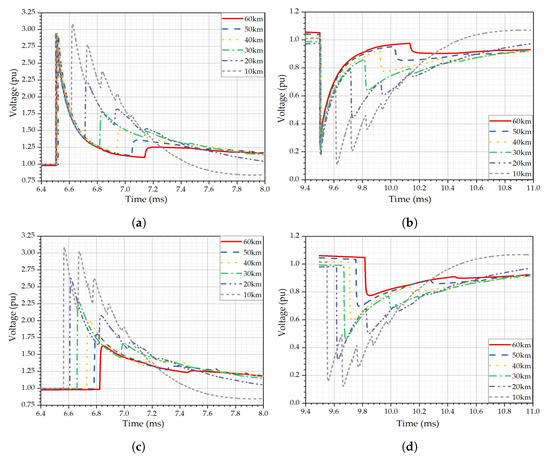
Figure 9.
Pole-to-ground voltage at cable terminals due to the SF of the positive pole conductor. (a) Voltage at the cable sending end due to the 1st stroke. (b) Voltage at the cable sending end due to the subsequent stroke. (c) Voltage at the cable receiving end due to the 1st stroke. (d) Voltage at the cable receiving end due to the subsequent stroke.
Overvoltage produced at cable terminals due to the first stroke is more alarming, as it is above the threshold level of cable insulation, which is evident from Figure 9a,c. After the application of SA, the overvoltage at the cable terminals is decreased along with the threat of cable insulation failure. However, the overvoltage is still above the LIPL of the SA as shown in Figure 10.
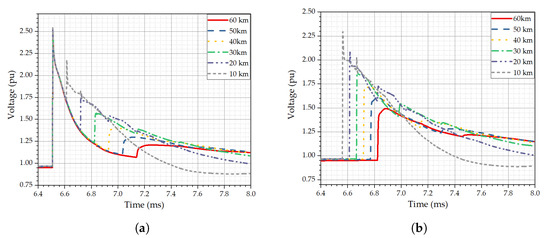
Figure 10.
Supressed voltage at the cable terminals after the application of SA: (a) Voltage at the cable sending end. (b) Voltage at the cable receiving end.
The energy absorbed by the SAs at the cable terminals is given in Table 6. As the cable length gets shorter, there is an increment in the energy dissipated by the SAs, and the energy absorption at the receiving end of cable gets larger than that at the sending end; this is because of increased reflections from the cable in a comparatively smaller time.
Table 6.
Absorbed energy by the SA at the cable sending and receiving ends due to the SF of the positive pole conductor.
In cable lengths shorter than 10 km, the overvoltage levels due to the first and subsequent strokes are shown in Figure 11a,b, respectively. The voltage at the receiving end of the cable was greater than at the sending end, due to the constructive superposition of reflected waves inside the cable. This does not occur in longer cables due to the greater attenuation constant of such cables.
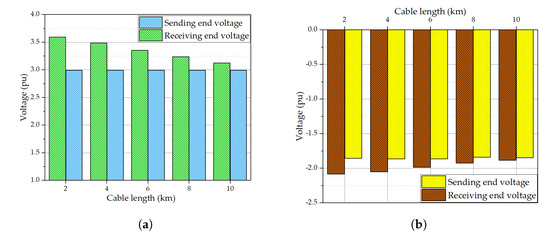
Figure 11.
Pole-to-ground overvoltage at the cable terminals with varying cable lengths: (a) Over voltage due to the first stroke at the positive pole. (b) Over voltage due to the subsequent stroke at the negative pole.
3.2. Case Study 2: Stroke on OHGW
In response to the direct stroke at the top of the adjacent and subsequent towers at the cable entrance, BFO took place due to the negative subsequent stroke of bipolar lightning. This is because of the short front time of the negative subsequent stroke compared to the positive first stroke. In comparison to the negative OHPC, the positive OHPC was already under more stress due to the sequence of polarity of lightning strokes and due to the short front time of the subsequent stroke added to the impulse overvoltage. Meanwhile, the overvoltage stress developed on the insulator of the negative pole conductor in response to the positive first stroke to the tower top was comparatively small because of the intrinsic large front times of the positive lightning flashes.
Figure 12a shows the positive pole voltage of the cable at its sending end due to the BFO at the subsequent tower. Multiple backward reflecting waves from the surroundings of the subsequent tower contributed to its BFO. These include four major opposite polarity reflected waves: one from the base of the incident tower itself, two from the base of the neighboring towers (left and right) of the incident tower, and one from the cable entrance when the riser section lengths are shorter than 200 m. In the case of riser section lengths greater than 150 m, no BFO occurred mainly because the reflection from the cable entrance died down by the time it reached the subsequent tower due to the larger distance between the lightning stroke location and cable entrance.
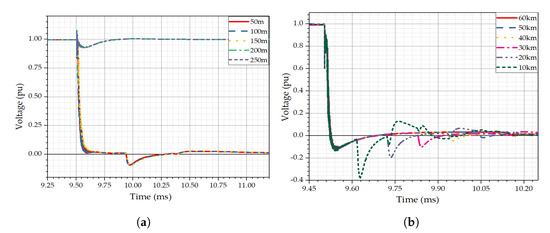
Figure 12.
Behavior of the cable positive pole-to-ground lightning overvoltages due to the BFO on different tower locations: (a) On the subsequent tower at a 40 km cable length as the riser section length varies. (b) On the adjacent tower at a 180 m riser section length as the cable length varies.
At the adjacent tower with a 10 footing resistance, BFO occurred despite the varying cable lengths, as shown in Figure 12b. This happened specifically at the 180 m riser section length because at this length, the backward reflected wave from the cable receiving end combines with the backward traveling wave from the cable entrance.
3.3. Effect of Tower Footing Impedance
At the 50 m riser section length, there is no significant variation in the cable core to the ground voltage despite the varying values of the adjacent tower footing resistance. This is due to the contributions of three major reflection waves, which have opposite polarity to that of the incident lightning subsequent stroke. One of them is a backward reflected wave from the cable entrance due to the difference in surge impedance of the OHPC and cable core impedance. The remaining two are upward reflecting waves from the base of the towers due to the difference in the surge impedance of the tower footing resistance and the impedance of tower lower segment: one coming from the base of the adjacent tower itself and the other from the base of the neighboring subsequent tower on the left. The effects of the reflected waves from the base of the towers beyond the subsequent tower are negligible. Note that with an increase in the tower footing resistance, the magnitude and frequency of the opposite polarity reflected wave from the tower base will decrease, but this effect is compensated by the shorter riser section length, which offers a smaller travel time and attenuation for the reflection wave at the cable entrance to reach the adjacent tower. Thus, increasing the footing resistance of the tower adjacent to the cable entrance with a shorter riser section will not result in BFO.
These reflected waves will attenuate the voltage stress at the lightning strike location, which is at the adjacent tower and will prevent insulation failure. Similarly, despite the varying riser section lengths, no ground fault occurred with a smaller footing resistance of the adjacent tower, as depicted in Figure 13a; the length of the cable is kept constant at 40 km in this case study, due to which the tail of waveforms seem to be constant. However, BFO will occur inevitably in cases where the riser section length increases along with the footing resistance of the adjacent tower; both of these sufficiently reduce the magnitude of the reflected waves and cause BFO, as shown in Figure 13b–d.
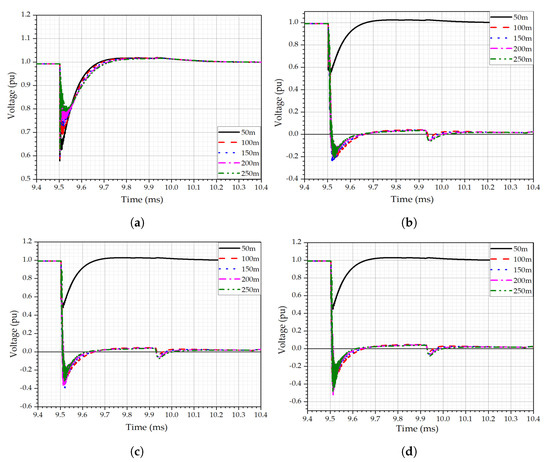
Figure 13.
Behavior of the cable positive pole voltage due to the BFO on the adjacent tower; as the riser section length and tower footing resistance changes. (a) 10 W footing resistance, (b) 20 W footing resistance, (c) 30 W footing resistance, and (d) 40 W footing resistance.
4. Conclusions
Insulation coordination strategy for underground cables is based upon the standard industry test waveshape (10 kA, 8/20 s), and in adverse situations at an unprotected cable terminal, the surge doubles. As shown in our previous research work, for an exceptionally high-magnitude unipolar lightning stroke, the overvoltage exceeded the LIPL of only unprotected shorter cables [35]. In case of bipolar lightning strokes even with minimal lightning stroke parameters, the voltage surge at the cable terminals exceeds the assumed margin of the worst-case scenario for cable insulation.
This work outlines the transient response of a mixed HVDC transmission line due to a bipolar lightning stroke and provides a critical assessment of the vulnerabilities. A detailed investigation of overvoltages produced by the multi-flash lightning strokes is essential before proposing a coherent strategy for insulation coordination. The insulator flashover of OHLs produces lightning overvoltages, which originate multiple reflecting waves from the base of towers and cable entrance, leading to an increase in the risk of cable insulation failure, due to dual polarity reversal along with the strokes of bipolar lightning. The following are the findings of this research.
- (1)
- In the case of a bipolar stroke on OHGW, the voltage stress caused insulator flashover of the positive pole due to the subsequent lightning stroke and the contribution of reflected waves from the first stroke. For unipolar lightning strokes, BFO occurs only under exceptional lightning and grounding conditions. Meanwhile, in this work, it is obvious from Table 5 that extreme lightning parameters are not selected; hence, there is a high likelihood of insulator flashover for bipolar lightning strokes.
- (a)
- BFO occurred at the adjacent tower due to the subsequent stroke when the footing resistance of the tower and the riser section length were both large. At smaller riser section lengths, no BFO took place despite the varying footing resistance due to reflection waves from the cable entrance, the adjacent tower, and its neighboring tower base. Strong backward reflected waves from the cable entrance at shorter riser section lengths compensate for the effect of increased footing resistance of the adjacent tower, and no BFO occurred despite the rising footing resistance. Similarly, no BFO took place with a smaller tower footing resistance and varying riser section lengths.
- (b)
- At the subsequent tower with riser section lengths greater than 150 m, no BFO occurred due to sufficient attenuation of the backward reflected waves from the cable entrance.
- (2)
- The SF of the positive OHPC caused overvoltage at the cable terminals, which was above the LIPL of the cable, and the energy dissipated by SA increased with decreasing cable lengths.
- (3)
- The small propagation time in shorter cables enabled the constructive superposition of the forward and backwards traveling waves, particularly in cables shorter than 10 km, and the voltage at the receiving end of the cable was greater than that at the sending end.
- (4)
- No BFO took place under normal conditions after applying the SA on the cable terminals for the adjacent and subsequent towers. However, for the worst choices of tower footing and riser section lengths for the adjacent tower, insulator failure occurred despite the application of SA.
This work analyzes the risks of damage caused by bipolar strokes to the mixed HVDC links instead of proposing a complete insulation coordination strategy. Future discussions can propose cost-effective lightning protective solutions with a nominal rating of SAs to avoid overvoltage and polarity reversal due to multiple strokes in short cable sections.
Author Contributions
Conceptualization, A.S. and B.-w.L.; methodology, A.S.; software, A.S. and K.-H.P.; validation, A.S.; resources, A.S. and B.-w.L.; writing—original draft preparation, A.S.; writing—review and editing, K.-Y.S. and B.-w.L.; supervision, B.-w.L. All authors have read and agreed to the published version of the manuscript.
Funding
This research received no external funding.
Data Availability Statement
Not applicable.
Conflicts of Interest
The authors declare no conflict of interest.
References
- Jovcic, D. High Voltage Direct Current Transmission: Converters, Systems and DC Grids; John Wiley & Sons: Hoboken, NJ, USA, 2019. [Google Scholar]
- Overvoltages on HVDC Cables: Final Report. In Brochures: International Conference on Large High Voltage Electric Systems; CIGRE Green Books; Springer: Cham, Swizterland, 1994.
- Balog, G.; Gustavsen, B. Transient voltages affecting long cables. ELECTRA 2005, 15, 23–27. [Google Scholar]
- Shim, E.; Woo, J.; Han, S.; Moon, J. Lightning characteristics in Korea and lightning performance of power systems. In Proceedings of the IEEE/PES Transmission and Distribution Conference and Exhibition, Yokohama, Japan, 6–10 October 2002; Volume 1, pp. 534–539. [Google Scholar]
- Rakov, V. A review of positive and bipolar lightning discharges. Bull. Am. Meteorol. Soc. 2003, 84, 767–776. [Google Scholar] [CrossRef]
- Wagner, C. Electrical Transmission and Distribution: Reference Book; Westinghouse Electric Corporation: Pittsburgh, PA, USA, 1950. [Google Scholar]
- Schulz, W.; Diendorfer, G. Bipolar flashes detected with lightning location systems and measured on an instrumented tower. In Proceedings of the VII International Symposium on Lightning Protection, Curitiba, Brazil, 17–21 November 2003; University of Sao Paulo Institute of Electrotechnics and Energy: Curitiba, Brazil, 2003; pp. 6–9. [Google Scholar]
- Grebovic, S.; Pack, S.; Sadovic, S. An EMTP–RV based analysis of the line surge arrester energy duty due to lightning discharges. In Proceedings of the International Conference on Power Systems Transients IPST2015, Cavtat, Croatia, 15–18 June 2015. [Google Scholar]
- Grebovic, S.; Balota, A.; Oprasic, N. Lightning outage performance of power distribution line located in Mountain Lovćen area. In Proceedings of the 2020 9th Mediterranean Conference on Embedded Computing (MECO), Budva, Montenegro, 8–11 June 2020; pp. 1–4. [Google Scholar]
- Grebovic, S.; Oprasic, N. Influence of lightning channel impedance and nonuniform tower footing resistance distribution on line surge arrester energy duty. In Proceedings of the 2018 IEEE PES Innovative Smart Grid Technologies Conference Europe (ISGT-Europe), Sarajevo, Bosnia and Herzegovina, 21–25 October 2018; pp. 1–5. [Google Scholar]
- Geri, A. Behaviour of grounding systems excited by high impulse currents: The model and its validation. IEEE Trans. Power Deliv. 1999, 14, 1008–1017. [Google Scholar] [CrossRef]
- Greenfield, E. Transient behavior of short and long cables. IEEE Trans. Power Appar. Syst. 1984, PAS-103, 3193–3203. [Google Scholar] [CrossRef]
- Adi, N.; Vu, T.T.N.; Teyssèdre, G.; Baudoin, F.; Sinisuka, N. DC model cable under polarity inversion and thermal gradient: Build-up of design-related space charge. Technologies 2017, 5, 46. [Google Scholar] [CrossRef]
- Asif, M.; Lee, H.Y.; Khan, U.A.; Park, K.H.; Lee, B.W. Analysis of transient behavior of mixed high voltage dc transmission line under lightning strikes. IEEE Access 2018, 7, 7194–7205. [Google Scholar] [CrossRef]
- Silva, F.F.; Pedersen, K.S.; Bak, C.L. Lightning in hybrid cable-overhead lines and consequent transient overvoltages. In Proceedings of the International Conference on Power System Transients. International Conference on Power Systems Transients, IPST 2017, Seoul, Korea, 26–29 June 2017. [Google Scholar]
- Colla, L.; Gatta, F.; Geri, A.; Lauria, S. Lightning overvoltages in hv-ehv “mixed” overhead-cable lines. In Proceedings of the International Conference on Power Systems Transients, Lyon, France, 4–7 June 2007. [Google Scholar]
- Morched, A.; Gustavsen, B.; Tartibi, M. A universal model for accurate calculation of electromagnetic transients on overhead lines and underground cables. IEEE Trans. Power Deliv. 1999, 14, 1032–1038. [Google Scholar] [CrossRef]
- Mangelrød, B.G.G.I.R.; Kent, D.B.K. Transmission line models for the simulation of interaction phenomena between parallel AC and DC overhead lines. In Proceedings of the International Conference on Power Systems Transients, Budapest, Hungary, 20–24 June 1999. [Google Scholar]
- Furgał, J. Influence of lightning current model on simulations of overvoltages in high voltage overhead transmission systems. Energies 2020, 13, 296. [Google Scholar]
- Motoyama, H. Experimental study and analysis of breakdown characteristics of long air gaps with short tail lightning impulse. IEEE Trans. Power Deliv. 1996, 11, 972–979. [Google Scholar] [CrossRef]
- Cigre, W.G. Guide to procedures for estimating the lightning performance of transmission lines. CIGRE SC33 1991, 10, 31–33. [Google Scholar]
- Goll, F.; Witzmann, R. Lightning protection of 500-kV DC gas-insulated lines (GIL) with integrated surge arresters. IEEE Trans. Power Deliv. 2015, 30, 1602–1610. [Google Scholar] [CrossRef]
- LaForest, J. Transmission-Line Reference Book. 345 kV and Above; Technical Report; Large Transformer Div.; General...; General Electric Co.: Pittsfield, MA, USA, 1981. [Google Scholar]
- Martinez, J.A.; Castro-Aranda, F. Tower modeling for lightning analysis of overhead transmission lines. In Proceedings of the IEEE Power Engineering Society General Meeting, San Francisco, CA, USA, 12–16 June 2005; pp. 1212–1217. [Google Scholar]
- Maekawa, Y. Research and development of DC+/-500 kV extruded cables. CIGRE 2002. [Google Scholar]
- IEEE Guide for the Connection of Surge Arresters to Protect Insulated, Shielded Electric Power Cable Systems; IEEE Std 1299–996; IEEE: Piscataway, NJ, USA, 1997.
- IEEE working group 3.4.11 application of surge protective devices subcommittee surge protective devices committee. Modeling of metal oxide surge arresters. IEEE Trans. Power Deliv. 1992, 7, 302–309. [Google Scholar]
- Tian, Y.; Qie, X.; Lu, G.; Jiang, R.; Wang, Z.; Zhang, H.; Liu, M.; Sun, Z.; Feng, G. Characteristics of a bipolar cloud-to-ground lightning flash containing a positive stroke followed by three negative strokes. Atmos. Res. 2016, 176, 222–230. [Google Scholar] [CrossRef]
- Han, Y.; Li, L.; Chen, H.; Lu, Y. Influence of modeling methods on the calculated lightning surge overvoltages at a UHVDC converter station due to backflashover. IEEE Trans. Power Deliv. 2012, 27, 1090–1095. [Google Scholar] [CrossRef]
- Zhou, H.; Diendorfer, G.; Thottappillil, R.; Pichler, H.; Mair, M. Upward bipolar lightning flashes observed at the gaisberg tower. In Proceedings of the 2010 30th International Conference on Lightning Protection (ICLP), Cagliari, Italy, 13–17 September 2010; pp. 1–5. [Google Scholar]
- Bewley, L.V. Traveling waves on transmission systems. Trans. Am. Inst. Electr. Eng. 1931, 50, 532–550. [Google Scholar] [CrossRef]
- Eriksson, A. An improved electrogeometric model for transmission line shielding analysis. IEEE Trans. Power Deliv. 1987, 2, 871–886. [Google Scholar] [CrossRef]
- IEEE Working Group. IEEE Guide for Improving the Lightning Performance of Transmission Lines; IEEE Press: New York, NY, USA, 1997. [Google Scholar]
- Mikropoulos, P.; Tsovilis, T. Lightning attachment models and maximum shielding failure current of overhead transmission lines: Implications in insulation coordination of substations. IET Gener. Transm. Distrib. 2010, 4, 1299–1313. [Google Scholar] [CrossRef]
- Asif, M.; Lee, H.Y.; Park, K.H.; Shakeel, A.; Lee, B.W. Assessment of overvoltage and insulation coordination in mixed HVDC transmission lines exposed to lightning strikes. Energies 2019, 12, 4217. [Google Scholar] [CrossRef]


Publisher’s Note: MDPI stays neutral with regard to jurisdictional claims in published maps and institutional affiliations. |
© 2021 by the authors. Licensee MDPI, Basel, Switzerland. This article is an open access article distributed under the terms and conditions of the Creative Commons Attribution (CC BY) license (https://creativecommons.org/licenses/by/4.0/).