Article

Toward a Unified Model Approach for Evaluating Different Electric Vehicles

1
Department of Information Technology, College of Computers and Information Technology, Taif University, P.O. Box 11099, Taif 21944, Saudi Arabia
2
Department of Information Technology, Babasaheb Bhimrao Ambedkar University, Lucknow 226025, Uttar Pradesh, India
3
Department of Computer Science, College of Computers and Information Technology, Taif University, P.O. Box 11099, Taif 21944, Saudi Arabia
4
Department of BCA, Azad Degree College, University of Lucknow, Lucknow 226002, Uttar Pradesh, India
*
Author to whom correspondence should be addressed.
Energies 2021, 14(19), 6120; https://doi.org/10.3390/en14196120
Submission received: 9 September 2021 / Revised: 17 September 2021 / Accepted: 23 September 2021 / Published: 26 September 2021
(This article belongs to the Special Issue Vehicle and Traffic Safety)

Abstract

:
Considering rising pollution as well as fuel expenses, it has now become critical to transition to a sustainable method of transportation. As a result, automakers have begun to spend on research and development in the electric vehicle (EV) industry. The amount of EVs has expanded rapidly in recent years. This is owing to new improved technology, particularly in electric motor engineering, as well as government initiatives to limit the level of environmental impact produced by combustion engines. Because EVs are powered by electricity, implementing their charging stations presents certain complications. In this paper, we have discussed the different types of EVs, such as BEVs, FCEVs, HEVs, PHEVs, and REHEVs. Even though the capacity of many of these electric car models has been substantially enhanced within the past few years, some challenges remain as a selection barrier for several customers. Considering these challenges, we have also implemented a fuzzy AHP-TOPSIS-based unified model to evaluate the different types of EVs. The study’s technical importance is the identification of various evaluation factors, implementation of a unified model for measuring performance, and computation using the fuzzy MCDM technique. The outcomes of the unified model approach also were validated. We concluded that FCEVs are excellent for long journeys, and have the resources to cause minimal disruption.

1. Introduction

Currently, the world is facing environmental degradation and an energy crisis as carbon emissions increase rapidly. A dramatic shift from internal combustion engine vehicles (ICEVs) to electric vehicles (EVs) can be observed in the automotive sector. Because petroleum is the principal fuel utilized in ICE vehicles, which are a significant contributor to the overall environmental catastrophe, EVs are the perfect alternatives [1,2]. An EV is one that runs on electricity rather than an internal combustion engine, which produces energy by consuming a mixture of oil and gases. As a result, EVs are seen as a potential alternative to current-generation cars to counter increasing pollution, environmental degradation, natural resource depletion, etc. [3]. Although there has been a very long period of the notion of electric vehicles, they have attracted significant interest in the last decade in the face of increasing carbon emissions and the other repercussions of fuel vehicles in the ecosystem.
As environmental issues continuously increase, governments across the globe have implemented numerous carbon dioxide and nitrogen oxide emission limits. From those perspectives, EVs, primarily based on electricity, would be able to soon replace traditional internal combustion engine vehicles, utilizing state-of-the-art electronic power systems, engine motors, electricity-generation systems, production of sustainable energy, as well as smart grids. EVs may be split into hybrid EVs (HEVs), plug-in HEVs (PHEVs), and EVs, based on the current design of the power generation and the system content. Industrialized nations have aggressively established numerous economic considerations in recent times in order to further support electrical engineering firms and research initiatives. Indeed, in the past 10 years, the power electronics industry and its infrastructure have grown rapidly [4,5]. Vehicles generate much carbon pollution that enters our natural surroundings, exposing us to pollution and global warming. An electric vehicle is a big step towards improving the quality of the environment effectively. EVs receive their energy from their rechargeable batteries. These batteries not only control the vehicles, but they are also utilized to power the lights and wipers. The batteries of electric automobiles have higher fuel economy and have lower fuel costs than a conventional petrol car. It is the same kind of battery that is commonly required when a gasoline engine is running. The advantages of electric vehicles are clear. With the development of new technology that promises to decrease the charging durations in minutes, increase the range, and achieve efficient security and technology, there has never been a greater moment to move to an EV. Figure 1 shows the several benefits of using EVs.
Consumers anticipate additional technological advancements and the introduction of new variants. Consumer behavior in the electric vehicle market is shifting from early buyers and technophile buyers to widespread adoption. Substantial advancements in technology, as well as a greater range of electric vehicle models on the market, have influenced consumer purchasing preferences. Automobiles will remain as a primary factor in energy requirements. China, India, and the Middle East are increasingly placing so many new automobiles on the road that the usage of oil for transportation fuel will continue to expand, and by 2035, it will require 12% more barrels compared to 2016. However, after 2025, there will still be a serious challenge for electric vehicles. Market shares are expanding tremendously above forecasts, with battery advancements boosting quicker than anticipated. In the present basic case, we perceive that the accumulation of EVs will be almost 100 million by 2035, with a daily fuel demand of approximately one to two million barrels per day. Figure 2 shows the intense growth in the electric vehicle market as per the report [6] published by Wood Meckenzie.
The emergence of the EV industry triggered a global economic transformation. Therefore, evaluation of different EVs’ effectiveness is a significant and challenging task. There seems to be no ideal strategy for EV evaluation. Even a well-planned evaluation method may encounter difficulties. To meet this objective, multicriteria decision-making (MCDM) approaches are used in conjunction with the fuzzy set concept to establish a unified model for the effectiveness assessment of different EVs, given that each EV can have its own set of mechanisms and quality to evaluate. Furthermore, a lack of resource availability causes decision makers to make judgments under high ambiguity, resulting in unanticipated outcomes. As a result, dealing with ambiguous and contradictory information necessitates the use of a fuzzy-based unified model for collecting and organizing technical and analytical data. In this paper, we used a fuzzy-based unified model approach for evaluating the effectiveness of different EVs.
This research work is presented in different sections. Section 2 deliberates several similar existing pieces of literature. An overview of the different types of electric vehicles is discussed in Section 3, and Section 4 presents the method and results of this study. Section 5 recapitulates and concludes the research work.

2. Related Works

Wang et al. [7] presented an assessment of trust for the heterogeneous network of vehicles in sustainable development with electric vehicles. The benefits of low energy usage and high assessment precision were derived from the transport trust assessment compared to the standard trust evaluation process. Hashemnia and Asaei [8] analyzed various electric motors and compared the advantages of each motor with that which is more appropriate for EV deployments. The five basic types of electric engines were explored, including DC, induction, permanent synchronous magnet, switching reluctance, and brushless DC motors. In their study, they found that the induction motor technology had progressed more than the others, and that brushless DC and permanent magnet motors were much more appropriate than others for electric vehicles.
Prud’homme and Koning [9] presented a methodology in the form of a computerized model. It analyzed the expenses and efficiency of an electric vehicle in relation to a fuel-powered vehicle. This was a comparable assessment. It compared an electric automobile with a conventional car that provides approximately the same kind of service over a similar time. This was done from three main perspectives: customer costs, societal costs, and environmental impacts.
Iclodean et al. [10] demonstrated the flexibility of an electric car using four distinct battery types: lithium-ion (Li-ion), molten salt (Na-NiCl2), nickel metal hydride (Ni-MH), all with a similar reserve capacity of electrical power. The originality of this research was the application in a real-time computerized simulation of four different rechargeable batteries for EVs in a similar model, in order to assess the autonomy and effectiveness of these rechargeable batteries in the driving process.
Oh [11] discussed and determined which drivetrain arrangement was the best to use in a commercially obtainable test motor as a train for hybrid vehicles. The engine feature could be simulated, as well as the actual characteristics evaluated when used in the car for a distinct driving and operating condition. Qiu and Wang [12] carried out extensive research on the structure and operation of the electrically powered regenerative braking component of EVs. The contribution process and assessment methods provided by regenerative braking were addressed and assessed by the circulation of energy to enhance the energy effectiveness of EVs. They presented a methodology for the calculation of the renewable frequency contribution. Furthermore, a novel regenerative braking control approach was presented, termed the “Serial 2 control technique.” In addition, as a contrast control approach, two control techniques were provided, namely the “parallel control strategy” and the “serial one control strategy”.
Pfeiffer et al. [13] discussed the alternative time delay estimation (TDE) techniques. All options were evaluated by means of real data with EV energy trains. They focused not only on the correctness of the TDE, but also on computing performance to facilitate the operation of vehicle electronic control units (ECUs). Even modest noise, as well as offsets, were found in the measuring data in the recommended linear regression (LR) methodology, which were not suited for our purposes. The variance minimization (VM) technique is a good option. After the initial execution, it is not only noise-proof, but also very effective.
Song [14] presented an integrated framework to assess the consequences of various solutions for power management. Three energy management strategy (EMS) considerations were included in their suggested strategy. The first was the durability of the fuel cell. Fuel-saving was the second priority for assessing fuel efficiency, and was dependent on a dynamic algorithm created for optimal worldwide driving distances. The synthesis of weighted fuel-cell durability was the third priority for the EMS.
Wang et al. [15] presented an assessment indicator system for use patterns focused on data of the battery electric vehicle (BEV) to examine the use of car-sharing vehicles and private vehicles, in order to analyze their usability patterns. The assessment indicator system was built on the state transition strategy and defined the three-dimensional use pattern for BEVs. The time and space components of travels defined the time as and space properties of the pattern of use. The decisive dimension represented a decision-making pattern based on a perceptual psychological model as a reason for the state transformation at the microlevel.
Zhang et al. [16] investigated the requirements for charging stations while considering the plug-in electric vehicle (PEV) operational cost, as well as BEV feasibility. The area of research and PEV specifications were determined depending on the early cars used in the evolving trade market in California. An appropriate charging strategy based on 24 h travel trends was suggested to minimize operating costs. The findings demonstrated that the charging timelines were the main tool in minimizing PEV operating costs, while more charging locations offered to decrease advantages for plug-in hybrid electric vehicles (PHEVs).
This paper is unique in various ways [17,18,19,20,21,22,23,24,25]. First, in contrast to many other studies, our paper focuses on the expert-centric hierarchical structure for multicriteria decision making in the evaluation of different EVs. Second, this work presents a straightforward fuzzy-based unified methodology in the form of a computational model. This model helped to compare the efficiency of EVs to that of other types.

3. Different Types of Electric Vehicles

It is a very interesting opportunity to go shopping for cars, especially for people attempting to improve the ecosystem. The EV industry is changing fast, and one would then probably buy one of those five kinds of electrical vehicles (EVs) if they reached the conclusion that they wanted to buy or rent a car that is better for the atmosphere.

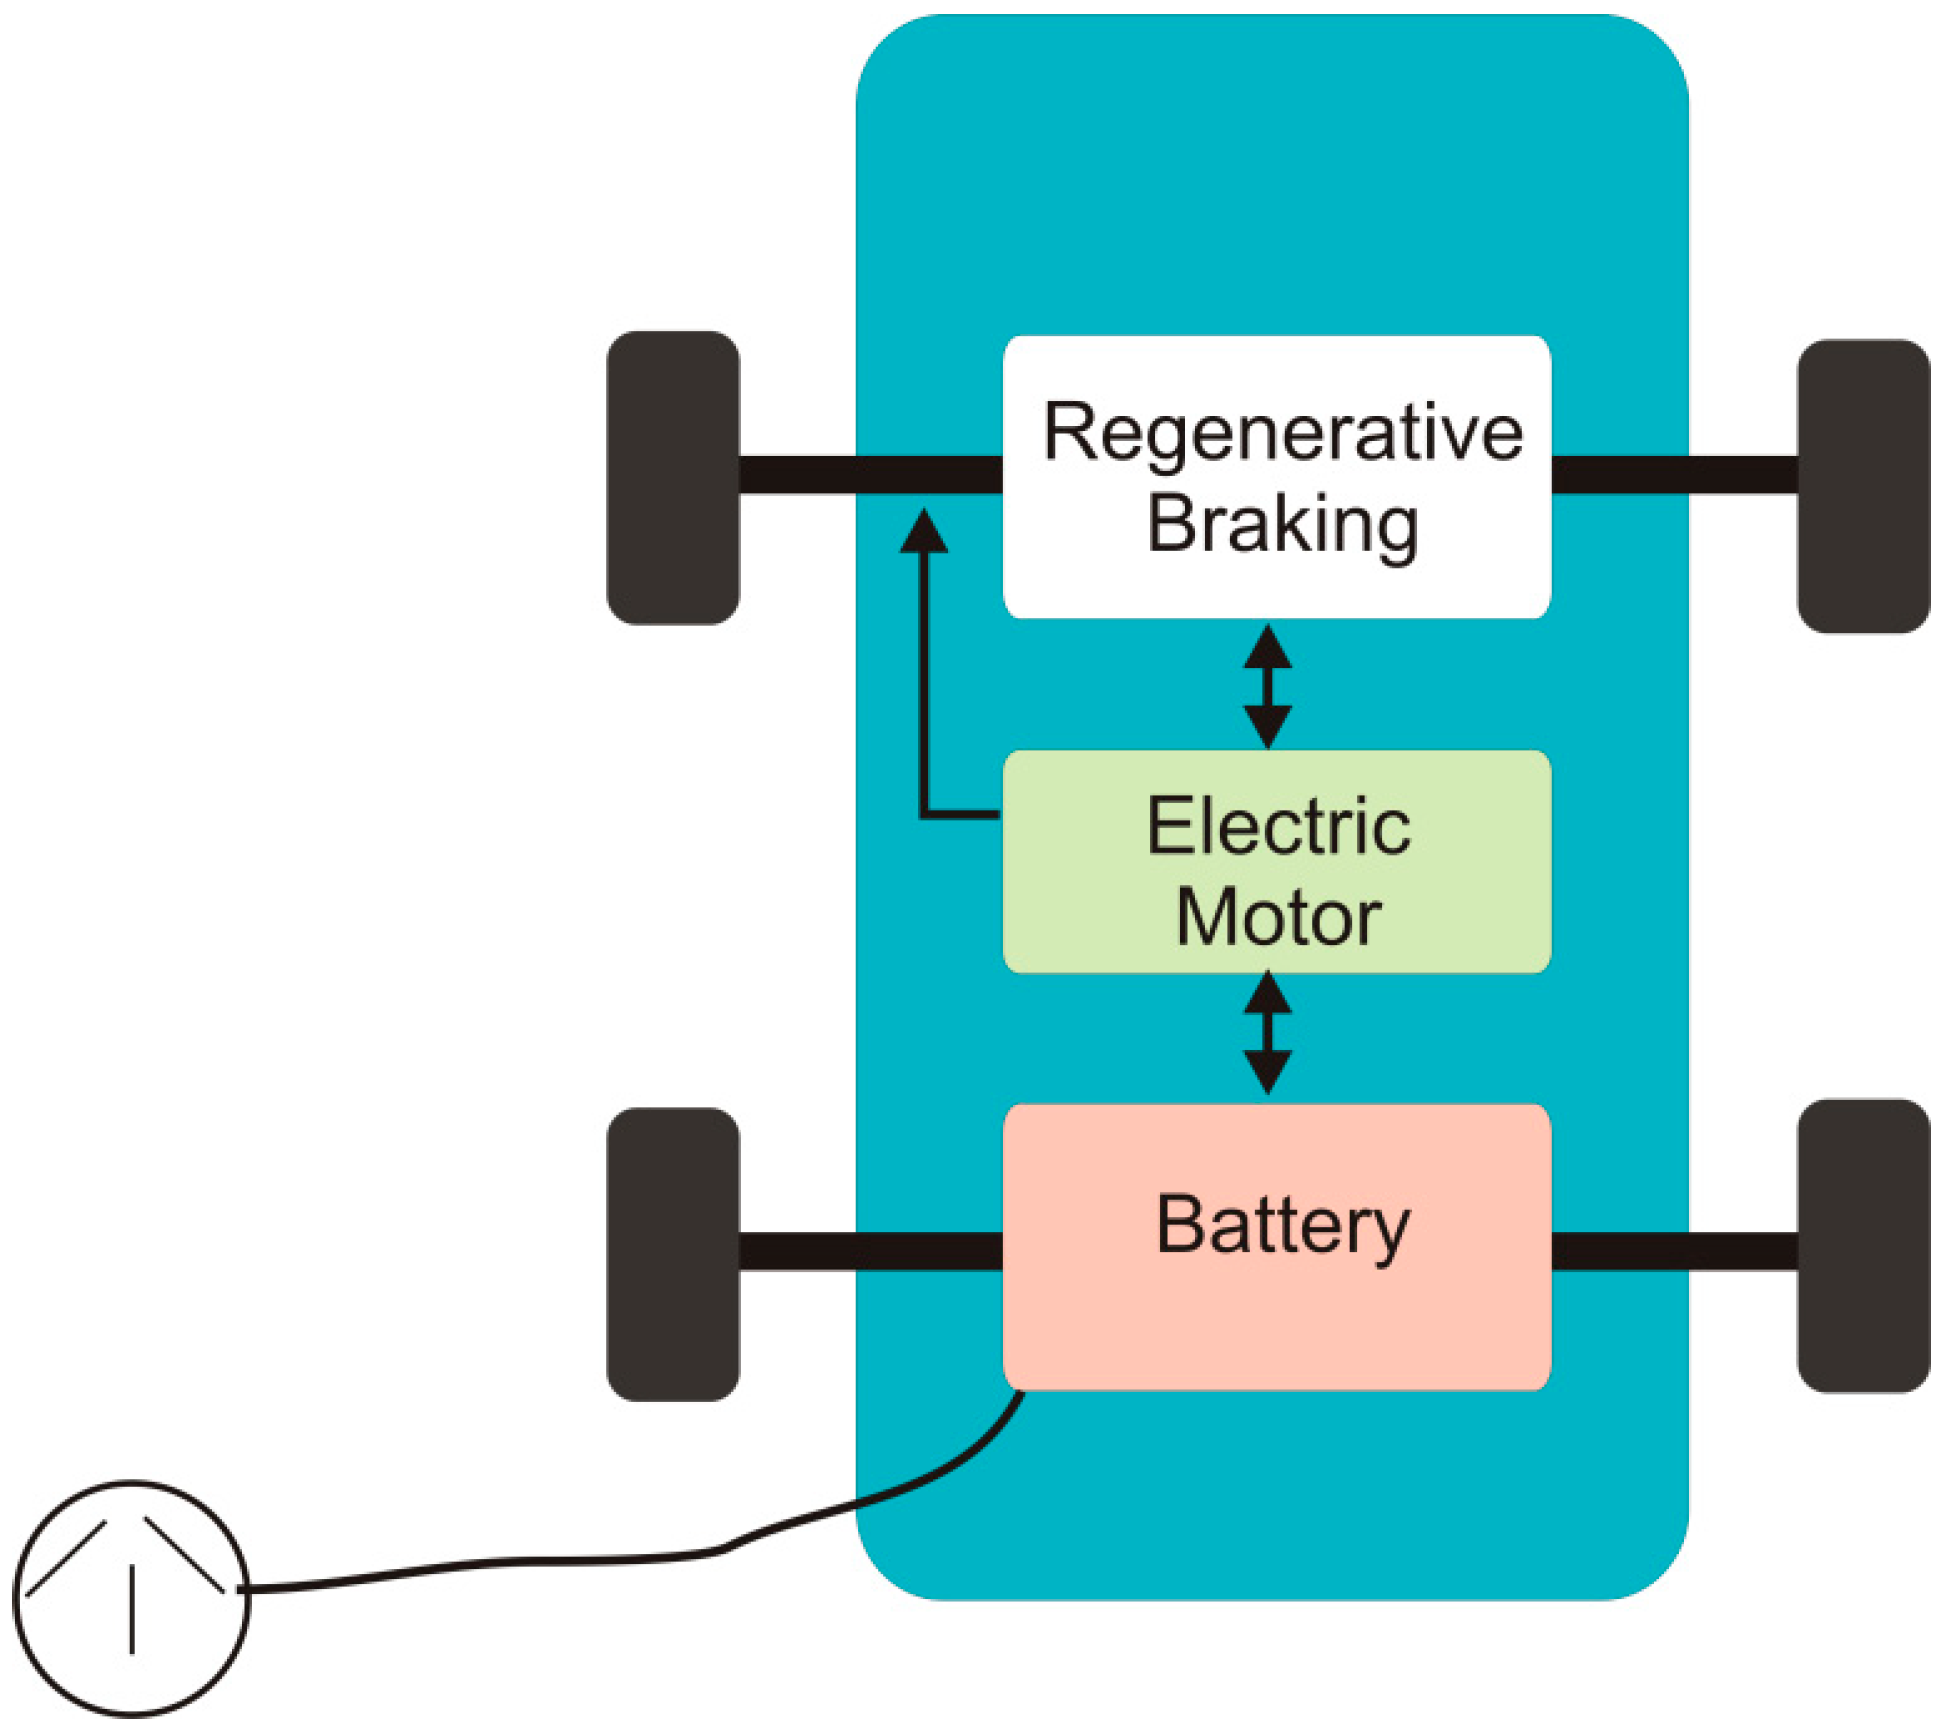
3.1. Battery Electric Vehicles (BEVs)

BEV denotes a battery electric vehicle that is operated by a battery-powered full electric engine. These are also called pure electric vehicles (PEVs) because they use only electricity as the primary source. The battery in these vehicles must be charged at regular intervals, often by connecting them to a charging station. One of the most significant barriers to BEV acceptance is “range anxiety” [26,27,28,29,30,31,32,33], which occurs when owners are concerned about being stuck in the middle of the highway with a completely depleted battery [17,18]. BEVs are capable of transforming about 80% of the power stored in the batteries into action. Teslas (all variants), the Nissan Leaf, and the Volkswagen e-Golf are a few examples of BEVs. Figure 3 shows the architectural diagram of battery electric vehicles.

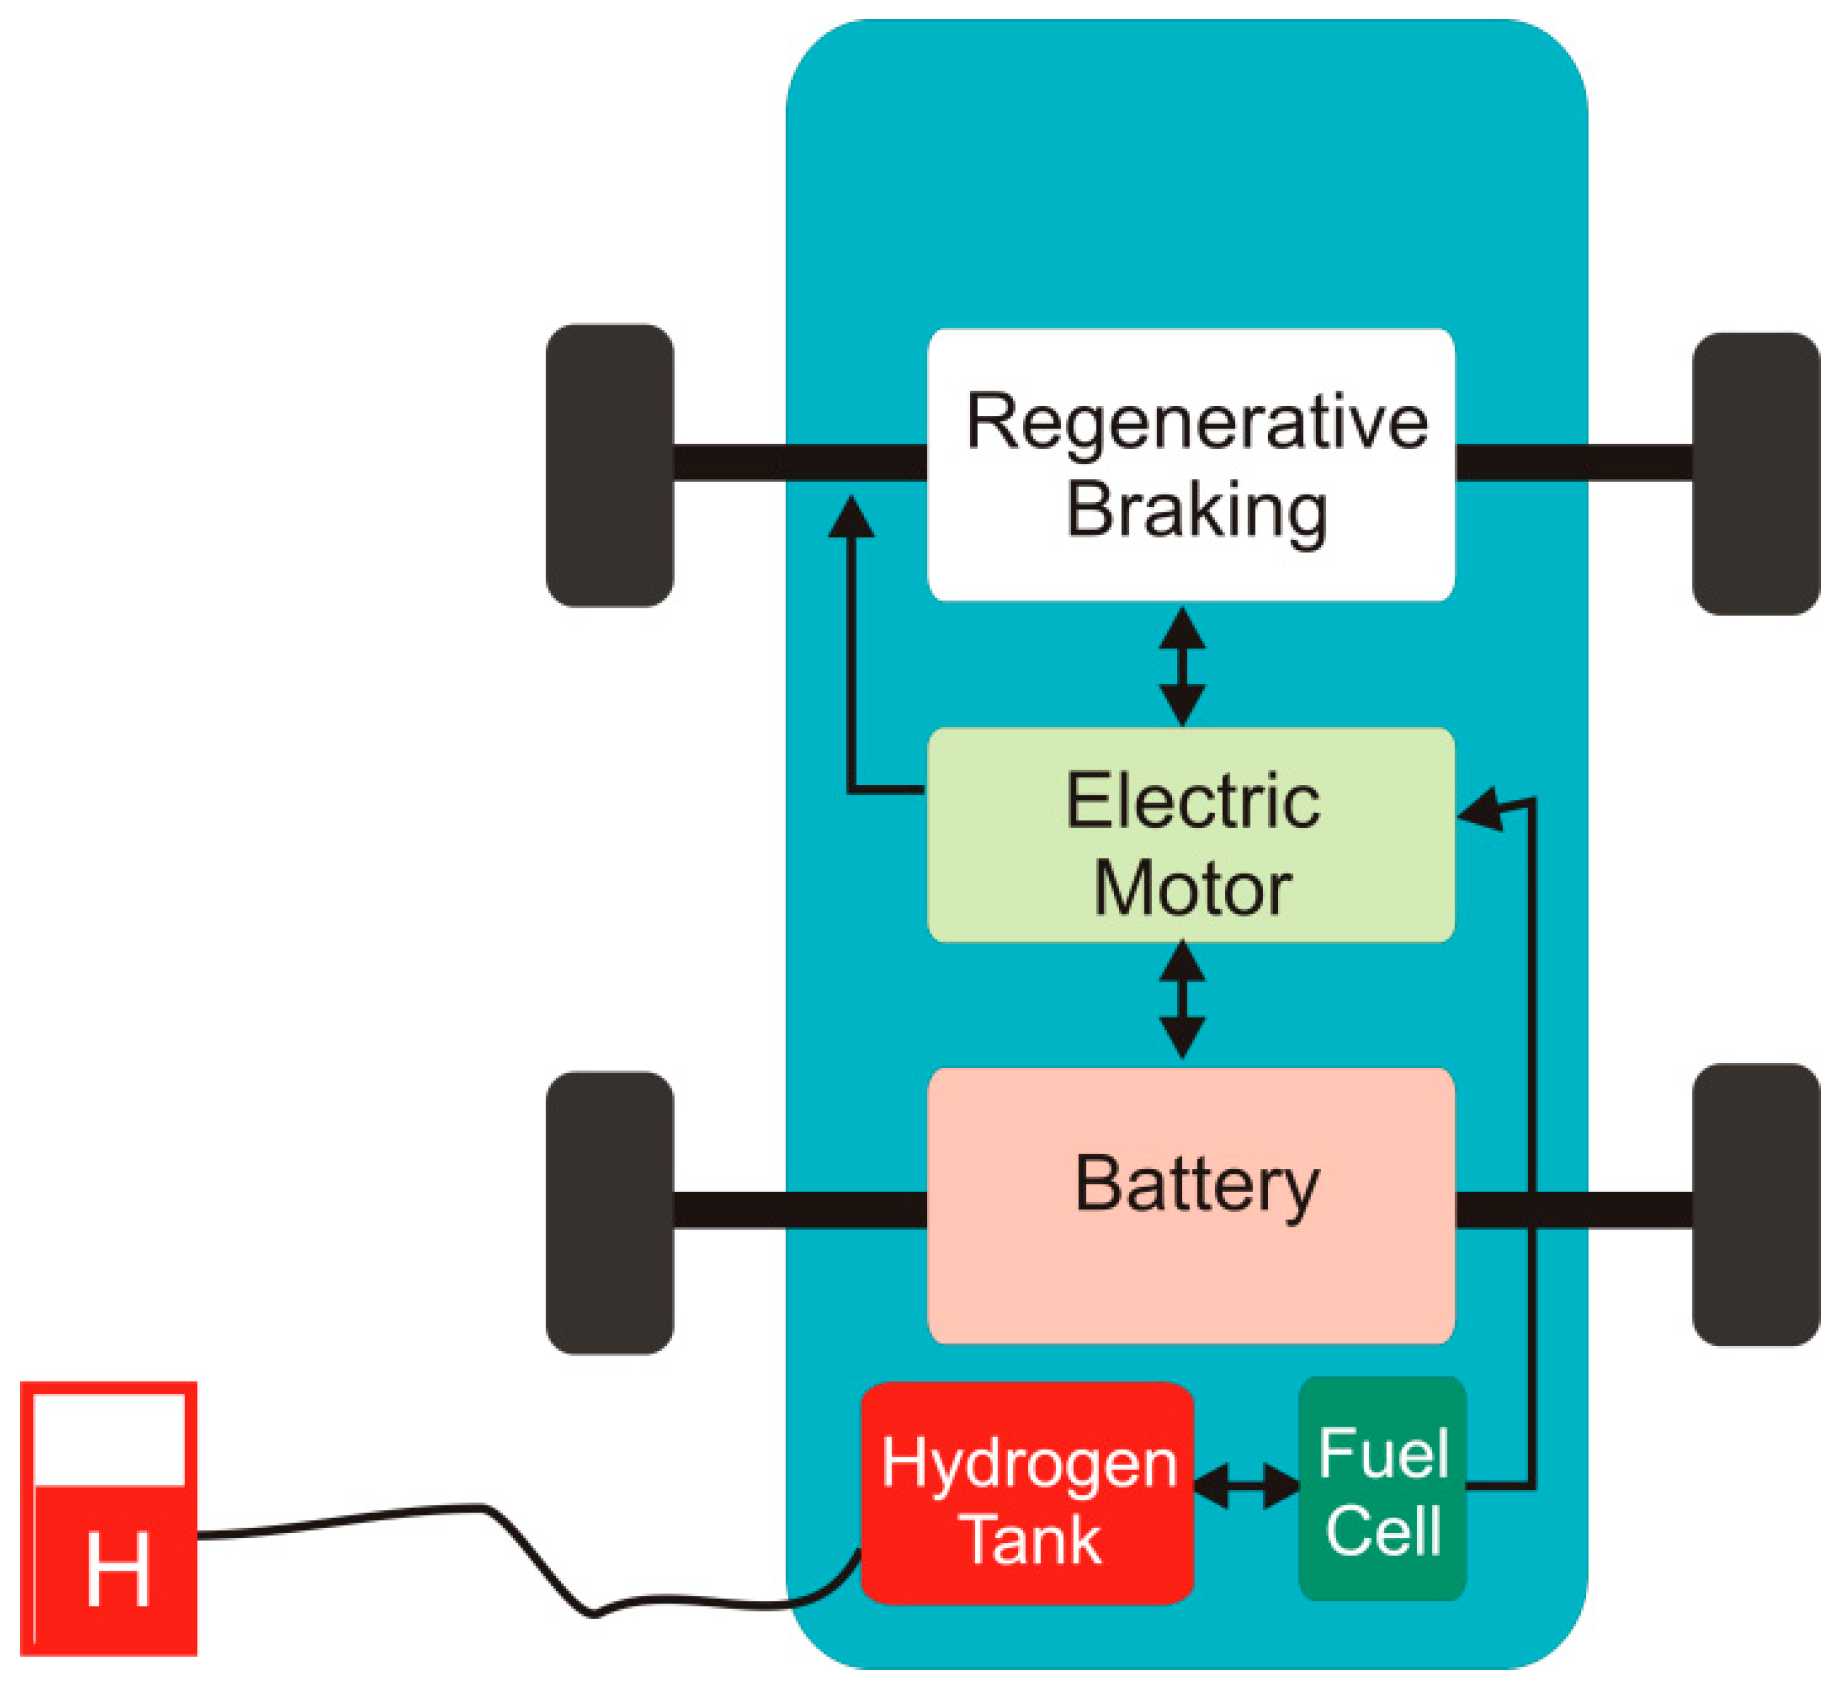
3.2. Fuel-Cell Electric Vehicles (FCEVs)

Fuel-cell electric vehicles (FCEVs) are different from other EVs. Fuel-cell EVs are powered by a fuel cell of hydrogen, and do not generate harmful emissions, only water vapor and warm air. In FCEVs, chemical power is transformed into electrical energy in the fuel cell; however, the hydrogen fuel is kept in a storage tank, therefore energy density and range are less likely to be an issue [19]. Like BEVs, FCEVs also primarily feature an electric motor, but employ a different storage and electricity supply technology. The propulsion battery in FCEVs is mostly substituted by the hydrogen tank, as well as by the chemical reaction, in which a number of fuel cells transform hydrogen into electricity as well as water vapor. The Toyota Mirai, Honda Clarity, and Hyundai Nexo are some examples of FCEVs. Figure 4 shows the architectural diagram of fuel-cell electric vehicles.

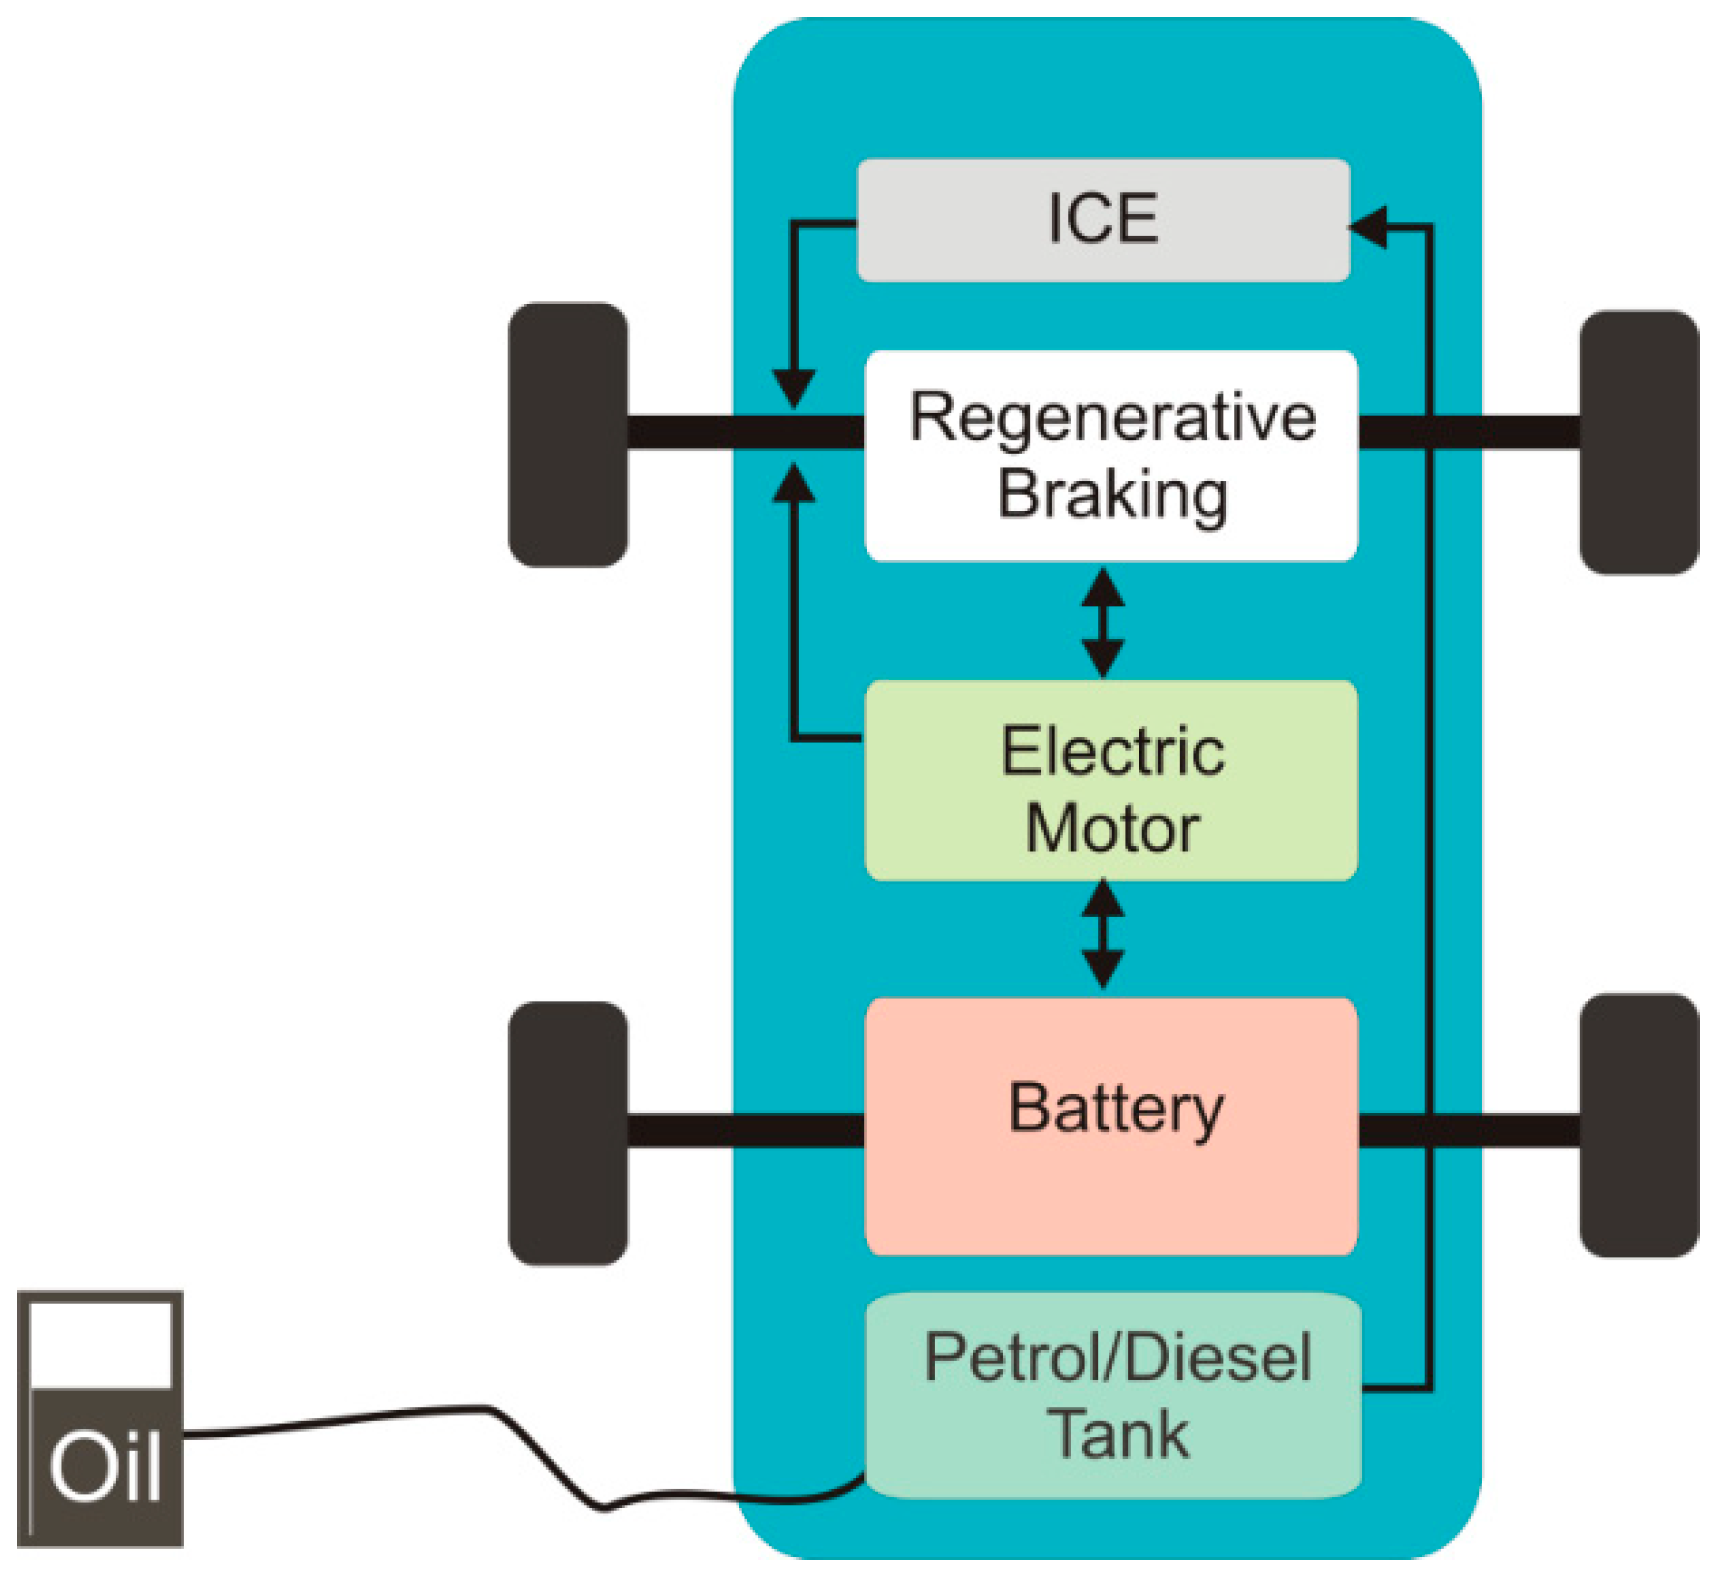
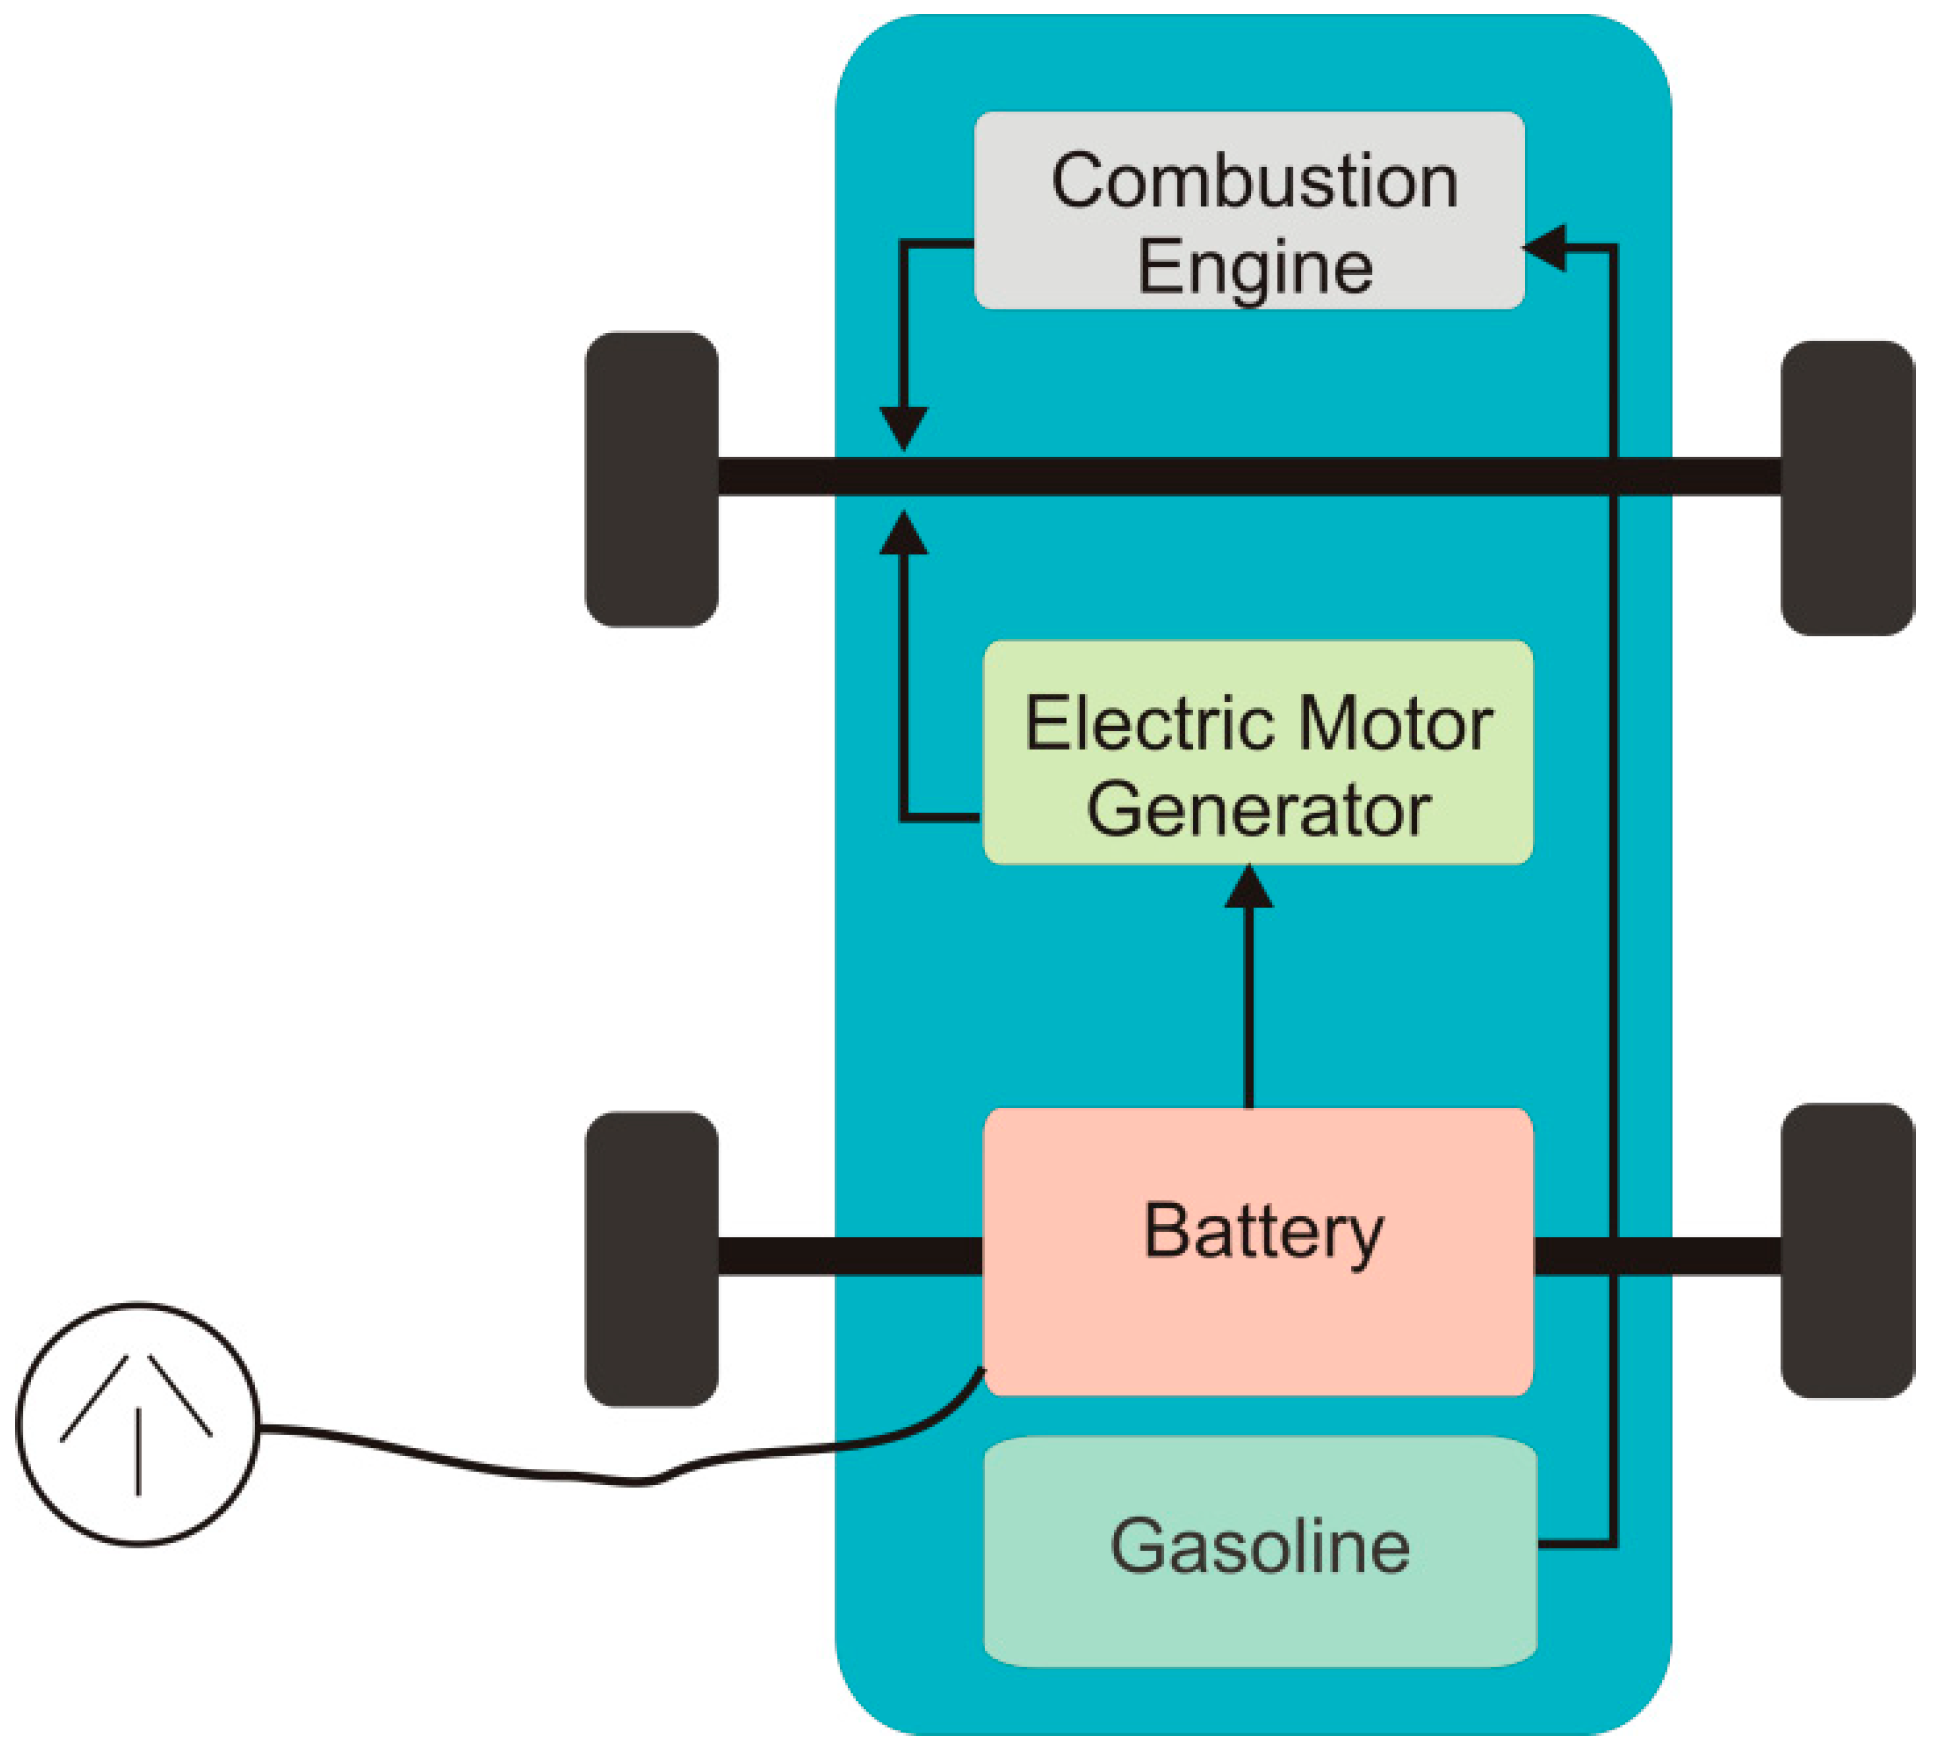
3.3. Hybrid Electric Vehicles (HEVs)

Hybrid electric vehicles are the most common type of EV. HEVs include a compact rechargeable battery that is not charged by plugging in, but instead by an inner combustion electric motor and/or the braking mechanism. The HEV is a multienergy system; unlike traditional vehicles that can only generate power, HEV batteries can both generate and absorb electricity. HEVs can already meet the needs of customers and therefore their numbers will increase at a quicker rate in the future. The key difficulty with HEVs is determining how to optimize the many sources of energy in order to achieve the optimum fuel economy or lowest pollution at the lowest cost [20]. There are various types of hybrids; however, on average, most are really battery-assisted automobiles instead of automobiles that are entirely powered by batteries. The Toyota Prius was first released in Japan in the late 1990s, and it made its way to the United States in 2001. Figure 5 shows the architectural diagram of hybrid electric vehicles.

3.4. Plug-In Hybrid Electric Vehicles (PHEVs)

Plug-in hybrid EVs (PHEVs) have relatively smaller rechargeable batteries than those of BEVs. The idea behind plug-in hybrids is to make short journeys powered by battery capacity. PHEVs are now becoming increasingly common. PHEVs are charged by either plugging into such an electric connection, or by using onboard energy generation. These vehicles have a limited selection in electric-only mode, and can operate at maximum throttle. PHEVs provide important fuel versatility. Although PHEVs contain a larger battery and a more robust motor compared to HEVs, the overall variety is still quite limited [21]. A plug-in hybrid, from a technical perspective, is basically a large hybrid with extra technology. The main distinction between a full hybrid and a plug-in hybrid (PHEV) is that the full hybrid EV battery is charged entirely by using internal combustion, whereas the plug-in hybrid’s expanded traction battery is also charged by using a charging station. This means that these plug-in hybrids can only go about 100 km on battery without any internal combustion engine ignition. In particular for tiny towns and short round-trip commutes, this is a significant advantage. This version also permits the lowest potential CO2 emissions between different hybrid systems. The Chevy Volt, Hyundai Ioniq PH EV, and VW Golf GTE are some examples of PHEVs. Figure 6 shows the architectural diagram of plug-in hybrid electric vehicles.

3.5. Range Extender Hybrid Electric Vehicles (REHEVs)

Range extender hybrid EVs are much like hybrid plug-in EVs; however, they are distinct in technology. REHEVs are most often regarded as PHEVs; however, REHEVs are often more powerful than PHEVs. The Chevy Volt is the most excellent example of a REHEV. This is arguably the appropriate choice for those who have experience in the EV market because it has a high all-battery portfolio and is driven by a combustion engine with which people are familiar. Figure 7 shows the architectural diagram of range extender hybrid electric vehicles.

4. Methods and Results

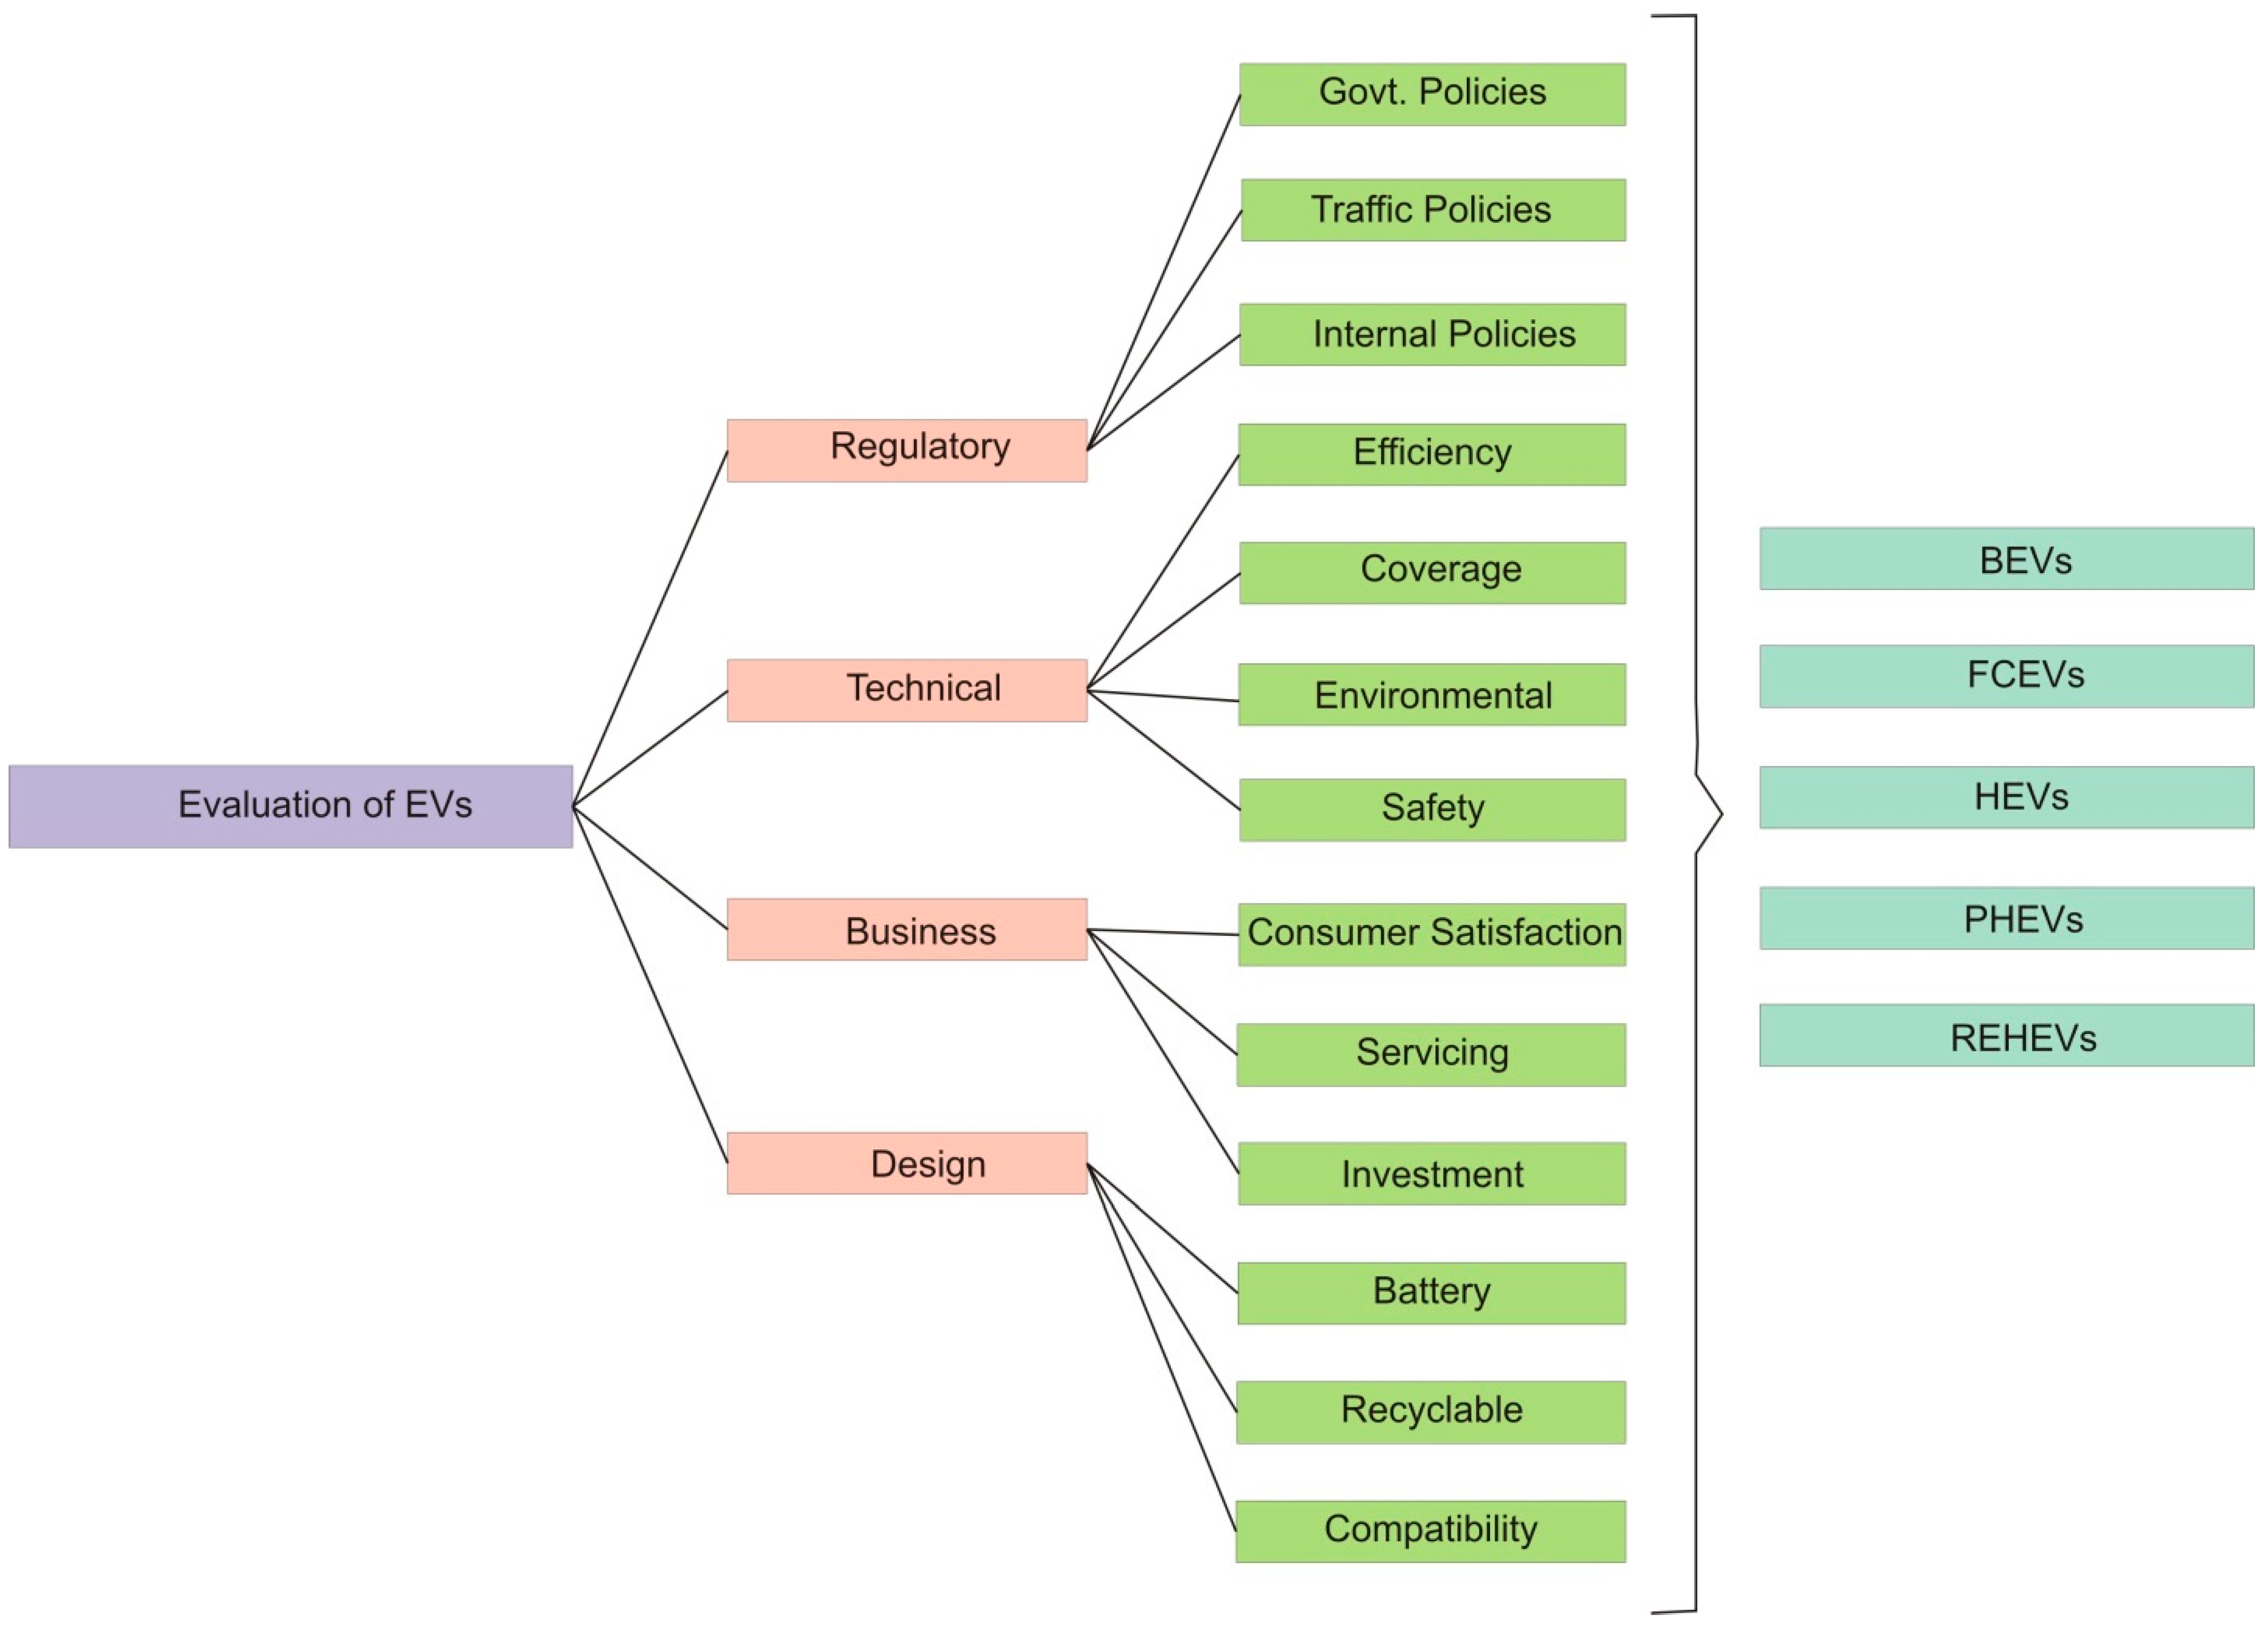
4.1. Hierarchical Design for the Evaluation of Different EVs

Electric vehicles are a revolutionary innovation that has yet to reach consumers outside of the “innovator” and “early adopter” groups in most regions [33]. Promoting a different and innovative technology creates hurdles, and the appropriate strategy may be quite beneficial in improving widespread approval. Under the challenges of energy efficiency and atmospheric pollution, several nations should reform their current energy utilization structure in order to minimize fuel energy demand and CO2 emissions. Acceptance of EVs has the potential to decrease reliance on foreign oil energy while also addressing specific environmental pollution issues. When compared to a regular gas-powered automobile, EVs have a significantly higher purchase price, lower availability of charging facilities, and a longer charging time, making people reluctant to acquire an EV. In this paper, we used a fuzzy AHP-TOPSIS-based unified technique to evaluate the different types of EV alternatives such as BEVs, FCEVs, HEVs, PHEVs, and REHEVs, which are represented as T1, T2, T3, T4, and T5, respectively.
As shown in Figure 8, the four significant criteria at level one and corresponding sub-criteria at level two in the present method that contributed to the evaluation of different EVs were clearly recognized and constructed based on a survey of the literature, as well as input from several automobile specialists. The primary factors at level one that can have a substantial impact on EVs performance were divided into five categories; i.e., regulatory, technical, business, and design, denoted by S1, S2, S3, and S4, respectively. The regulatory level included three subfactors; i.e., government policies, traffic policies, and internal policies, denoted by S11, S12, and S13, respectively. Further, the technical level included four significant subfactors; i.e., efficiency, coverage, environmental, and safety, denoted by S21, S22, S23, and S24, respectively. Furthermore, the business level included three subfactors; i.e., consumer satisfaction, servicing, and investment, denoted by S31, S32, and S33, respectively. Lastly, the design level included three subfactors; i.e., battery, recyclable, and compatibility, denoted by S41, S42, and S43, respectively. Figure 8 illustrates the hierarchical structure used for the multicriteria decision making in this research. This hierarchical structure assisted in evaluating the performance of five alternatives.

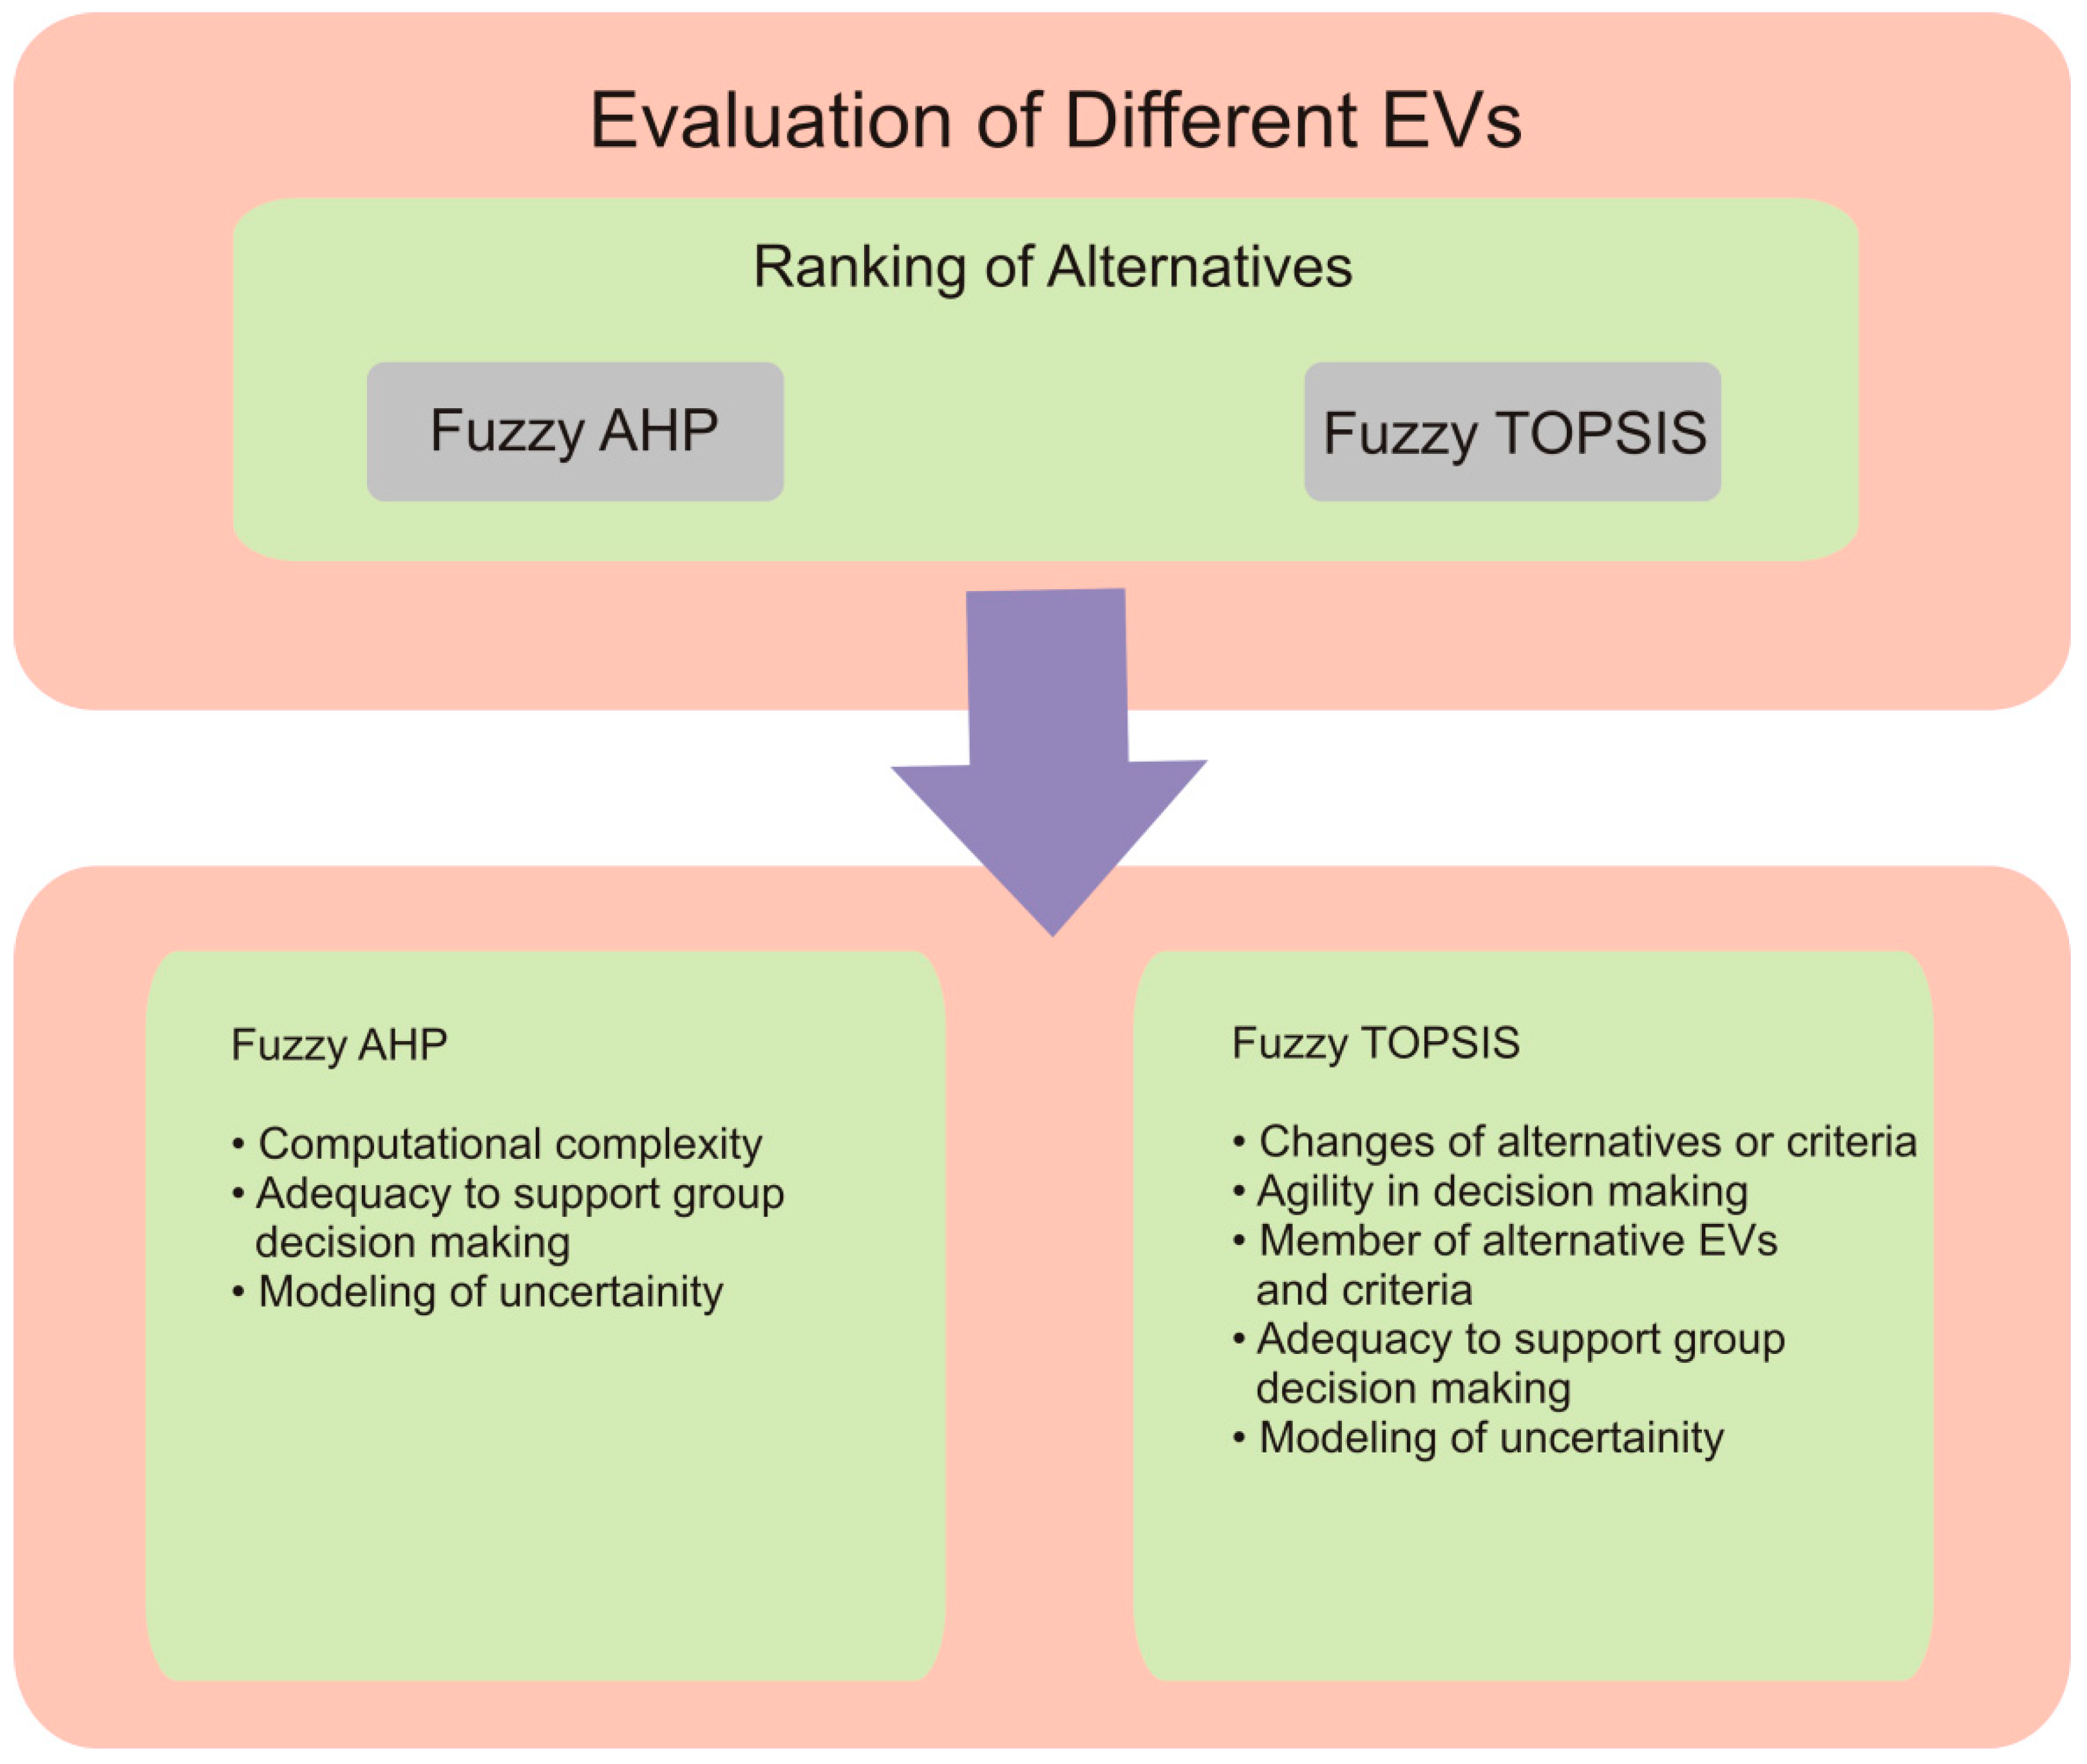
4.2. Fuzzy AHP-TOPSIS Methodology

The analytic hierarchy process (AHP) was introduced by Saaty in 1990 [22]. Both numerical and subjective aspects were taken into account in the decision-making procedure. Given that AHP uses a discreet scale of 1 to 9, this technique is usually criticized because it does not include uncertainty during the decision-making procedure. The fuzzy-AHP approach has also been utilized in other disciplines to tackle multicriteria challenges. This method was used by Haq and Kannan [23] to choose the best supplier in a delivery chain. This was utilized by Huang et al. [24] for R&D shortlisting. For the selection of the most appropriate method of bridge building, Pan [25] employed this technique. For a staff-selection process, Güngör et al. [26] used this methodology. The fuzzy set theory, as developed by Zadeh, is a generalized variant of the classical set theory. It is an affiliate and assigns a grade of 1 to 10. In this paper, different types of EVs were classified using TOPSIS on the basis of characteristics [27].
In order to deal with uncertain numerical values in reality, Zadeh [34] invented fuzzy numbers. A fuzzy number is an amount for which a single-valued figure is not accurate, but imprecise. Classification of fuzzy numbers is a significant decision-making technique. Fuzzy decisions represent the effectiveness of different alternative models in the modeling of real-world situations by using fuzzy variables. Generally, a fuzzy-based approach is any system in which the variables vary over fuzzy values rather than real figures. These fuzzy values could reflect linguistic terms like “very small”, “moderate”, and so on, depending on how they are perceived in a specific scenario [35]. The defuzzification process is the technique of extracting a single value using the aggregated outcome of fuzzy numbers. This is used to convert the findings of fuzzy rules into a crisp output. In another word, defuzzification is accomplished through the use of a decision-making mechanism that determines the best crisp output from a fuzzy set.
A number of fuzzy criteria are used for a finite series of alternatives; i.e., the values of the alternatives are fuzzy figures. An additional process maps each m-tuple of fuzzy values into one fuzzy value, which is the alternative as per the entire set of criteria.
Let A = { A i i = 1 , , n } be a finite group of possibilities for decision making, and let K = { K j j = 1 , , m } be a finite group of fuzzy criteria, through which activity is regarded to be desirable. The estimates of the alternatives are fuzzy values. It must decide on this set of alternatives as a ranking challenge or decision problem. It is a two-stage technique:
(i) Compliance with all criteria aggregating judgments (fuzzy-numbers);
(ii) Ranking alternative decision making in relation to aggregating judgments.
In this research, two alternatives, the negative ideal solution (d−i) and positive ideal solution (d+i) were investigated. Further closeness coefficients (CCi) were calculated. We denoted CC−i as the degree of satisfaction in the i-th alternative and CC+i as the degree of gap in the i-th alternative. From a fuzzy collection of possible choices, we could evaluate which, as well as how, gaps must be closed in order to achieve ambitious goals and attain the ultimate findings. Closeness coefficients were used to rate all of the alternatives. Furthermore, CCi demonstrated the alternative closest to d+i and farthest from d−i. TOPSIS was determined by the choice of the ultimate solution or EVs that went beyond the perfect negative solution and were nearest to the ideal solution for the positive. The positive and the negative ideal solutions correspondingly had the highest advantages and lowest advantages. The final evaluations of the EVs were based on relative proximity to the optimal solution [28]. Figure 9 shows the integrated fuzzy AHP-TOPSIS methodology for the evaluation of different EVs.

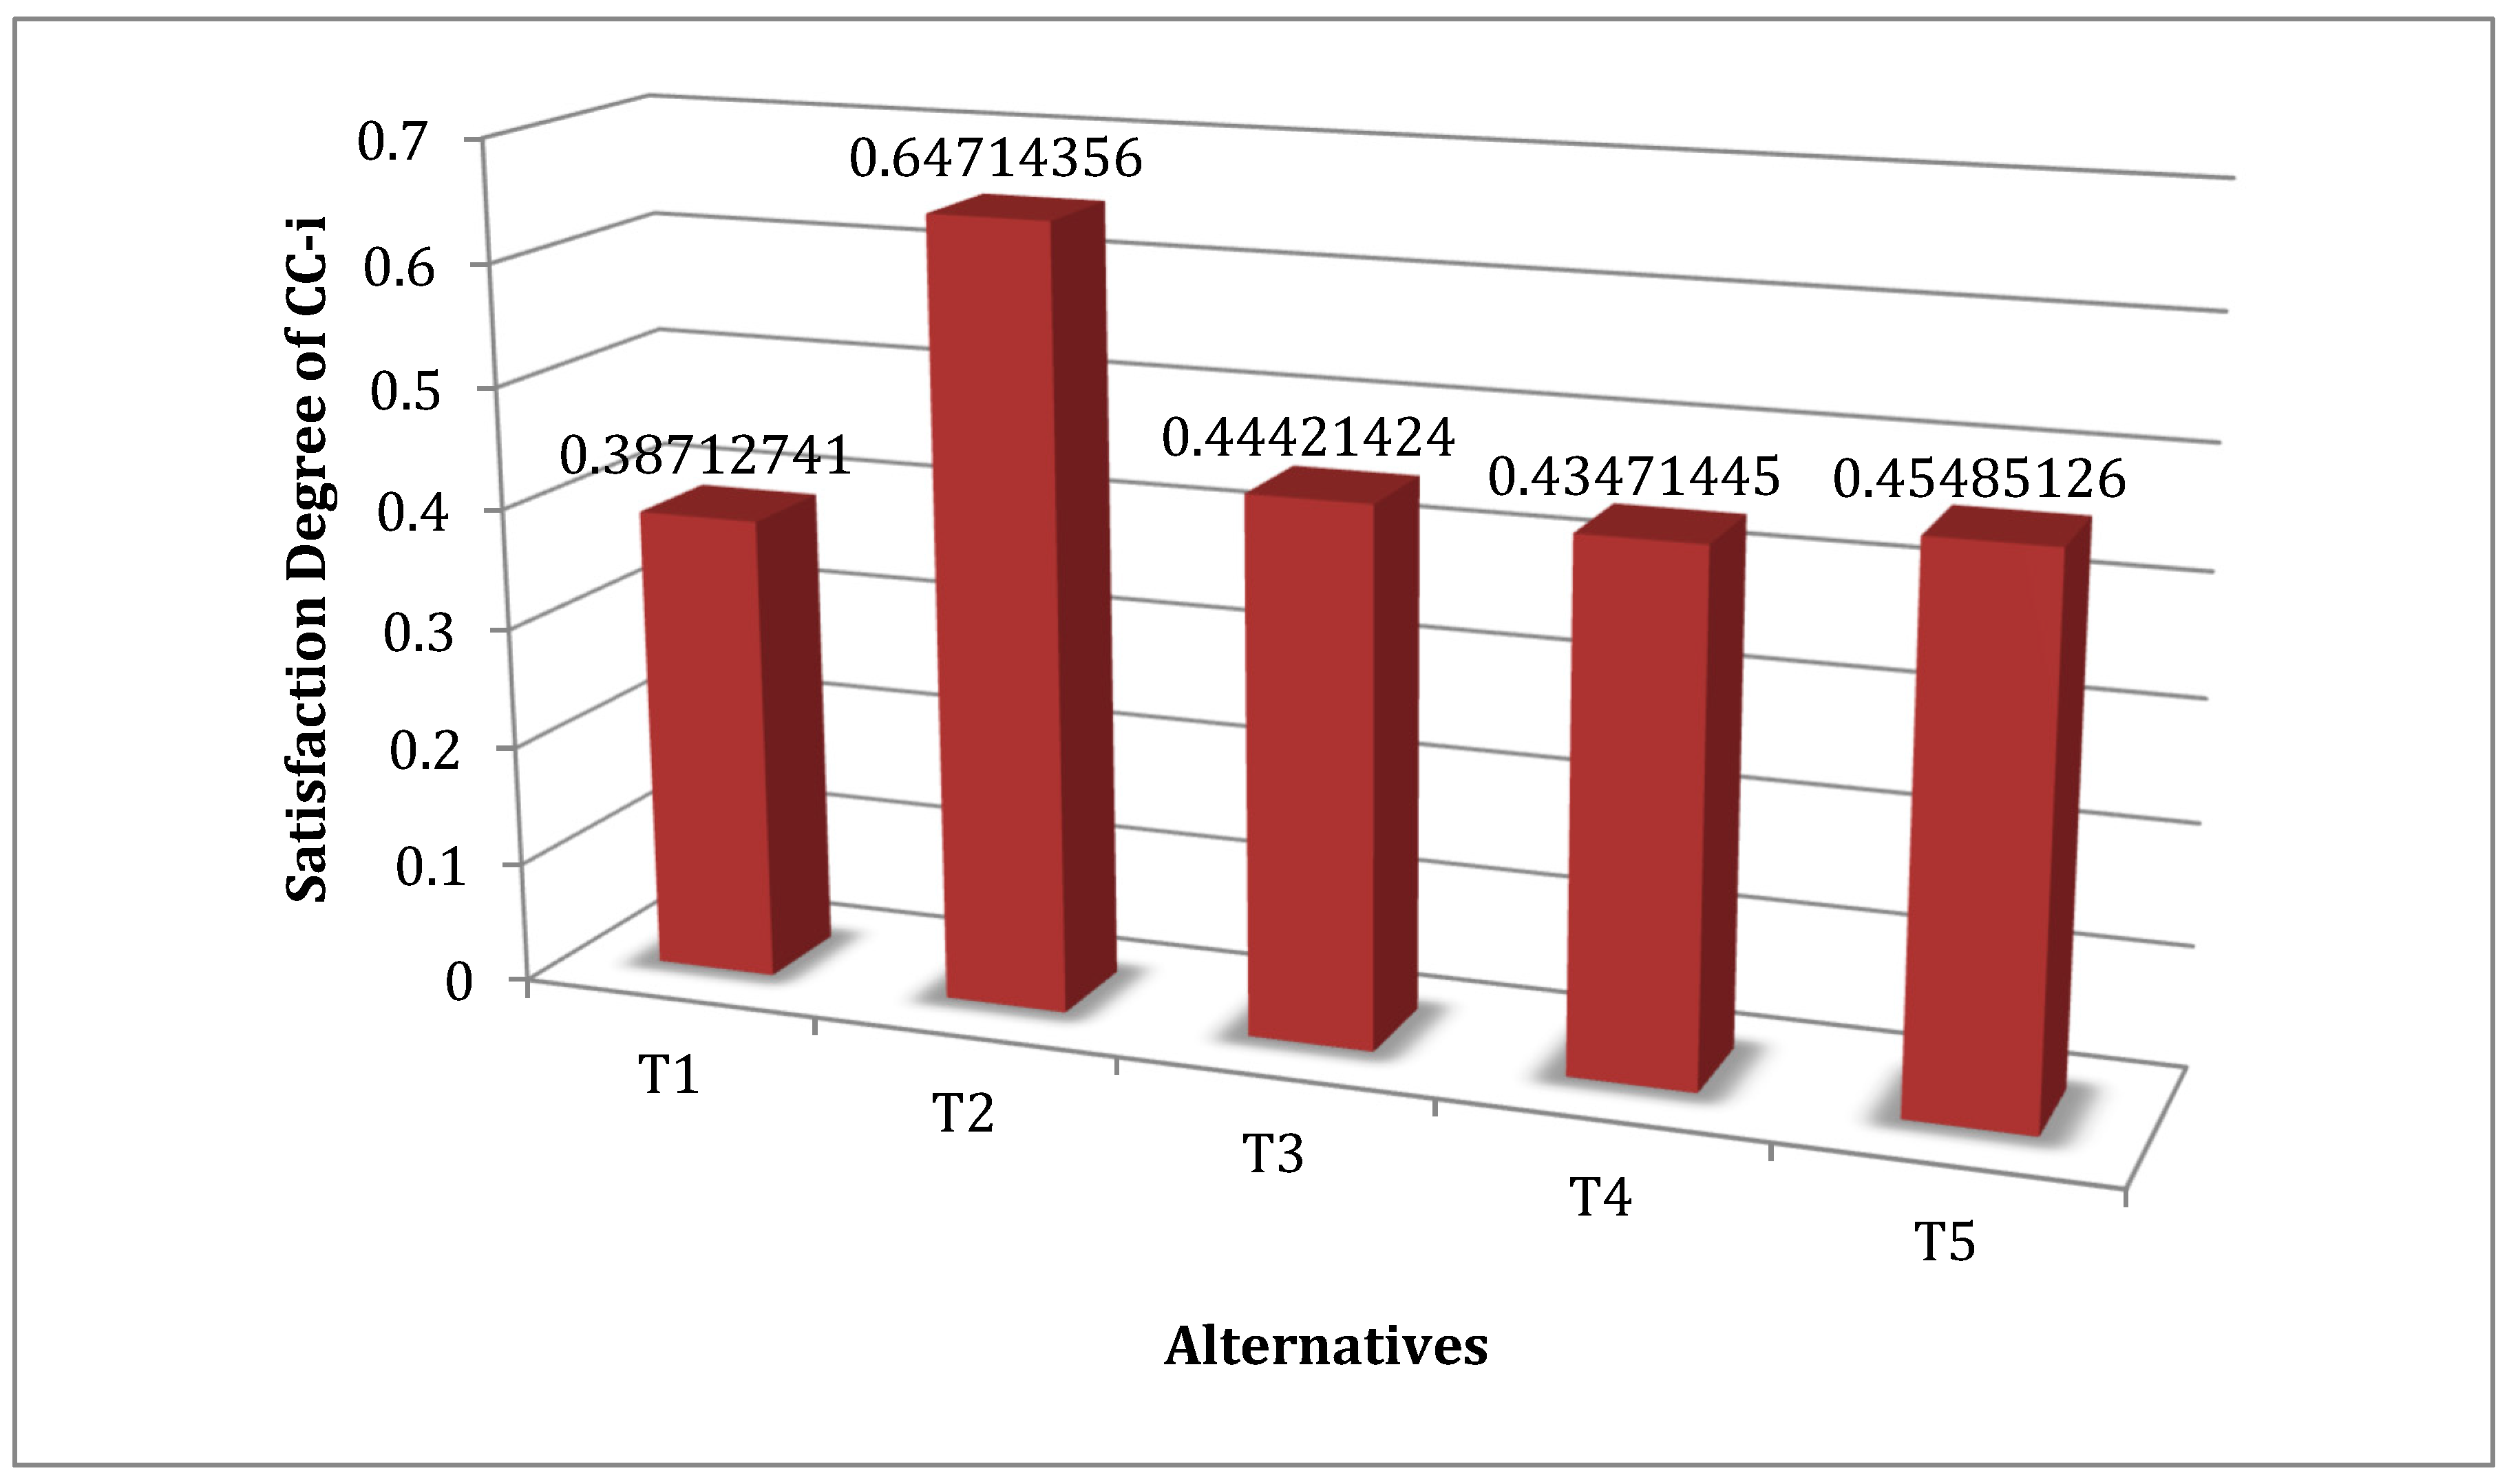
4.3. Statistical Results

This integrated fuzzy AHP-TOPSIS methodology was used to evaluate the performance of different EVs. To acquire accurate information and insights, the investigators used comparative opinions of 75 automobile specialists from varied organization and scholarly backgrounds. It has been previously discussed that analyzing the performance of various EVs is extremely difficult in terms of competitive efficacy. The EVs were selected by using predetermined qualitative and quantitative assessment criteria during the process of different EVs’ evaluation; however, the criteria demonstrated the requirement of the judgment, so herein unpredictability and fuzziness were included in the statistical and observational data evaluated by the decision makers with specific intelligence. A total of 75 automobile specialists, DM (k = 1, 2, 3,..., 75), were involved in analyzing the optimum available decision in linguistic variables. These 75 decision makers comprised 20 academics with 15 years of expertise, 20 researchers with 7 years of vehicle research experience, and 35 professionals from various automobile firms with 15 years of experience. The weights of the local criterion and subcriteria were derived using pairwise comparative matrices.
The aggregated fuzzify pairwise comparison matrix at Level 1 was formed, and can be seen in Table 1. The fuzzy-aggregated pairwise comparison matrix at Level 2 for regulatory, technical, business, and design is presented in Table 2, Table 3, Table 4 and Table 5. For each second-layer aspect, the global weights were deliberate. These are tabulated in Table 6, Table 7, Table 8, Table 9 and Table 10. Further, Table 11 shows the overall weights and rankings of the methods. Table 12 presents the subjective cognition results for evaluators in linguistic terms. Table 13 shows the normalized fuzzy-decision matrix. Table 14 shows the weighted normalized fuzzy-decision matrix. In addition, with the support of the hierarchical structure, Table 15 and Figure 10 show the complete and final relative closeness of the alternatives.
In this context, an evaluation of different electric vehicle alternatives was conducted for the inclusion of fuzzy AHP in the fuzzy TOPSIS; i.e., two major MCDM techniques. Although the proportional relevance of each aspect to the other can be expressed, the intricacies of subjective judgments in the description of the challenge were taken into consideration by fuzzy numbers. Ultimately, the suggested model was tested using a statistical method showing how the highest efficient electric vehicle type was chosen. The satisfaction degree (CC−i) of different alternatives was estimated as 0.38712741, 0.64714356, 0.44421424, 0.43471445, and 0.45485126 for T1, T2, T3, T4, and T5, respectively. As per the findings shown in Figure 10, the second alternative (T2) was highly effective and proficient among several other EV alternatives.

4.4. Comparison with the Classical AHP-TOPSIS Method

Whenever similar statistics are handled with different approaches, it produces contradictory interpretations [29]. Researchers have employed one or more techniques to check the correctness of anticipated methodology findings [30]. Therefore, in this study, we employed the classical AHP-TOPSIS approach [31] to estimate the findings using another approach and to check the effectiveness of consequences using fuzzy AHP-TOPSIS. The procedure of accumulating and projecting relevant information in classical AHP-TOPSIS is analogous to analyzing fuzzy AHP-TOPSIS without fuzzification. As a result, data were used in their actual numerical format to evaluate the different EV performances using traditional AHP-TOPSIS. Table 16 and Figure 11 show the differences in outcomes between fuzzy and classical AHP-TOPSIS. The findings produced using the traditional approach had a strong association with the ones produced using the fuzzy methodology. The outcomes of the comparative analysis were not as varied and distinct from one another; however, the precision of the findings varied. The correctness of the fuzzy-based methodology was higher and more accurate than that of the conventional methodology, as it was a more powerful approach over the classical AHP-TOPSIS. The fuzzy-based AHP-TOPSIS offered the capability of providing fuzzy set numbers for different parameters during the evaluation process.

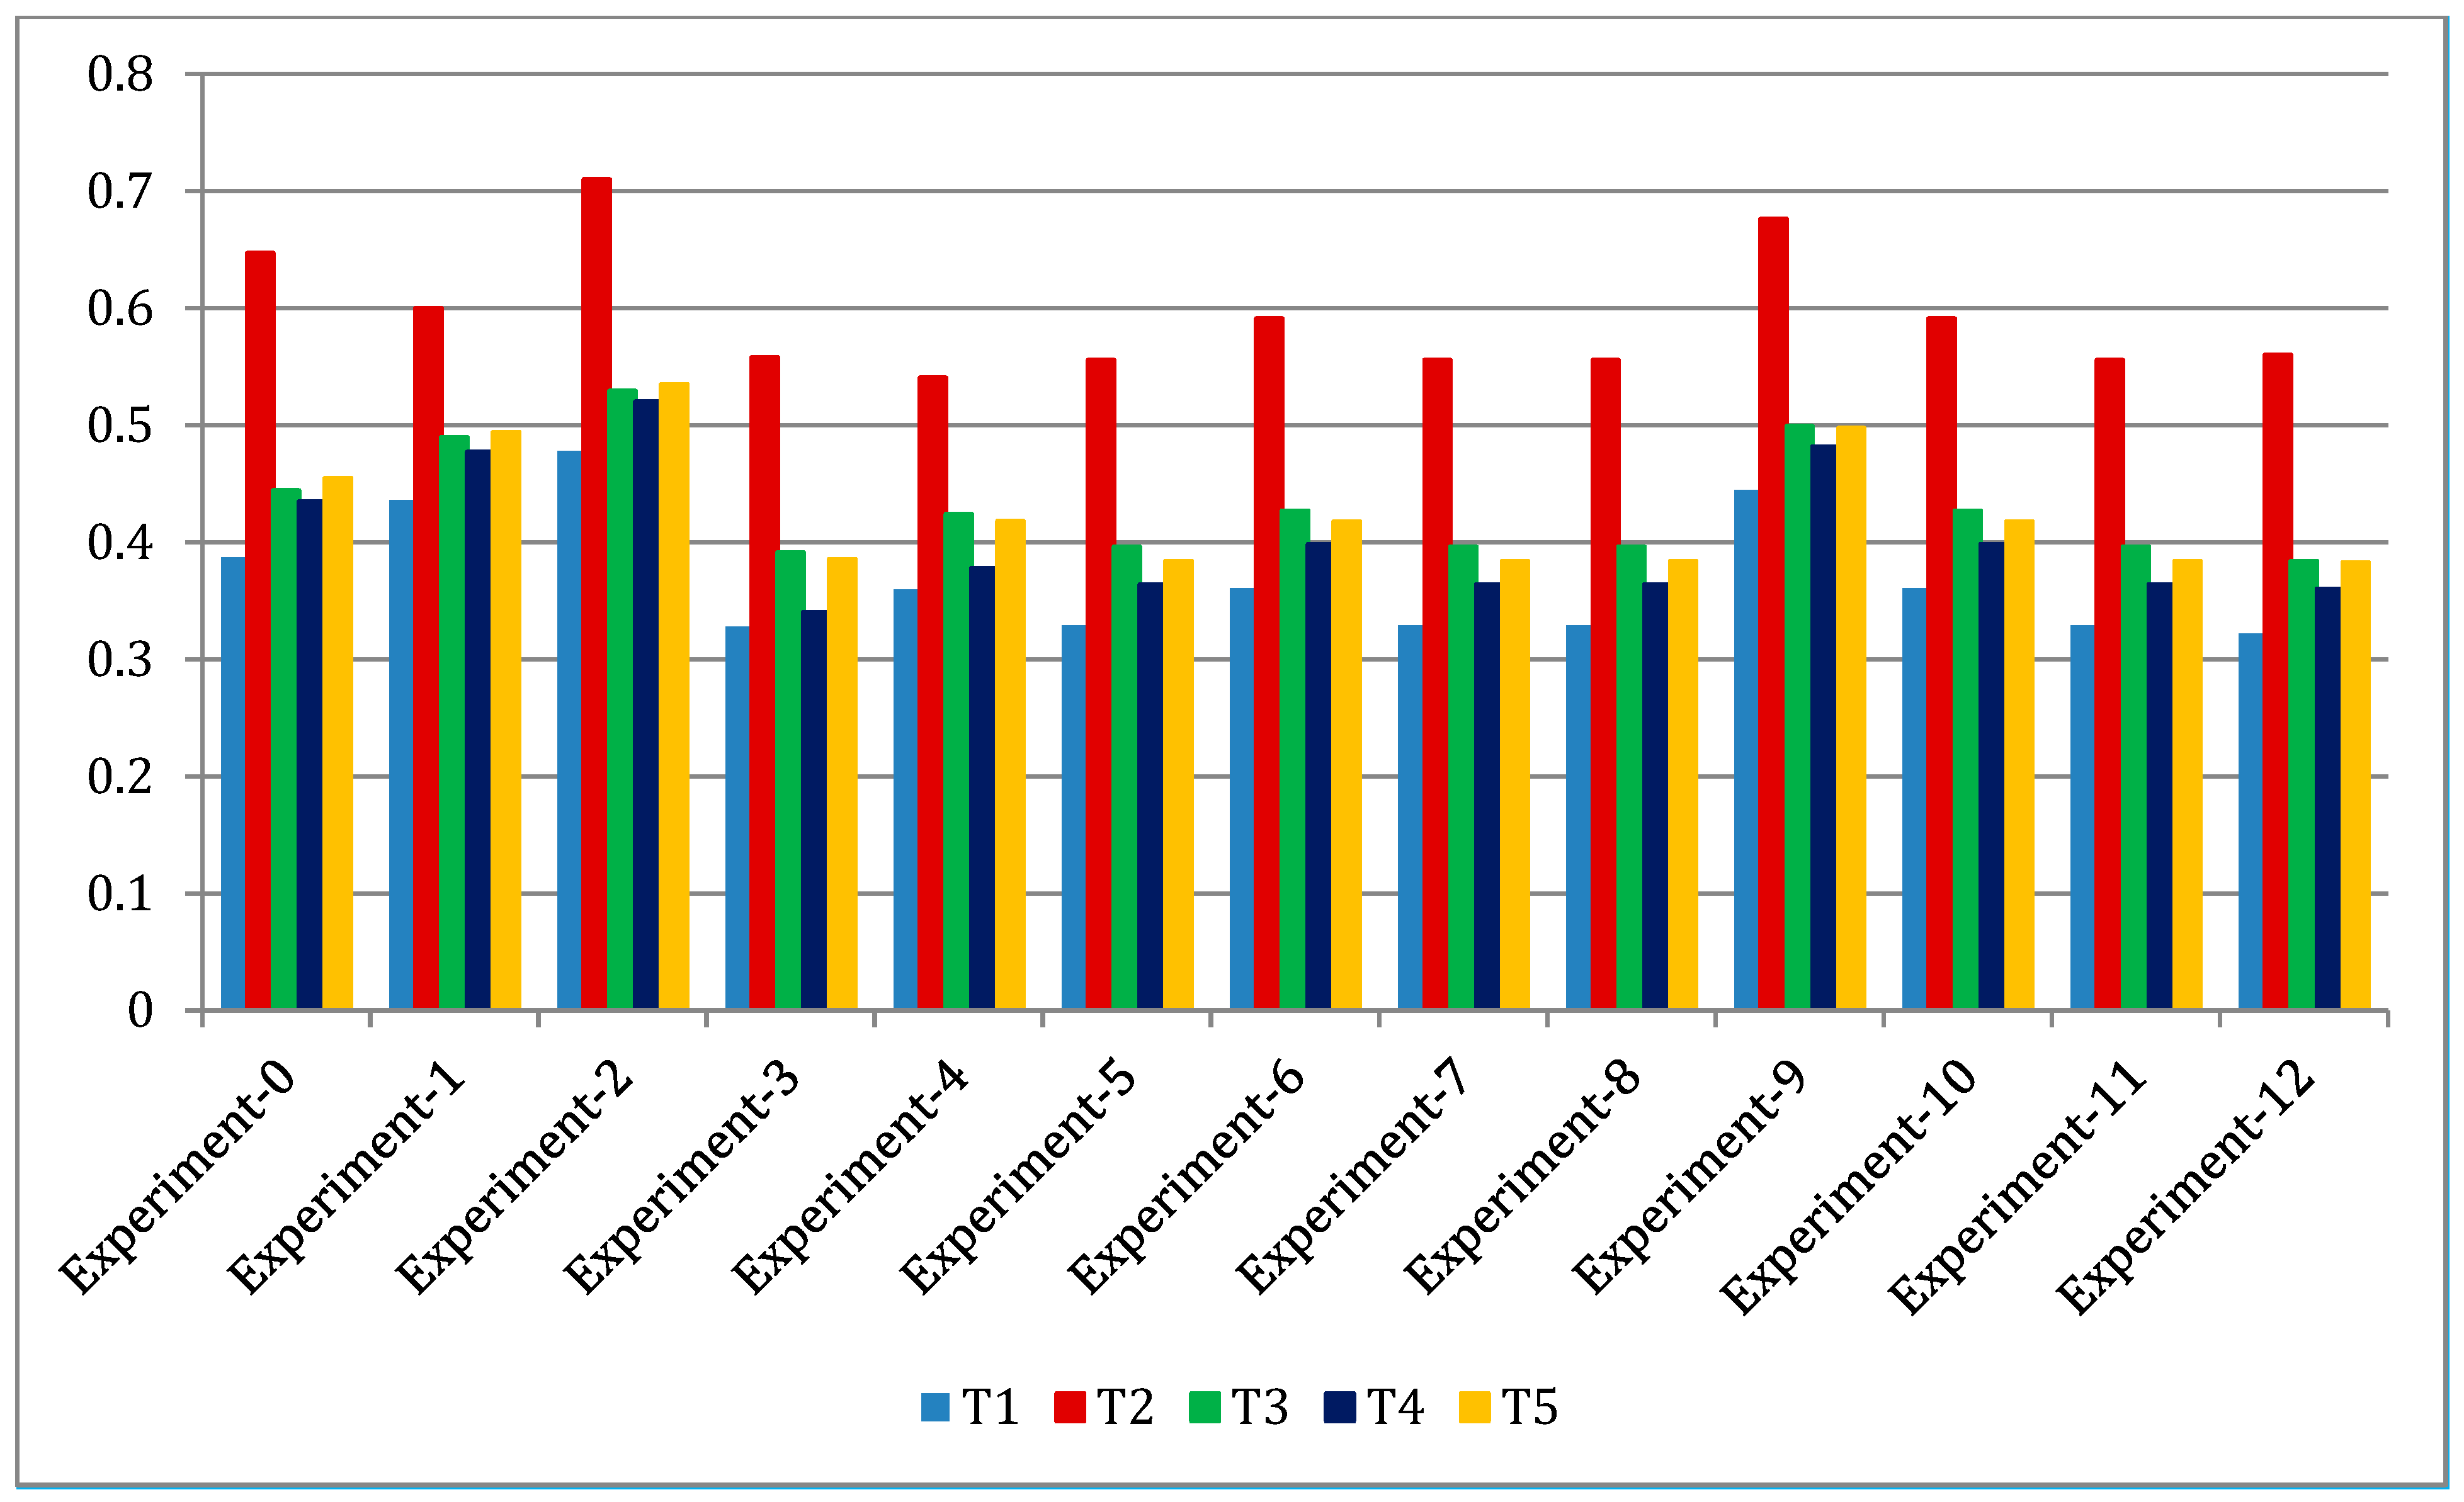
4.5. Sensitivity Analysis

The sensitivity evaluation was accomplished by altering the variables that influenced the report’s correctness. During this statistical study, the sensitivity of the generated weights (variables) was assessed [32]. Following this, 13 variables were used throughout the analysis to evaluate sensitivity with the use of 13 experiments. The rate of satisfaction (CC−i) was calculated for each trial by taking into account weight alterations within each variable, whereas the weights of some other full variables were maintained constant by integrating the fuzzy AHP-TOPSIS methodology. The actual weights obtained in this research work are shown in the first row of Table 17. Alternative-2 (T2) had a significant satisfaction degree (CCi), as per the research findings. Thirteen experiments were performed, ranging from Experiment 1 to Experiment 13. In these 13 experiments, the obtained conclusions revealed that alternative-2 (T2) still had a higher satisfaction degree (CCi). Alternative-1 (T1) also was the lowest-weighted alternative in every trial. The variability in outcome suggested that alternative rankings were sensitive to weights. Table 17 and Figure 12 show the projected consequences.

5. Conclusions

Although technological increases in worldwide transportation and society have enhanced life on this planet, they also have resulted in massive environmental devastation. As a result, people are paying close attention to the environment and its long-term sustainability. Renewable-power vehicles are one contributor to global challenges. BEVs have a reasonable consumption and good power generation, as long as the overall weight is not excessive. The vehicle weight depends on the number and capacity of the batteries installed. As a result, light BEVs that travel short distances have the highest efficiencies. FCEV automobiles can store a greater amount of energy in comparison to their vehicle weight, and fuel-cell recharging can be done more speedily. FCEVs are thus ideal for long-distance travel and resources to create little interruption. The prospect of transportation will play a significant role in energy in systems centered on the interchange of modes of transportation, a future in which battery electric vehicles, as well as fuel-cell electric vehicles, will be supportive instead of combative.

Author Contributions

All authors contributed equally to the manuscript. All authors have read and agreed to the published version of the manuscript.

Funding

The project has been funded by Taif University, Kingdom of Saudi Arabia, under grant no: TURSP-2020/306.

Institutional Review Board Statement

Not applicable.

Informed Consent Statement

Not applicable.

Acknowledgments

This research was supported by Taif University Researchers Supporting Project Number TURSP-2020/306, Taif University, Taif, Saudi Arabia.

Conflicts of Interest

The authors declare no conflict of interest.

References

  1. Pareek, S.; Sujil, A.; Ratra, S.; Kumar, R. Electric Vehicle Charging Station Challenges and Opportunities: A Future Perspective. In 2020 International Conference on Emerging Trends in Communication, Control and Computing (ICONC3); IEEE: Piscataway, NJ, USA, 2020; pp. 1–6. [Google Scholar]
  2. Habib, S.; Khan, M.M.; Abbas, F.; Sang, L.; Shahid, M.U.; Tang, H. A Comprehensive Study of Implemented International Standards, Technical Challenges, Impacts and Prospects for Electric Vehicles. IEEE Access 2018, 6, 13866–13890. [Google Scholar] [CrossRef]
  3. Shamshirband, M.; Salehi, J.; Gazijahani, F.S. Look-ahead risk-averse power scheduling of heterogeneous electric vehicles aggregations enabling V2G and G2V systems based on information gap decision theory. Electr. Power Syst. Res. 2019, 173, 56–70. [Google Scholar] [CrossRef]
  4. Ansari, T.J.; Pandey, D.; Alenezi, M. STORE: Security Threat Oriented Requirements Engineering Methodology. J. King Saud Univ. Comput. Inf. Sci. 2018, in press. [Google Scholar] [CrossRef]
  5. Sahu, K.; Alzahrani, F.A.; Srivastava, R.K.; Kumar, R. Hesitant Fuzzy Sets Based Symmetrical Model of Decision-Making for Estimating the Durability of Web Application. Symmetry 2020, 12, 1770. [Google Scholar] [CrossRef]
  6. Mackenzie, W. 2035: Can EVs Put the Brakes on Oil Demand? Wood Mackenzie. 2017. Available online: https://www.woodmac.com/news/editorial/2035-electric-vehicles-oil-demand/ (accessed on 10 September 2021).
  7. Wang, T.; Luo, H.; Zeng, X.; Yu, Z.; Liu, A.; Sangaiah, A.K. Mobility Based Trust Evaluation for Heterogeneous Electric Vehicles Network in Smart Cities. IEEE Trans. Intell. Transp. Syst. 2021, 22, 1797–1806. [Google Scholar] [CrossRef]
  8. Hashemnia, N.; Asaei, B. Comparative study of using different electric motors in the electric vehicles. In Proceedings of the 18th International Conference on Electrical Machines, Vilamoura, Portugal, 6–9 September 2008; pp. 1–5. [Google Scholar] [CrossRef]
  9. Prud’Homme, R.; Koning, M. Electric vehicles: A tentative economic and environmental evaluation. Transp. Policy 2012, 23, 60–69. [Google Scholar] [CrossRef] [Green Version]
  10. Iclodean, C.; Varga, B.; Burnete, N.; Cimerdean, D.; Jurchiş, B. Comparison of Different Battery Types for Electric Vehicles; IOP Publishing: Bristol, UK, 2017; Volume 252, p. 012058. [Google Scholar]
  11. Oh, S.C. Evaluation of Motor Characteristics for Hybrid Electric Vehicles Using the Hardware-in-the-Loop Concept. IEEE Trans. Veh. Technol. 2005, 54, 817–824. [Google Scholar] [CrossRef]
  12. Qiu, C.; Wang, G. New evaluation methodology of regenerative braking contribution to energy efficiency improvement of electric vehicles. Energy Convers. Manag. 2016, 119, 389–398. [Google Scholar] [CrossRef]
  13. Pfeiffer, J.; Wu, X.; Ayadi, A. Evaluation of Three Different Approaches for Automated Time Delay Estimation for Distributed Sensor Systems of Electric Vehicles. Sensors 2020, 20, 351. [Google Scholar] [CrossRef] [Green Version]
  14. Song, K.; Chen, H.; Wen, P.; Zhang, T.; Zhang, B.; Zhang, T. A comprehensive evaluation framework to evaluate energy management strategies of fuel cell electric vehicles. Electrochim. Acta 2018, 292, 960–973. [Google Scholar] [CrossRef]
  15. Wang, W.; Zhang, Q.; Peng, Z.; Shao, Z.; Li, X. An empirical evaluation of different usage pattern between car-sharing battery electric vehicles and private ones. Transp. Res. Part A Policy Pract. 2020, 135, 115–129. [Google Scholar] [CrossRef]
  16. Zhang, L.; Brown, T.; Samuelsen, S. Evaluation of charging infrastructure requirements and operating costs for plug-in electric vehicles. J. Power Sources 2013, 240, 515–524. [Google Scholar] [CrossRef]
  17. Khan, M.; Kockelman, K.M. Predicting the market potential of plug-in electric vehicles using multiday GPS data. Energy Policy 2012, 46, 225–233. [Google Scholar] [CrossRef] [Green Version]
  18. Tate, E.D.; Harpster, M.O.; Savagian, P.J. The Electrification of the Automobile: From Conventional Hybrid, to Plug-in Hybrids, to Extended-Range Electric Vehicles. SAE Int. J. Passeng. Cars Electron. Electr. Syst. 2008, 1, 156–166. [Google Scholar] [CrossRef] [Green Version]
  19. Offer, G.; Howey, D.; Contestabile, M.; Clague, R.; Brandon, N. Comparative analysis of battery electric, hydrogen fuel cell and hybrid vehicles in a future sustainable road transport system. Energy Policy 2010, 38, 24–29. [Google Scholar] [CrossRef] [Green Version]
  20. Shen, C.; Shan, P.; Gao, T. A Comprehensive Overview of Hybrid Electric Vehicles. Int. J. Veh. Technol. 2011, 2011, 1–7. [Google Scholar] [CrossRef]
  21. Clement-Nyns, K.; Haesen, E.; Driesen, J. The Impact of Charging Plug-In Hybrid Electric Vehicles on a Residential Distribution Grid. IEEE Trans. Power Syst. 2009, 25, 371–380. [Google Scholar] [CrossRef] [Green Version]
  22. Saaty, T.L. Decision making with the analytic hierarchy process. Int. J. Serv. Sci. 2008, 1, 83. [Google Scholar] [CrossRef] [Green Version]
  23. Haq, A.N.; Kannan, G. Fuzzy analytical hierarchy process for evaluating and selecting a vendor in a supply chain model. Int. J. Adv. Manuf. Technol. 2005, 29, 826–835. [Google Scholar] [CrossRef]
  24. Huang, C.-C.; Chu, P.-Y.; Chiang, Y.-H. A fuzzy AHP application in government-sponsored R&D project selection. Omega 2008, 36, 1038–1052. [Google Scholar] [CrossRef]
  25. Pan, N.-F. Fuzzy AHP approach for selecting the suitable bridge construction method. Autom. Constr. 2008, 17, 958–965. [Google Scholar] [CrossRef]
  26. Güngör, Z.; Serhadlıoğlu, G.; Kesen, S.E. A fuzzy AHP approach to personnel selection problem. Appl. Soft Comput. 2009, 9, 641–646. [Google Scholar] [CrossRef]
  27. Alosaimi, W.; Ansari, T.J.; Alharbi, A.; Alyami, H.; Seh, A.; Pandey, A.; Agrawal, A.; Khan, R. Evaluating the Impact of Different Symmetrical Models of Ambient Assisted Living Systems. Symmetry 2021, 13, 450. [Google Scholar] [CrossRef]
  28. Ansari, T.J.; Al-Zahrani, F.A.; Pandey, D.; Agrawal, A. A fuzzy TOPSIS based analysis toward selection of effective security requirements engineering approach for trustworthy healthcare software development. BMC Med. Inform. Decis. Mak. 2020, 20, 1–13. [Google Scholar] [CrossRef]
  29. Kumar, R.; Alenezi, M.; Ansari, M.T.J.; Gupta, B.; Agrawal, A.; Khan, R. Evaluating the Impact of Malware Analysis Techniques for Securing Web Applications through a Decision-Making Framework under Fuzzy Environment. Int. J. Intell. Eng. Syst. 2020, 13, 94–109. [Google Scholar] [CrossRef]
  30. Attaallah, A.; Ahmad, M.; Ansari, T.J.; Pandey, A.K.; Kumar, R.; Khan, R.A. Device Security Assessment of Internet of Healthcare Things. Intell. Autom. Soft Comput. 2021, 27, 593–603. [Google Scholar] [CrossRef]
  31. Kumar, R.; Ansari, M.T.J.; Baz, A.; Alhakami, H.; Agrawal, A.; Khan, R.A. A Multi-Perspective Benchmarking Framework for Estimating Usable-Security of Hospital Management System Software Based on Fuzzy Logic, ANP and TOPSIS Methods. KSII Trans. Internet Inf. Syst. 2021, 15, 240–263. [Google Scholar]
  32. Zarour, M.; Ansari, T.J.; Alenezi, M.; Sarkar, A.K.; Faizan, M.; Agrawal, A.; Kumar, R.; Khan, R.A. Evaluating the Impact of Blockchain Models for Secure and Trustworthy Electronic Healthcare Records. IEEE Access 2020, 8, 157959–157973. [Google Scholar] [CrossRef]
  33. Viola, F. Electric Vehicles and Psychology. Sustainability 2021, 13, 719. [Google Scholar] [CrossRef]
  34. Zadeh, L.A. Fuzzy sets as a basis for a theory of possibility. Fuzzy Sets Syst. 1978, 1, 3–28. [Google Scholar] [CrossRef]
  35. Klir, G.J. From Classical Mathematics to Fuzzy Mathematics: Emergence of a New Paradigm for Theoretical Science. In Fuzzy Logic in Chemistry; Elsevier: Amsterdam, The Netherlands, 1997; pp. 31–63. [Google Scholar]
Figure 1. Several benefits of electric vehicles.
Energies 14 06120 g001
Figure 2. The dramatic growth in the electric vehicle market.
Energies 14 06120 g002
Figure 3. Architectural diagram of battery electric vehicles (BEV).
Energies 14 06120 g003
Figure 4. Architectural diagram of fuel-cell electric vehicles (FCEVs).
Energies 14 06120 g004
Figure 5. Architectural diagram of hybrid electric vehicles (HEVs).
Energies 14 06120 g005
Figure 6. Architectural diagram of plug-in hybrid electric vehicles (PHEVs).
Energies 14 06120 g006
Figure 7. Architectural diagram of range extender hybrid electric vehicles (REHEVs).
Energies 14 06120 g007
Figure 8. The hierarchy structure for the evaluation of different EVs.
Energies 14 06120 g008
Figure 9. The fuzzy AHP TOPSIS methodology for the evaluation of different EVs.
Energies 14 06120 g009
Figure 10. A graphical representation of the satisfaction degree of CC−i.
Energies 14 06120 g010
Figure 11. A graphical representation of the comparison of the AHP-TOPSIS techniques.
Energies 14 06120 g011
Figure 12. A graphical representation of the sensitivity analysis.
Energies 14 06120 g012
Table 1. The aggregated fuzzify pairwise comparison matrix at Level 1.
S1S2S3S4
S11.000000, 1.000000, 1.0000001.750254, 2.345258, 3.0365631.485854, 1.956375, 2.5268731.129628, 1.555351, 1.989625
S2-1.000000, 1.000000, 1.0000000.576528, 0.786562, 1.1685240.565263, 0.728568, 0.969954
S3--1.000000, 1.000000, 1.0000000.628656, 0.816575, 1.075846
S4---1.000000, 1.000000, 1.000000
Table 2. The fuzzy-aggregated pairwise comparison matrix at Level 2 for regulatory.
S11S12S13
S111.000000, 1.000000, 1.0000000.237552, 0.287963, 0.3675260.342154, 0.447785, 0.824763
S12-1.000000, 1.000000, 1.0000000.661454, 1.172563, 1.693686
S13--1.000000, 1.000000, 1.000000
Table 3. The fuzzy-aggregated pairwise comparison matrix at Level 2 for technical.
S21S22S23S24
S211.000000, 1.000000, 1.0000000.694154, 0.895356, 1.1124850.234596, 0.287864, 0.3641680.711256, 0.954163, 1.351257
S22-1.000000, 1.000000, 1.0000000.493154, 0.642362, 1.2414350.271354, 0.351565, 0.521635
S23--1.000000, 1.000000, 1.0000001.085484, 1.329762, 1.558235
S24---1.000000, 1.000000, 1.000000
Table 4. The fuzzy-aggregated pairwise comparison matrix at Level 2 for business.
S31S32S33
S311.000000, 1.000000, 1.0000000.665365, 1.172384, 1.6974651.157663, 1.447254, 1.704365
S32-1.000000, 1.000000, 1.0000001.007762, 1.524765, 1.934368
S33--1.000000, 1.000000, 1.000000
Table 5. The fuzzy-aggregated pairwise comparison matrix at Level 2 for design.
F41F42F43
S411.000000, 1.000000, 1.0000001.197856, 1.588385, 2.1564650.491541, 0.642285, 1.009958
S42-1.000000, 1.000000, 1.0000000.224165, 0.295684, 0.427969
S43--1.000000, 1.000000, 1.000000
Table 6. The defuzzified pairwise comparison matrix.
S1S2S3S4Weights
S11.0000002.3725301.9815901.5566400.392511
S20.4215501.0000000.8246300.7447700.152321
S30.5045601.2135201.0000000.8350900.202531
S40.6426501.3428801.2035501.0000000.252637
CR = 0.000602.
Table 7. The aggregated pairwise comparison matrix at Level 2 for regulatory.
S11S12S13Weights
S111.0000001.1735400.4945640.275854
S120.8525501.0000001.1725470.328627
S132.0243400.8535451.0000000.395519
CR = 0.0488003.
Table 8. The aggregated pairwise comparison matrix at Level 2 for technical.
S21S22S23S24Weights
S211.0000000.8926541.1735540.9945470.246313
S221.1212421.0000000.6915260.3725460.182575
S230.8525621.4472561.0000001.2985410.272112
S241.0066242.6883540.7704351.0000000.299000
CR = 0.034904.
Table 9. The aggregated pairwise comparison matrix at Level 2 for business.
S31S32S33Weights
S311.0000001.1725411.3636520.382000
S320.8533451.0000001.4912240.353026
S330.7337540.6707251.0000000.255047
CR = 0.002506.
Table 10. The aggregated pairwise comparison matrix at Level 2 for design.
S41S42S43Weights
S411.0000001.6332440.6918440.3259211
S420.6124771.0000000.3034570.2731254
S431.4472473.3003471.0000000.3112540
CR = 0.0052045.
Table 11. The overall weights and rankings of methods.
Level 1 MethodsLocal Weights of Level 1Level 2 MethodsLocal Weights of Level 2Overall WeightsOverall Ranks
S10.392511S110.2758540.1082763
S120.3286270.1289902
S130.3955190.1552461
S20.152321S210.2463130.03751912
S220.1825750.02781013
S230.2721120.04144811
S240.2990000.04554410
S30.202531S310.3820000.0773676
S320.3530260.0715007
S330.2550470.0516559
S40.252637S410.3259210.0823404
S420.2731250.0690008
S430.3112540.0786345
Table 12. The subjective cognition results for evaluators in linguistic terms.
T1T2T3T4T5
S115.3600, 7.3006, 8.73005.5500, 7.5500, 8.91000.6400, 2.2700, 4.27005.3600, 7.3600, 8.73004.1800, 6.0900, 7.6400
S123.7300, 5.5500, 7.27004.4500, 6.4500, 8.18001.6400, 3.5500, 5.55003.5500, 5.5500, 7.36005.0000, 7.0000, 8.4500
S132.3600, 4.2700, 6.27005.3600, 7.3006, 8.73005.5500, 7.5500, 8.91000.6400, 2.2700, 4.27005.3600, 7.3600, 8.7300
S214.8200, 6.8200, 8.55003.7300, 5.5500, 7.27004.4500, 6.4500, 8.18001.6400, 3.5500, 5.55003.5500, 5.5500, 7.3600
S225.5500, 7.5005, 9.27002.3600, 4.2700, 6.27002.4500, 4.2700, 6.27001.3600, 3.3600, 5.36004.4500, 6.4500, 8.1800
S234.2700, 6.2700, 8.18004.8200, 6.8200, 8.55004.6400, 6.6400, 8.55000.8200, 2.6400, 4.64004.4500, 6.4500, 8.2700
S245.3600, 7.3006, 8.73005.5500, 7.5500, 8.91000.6400, 2.2700, 4.27005.3600, 7.3600, 8.73005.7300, 7.7300, 9.2700
S313.7300, 5.5500, 7.27005.3600, 7.3006, 8.73005.5500, 7.5500, 8.91000.6400, 2.2700, 4.27005.3600, 7.3600, 8.7300
S322.3600, 4.2700, 6.27003.7300, 5.5500, 7.27004.4500, 6.4500, 8.18001.6400, 3.5500, 5.55003.5500, 5.5500, 7.3600
S335.3600, 7.3006, 8.73005.5500, 7.5500, 8.91000.6400, 2.2700, 4.27005.3600, 7.3600, 8.73004.4500, 6.4500, 8.1800
S413.7300, 5.5500, 7.27004.4500, 6.4500, 8.18001.6400, 3.5500, 5.55003.5500, 5.5500, 7.36004.4500, 6.4500, 8.2700
S422.3600, 4.2700, 6.27002.4500, 4.2700, 6.27001.3600, 3.3600, 5.36004.4500, 6.4500, 8.18005.7300, 7.7300, 9.2700
S434.8200, 6.8200, 8.55004.6400, 6.6400, 8.55000.8200, 2.6400, 4.64004.4500, 6.4500, 8.27005.1800, 7.1800, 8.8200
Table 13. The normalized fuzzy-decision matrix.
T1T2T3T4T5
S110.3800, 0.6000, 0.80000.5400, 0.7500, 0.92000.5200, 0.7400, 0.93000.4200, 0.6900, 0.99000.5200, 0.7400, 0.9400
S120.5200, 0.7400, 0.94000.3800, 0.6000, 0.80000.5400, 0.7500, 0.92000.5200, 0.7400, 0.93000.4200, 0.6900, 0.9900
S130.3800, 0.6000, 0.80000.5200, 0.7400, 0.94000.5400, 0.7500, 0.92000.5200, 0.7400, 0.92000.2000, 0.4700, 0.7700
S210.3800, 0.6000, 0.80000.5400, 0.7500, 0.92000.5200, 0.7400, 0.93000.4200, 0.6900, 0.99000.5400, 0.7500, 0.9400
S220.5200, 0.7400, 0.94000.3800, 0.6000, 0.80000.5400, 0.7500, 0.92000.5200, 0.7400, 0.93000.4200, 0.6900, 0.9900
S230.3800, 0.6000, 0.80000.5200, 0.7400, 0.94000.5400, 0.7500, 0.92000.5200, 0.7400, 0.92000.2000, 0.4700, 0.7700
S240.3800, 0.6000, 0.80000.5400, 0.7500, 0.92000.5200, 0.7400, 0.93000.4200, 0.6900, 0.99000.5400, 0.7500, 0.9400
S310.5200, 0.7400, 0.94000.3800, 0.6000, 0.80000.5400, 0.7500, 0.92000.5200, 0.7400, 0.93000.4200, 0.6900, 0.9900
S320.3800, 0.6000, 0.80000.5200, 0.7400, 0.94000.5400, 0.7500, 0.92000.5200, 0.7400, 0.92000.2000, 0.4700, 0.7700
S330.3800, 0.6000, 0.80000.5400, 0.7500, 0.92000.5200, 0.7400, 0.93000.4200, 0.6900, 0.99000.5400, 0.7500, 0.9400
S410.5200, 0.7400, 0.94000.5400, 0.7500, 0.92000.3800, 0.6000, 0.80000.5400, 0.7500, 0.92000.5200, 0.7400, 0.9300
S420.3800, 0.6000, 0.80000.3500, 0.5800, 0.81000.5200, 0.7400, 0.94000.5400, 0.7500, 0.92000.5200, 0.7400, 0.9200
S430.5200, 0.7400, 0.92000.4600, 0.6700, 0.86000.3800, 0.6000, 0.80000.3500, 0.5800, 0.81000.4200, 0.6900, 0.9900
Table 14. The weighted normalized fuzzy-decision matrix.
T1T2T3T4T5
S110.00000, 0.00200, 0.009000.00200, 0.00700, 0.022000.00200, 0.00700, 0.024000.00100, 0.00500, 0.018000.00300, 0.01100, 0.03600
S120.00300, 0.01200, 0.041000.00000, 0.00200, 0.009000.00200, 0.00700, 0.022000.00200, 0.00700, 0.024000.00100, 0.00500, 0.01800
S130.00300, 0.01200, 0.042000.00300, 0.01200, 0.041000.00300, 0.01200, 0.041000.00500, 0.01600, 0.048000.00500, 0.01600, 0.04900
S210.00000, 0.00200, 0.009000.00200, 0.00700, 0.022000.00200, 0.00700, 0.024000.00100, 0.00500, 0.018000.00200, 0.00900, 0.03800
S220.00300, 0.01200, 0.041000.00000, 0.00200, 0.009000.00200, 0.00700, 0.022000.00200, 0.00700, 0.024000.00100, 0.00500, 0.01800
S230.00300, 0.01200, 0.042000.00300, 0.01200, 0.041000.00300, 0.01200, 0.041000.00500, 0.01600, 0.048000.00500, 0.01600, 0.04900
S240.00000, 0.00200, 0.009000.00000, 0.00200, 0.009000.00200, 0.00700, 0.022000.00200, 0.00700, 0.024000.00100, 0.00500, 0.01800
S310.00300, 0.01200, 0.041000.00300, 0.01200, 0.041000.00300, 0.01200, 0.041000.00500, 0.01600, 0.048000.00500, 0.01600, 0.04900
S320.00000, 0.00200, 0.009000.00000, 0.00200, 0.009000.00200, 0.00700, 0.022000.00200, 0.00700, 0.024000.00100, 0.00500, 0.01800
S330.00300, 0.01200, 0.041000.00300, 0.01200, 0.041000.00300, 0.01200, 0.041000.00500, 0.01600, 0.048000.00500, 0.01600, 0.04900
S410.00000, 0.00200, 0.009000.00200, 0.00700, 0.022000.00200, 0.00700, 0.024000.00100, 0.00500, 0.018000.00200, 0.00900, 0.03800
S420.00300, 0.01200, 0.041000.00300, 0.01200, 0.041000.00500, 0.01600, 0.048000.00500, 0.01600, 0.049000.00100, 0.00500, 0.01800
S430.00300, 0.01200, 0.042000.00300, 0.01200, 0.042000.00200, 0.01000, 0.037000.00200, 0.00900, 0.038000.00100, 0.00500, 0.01800
Table 15. The closeness coefficients for the aspired level among the different alternatives.
Alternativesd+id−iGap Degree of CC+iSatisfaction Degree of CC−i
Alternative 1T10.04515400.05452500.61254500.38712741
Alternative 2T20.05645700.03652600.35625600.64714356
Alternative 3T30.04645700.05487400.56985700.44421424
Alternative 4T40.04512700.04524500.57548200.43471445
Alternative 5T50.03465700.02154700.55356800.45485126
Table 16. Comparison of the AHP-TOPSIS techniques.
Methods/AlternativesT1T2T3T4T5
Fuzzy AHP-TOPSIS0.387127410.647143560.444214240.434714450.45485126
Classical AHP-TOPSIS0.385474000.645287000.445427000.436548000.46358700
Table 17. The sensitivity analysis.
ExperimentsWeights/Alternatives T1T2T3T4T5
Experiment-0Original WeightsSatisfaction Degree (CC−i)0.387127410.647143560.444214240.434714450.45485126
Experiment-1S110.435764000.600045000.489627000.477181000.49393900
Experiment-2S120.477764000.710045000.529127000.520180000.53493900
Experiment-3S130.328064000.558045000.391127000.340482000.38563900
Experiment-4S210.359764000.540445000.424127000.377980000.41803900
Experiment-5S220.329164000.555545000.396127000.363680000.38383900
Experiment-6S230.360764000.591045000.427127000.398178000.41783900
Experiment-7S240.329164000.555545000.396127000.363680000.38383900
Experiment-8S310.329164000.555545000.396127000.363680000.38383900
Experiment-9S320.444464000.676045000.499127000.481679000.49743900
Experiment-10S330.360764000.591045000.427127000.398178000.41783900
Experiment-11S410.329164000.555545000.396127000.363680000.38383900
Experiment-12S420.321764000.560045000.383627000.360180000.38293900
Experiment-13S430.478164000.726545000.540627000.527681000.54343900
Publisher’s Note: MDPI stays neutral with regard to jurisdictional claims in published maps and institutional affiliations.

