
Mathematical Description of Energy Transition Scenarios Based on the Latest Technologies and Trends

Abstract
:1. Introduction
2. The Current State of the Energy Sector
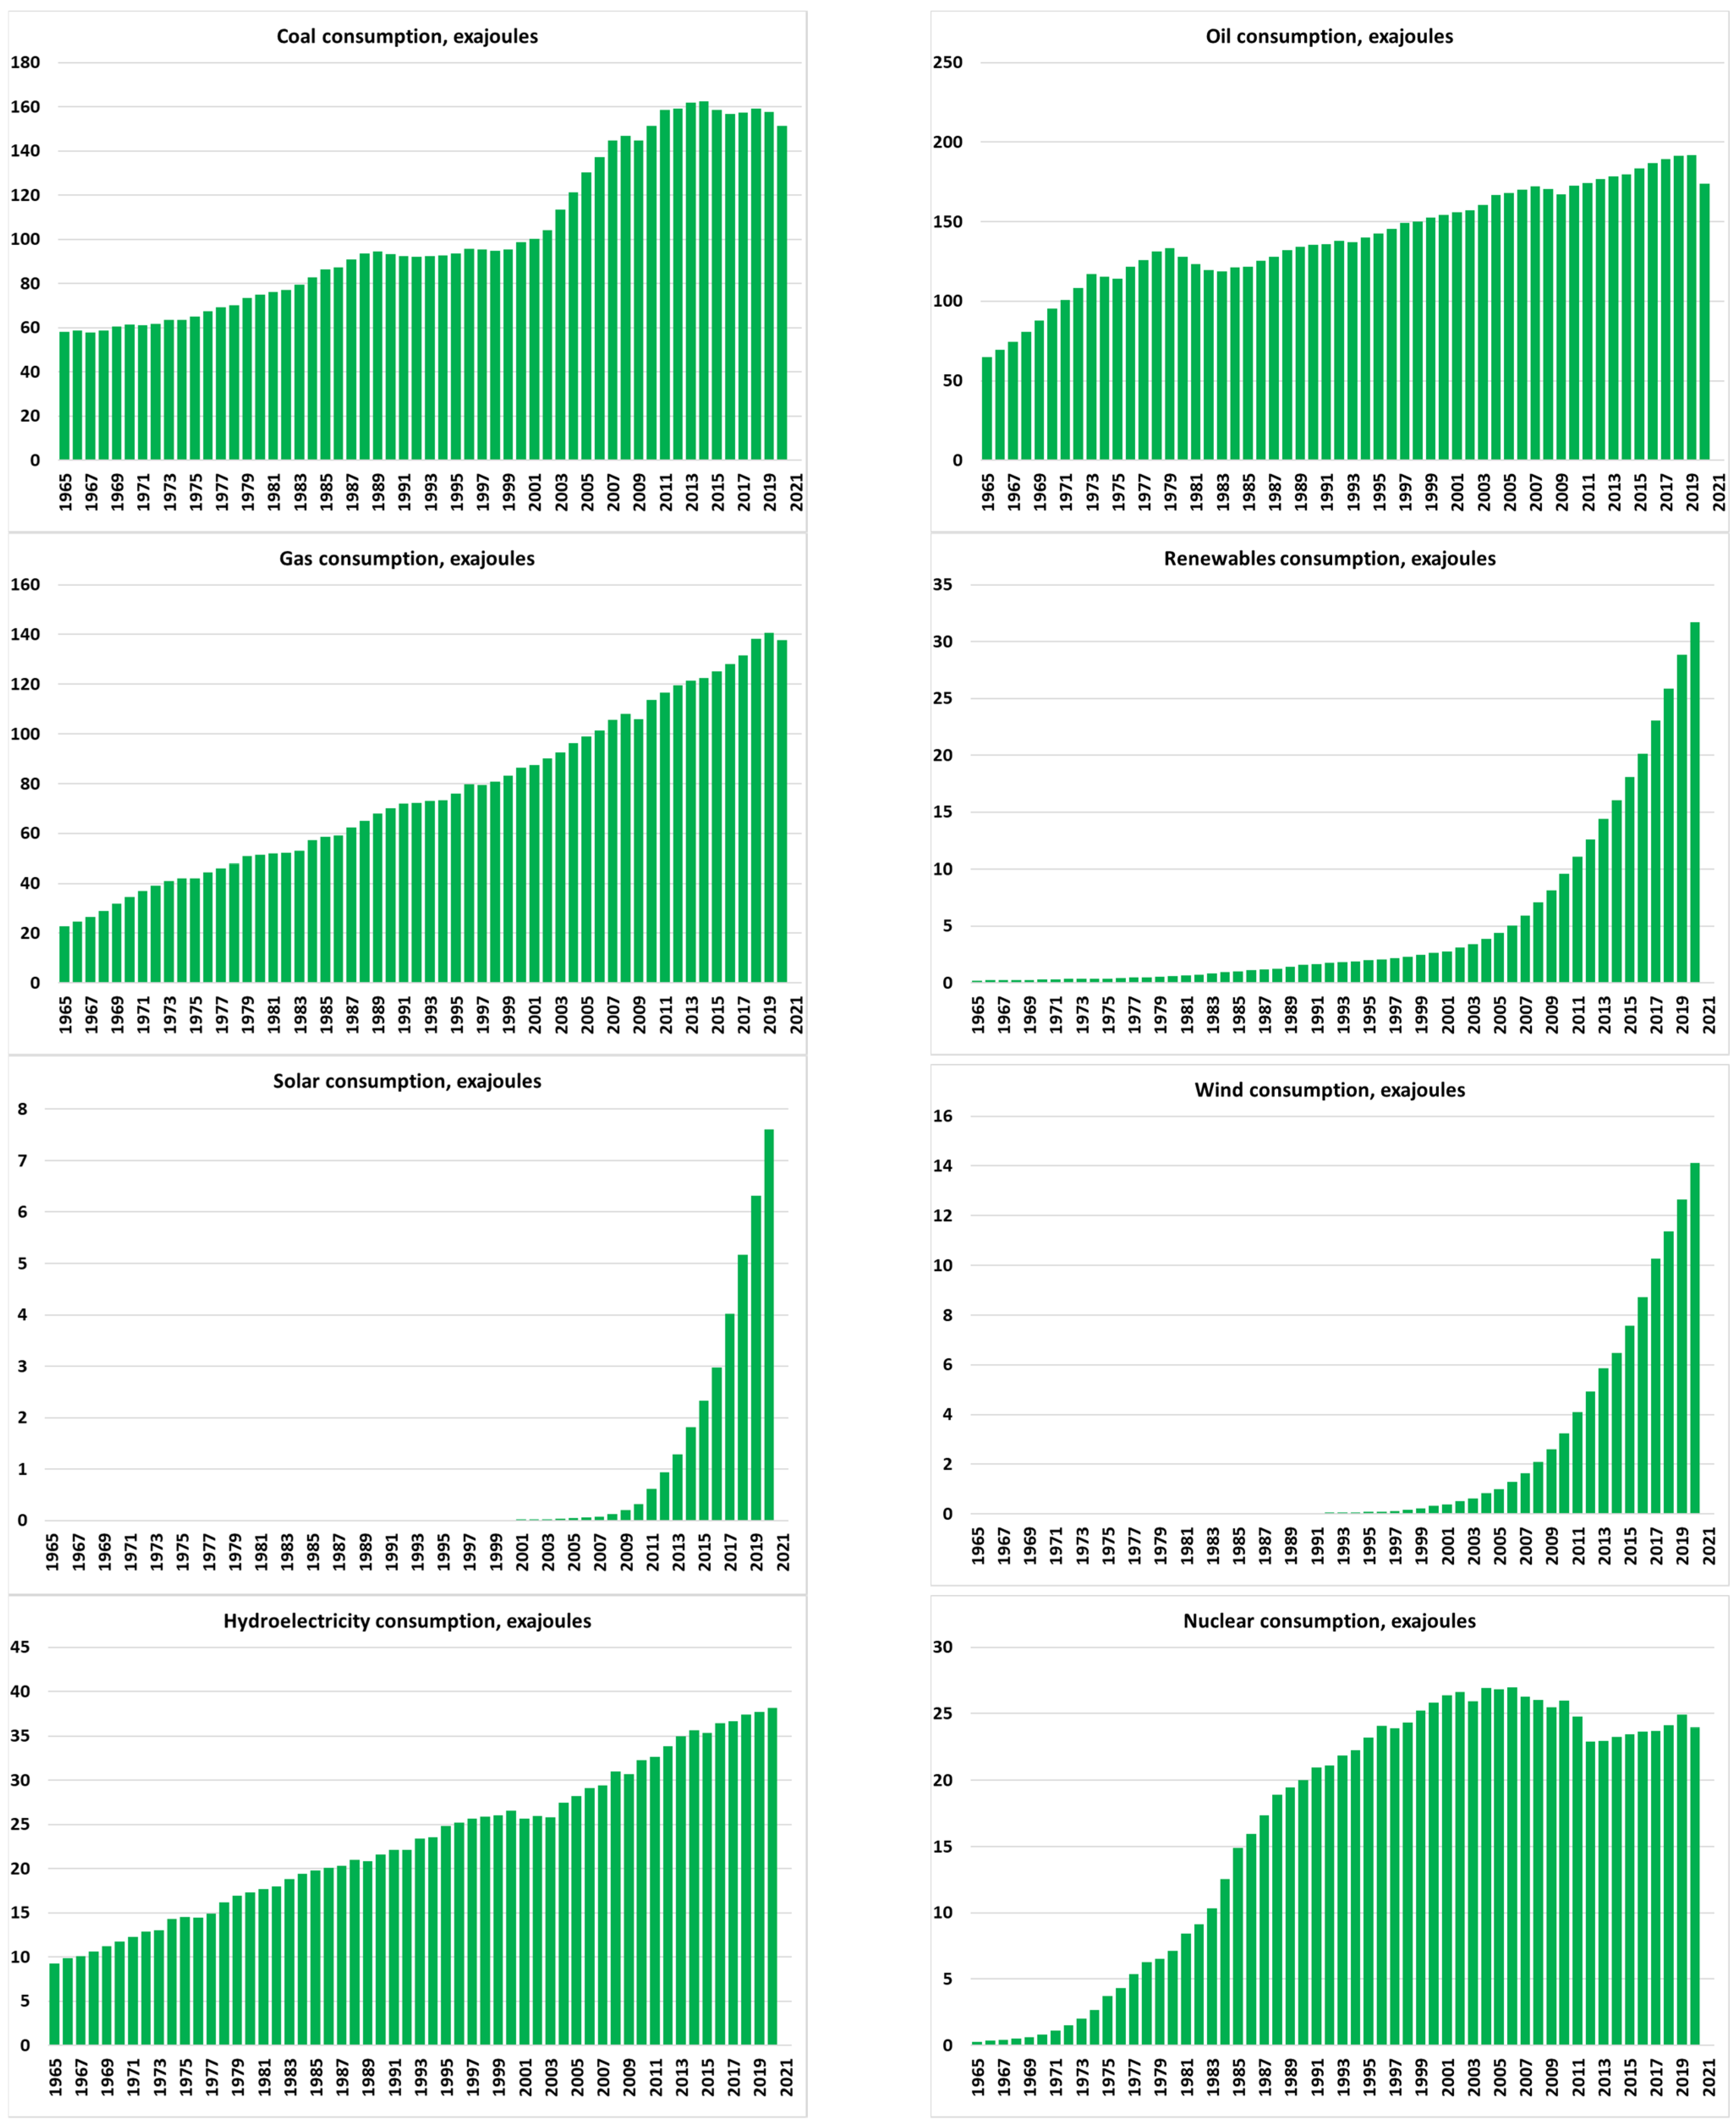
2.1. Modern Trends of the Energy Sector
2.2. Changes Observed in 2020
3. Ways of Reducing Global Warming
- energy-efficient technologies;
- renewable energy;
- green hydrogen;
- CCS technology
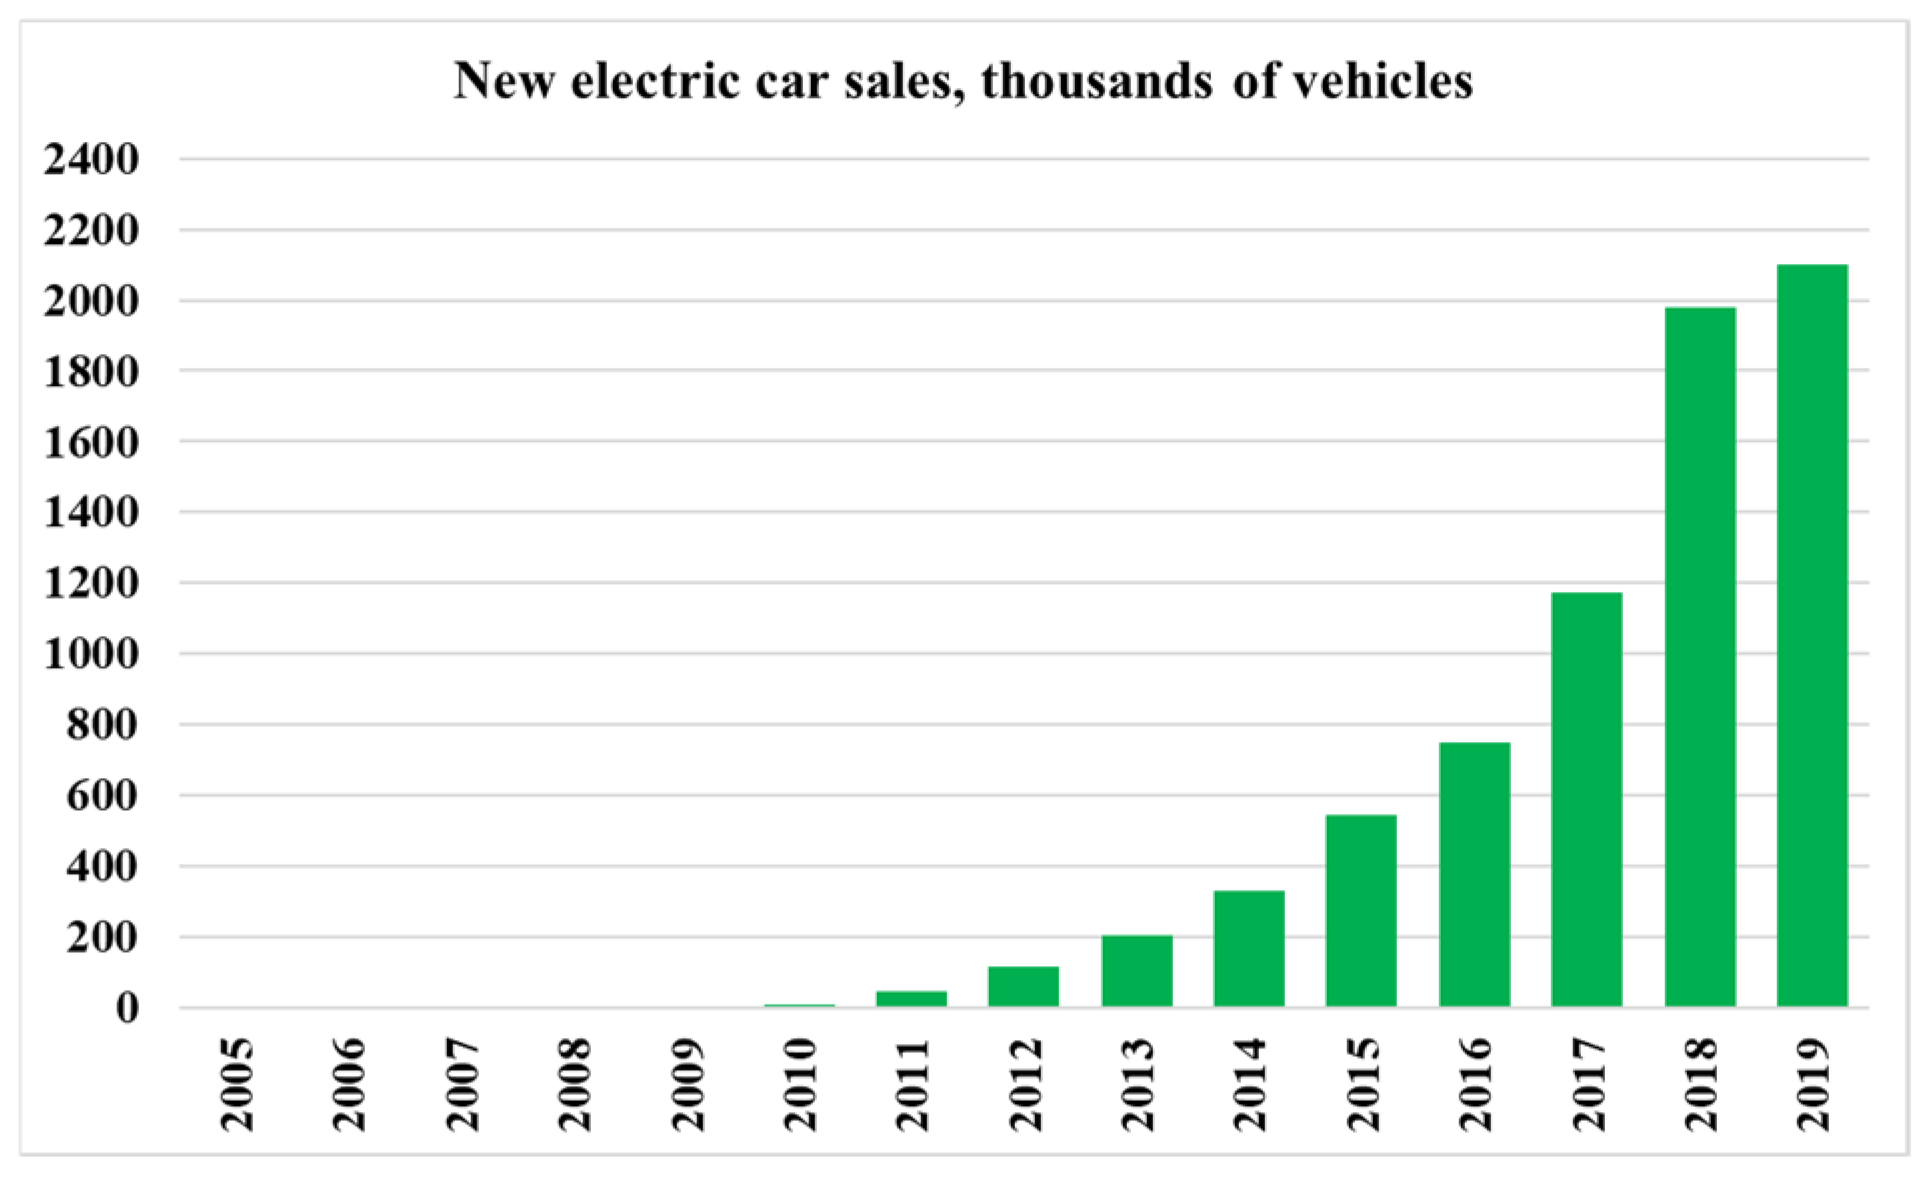
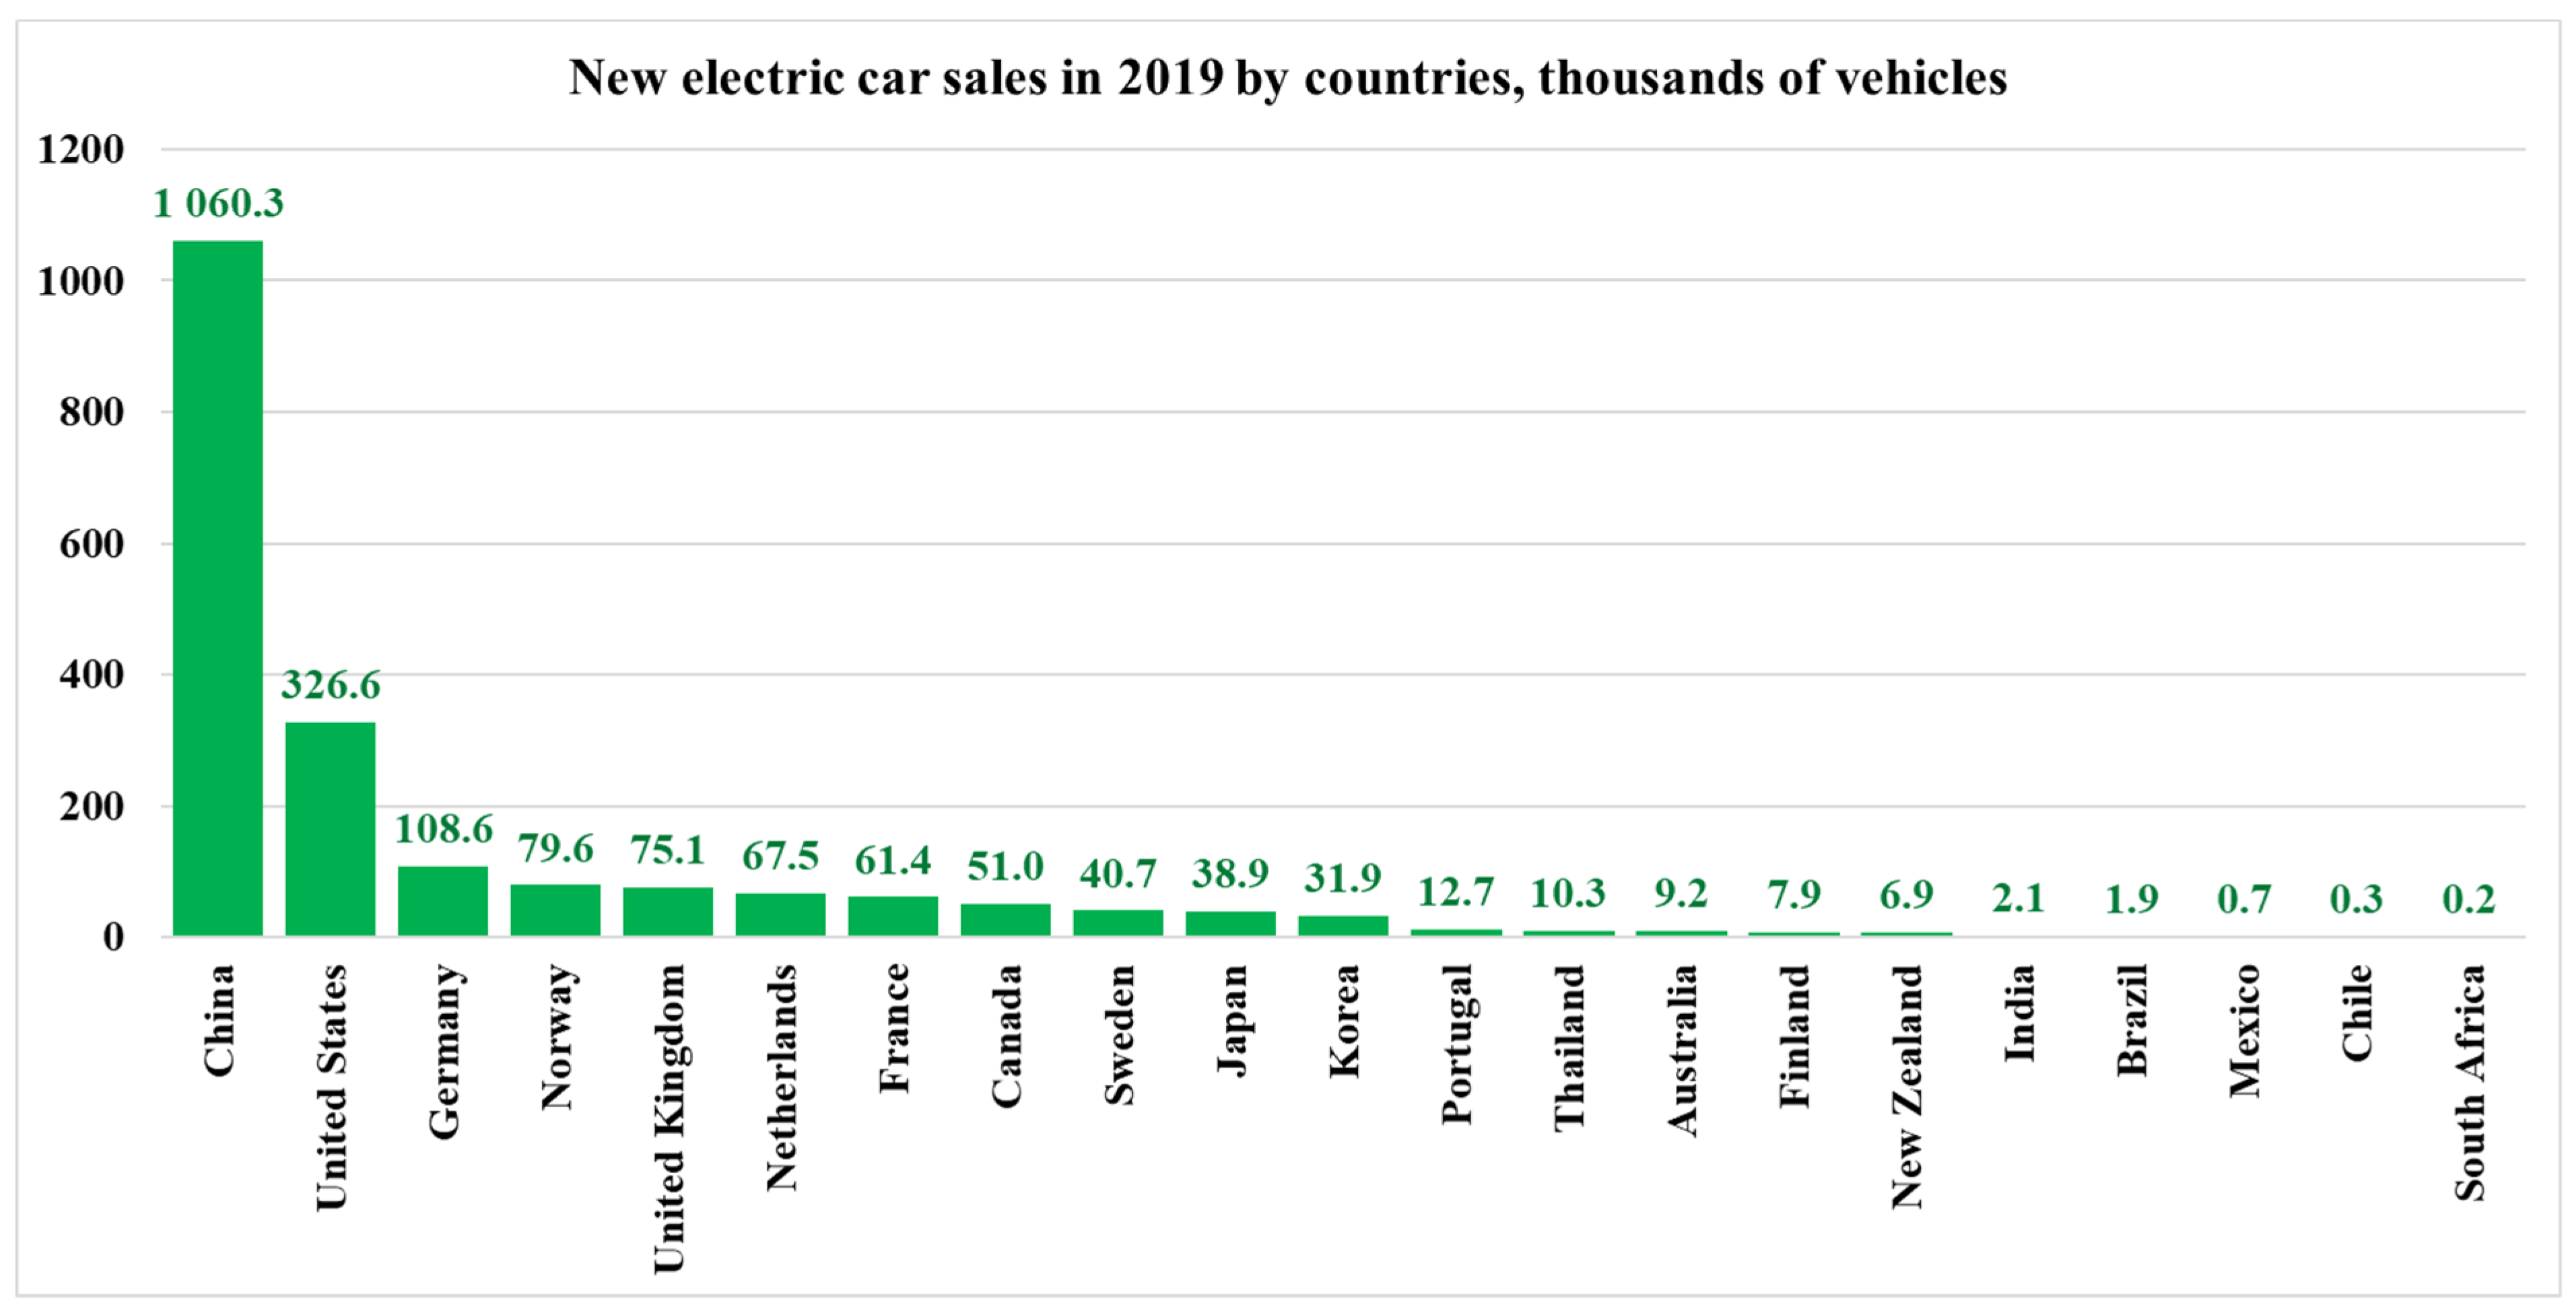
3.1. Energy-Efficient Technologies
3.2. Renewable Energy
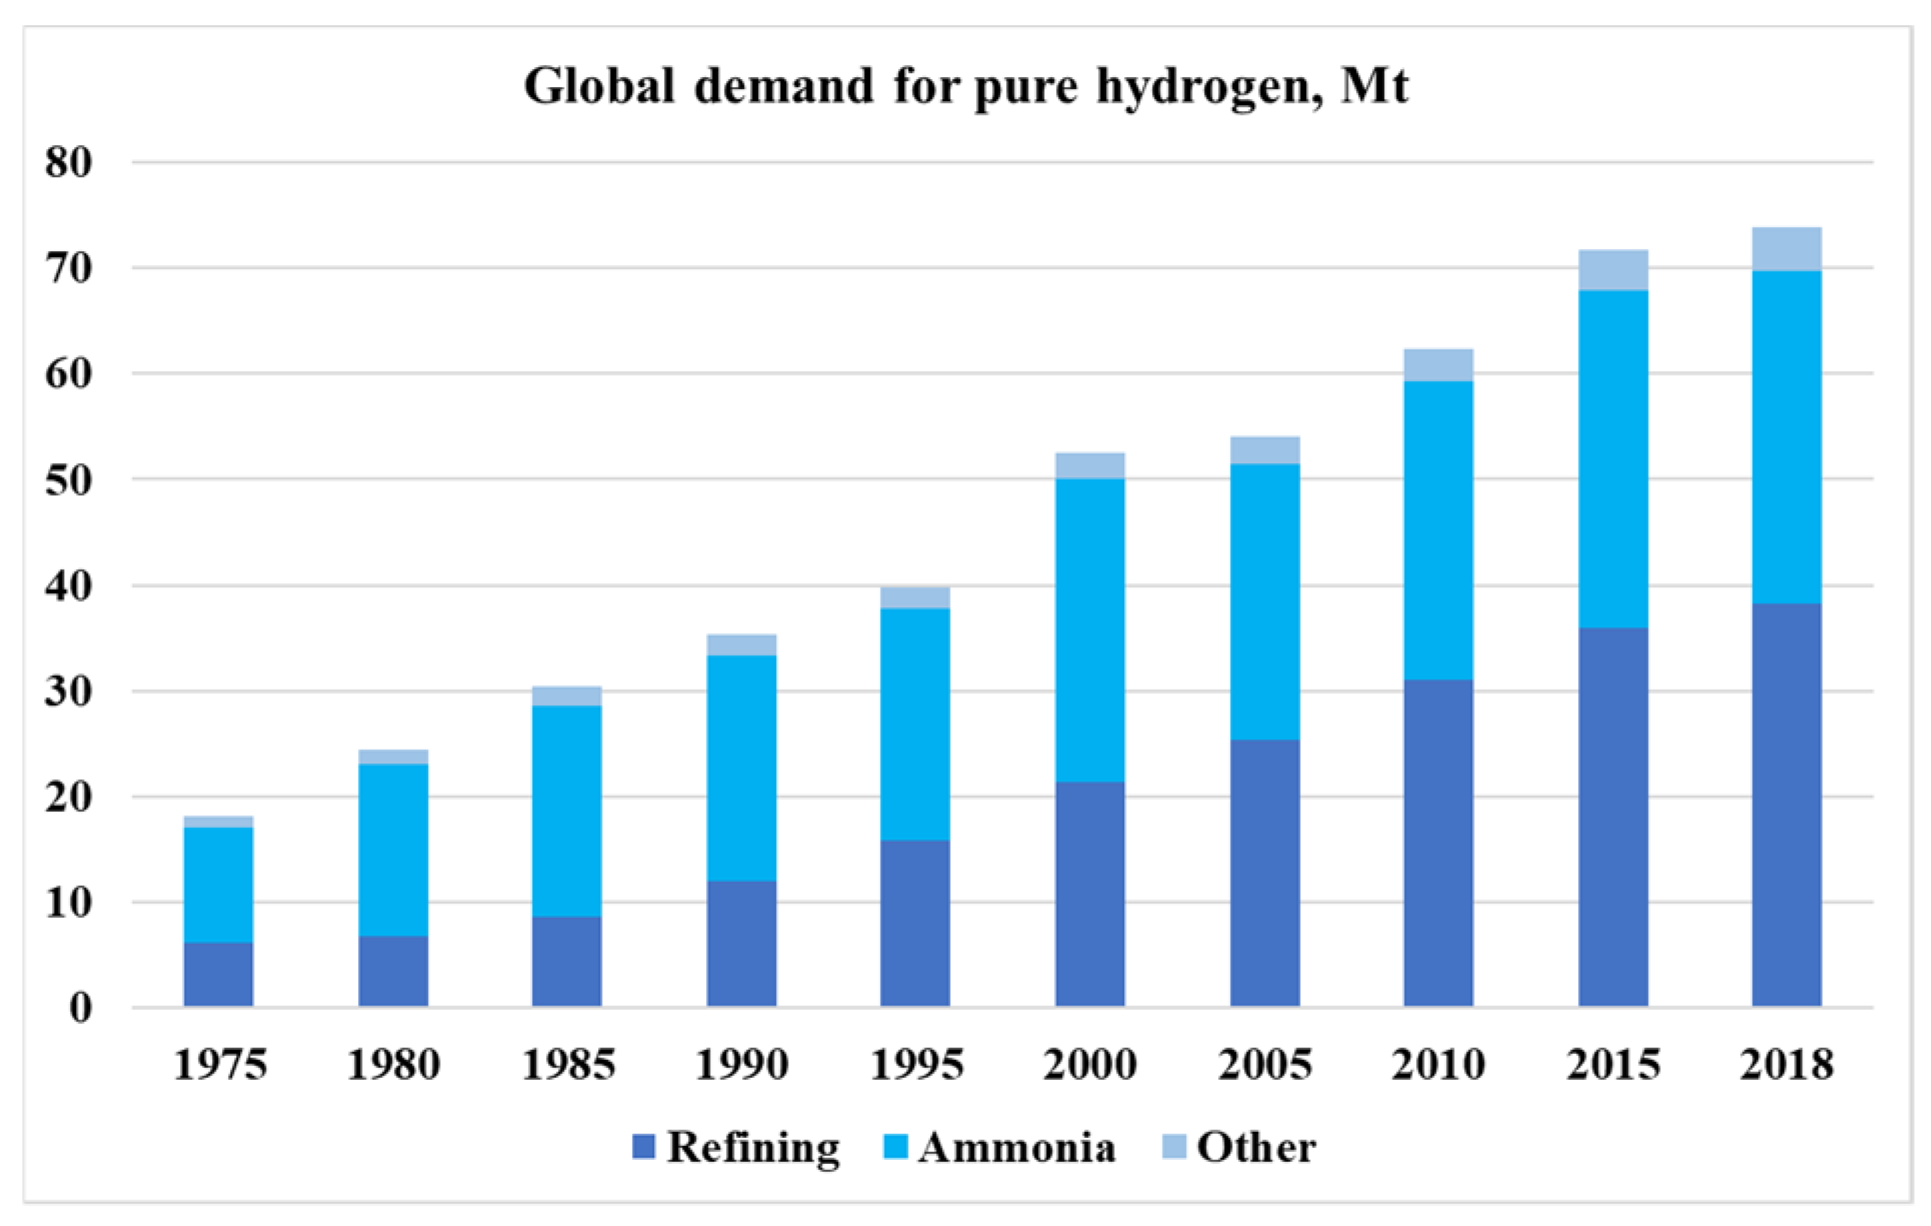
3.3. Hydrogen
4. Mathematical Description
4.1. Methodology
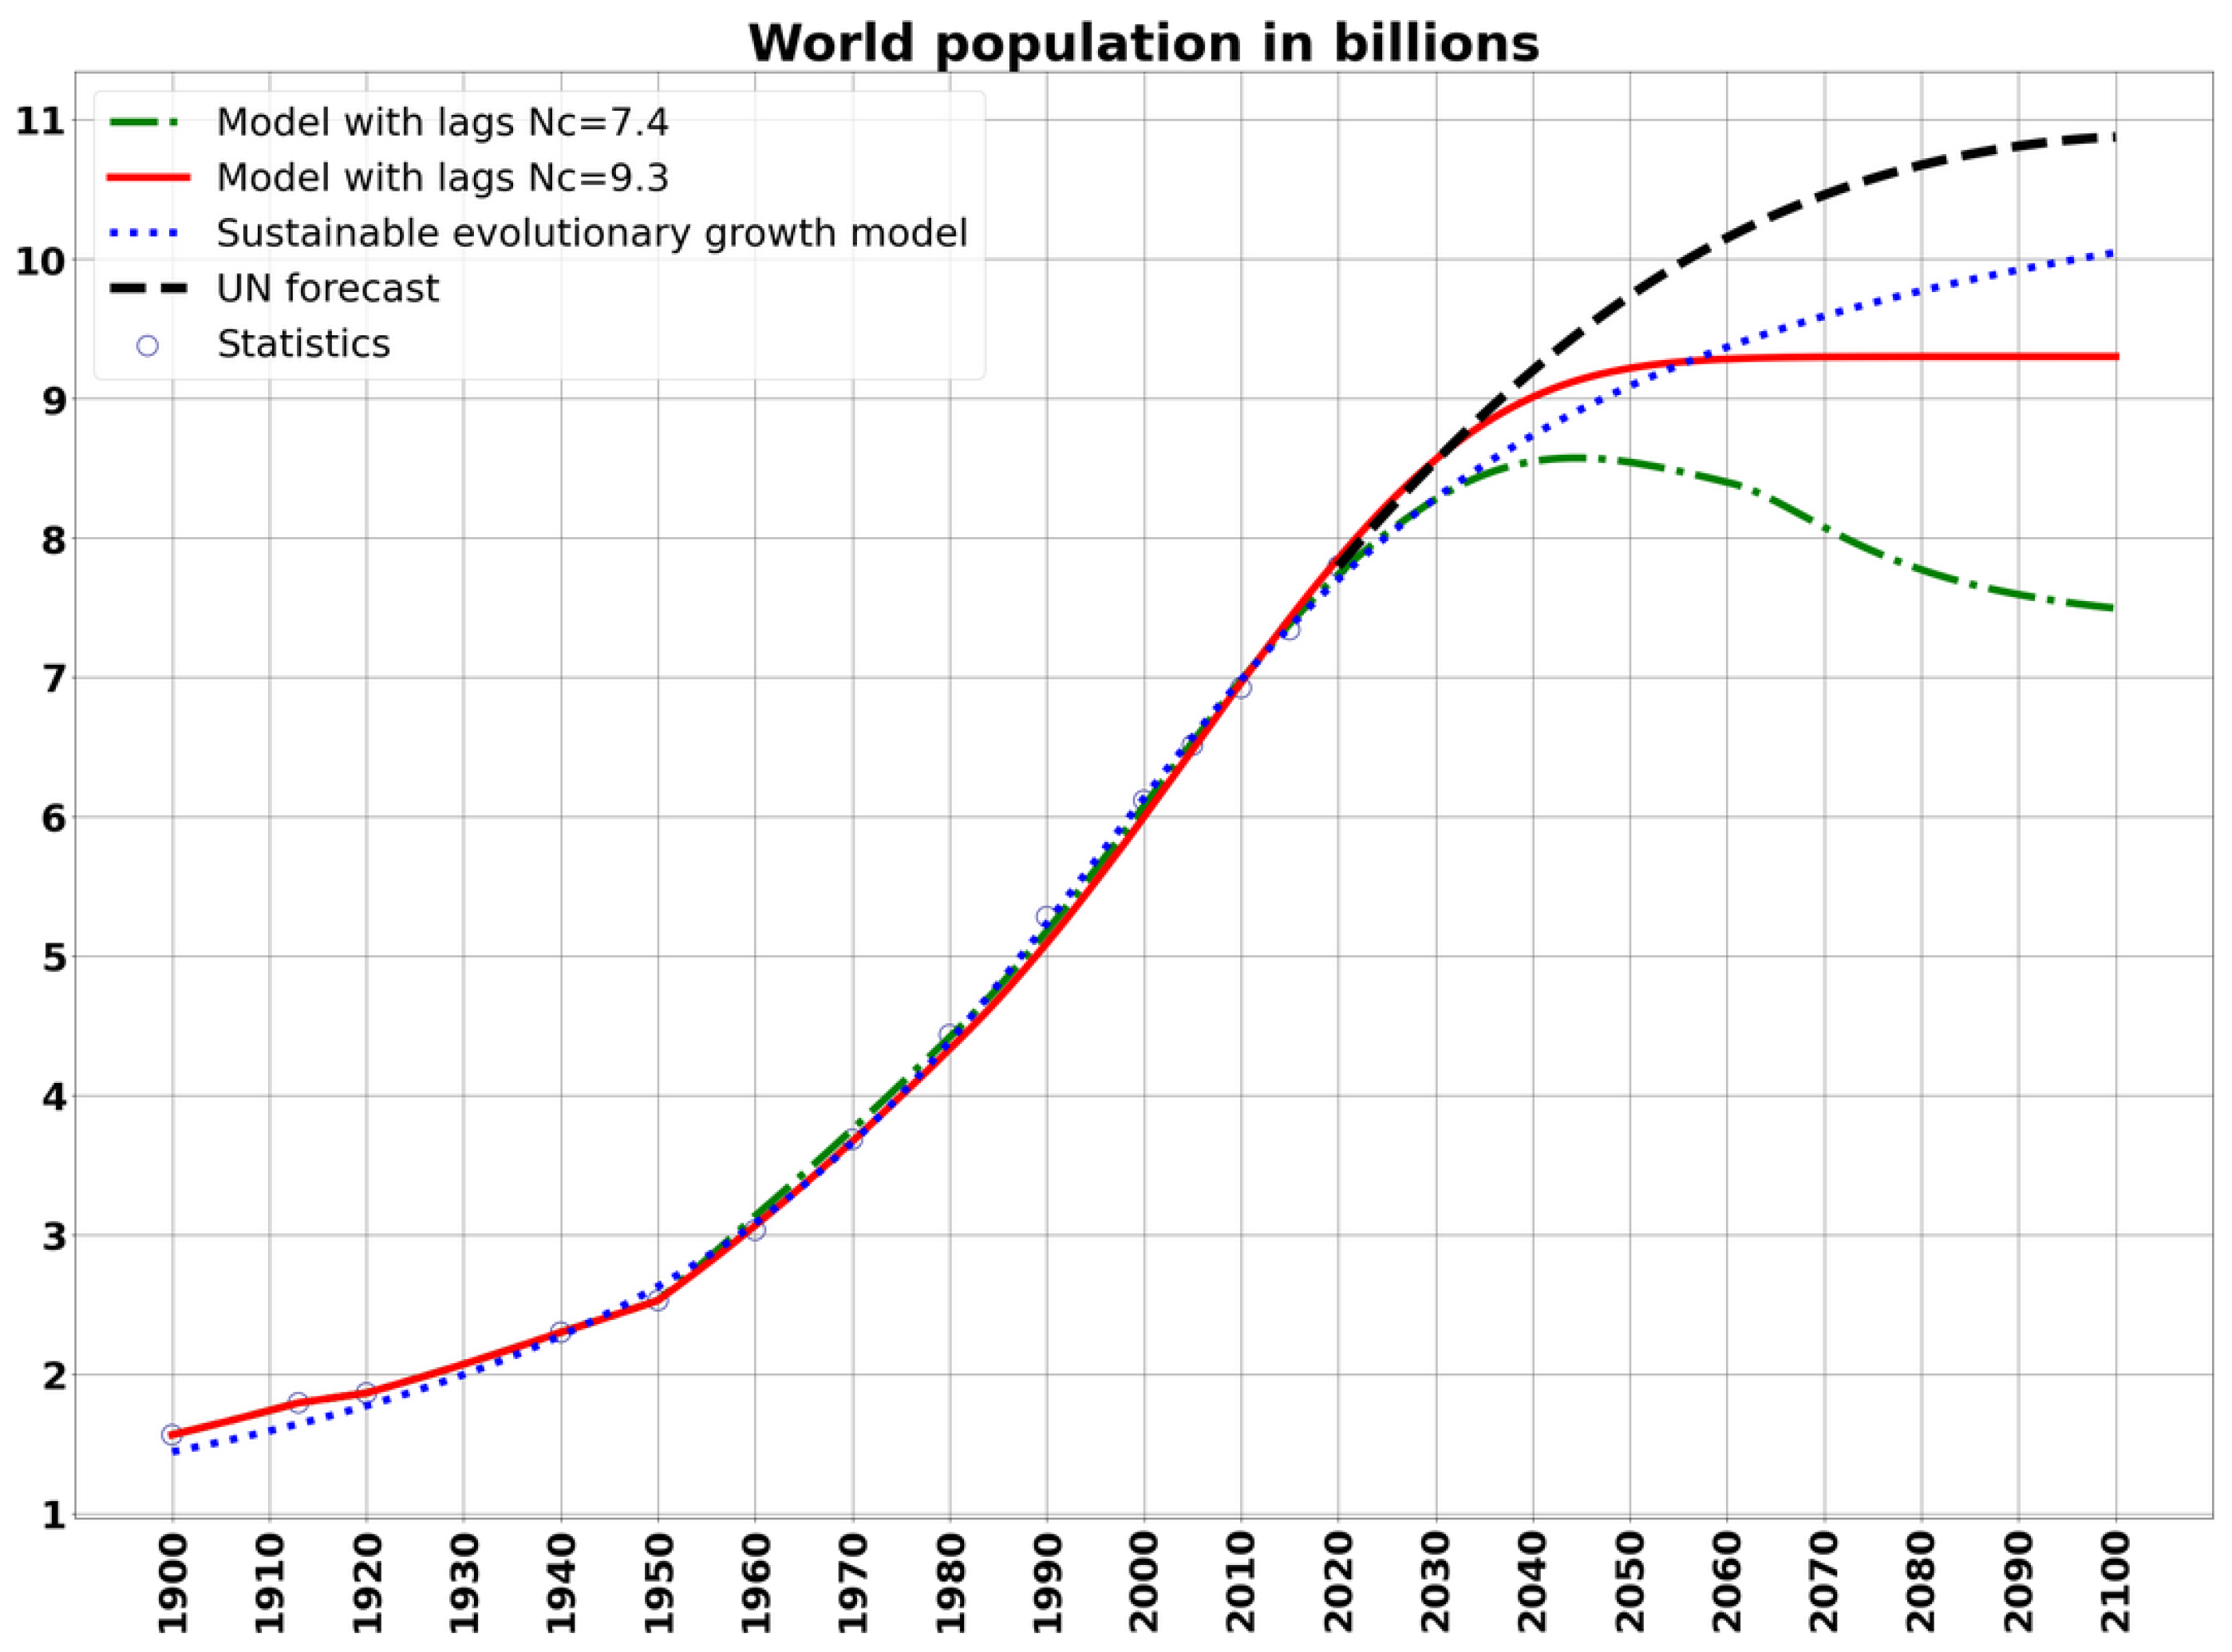
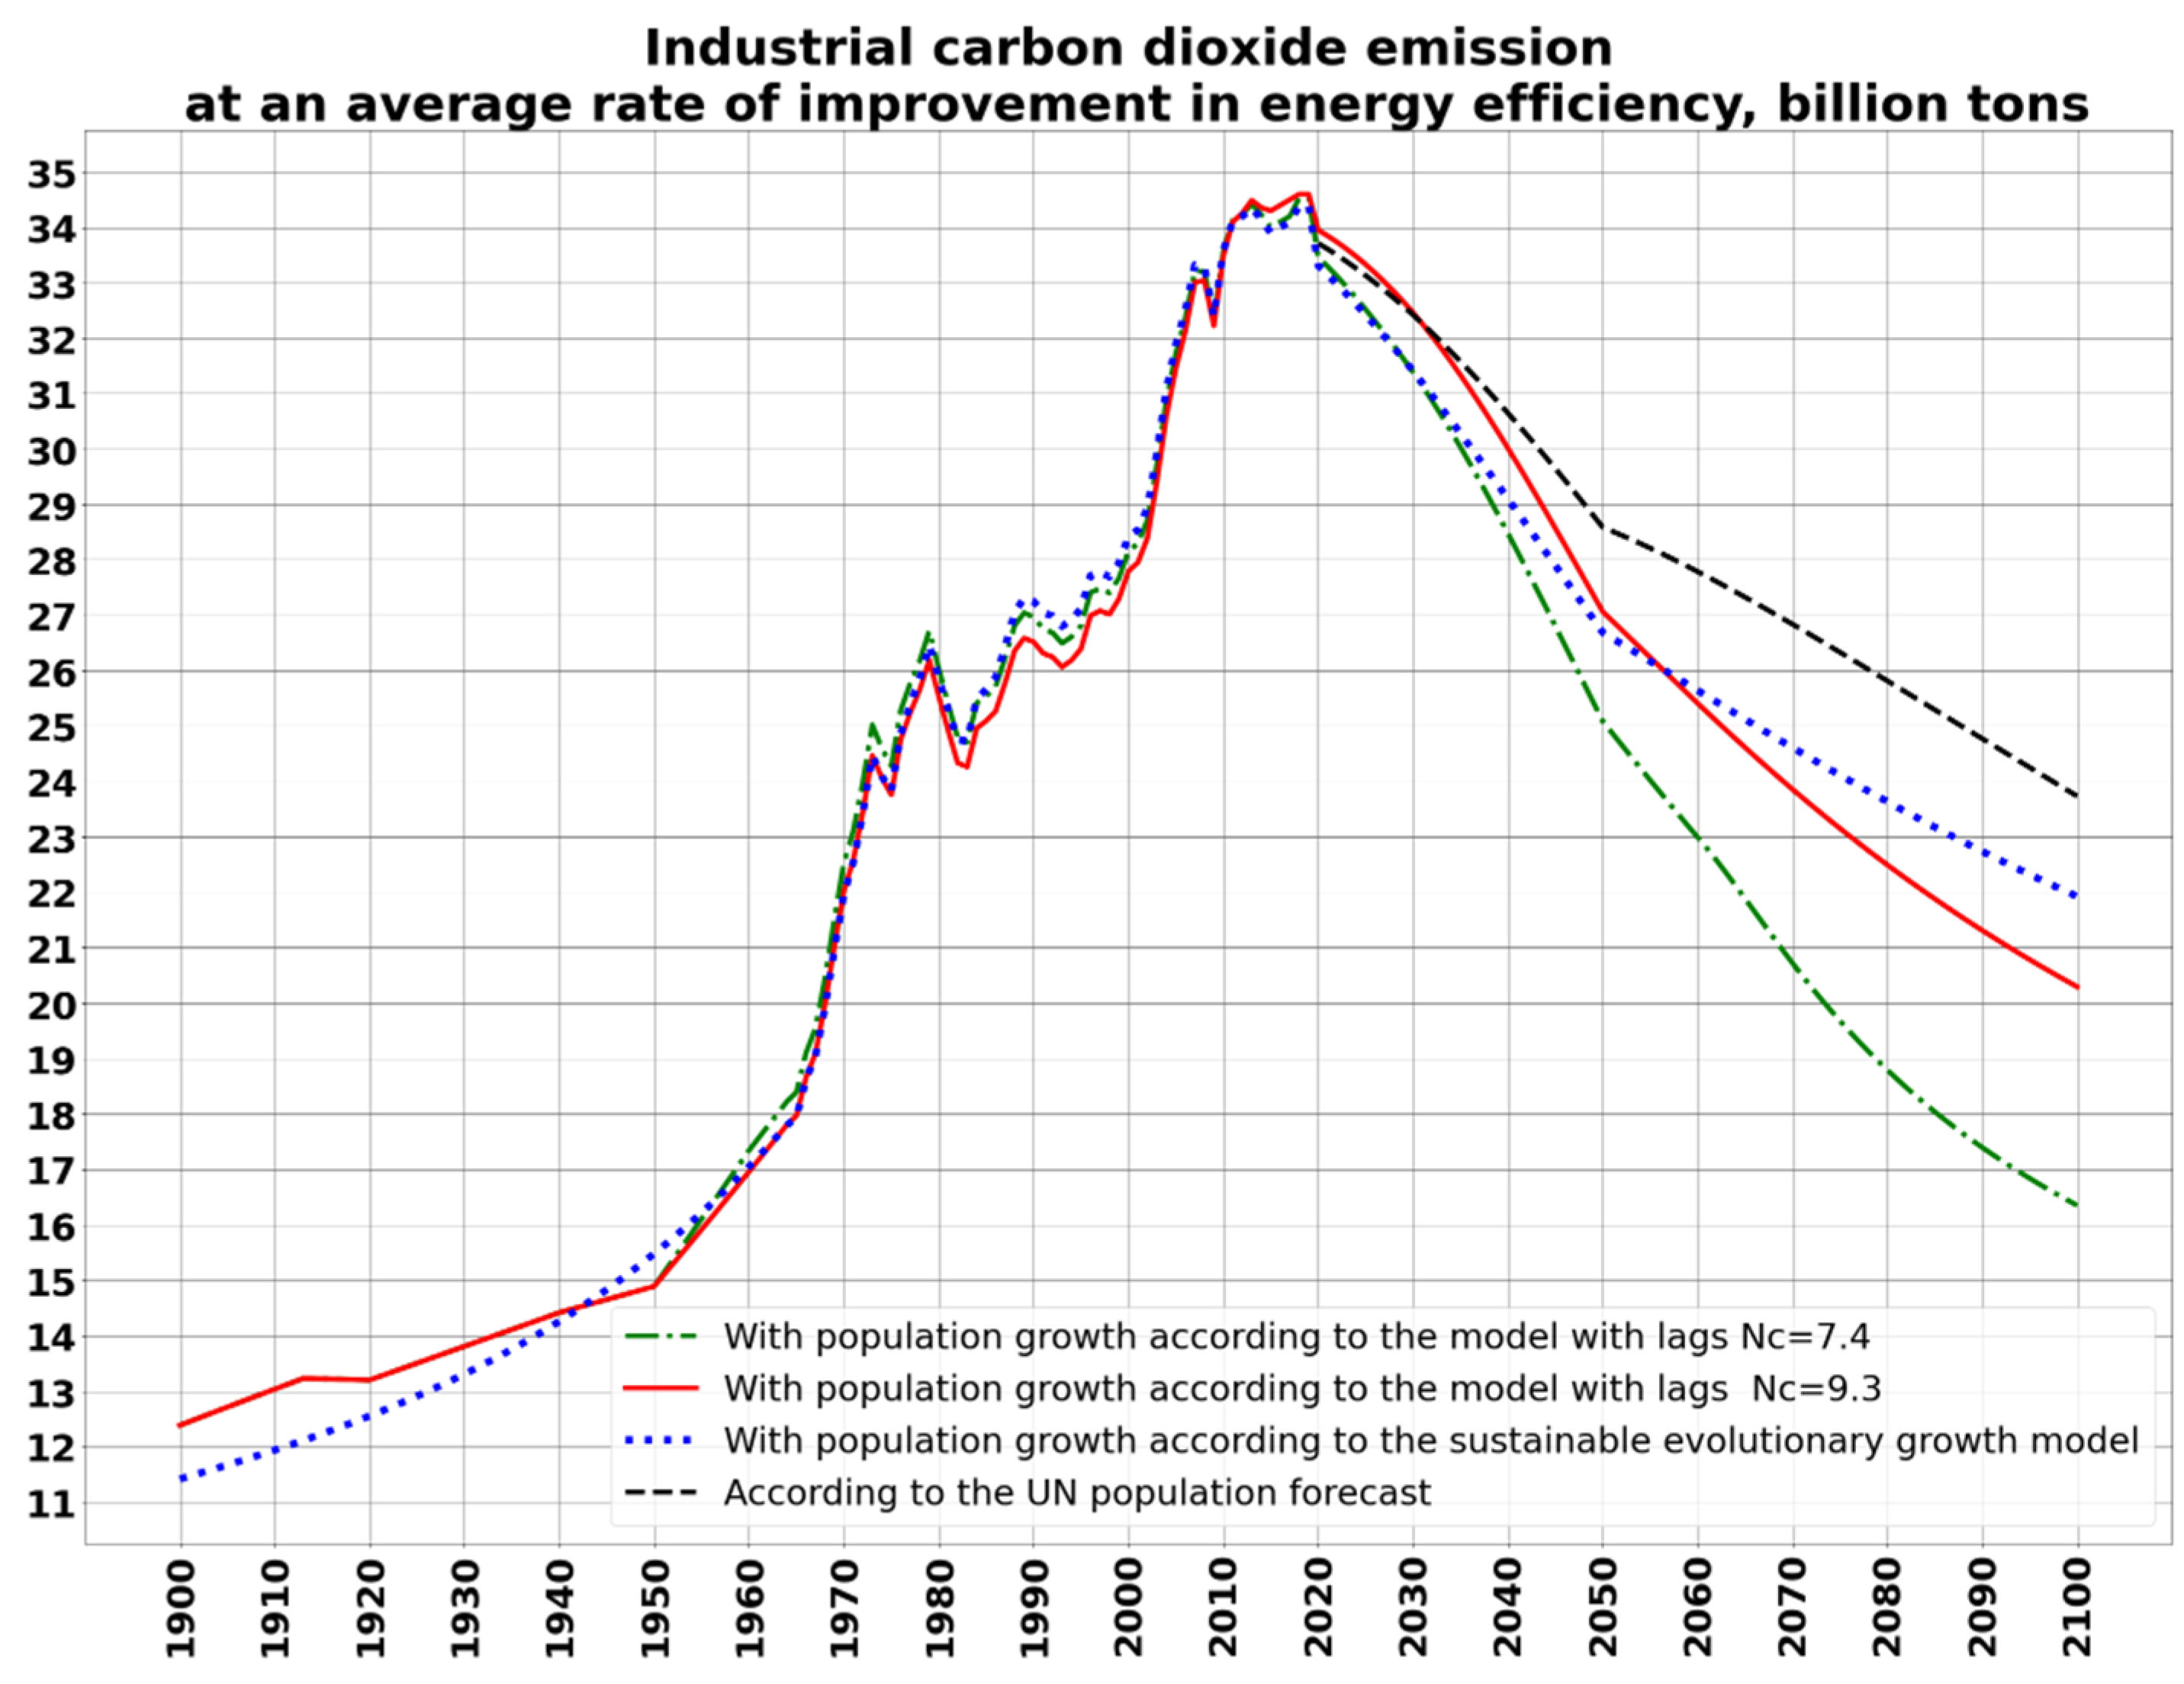
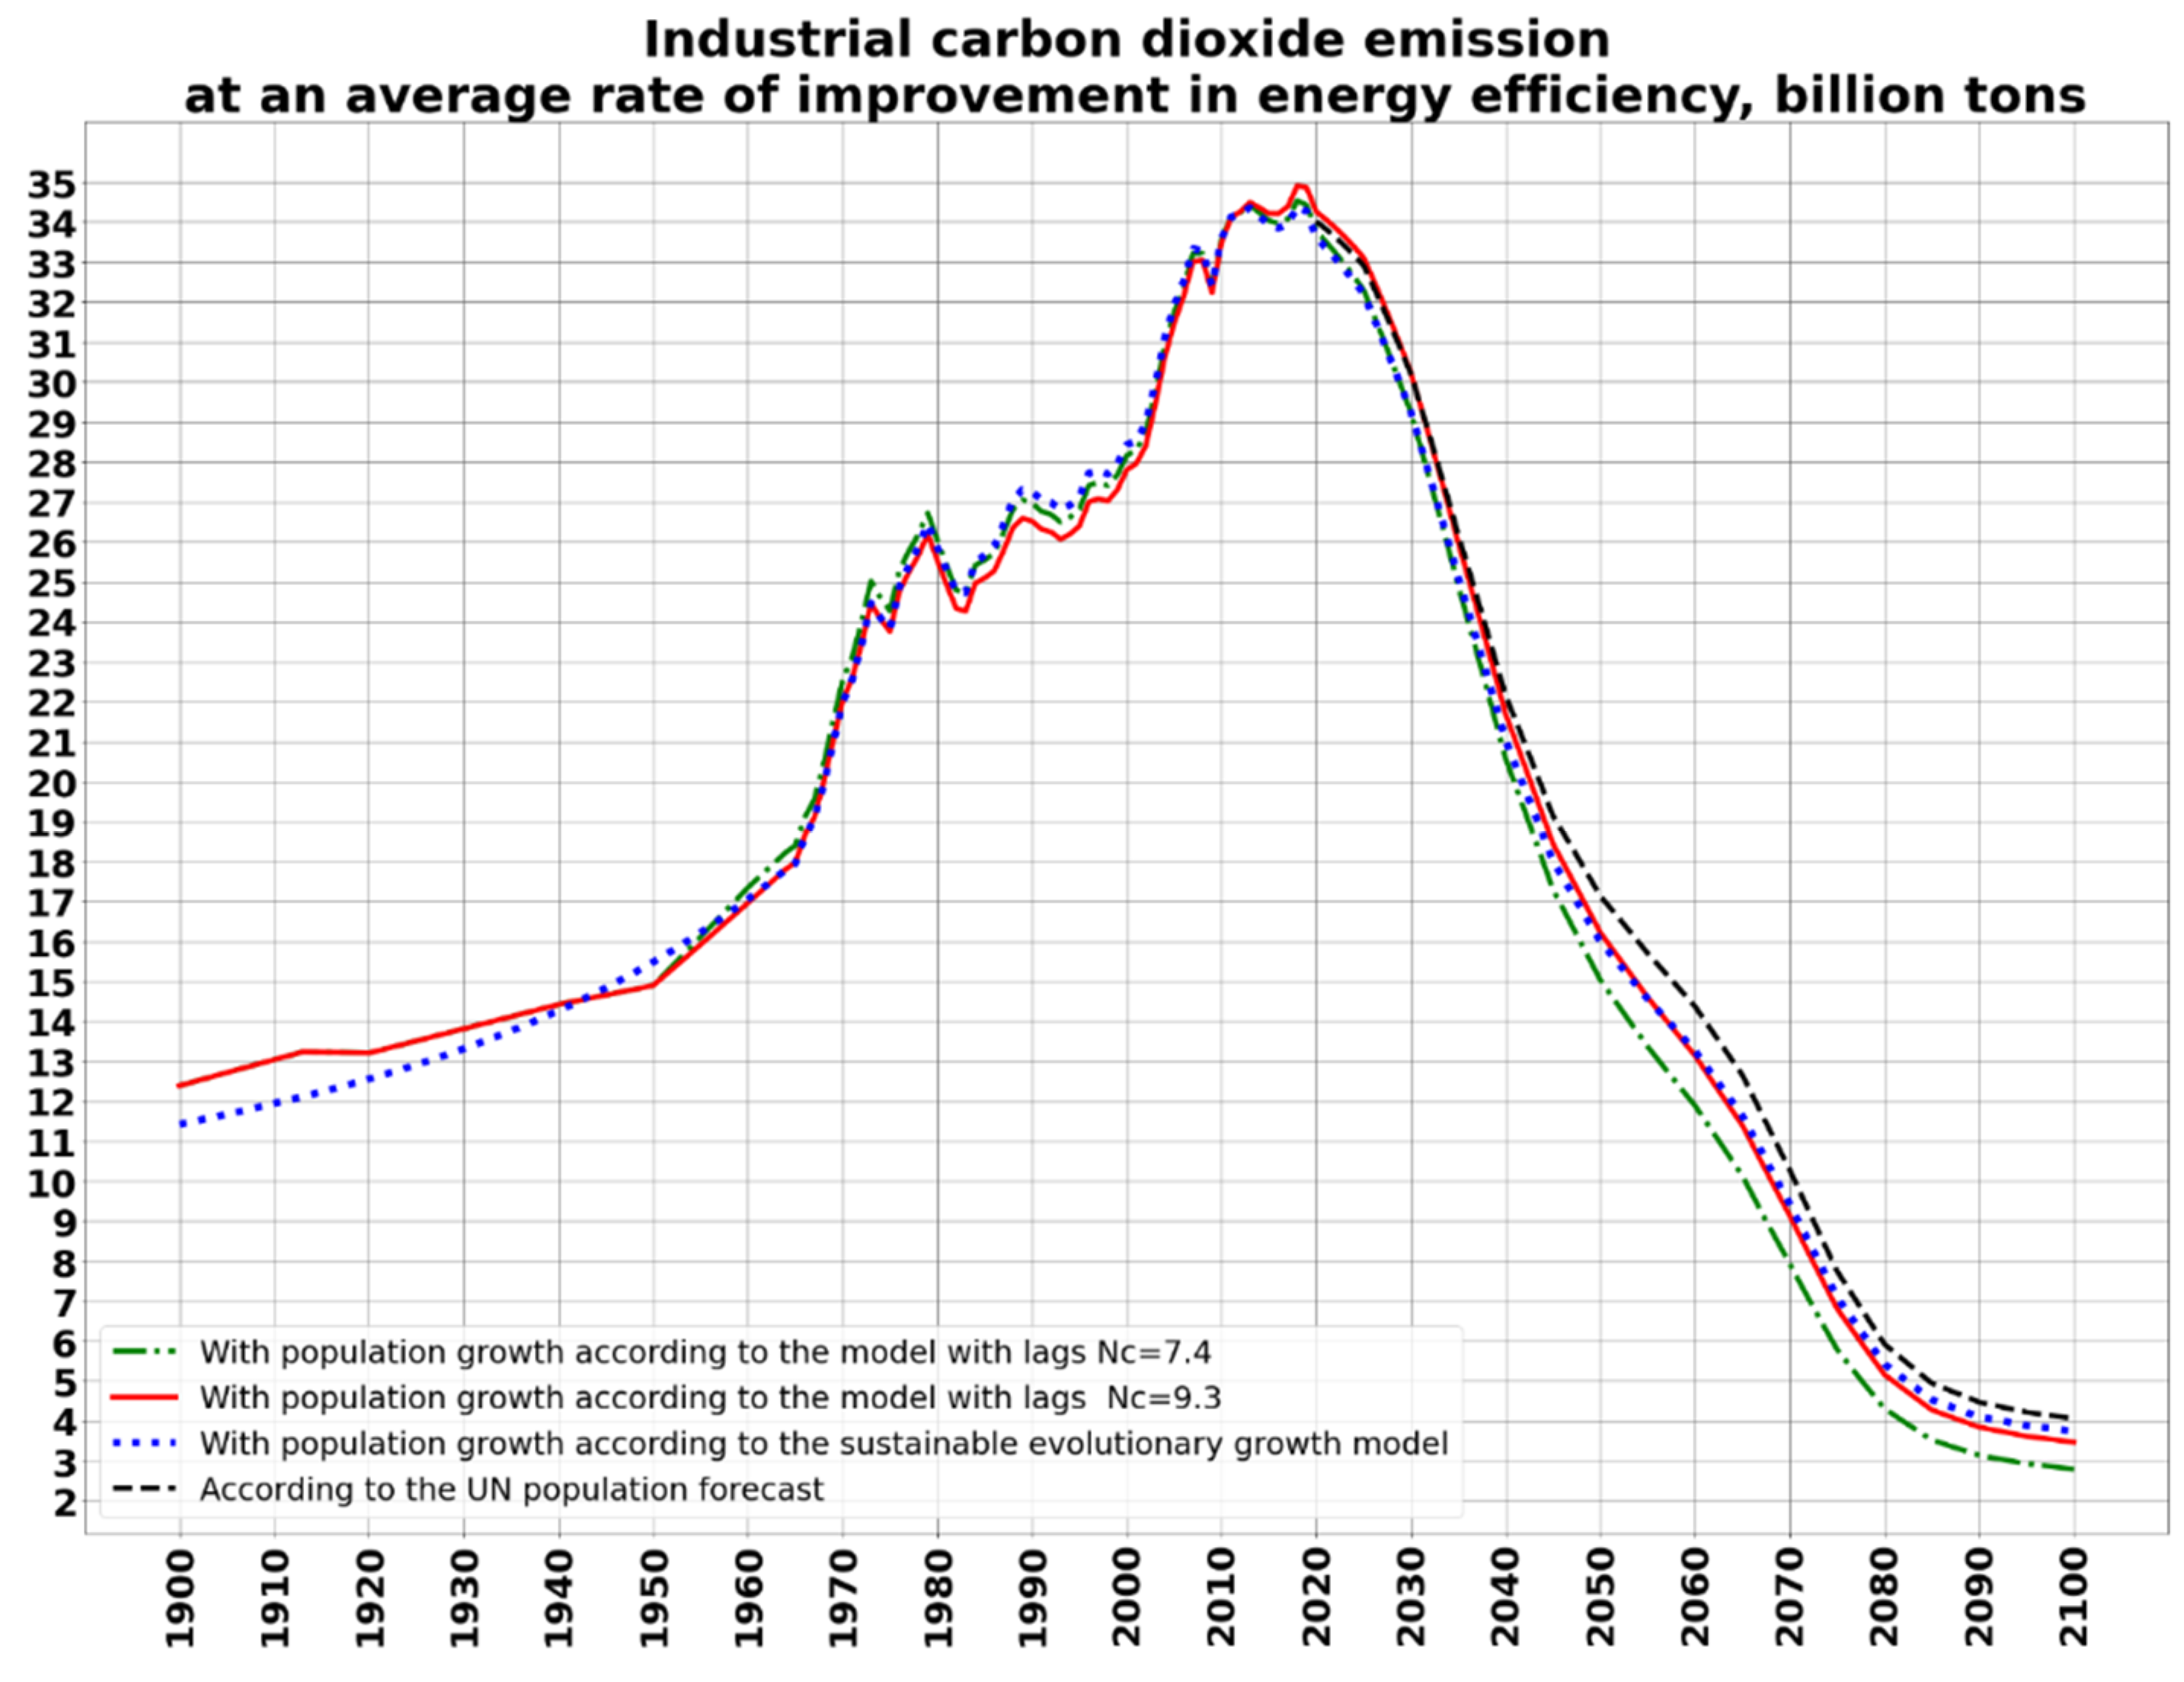
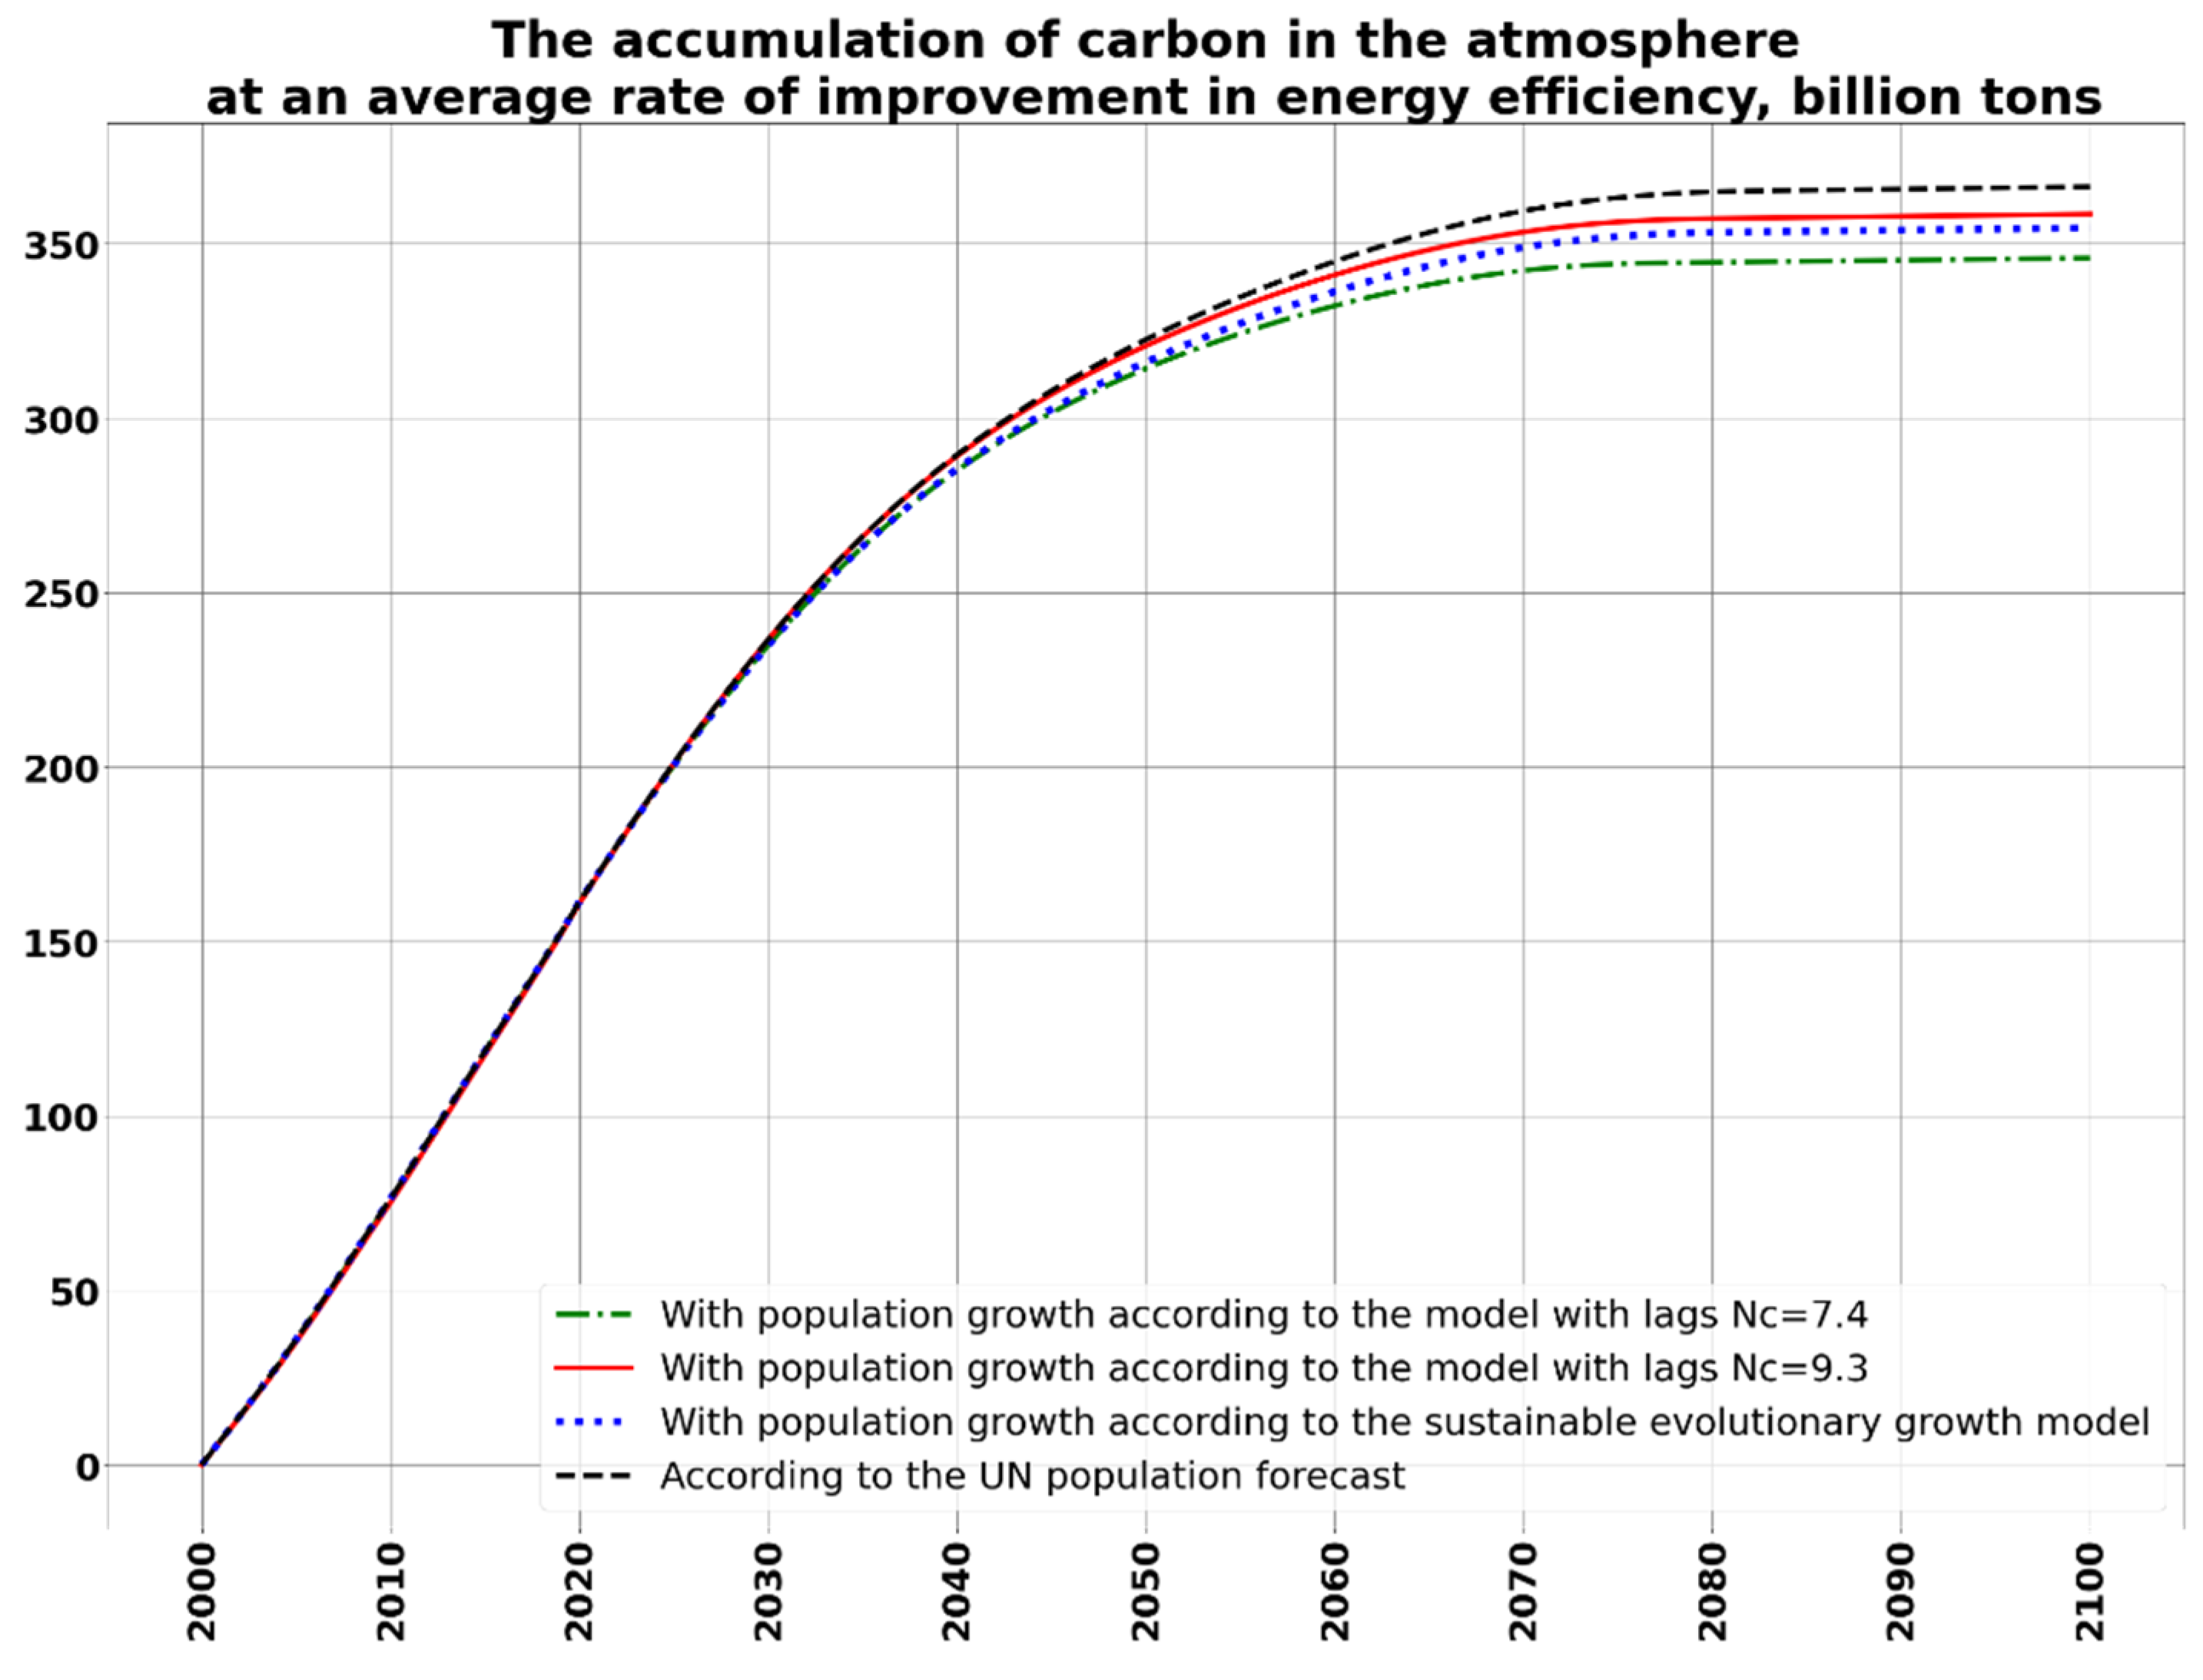
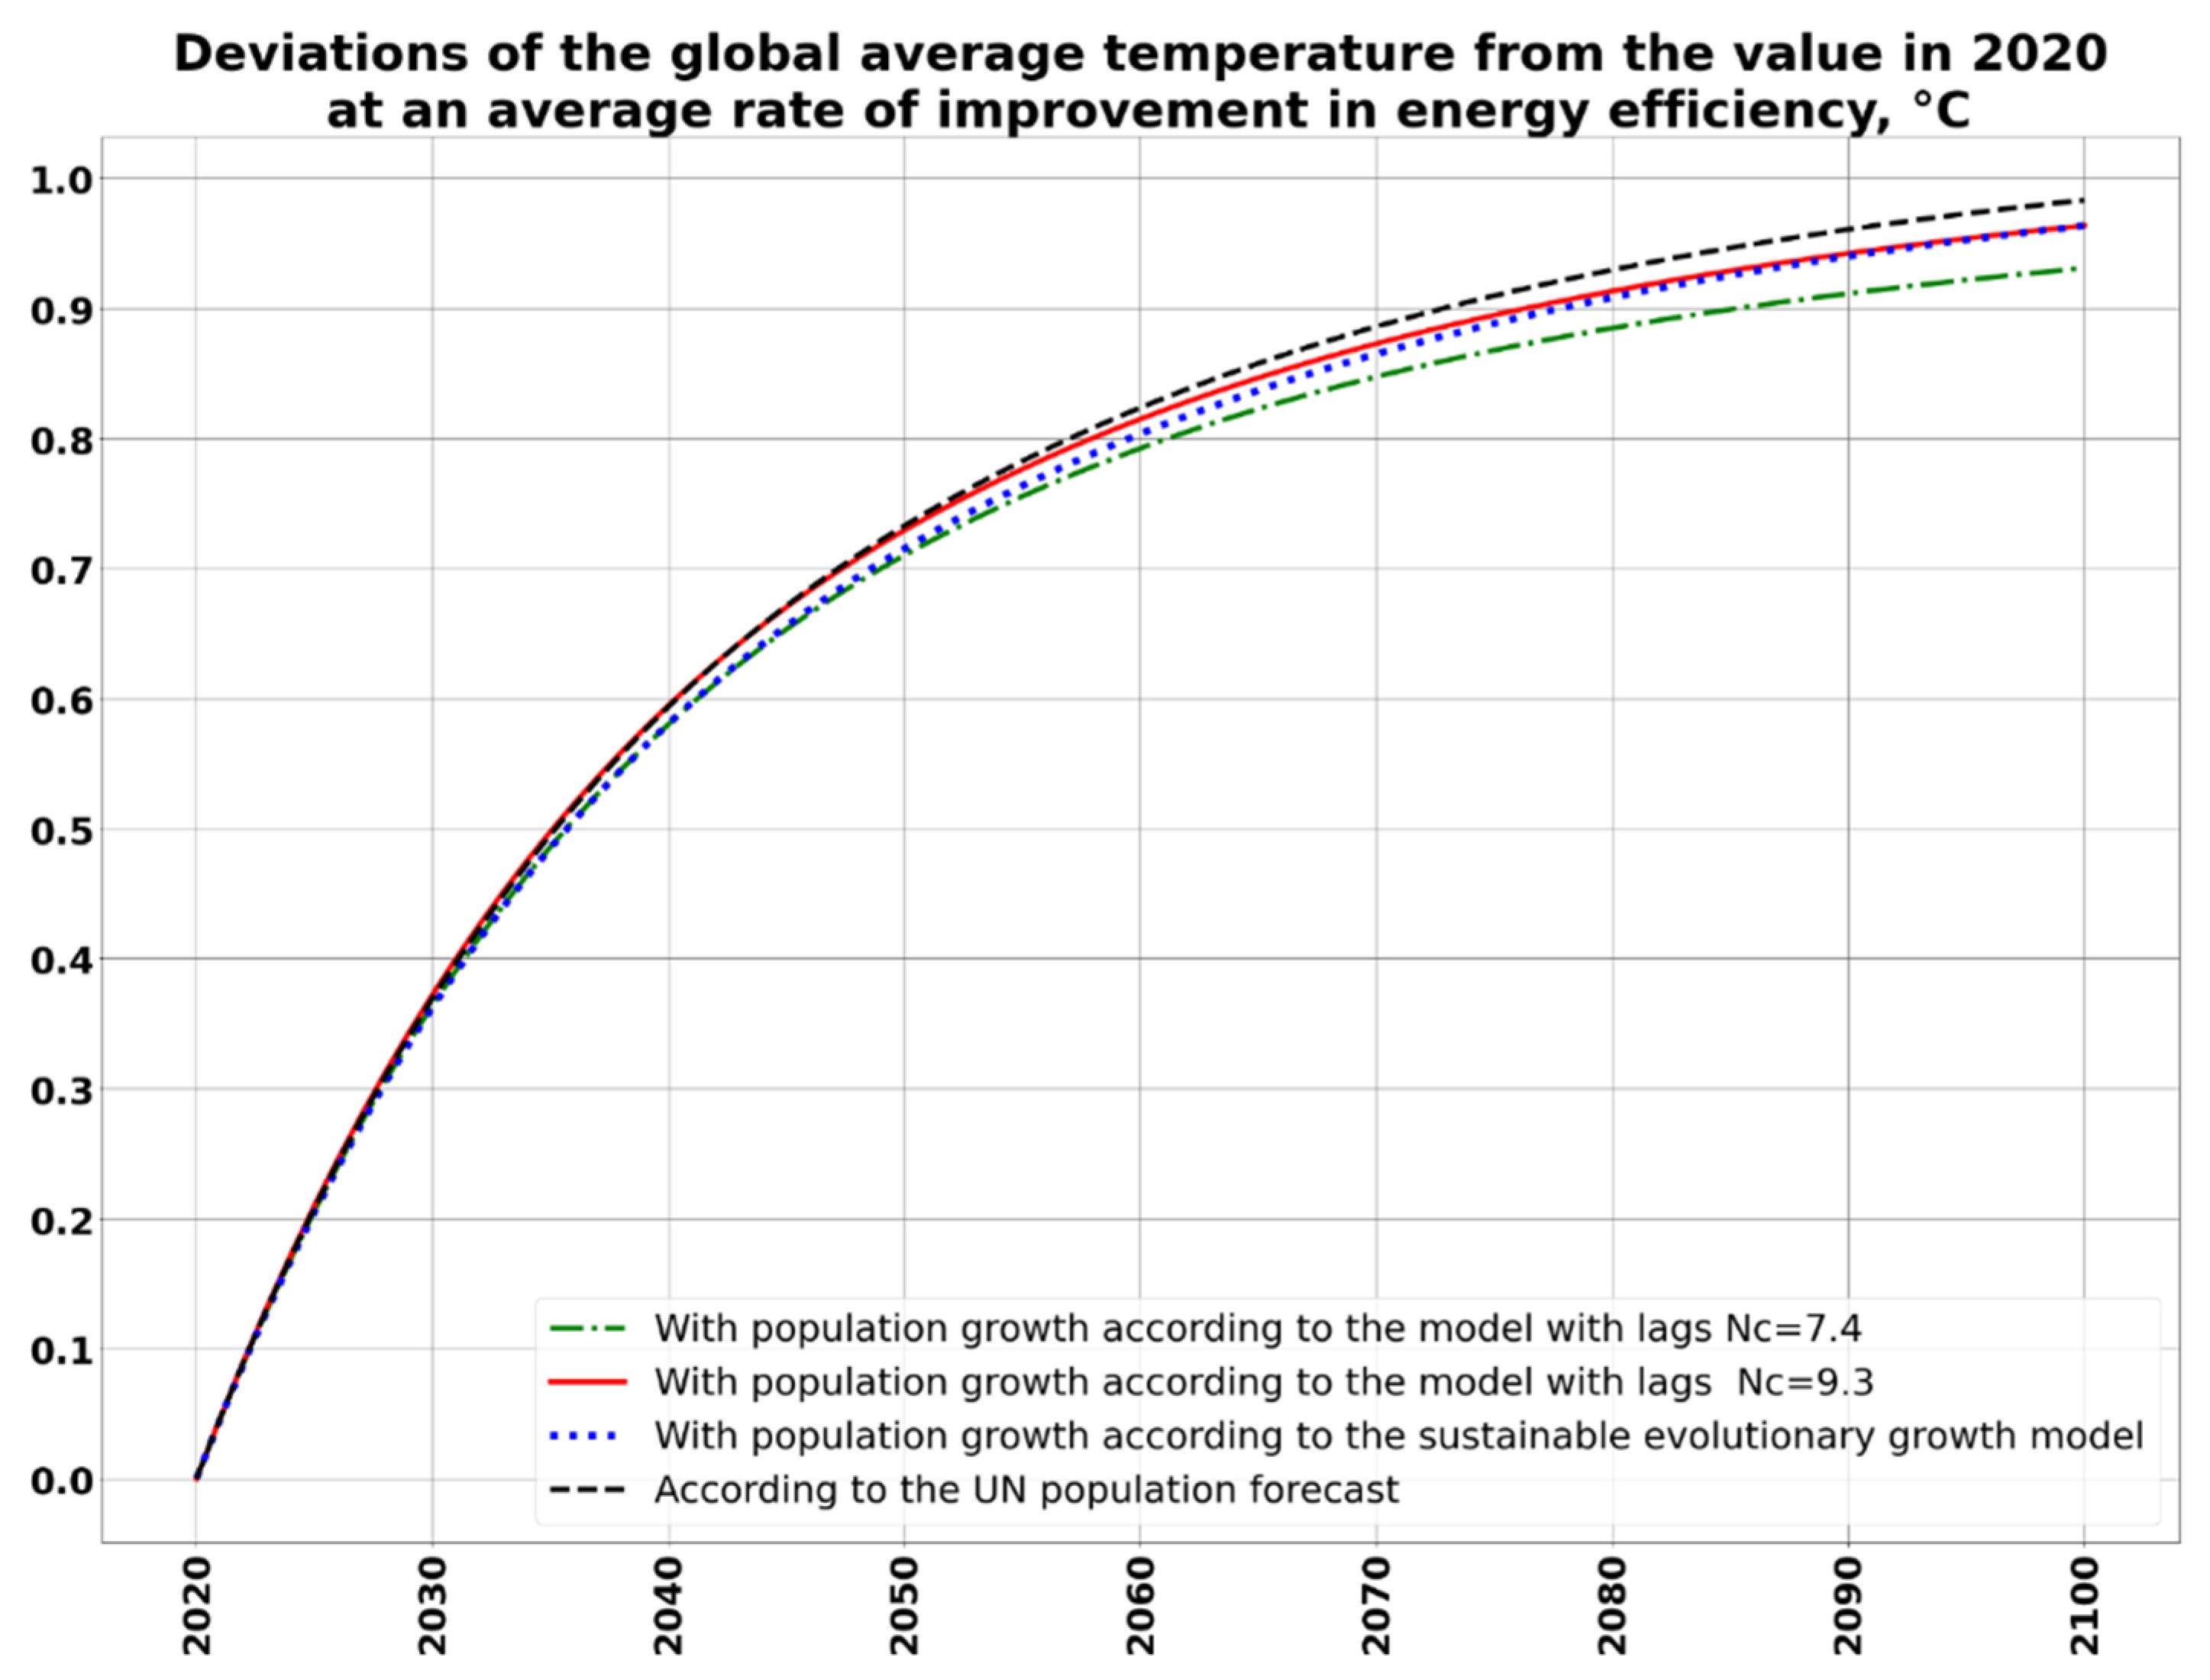
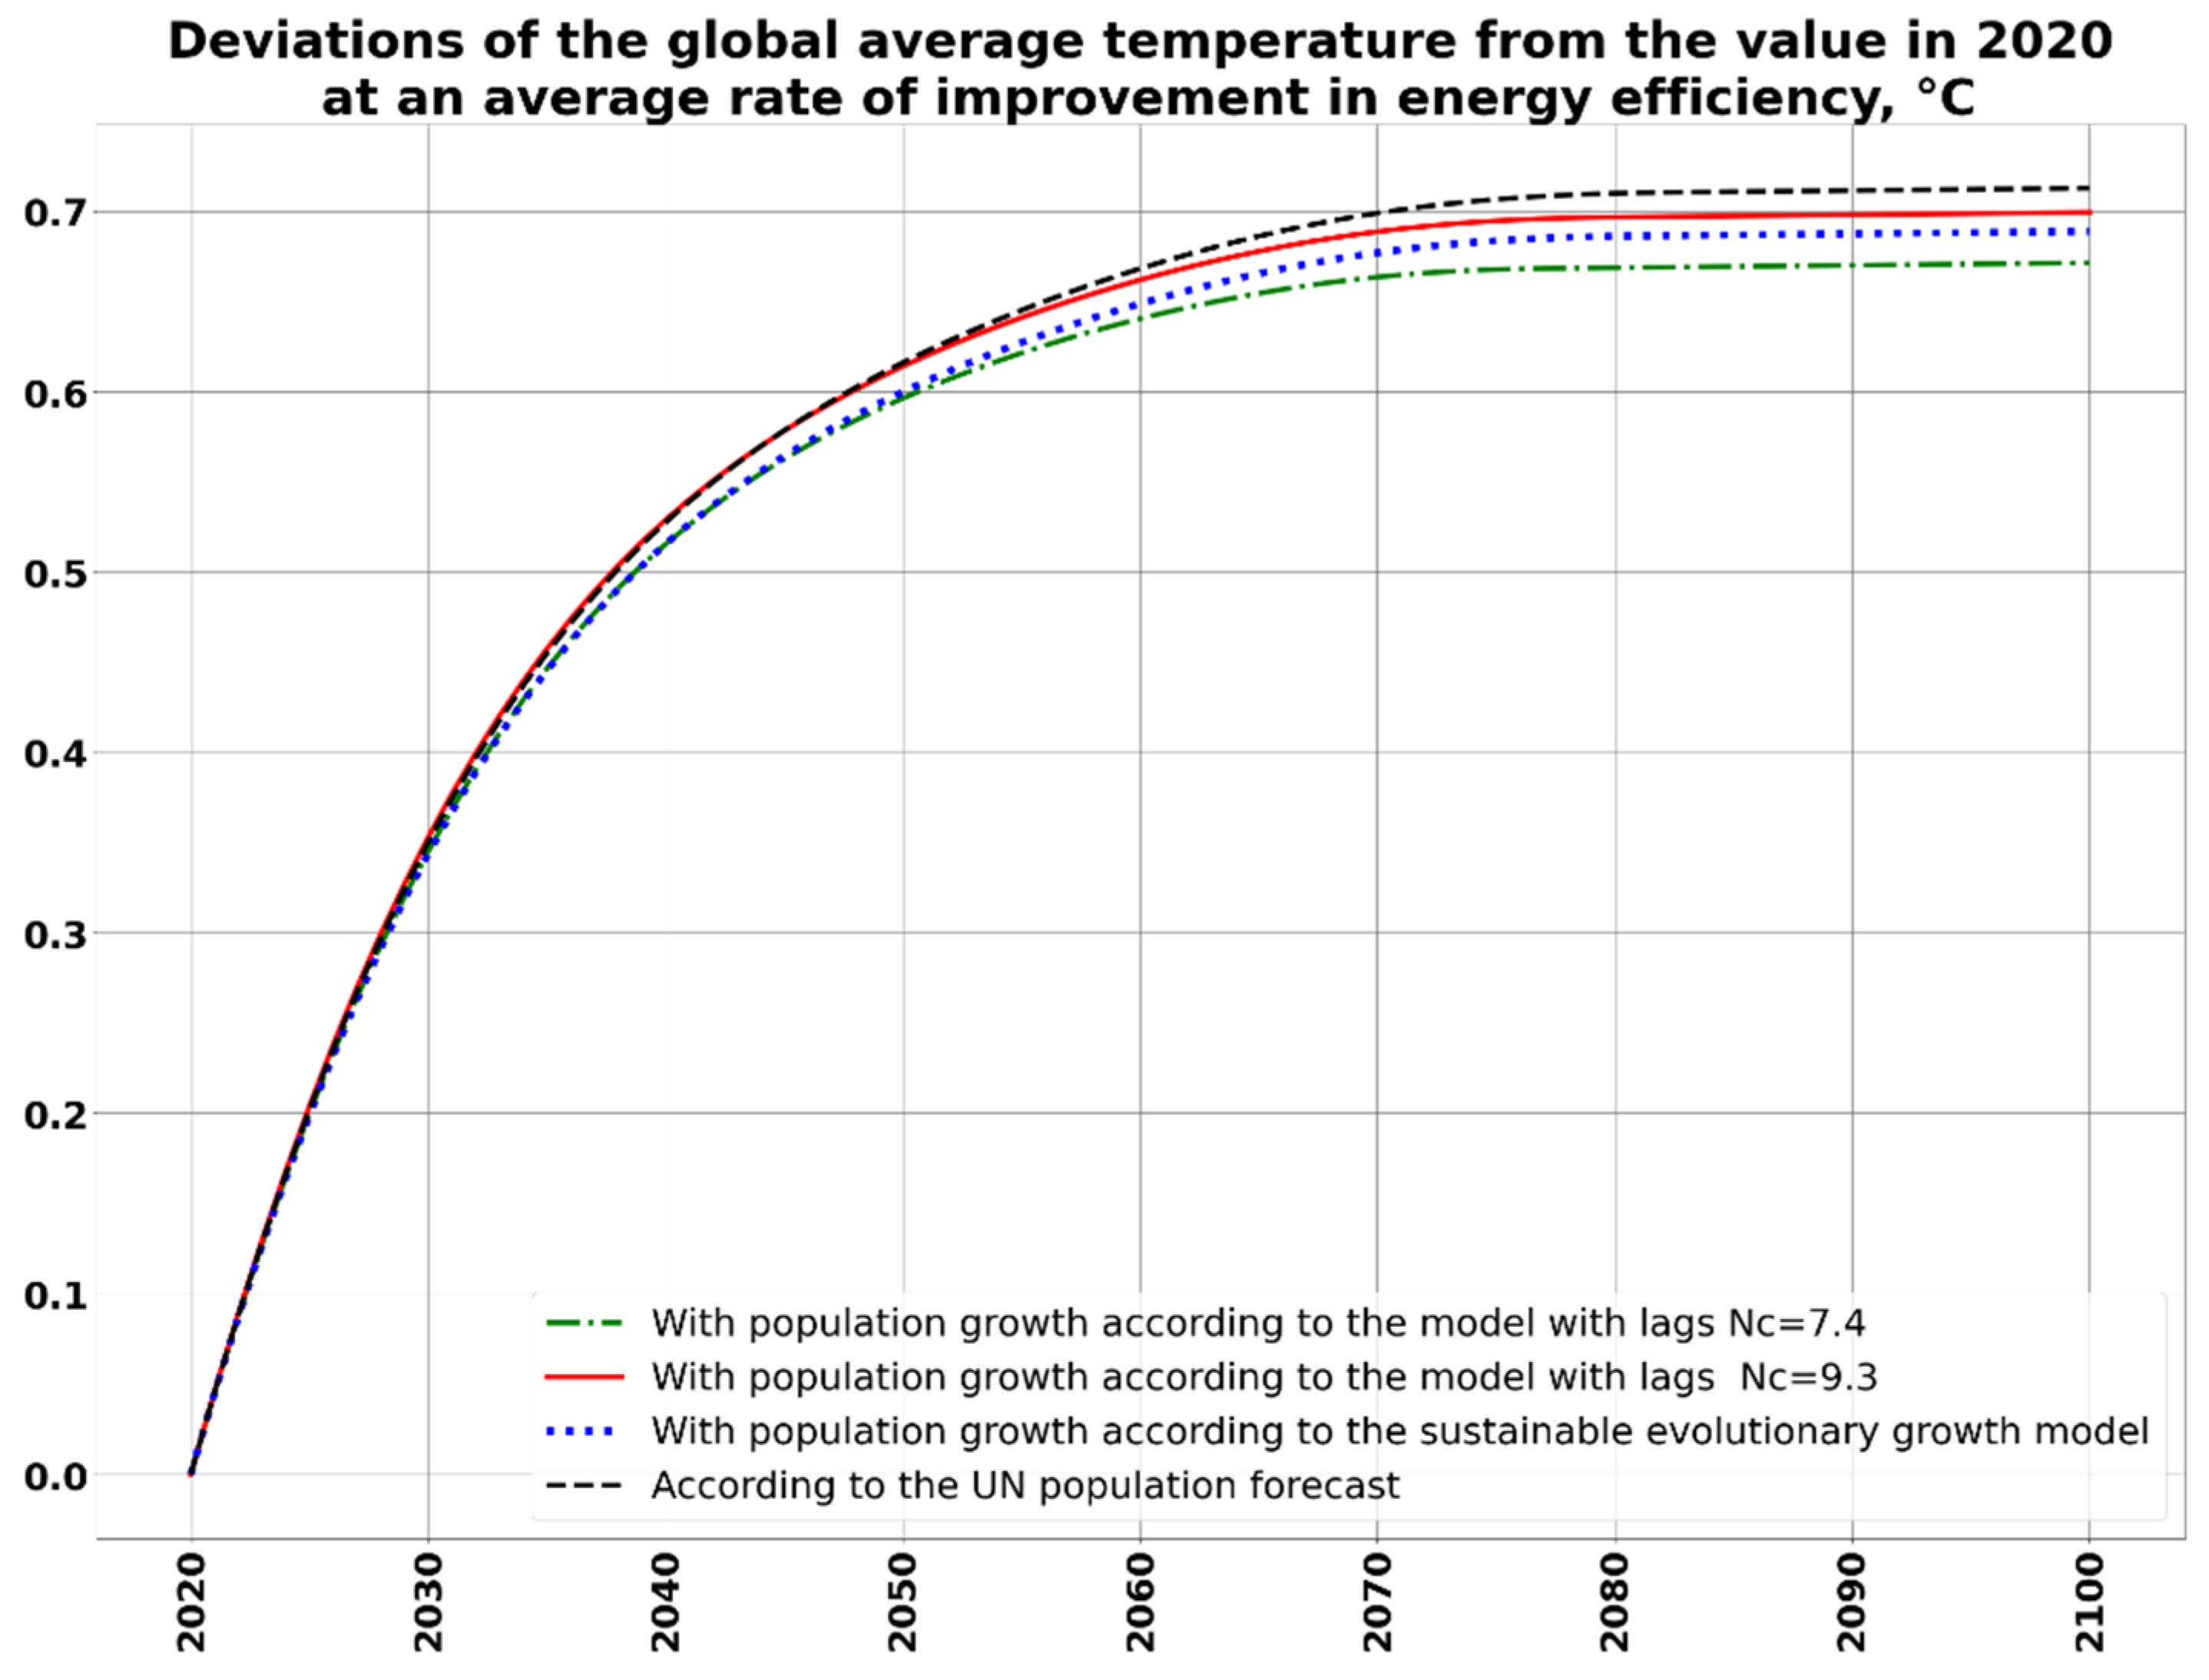
- 7.4 billion people by the year 2100 (using the model with lags described in [70]);
- 9.3 billion people by the year 2100 (using the model with lags [70]);
- 10 billion people by the year 2100 (using the model of sustainable evolutionary growth according to Kapitsa [71]); and
- 11 billion people by the year 2100 (according to the UN scenario [72]).
4.2. Results
5. Conclusions
- -
- calculation of various scenarios of growth in the population of the world;
- -
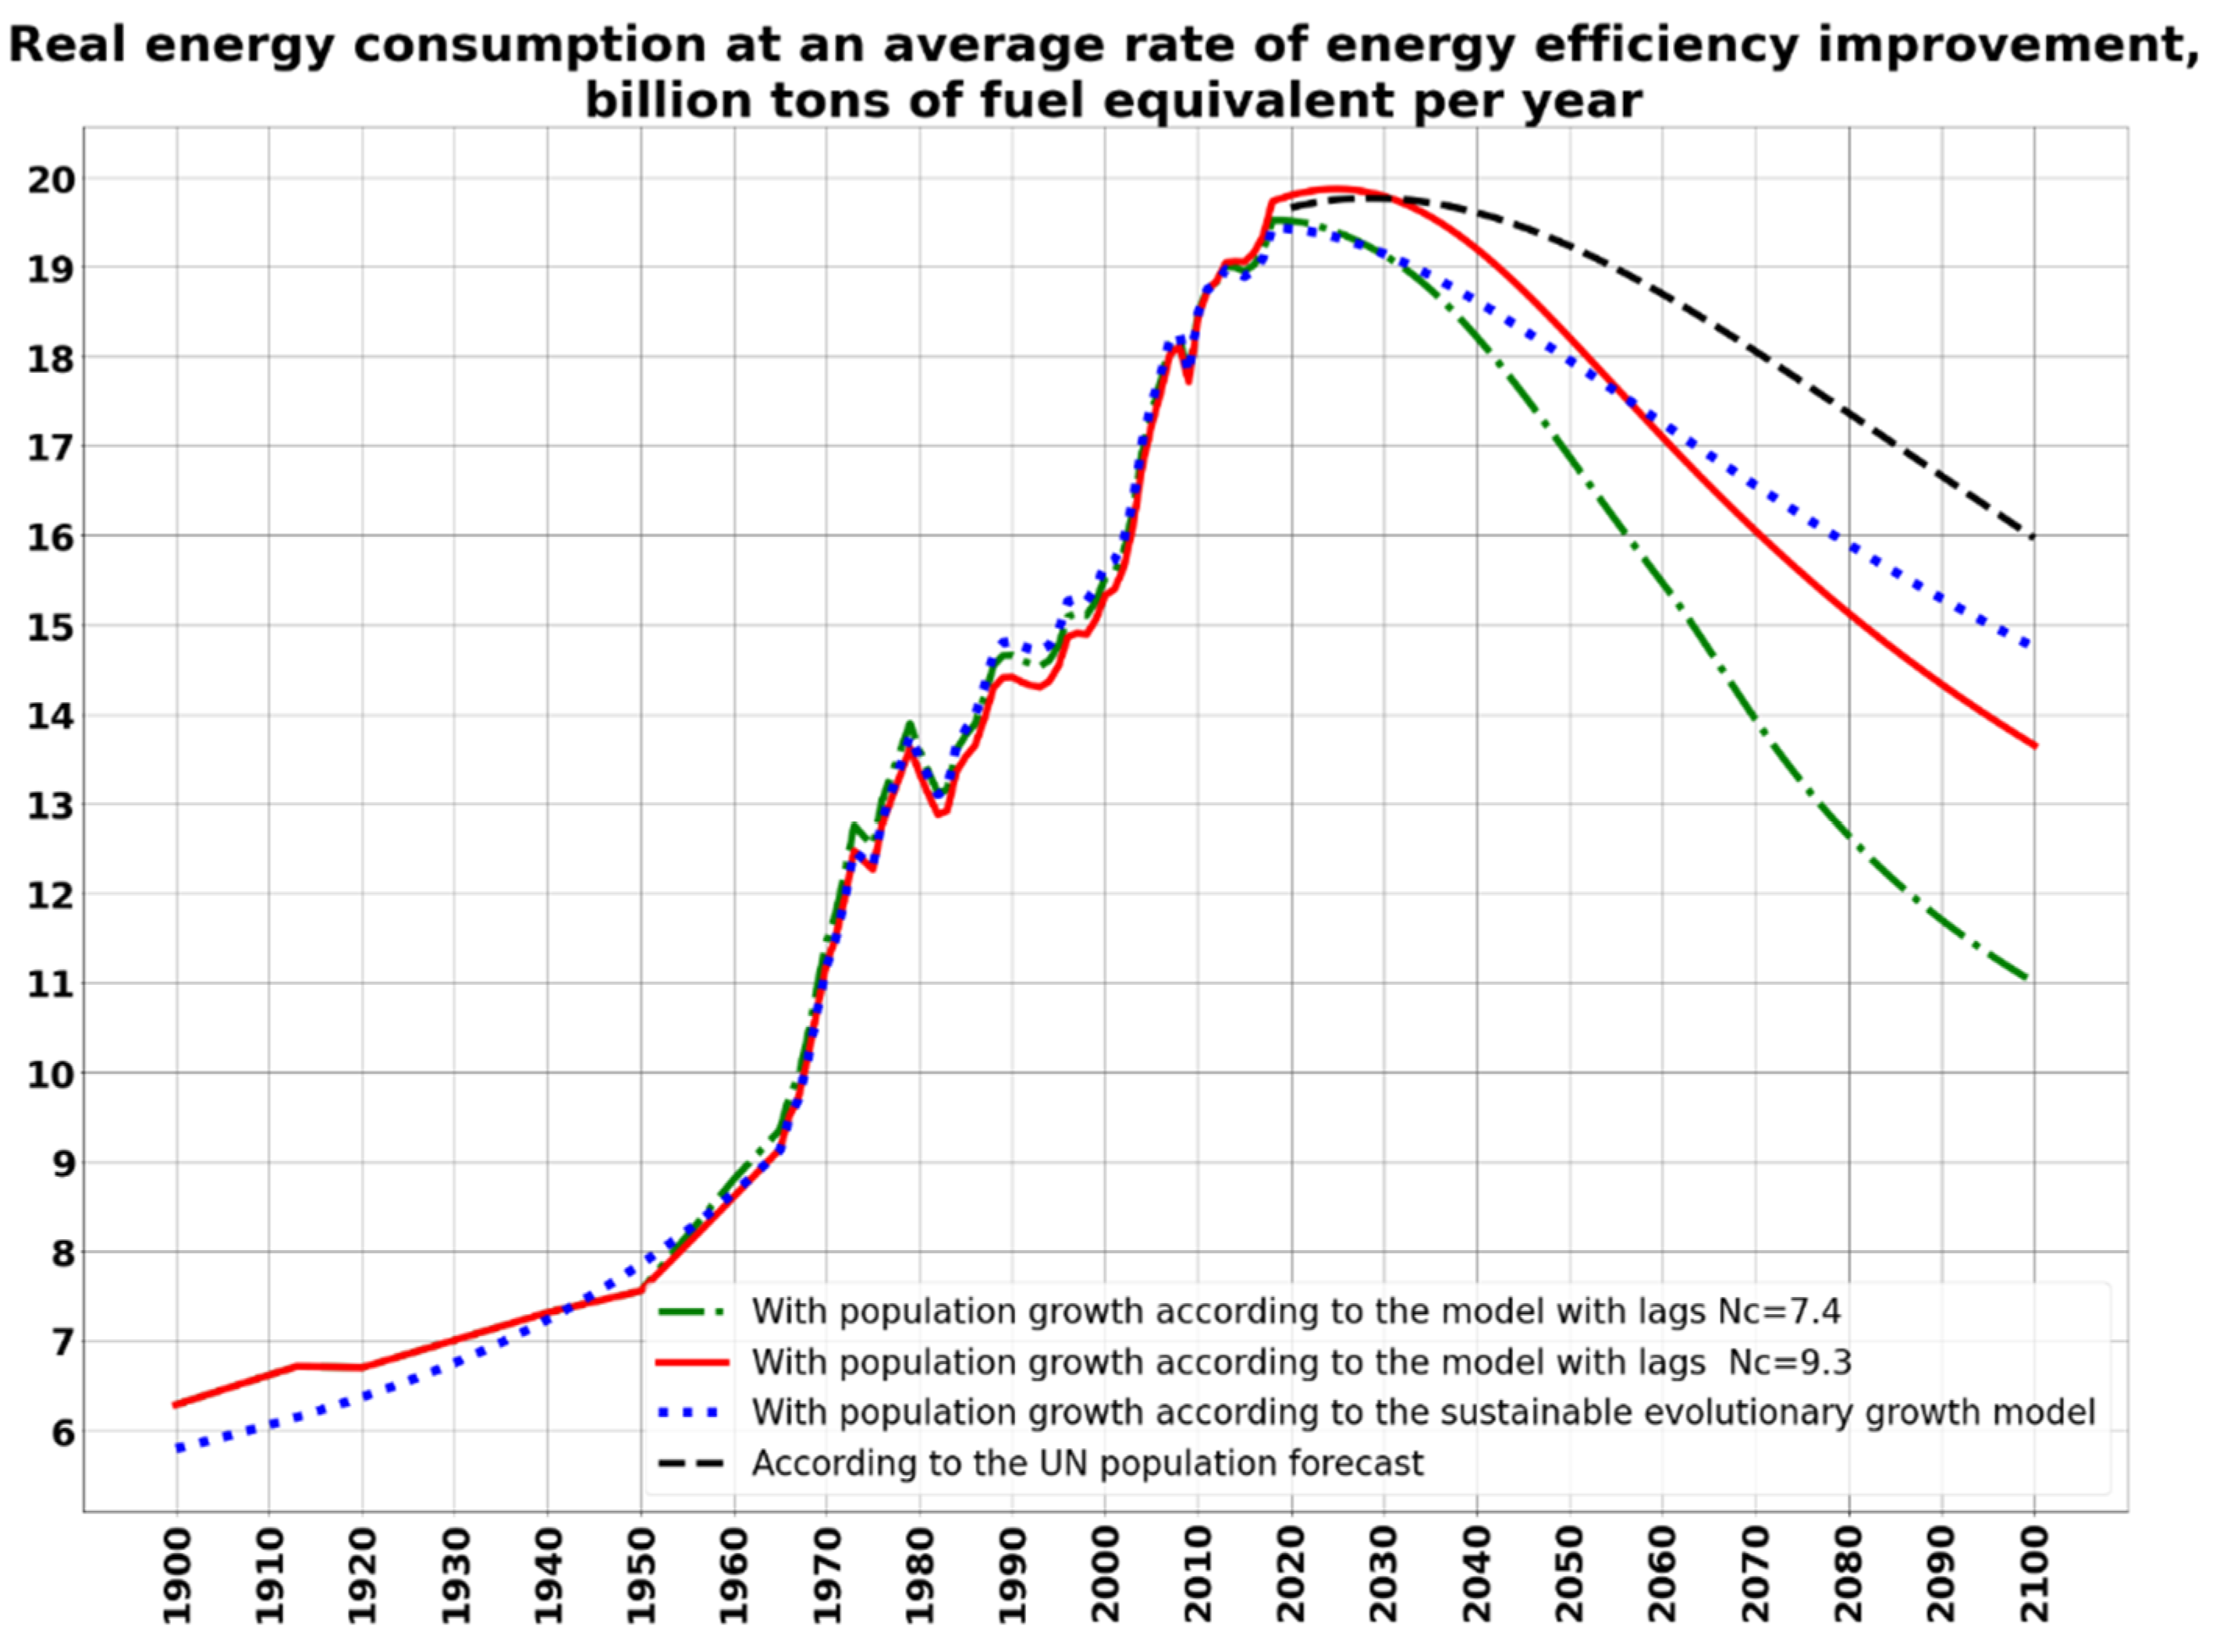
- calculation of the corresponding scenarios for the development of the dynamics of energy demand, based on the new paradigm of energy consumption;
- -
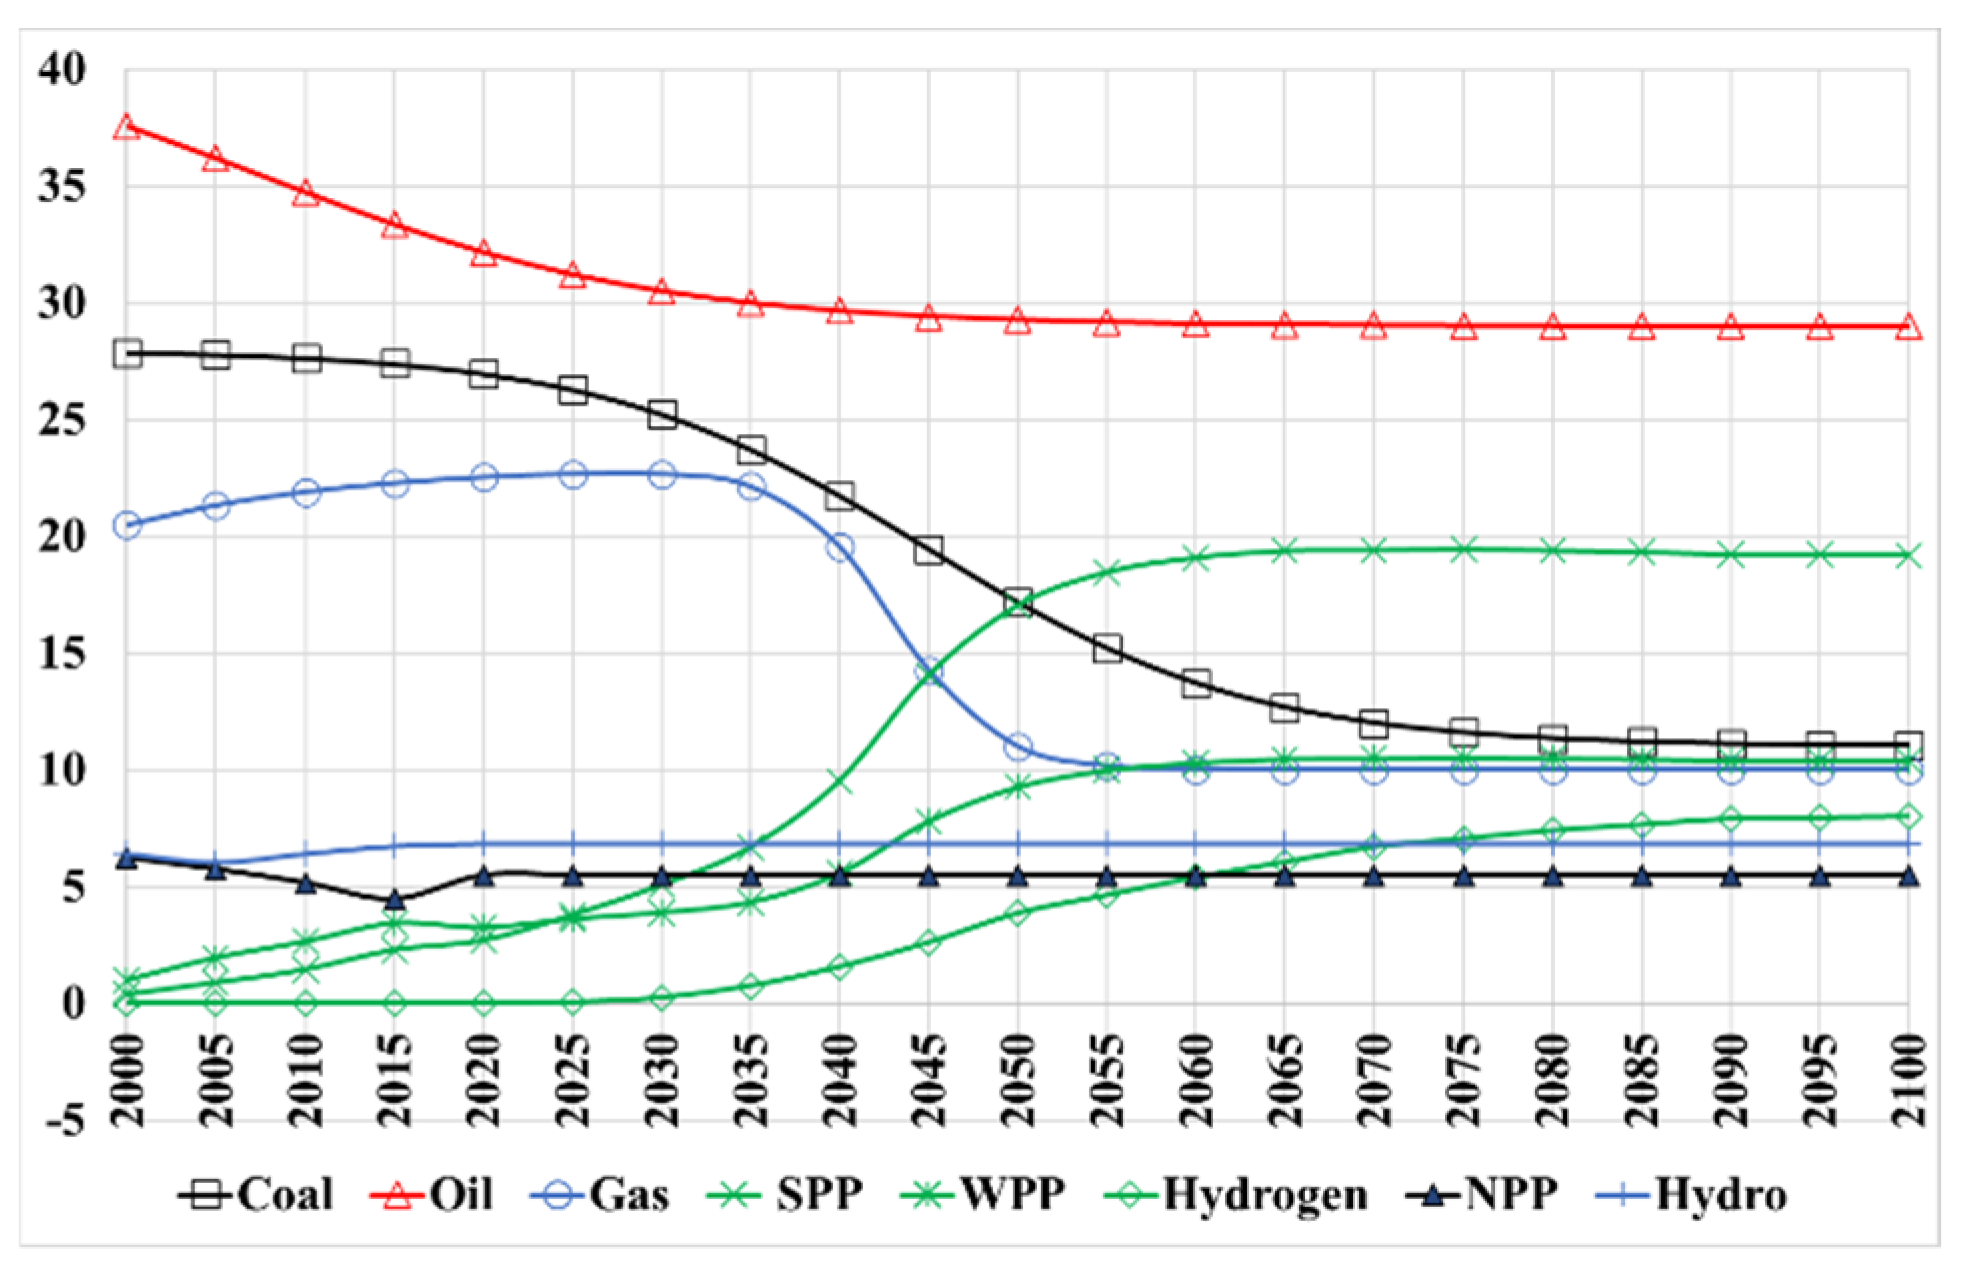
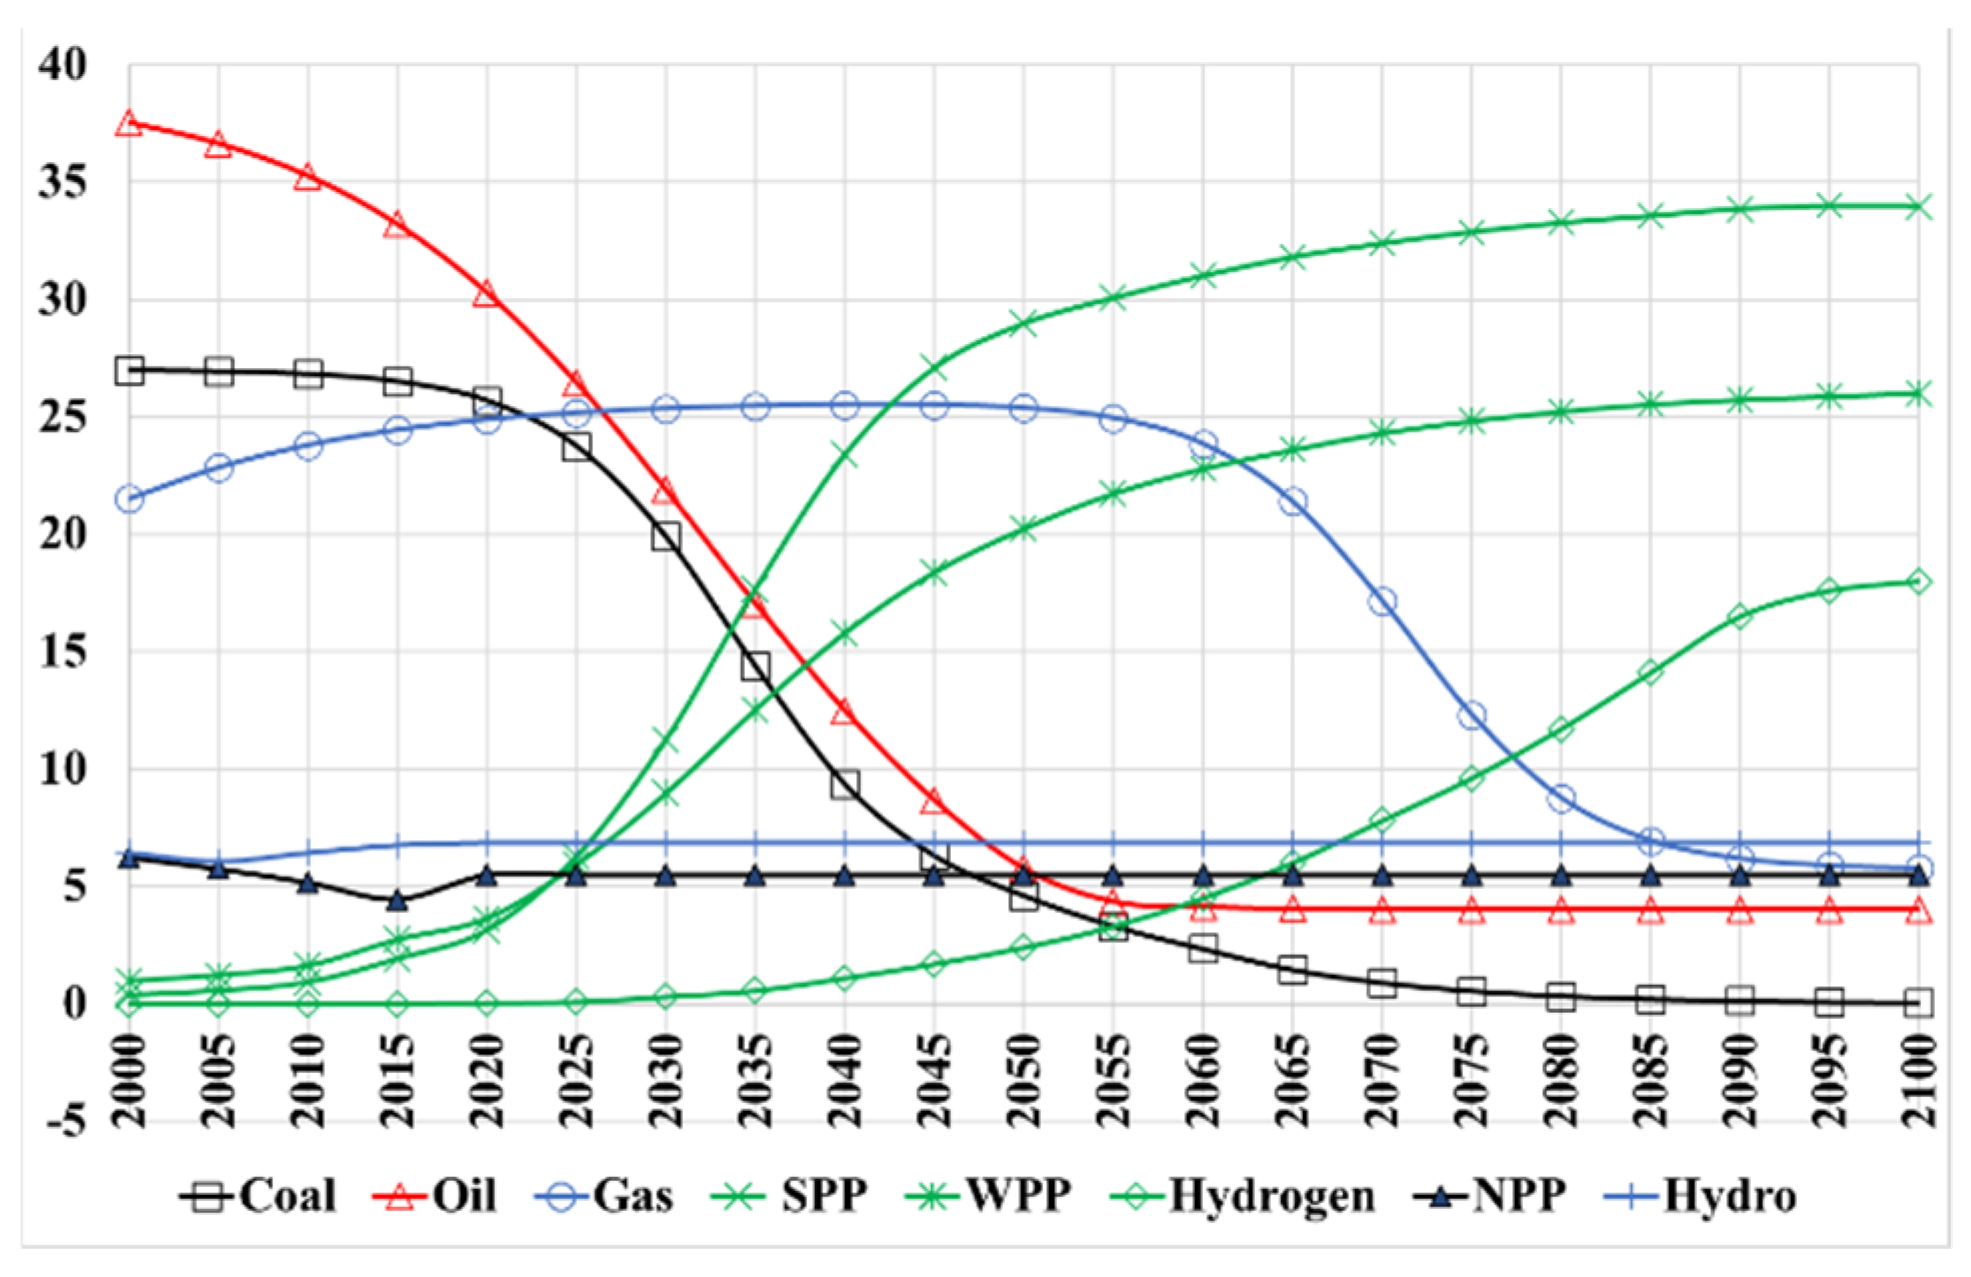
- scenarios writing for the dynamics of the structure of energy consumption by types of energy sources (coal, oil, gas, renewable energy sources, nuclear energy, hydropower);
- -
- scenarios writing for the dynamics of demand for organic fossil fuels (coal, oil, gas);
- -
- scenarios writing for the dynamics of changes in the structure of hydrocarbon energy sources (coal, oil, gas);
- -
- calculation of the dynamics of CO2 emissions into the atmosphere during the combustion of hydrocarbon fuels, taking into account structural changes in the consumption of organic fossil fuels (coal, oil, gas), as well as the use of technologies for carbon capture and storage (CCS);
- -
- calculation of the dynamics of CO2 accumulation in the atmosphere, taking into account non-industrial CO2 emissions (due to deforestation and soil erosion) and absorption of part of the emissions by oceans and terrestrial ecosystems; and
- -
- calculation of changes in the global average temperature of the surface atmosphere.
- renewable energy;
- energy-efficient technologies;
- CCS technology; and
- green hydrogen.
Author Contributions
Funding
Institutional Review Board Statement
Informed Consent Statement
Data Availability Statement
Conflicts of Interest
Abbreviations
| CCS | Carbon Capture and Storage; |
| CO2 | carbon dioxide; |
| EJ | exajoule; |
| GW | gigawatt; |
| LED | a light-emitting diode; |
| Mt | megaton; |
| NPP | Nuclear Power Plants |
| SPP | Solar Power Plants; |
| Toe | tonnes of oil equivalent; |
| UN | United Nations; |
| WPP | Wind Power Plants. |
References
- Tebor, C. The current drought is worldwide. Here’s how different places are fighting it. Los Angeles Times. 16 July 2021. Available online: https://www.latimes.com/world-nation/story/2021-07-16/drought-water-use-strategies (accessed on 23 August 2021).
- Dixon, R. Siberia’s wildfires are bigger than all the world’s other blazes combined. The Washington Post. 11 August 2021. Available online: https://www.washingtonpost.com/world/2021/08/11/siberia-fires-russia-climate/ (accessed on 15 August 2021).
- Pasch, R.J.; Penny, A.B.; Berg, R. Hurricane Maria; National Hurricane Center: Miami, FL, USA, 2019. [Google Scholar]
- Energy Outlook 2020. Available online: https://www.bp.com/content/dam/bp/business-sites/en/global/corporate/pdfs/energy-economics/energy-outlook/bp-energy-outlook-2020.pdf (accessed on 7 August 2021).
- Statistical Review of World Energy; British Petroleum Co.: London, UK, 2021; Available online: https://www.bp.com/en/global/corporate/energy-economics/statistical-review-of-world-energy.html (accessed on 20 July 2021).
- Gielen, D.; Boshell, F.; Saygin, D.; Bazilian, M.D.; Wagner, N.; Gorini, R. The role of renewable energy in the global energy transformation. Energy Strat. Rev. 2019, 24, 38–50. [Google Scholar] [CrossRef]
- Carbon Capture. Available online: https://www.c2es.org/content/carbon-capture/ (accessed on 12 August 2021).
- Bagher, A.M.; Vahid, M.M.; Mohsen, M.; Parvin, D. Hydroelectric energy advantages and disadvantages. Am. J. Energy Sci. 2015, 2, 17–20. [Google Scholar]
- Denisov, S.E.; Denisova, M.V. Analysis of hydropower potential and the prospects of developing hydropower engineering in south ural of the Russian Federation. Procedia Eng. 2017, 206, 881–885. [Google Scholar] [CrossRef]
- Gatte, M.T.; Rasim, A.K. Hydro power. Energy Conserv. 2012, 9, 95–124. [Google Scholar]
- Global CO2 Emissions by Sector; IEA: Paris, France, 2019; Available online: https://www.iea.org/data-and-statistics/charts/global-co2-emissions-by-sector-2019 (accessed on 19 October 2021).
- Global Electric Vehicle Outlook Report; IEA: Paris, France, 2021; Available online: https://www.iea.org/reports/global-ev-outlook-2021 (accessed on 13 August 2021).
- Global Status of CCS Report; Global CCS Institute: Melbourne, Australia, 2020; Available online: https://www.globalccsinstitute.com/resources/global-status-report/ (accessed on 5 October 2021).
- Statistical Review of World Energy 2021, 70th ed.; British Petroleum Co.: London, UK, 2021; Available online: https://www.bp.com/content/dam/bp/business-sites/en/global/corporate/pdfs/energy-economics/statistical-review/bp-stats-review-2021-full-report.pdf (accessed on 11 August 2021).
- Outcomes of the Glasgow Climate Change Conference—Advance Unedited Versions (AUVs) and List of Submissions from the Sessions in Glasgow. Available online: https://unfccc.int/process-and-meetings/conferences/glasgow-climate-change-conference-october-november-2021/outcomes-of-the-glasgow-climate-change-conference (accessed on 5 December 2021).
- Smart Grids; IEA: Paris, France, 2021; Available online: https://www.iea.org/reports/smart-grids (accessed on 5 December 2021).
- Forecast of Energy Development in the World and Russia 2019/Report of ERI RAS; Moscow School of Management Skolkovo: Moscow, Russia, 2019; Available online: https://energy.skolkovo.ru/downloads/documents/SEneC/Research/SKOLKOVO_EneC_Forecast_2019_Rus.pdf (accessed on 12 April 2021). (In Russian)
- Vorrath, S. Top 10 technologies to double the energy efficiency, deliver zero emissions. Renew Economy. 11 March 2015. Available online: https://reneweconomy.com.au/top-10-technologies-to-double-energy-efficiency-deliver-zero-emissions-65210/ (accessed on 2 August 2021).
- Global EV Outlook 2020 Entering the Decade of Electric Drive? IEA: Paris, France, 2021; Available online: https://iea.blob.core.windows.net/assets/af46e012-18c2-44d6-becd-bad21fa844fd/Global_EV_Outlook_2020.pdf (accessed on 2 August 2021).
- Solar Energy. The National Center for Appropriate Technology. Available online: https://www.ncat.org/solar-energy/ (accessed on 4 August 2021).
- Wind Power Facts. Available online: https://cleanpower.org/facts/wind-power/ (accessed on 4 August 2021).
- Gavrilov, S. Cold Roofs Take Care of the Environment. Available online: https://vseokrovle.ru/kholodnye-kryshi-zabotyatsya-ob-okruzhayushhejj-srede.html (accessed on 29 July 2021). (In Russian).
- How an LED Uses So Much Less Energy. Available online: https://www.consumerreports.org/lightbulbs/why-an-led-uses-so-little-energy-/ (accessed on 29 July 2021).
- Windows Lux +, Advantages of PVC Double-Pane Windows. Available online: https://okna-klas.ru/preimushhestva-steklopaketa.php (accessed on 29 July 2021). (In Russian).
- Meier, A. Should the Next Standby Power Target Be 0-Watt? Lawrence Berkeley National Laboratory: Berkeley, CA, USA, 2021; Available online: https://escholarship.org/content/qt566951pn/qt566951pn.pdf (accessed on 21 August 2021).
- How the Thermostat Saves Energy. Available online: https://stem-energy.ru/corp-blog/kak-termoregulyator-pozvolyaet-ekonomit-elektroenergiyu/ (accessed on 29 July 2021). (In Russian).
- GreenMatch, Heat Pumps: 7 Advantages and Disadvantages. Available online: https://www.greenmatch.co.uk/blog/2014/08/heat-pumps-7-advantages-and-disadvantages (accessed on 29 July 2021).
- Pros, Cons and Costs: Energy Star Appliances. Available online: https://www.homeadvisor.com/r/energy-star-appliances/ (accessed on 29 July 2021).
- Sørensen, B. A history of renewable energy technology. Energy Policy 1991, 19, 8–12. [Google Scholar] [CrossRef]
- Guo, Z.; Sun, Y.; Pan, S.Y.; Chiang, P.C. Integration of Green Energy and Advanced Energy-Efficient Technologies for Municipal Wastewater Treatment Plants. Int. J. Environ. Res. Public Health 2019, 16, 1282. [Google Scholar] [CrossRef] [PubMed] [Green Version]
- He, K.; Wang, L. A review of energy use and energy-efficient technologies for the iron and steel industry. Renew. Sustain. Energy Rev. 2017, 70, 1022–1039. [Google Scholar] [CrossRef]
- Ferrante, A.; Mochi, G.; Predari, G.; Badini, L.; Fotopoulou, A.; Gulli, R.; Semprini, G. A European Project for Safer and Energy Efficient Buildings: Pro-GET-onE (Proactive Synergy of inteGrated Efficient Technologies on Buildings’ Envelopes). Sustainability 2018, 10, 812. [Google Scholar] [CrossRef] [Green Version]
- Vahidi, A.; Sciarretta, A. Energy saving potentials of connected and automated vehicles. Transp. Res. Part C Emerg. Technol. 2018, 95, 822–843. [Google Scholar] [CrossRef]
- Leng, Z.; Shuai, J.; Sun, H.; Shi, Z.; Wang, Z. Do China’s wind energy products have potentials for trade with the Belt and Road countries?–A gravity model approach. Energy Policy 2020, 137. [Google Scholar] [CrossRef]
- Xi, L.; McElroy, M.B.; Kiviluoma, K. Global potential for wind-generated electricity. Proc. Natl. Acad. Sci. USA 2009, 106, 10933–10938. [Google Scholar]
- Chaurasiya, P.K.; Warudkar, V.; Ahmed, S. Wind energy development and policy in India: A review. Energy Strat. Rev. 2019, 24, 342–357. [Google Scholar] [CrossRef]
- Shoaib, M.; Siddiqui, I.; Rehman, S.; Khan, S.; Alhems, L.M. Assessment of wind energy potential using wind energy conversion system. J. Clean. Prod. 2019, 216, 346–360. [Google Scholar] [CrossRef]
- Shahsavari, A.; Morteza, A. Potential of solar energy in developing countries for reducing energy-related emissions. Renew. Sustain. Energy Rev. 2018, 90, 275–291. [Google Scholar] [CrossRef]
- Bódis, K.; Kougias, I.; Jäger-Waldau, A.; Taylor, N.; Szabó, S. A high-resolution geospatial assessment of the rooftop solar photovoltaic potential in the European Union. Renew. Sustain. Energy Rev. 2019, 114. [Google Scholar] [CrossRef]
- Ermolenko, B.V.; Ermolenko, G.V.; Fetisova, Y.A.; Proskuryakova, L.N. Wind and solar PV technical potentials: Measurement methodology and assessments for Russia. Energy 2017, 137, 1001–1012. [Google Scholar] [CrossRef]
- Puebla, J.; Kim, J.; Kondou, K.; Otani, Y. Spintronic devices for energy-efficient data storage and energy harvesting. Commun. Mater. 2020, 1. [Google Scholar] [CrossRef]
- Climate Change 2021: The Physical Science Basis. Contribution of Working Group I to the Sixth Assessment Report of the Intergovernmental Panel on Climate Change; IPCC: Geneva, Switzerland, August 2021. [Google Scholar]
- Ploetz, R.; Rusdianasari, R.; Eviliana, E. Renewable Energy: Advantages and Disadvantages. In Proceedings of the Forum in Research, Science and Technology, Palembang, Indonesia, 18–19 October 2016. [Google Scholar]
- Advantages and Disadvantages of Using Renewable Energy. Available online: https://terrapass.com/blog/advantages-and-disadvantages-of-using-renewable-energy (accessed on 14 September 2021).
- Baraniuk, C. How China’s giant solar farms are transforming world energy. BBC. 4 September 2018. Available online: https://www.bbc.com/future/article/20180822-why-china-is-transforming-the-worlds-solar-energy (accessed on 5 December 2021).
- The Future of Hydrogen; International Energy Agency (IEA): Paris, France, 2019; Available online: https://iea.blob.core.windows.net/assets/9e3a3493-b9a6-4b7d-b499-7ca48e357561/The_Future_of_Hydrogen.pdf (accessed on 14 August 2021).
- Hydrogen Boiler. Available online: https://www.worcester-bosch.co.uk/hydrogen (accessed on 14 August 2021).
- Vitovalor PT2. Available online: https://www.viessmann.co.uk/products/combined-heat-and-power/fuel-cell/vitovalor (accessed on 17 August 2021).
- Global Demand for Pure Hydrogen, 1975–2018; IEA: Paris, France, 2019; Available online: https://www.iea.org/data-and-statistics/charts/global-demand-for-pure-hydrogen-1975-2018 (accessed on 16 August 2021).
- Advantages and Disadvantages of Hydrogen Energy, Boiler Guide. Available online: https://www.boilerguide.co.uk/articles/advantages-disadvantages-hydrogen-energy (accessed on 19 August 2021).
- Watson, S. What are the Pros and Cons of Hydrogen Energy? Available online: https://science.howstuffworks.com/environmental/green-science/pros-and-cons-of-hydrogen-energy.htm (accessed on 18 August 2021).
- Hydrogen: A Renewable Energy Perspective; International Renewable Energy Agency: Abu Dhabi, United Arab Emirates, 2019; Available online: https://www.irena.org/-/media/Files/IRENA/Agency/Publication/2019/Sep/IRENA_Hydrogen_2019.pdf (accessed on 19 August 2021).
- Hydrogen Explained. Available online: https://www.eia.gov/energyexplained/hydrogen/ (accessed on 19 August 2021).
- What’s the Difference Between Gray, Blue and Green Hydrogen? Available online: https://www.jdpower.com/cars/shopping-guides/whats-the-difference-between-gray-blue-and-green-hydrogen (accessed on 19 August 2021).
- Casey, J.P. Will China do for Hydrogen What It Did for Solar Power? Future Power Technology, Inc.: London, UK, 2021; Available online: https://www.power-technology.com/features/will-china-do-for-hydrogen-what-it-did-for-solar-power/ (accessed on 10 August 2021).
- Experts Explain Why Green Hydrogen Costs Have Fallen and Will Keep Falling. Available online: https://www.spglobal.com/marketintelligence/en/news-insights/latest-news-headlines/experts-explain-why-green-hydrogen-costs-have-fallen-and-will-keep-falling-63037203 (accessed on 19 August 2021).
- Sonal Patel, Countries Roll Out Green Hydrogen Strategies, Electrolyzer Targets, Power. 2021. Available online: https://www.powermag.com/countries-roll-out-green-hydrogen-strategies-electrolyzer-targets/ (accessed on 19 August 2021).
- Hydrogen Strategy for Canada. Available online: https://www.nrcan.gc.ca/changements-climatiques/hydrogen-strategy/23080 (accessed on 19 August 2021).
- National Green Hydrogen Strategy; Ministry of Energy, Government of Chile: Santiago, Chile, 2020; Available online: https://www.google.ru/url?sa=t&rct=j&q=&esrc=s&source=web&cd=&ved=2ahUKEwjesZO0var0AhWpw4sKHevZAdsQFnoECAMQAQ&url=https%3A%2F%2Fenergia.gob.cl%2Fsites%2Fdefault%2Ffiles%2Fnational_green_hydrogen_strategy_-_chile.pdf&usg=AOvVaw0xaJg_mmBcUslTnnfYnBzY (accessed on 19 August 2021).
- Morton, A. Australia’s first fully renewable ‘hydrogen valley’ slated for NSW coal heartland. The Guardian, 17 May 2021; 1756–3224. [Google Scholar]
- Hydrogen. Available online: https://www.bp.com/en/global/corporate/energy-economics/energy-outlook/demand-by-fuel/hydrogen.html (accessed on 19 August 2021).
- Holbrook, E. EnergyCAP, Study Says Global Green Hydrogen Production to Skyrocket 57% to 2030. Available online: https://www.environmentalleader.com/2021/01/study-says-global-green-hydrogen-production-to-skyrocket-57-to-2030/ (accessed on 5 December 2021).
- Sönnichsen, S. Global Hydrogen Production Outlook by Type 2015–2050. Available online: https://www.statista.com/statistics/859104/hydrogen-production-outlook-worldwide-by-type/ (accessed on 5 December 2021).
- Caspersen, M. The Hydrogen Trajectory. Available online: https://home.kpmg/xx/en/home/insights/2020/11/the-hydrogen-trajectory.html (accessed on 5 December 2021).
- van Renssen, S. How Green Hydrogen Will Grow Up into a Global Market. Available online: https://www.energymonitor.ai/tech/hydrogen/how-green-hydrogen-will-grow-up-into-a-global-market (accessed on 5 December 2021).
- Flowers, S. Future Energy—Green Hydrogen. Could It Be a Pillar of Decarbonization. Available online: https://www.woodmac.com/news/the-edge/future-energy-green-hydrogen/ (accessed on 5 December 2021).
- Buli, N. Green Hydrogen to Account for 20% of European Power Demand by 2050—Statkraft. Available online: https://www.reuters.com/business/energy/green-hydrogen-account-20-european-power-demand-by-2050-statkraft-2021-10-21/ (accessed on 5 December 2021).
- Scott, M. Green Hydrogen, Forbes, The Fuel Of The Future, Set For 50-Fold Expansion. Available online: https://www.forbes.com/sites/mikescott/2020/12/14/green-hydrogen-the-fuel-of-the-future-set-for-50-fold-expansion/?sh=6f5485306df3 (accessed on 5 December 2021).
- Akaev, A.A.; Davydova, O.I. A Mathematical Description of Selected Energy Transition Scenarios in the 21st Century, Intended to Realize the Main Goals of the Paris Climate Agreement. Energies 2021, 14, 2558. [Google Scholar] [CrossRef]
- Akaev, A.A.; Sadovnichii, V.A. Mathematical model of population dynamics with the world population size stabilizing about a stationary level. Dokl. Math. 2010, 82, 978–981. [Google Scholar] [CrossRef]
- Kapitsa, S.P. Essay on the theory of population growth. In Demographic Revolution and Information Society; M Nikitsky Club: Moscow, Russia, 2008; Available online: https://books.google.ru/books?id=419QAQAAIAAJ (accessed on 22 April 2021). (In Russian)
- United Nations World Population Prospects. Available online: https://population.un.org/wpp/ (accessed on 15 April 2021).
- Plakitkin, Y.A. Patterns of Innovative Development of the World Economy: Energy Modes of the 21st Century; SPb RANS: Saint Petersburg, Russia, 2012; p. 120. ISBN 978-5-91918-194-1. (In Russian) [Google Scholar]
- Marchetti, C.; Nakicenovic, N. The Dynamics of Energy Systems and the Logistic Substitution Model, RR-79–13; International Institute for Applied Systems Analysis: Laxenburg, Austria, 1979; Available online: http://pure.iiasa.ac.at/1024 (accessed on 17 April 2021).
- Transforming the Energy System and Holding the Line on Rising Global Temperatures; International Renewable Energy Agency: Abu Dhabi, United Arab Emirates, 2019; Available online: https://www.irena.org/-/media/Files/IRENA/Agency/Publication/2019/Sep/IRENA_Transforming_the_energy_system_2019.pdf (accessed on 21 April 2021).
- World Energy Scenarios, The Future of Nuclear. Available online: https://www.worldenergy.org/publications/entry/world-energy-scenarios-2019-the-future-of-nuclear-diverse-harmonies-in-the-energy-transition (accessed on 21 August 2021).
- Shell New Lens Scenarios A Shift in Perspective for a World in Transition. Available online: https://www.google.ru/url?sa=t&rct=j&q=&esrc=s&source=web&cd=&ved=2ahUKEwih_7mr-4ftAhVMr4sKHT_tBAEQFjABegQIAxAC&url=https%3A%2F%2Fwww.shell.com%2Fcontent%2Fdam%2Froyaldutchshell%2Fdocuments%2Fcorporate%2Fscenarios-newdoc.pdf&usg=AOvVaw2yKUrs_ZGNsFk9icrtWoM1 (accessed on 21 August 2021).
- ExxonMobil The 2019 Outlook for Energy. Available online: https://corporate.exxonmobil.com/-/media/Global/Files/outlook-for-energy/2019-Outlook-for-Energy_v4.pdf (accessed on 21 August 2021).
- Akaev, A.A. The Stabilization of Earth’s Climate in the 21st Century by the Stabilization of Per Capita Consumption. In The Oxford Handbook of the Macroeconomics of Global Warming; Semmler, B.W., Ed.; Oxford University Press: New York, NY, USA, 2014; pp. 499–554. [Google Scholar] [CrossRef]
- International Energy Agency. Energy Technology Perspectives 2010: Scenarios and Strategies to 2050; OECD Publishing: Paris, France, 2009. [Google Scholar] [CrossRef]
- Kuykendall, K. Carbon Capture and Storage Projects on the Rise Gobally—Global CCS Institute. Available online: https://www.spglobal.com/marketintelligence/en/news-insights/latest-news-headlines/carbon-capture-and-storage-projects-on-the-rise-globally-8211-global-ccs-institute-61531550 (accessed on 17 September 2021).
- Disadvantages of Carbon Capture. Available online: https://theclimateconnection.org/disadvantages-of-carbon-capture/ (accessed on 17 September 2021).
- Dooley, J.J.; Dahowski, R.T.; Davidson, C.L.; Wise, M.A.; Gupta, N.; Kim, S.H.; Malone, E.L. Carbon Dioxide Capture and Geologic Storage: A Core Element of a Global Energy Technology Strategy to Address Climate Change; The Global Energy Technology Strategy Program: College Park, MD, USA, 2006. [Google Scholar]
- Tarko, A.M. Anthropogenic Changes of the Global Biosphere Processes. Mathematical Modelling; Fizmatlit: Moscow, Russia; p. 232. Available online: https://www.researchgate.net/publication/312093195_Tarko_AM_Antropogennye_izmenenia_globalnyh_biosfernyh_processov_Matematiceskoe_modelirovanie_-_M_Fizmatlit_2005_-_232_s_Tarko_AM_Anthropogenic_Changes_of_the_Global_Biosphere_Processes_Mathematical_Mo (accessed on 30 March 2021). (In Russian)


Publisher’s Note: MDPI stays neutral with regard to jurisdictional claims in published maps and institutional affiliations. |
© 2021 by the authors. Licensee MDPI, Basel, Switzerland. This article is an open access article distributed under the terms and conditions of the Creative Commons Attribution (CC BY) license (https://creativecommons.org/licenses/by/4.0/).
Share and Cite
Akaev, A.A.; Davydova, O.I. Mathematical Description of Energy Transition Scenarios Based on the Latest Technologies and Trends. Energies 2021, 14, 8360. https://doi.org/10.3390/en14248360
Akaev AA, Davydova OI. Mathematical Description of Energy Transition Scenarios Based on the Latest Technologies and Trends. Energies. 2021; 14(24):8360. https://doi.org/10.3390/en14248360
Chicago/Turabian StyleAkaev, Askar A., and Olga I. Davydova. 2021. "Mathematical Description of Energy Transition Scenarios Based on the Latest Technologies and Trends" Energies 14, no. 24: 8360. https://doi.org/10.3390/en14248360
APA StyleAkaev, A. A., & Davydova, O. I. (2021). Mathematical Description of Energy Transition Scenarios Based on the Latest Technologies and Trends. Energies, 14(24), 8360. https://doi.org/10.3390/en14248360