Article

The Drive towards Optimization of Road Lighting Energy Consumption Based on Mesopic Vision—A Suburban Street Case Study

1
Faculty of Electrical Engineering, Bialystok University of Technology, Wiejska 45d, 15-351 Bialystok, Poland
2
Electrical Engineering Faculty, Electrical Power Engineering Institute, Warsaw University of Technology, Koszykowa 75, 00-662 Warsaw, Poland
3
Institute of Future Lighting, Academy for Engineering & Technology, Fudan University, Shanghai 200433, China
4
Faculty of Civil Engineering and Building Services, Technical University Gheorghe Asachi, Bd. Dimitrie Mangeron 1, 700050 Iasi, Romania
*
Author to whom correspondence should be addressed.
Energies 2021, 14(4), 1175; https://doi.org/10.3390/en14041175
Submission received: 20 January 2021 / Revised: 9 February 2021 / Accepted: 18 February 2021 / Published: 22 February 2021
(This article belongs to the Special Issue Efficient Utilization of Energy toward Realization of Smart City)

Abstract

:
This paper presents the research of optimization of road lighting energy consumption by utilizing the fact of human twilight and night vision (mesopic vision) dependency on luminance level and lamp’s light spectral composition. The research was conducted for a suburban street illuminated by smart LED road luminaires with a luminous flux control system with which different luminance levels can be achieved on the road. This road is an access road leading to a town located on the outskirts of Warsaw which is the capital of Poland and a large metropolitan area. Therefore, the traffic here is quite heavy on this road in the morning and in the evening and it is very light at other times of the day. In accordance with EN 13201 standard, lighting control can be applied to illuminate this road. This paper compares energy consumption for different lighting scenarios of the road in question. In the first scenario, the road luminance is compliant with M4, M5, and M6 lighting class requirements depending on the time of the day. In the second scenario, for each M lighting class, the values of luminance levels provided by EN 13201 standard have been reduced to the values resulting from their conversion to the corresponding mesopic luminance values. The conducted research has shown that a 15% saving per year in electricity consumption on the road is possible with such a conversion. Therefore, energy efficiency of a lighting installation can be improved by matching the lighting levels provided by the standard to the mesopic vision.

1. Introduction

Everyone likes to feel safe. For that reason, especially in urban environments, the lack of natural light after dusk is always a problem that needs solving, e.g., through properly designed road lighting that guarantees adequate brightness at night [1,2,3]. Such an issue has been faced by communities since the establishment of first human settlements when their inhabitants first started to consider how to ensure overall safety and proper functionality of public spaces.
For many years, by using artificial light sources, people have been trying to light up the darkness to obtain appropriate lighting conditions. For this reason, the history of street lighting goes back a long way [4].
Today, streetlights are based on LED lamps and high-intensity discharge (HID) lamps like metal-halogen (MH) and high-pressure sodium lamps (HPS). Thanks to the rapid rise of LEDs [5], HID streetlights may soon be just as extinct as the oil lamps the Romans used. Nowadays, LEDs have been widely used as light sources in general indoor [6,7] and outdoor lighting [8], automotive lighting [9], TV backlighting [10], medical and communication equipment [11], and others [12]. This is due to the many advantages of LEDs [13] such as longer lifetime (50,000–100,000 h), higher reliability, environmental friendliness, compactness in size, and quicker switching time. Low energy consumption, which ultimately helps in the energy saving programs, is one of the greatest benefits of LEDs [14,15].
The replacement of traditional lighting sources with LEDs is to reduce the electrical energy usage for lighting applications by 15% in 2020, by 40% in 2030, and up to 75% in 2035 in the U.S according to the latest forecasts [16]. The European Union has issued many directives and regulations banning the use of energy-intensive lighting equipment, including that used in road lighting. In accordance with the second stage of the implementation of the EU regulations 245/2009 (ErP) [17], 357/2010 (ErP) [18] and the terms of the EU Directive 2011/65 (RoHS2) [19], since April 13th 2015, further marketing of any and all mercury lamps (HQL), mercury-incandescent lamps (HWL), and many sodium lamps (NAV Plug-in) has been banned in the European Union. The third stage of eco-design requirements for lighting products intended for the institutional sector, including street lighting, set out in Commission Regulation (EC) No 245/2009 [17] and amended by Commission Regulation (EC) No 347/2010, ended on April 13th 2017. As a result, it will be possible to introduce high-pressure metal halide lamps, only with strictly defined, high values of luminous efficiency, lumen maintenance factor, and durability factor, into the EU market. These limitations do not apply to the use of LED based lamps on roadways and in the outdoor areas.
Over the centuries, we have witnessed the changes in road lighting techniques not only in respect to the light sources used in lamps, but also to the role of road lighting itself. Initially the focal point was the road illumination [20,21,22,23] due to its direct impact on traffic safety. However, over time, the safety of pedestrians and cyclists was also considered [24,25,26,27,28,29]. As a result, pavements, bicycle paths, and the immediate surroundings of the road/roadside started to be illuminated [30], bearing in mind optimization of energy efficiency in the given lighting installation [31]. Currently, in Europe, road lighting is designed following the requirements of EN 13201-Road Lighting standard [32] published in 2003, i.e., when HID lamps were still used in indoor lighting. Although EN 13201 does not explicitly state that the recommended luminance levels on roadways have been set for HPS lighting, it is clear (due to the lack of other technologies used) that these requirements were set for this type of lamps. It is so because in the first decade of the 21st century, HPS light sources (with typical CCT 2060 K) dominated road lighting installations [33]. An extended and supplemented version of EN 13201 standard was published in 2015 [34], i.e., at the time when LEDs entered and revolutionized the lighting market. The EN 13201:2015 standard [34] indicates the possibility of selecting the lighting class (from M1 to M6) depending on the conditions on the road and its surroundings such as: Traffic volume, traffic composition, separation of carriageway, parked vehicles, ambient luminosity, and a navigational task [35,36]. Depending on the lighting class (Table 1) the average luminance of the road surfaces a minimum of 0.30 cd/m2 and a maximum of 2.0 cd/m2. It is well known that the luminance levels recommended in this standard are based on scientific research carried out several decades ago for roadways illuminated with HID lamps [37,38,39,40]. This standard, however, contains a significant innovation compared to the previous normative recommendations—among other things, it introduces the possibility of changing/reducing the lighting class (luminance of the roadway) depending on daily traffic volume changes on the given road. With a significant periodic reduction in vehicle traffic, the luminance level of a given roadway can be temporarily reduced by up to 50% according to the information contained in this standard. Thanks to the application of lighting control (luminaire flux control of a given installation) [41,42] it is possible, for example, to change the class from M4 (0.75 cd/m2) to M5 (0.50 cd/m2) or even to M6, i.e., to the luminance level of 0.30 cd/m2.
The luminous flux value of the luminaire can be easily adjusted to the required luminance levels of the road by using LED luminaires (their CCT is typically between 4000 K and 6500 K) [43]. Such possibilities were generally not available (or limited) in the case of HPS lamps where oversizing of the lighting installation luminous flux was frequently encountered due to the lack of possibility of smooth adjustment of the luminous flux level in these lamps [44,45]. The previous research and practical applications have shown that the standard-compliant possibilities of reducing lighting levels (in adjustment to current road conditions) have led to significant electricity savings [46,47] and light pollution reduction in the night environment [48]. As LEDs allow a relatively easy and immediate change of the emitted luminous flux [49] and light color, new technical possibilities and methods for reducing of light pollution [50,51,52,53] have opened up for lighting designers [54].
Manufacturers of road lighting luminaires offer a wide range of LED lighting luminaire optical system designs [55]. Thanks to the right shape of the optical system [56,57,58] taking into account luminance distribution on the LED surface [59,60,61], the use of LED luminaires ensures high energy efficiency of the road lighting installation [31,62]. The energy efficiency value of LED lighting installations additionally increases when they are operated at low temperatures i.e., in winter [63,64,65].
However, the use of such luminaires is not without disadvantages. Compared to classic lighting installations, using such luminaries requires the designer to pay more attention to reducing the undesirable glare effect [66,67,68,69,70].
As far as the recommended road luminance by the standard, the observer (a driver, a pedestrian, etc.) has the eyesight adapted to the twilight (mesopic) vision [71]. The luminous efficiency of the human eye (Figure 1) is then different from the night vision (scotopic V’(λ)) and the day vision (photopic V(λ)). As presented in CIE 191:2010 [72], in the mesopic range, the spectral sensitivity of the human eye Vmes(λ) depends on the photopic luminance level (Lp) and the spectral distribution of radiant power (SPD) of the given lighting. This CIE document also details the method for determining the eye sensitivity in this luminance range. The mesopic sensitivity is calculated as a linear combination (Equation (1)) of the photopic V(λ) and scotopic V’(λ) human eye sensitivities. In Equation (1), the m parameter is the adaptation coefficient and M(m) is a normalization factor to ensure that the maximum value of Vmes(λ) is unity.
V m e s ( λ ) = 1 M ( m ) [ m V ( λ ) + ( 1 m ) V ( λ ) ]
The value of m for an adaptation field characterized by given photopic (Le) can be iteratively calculated as defined in the CIE document and other papers [73,74,75]. As perceived by a person whose eye is adjusted to mesopic conditions, luminance value Lmes has a different value than the luminance (Le) defined (measured) for photopic viewing conditions [76]. The mesopic luminance (cd/m2) of a light beam with spectral radiance Le(λ), in W/m2/sr/nm can be calculated as:
L m e s = K m e s 0 V m e s ( λ ) L e ( λ ) d λ
where Kmes = 683⁄(Vmes0 = 555 nm)), in lm/W.
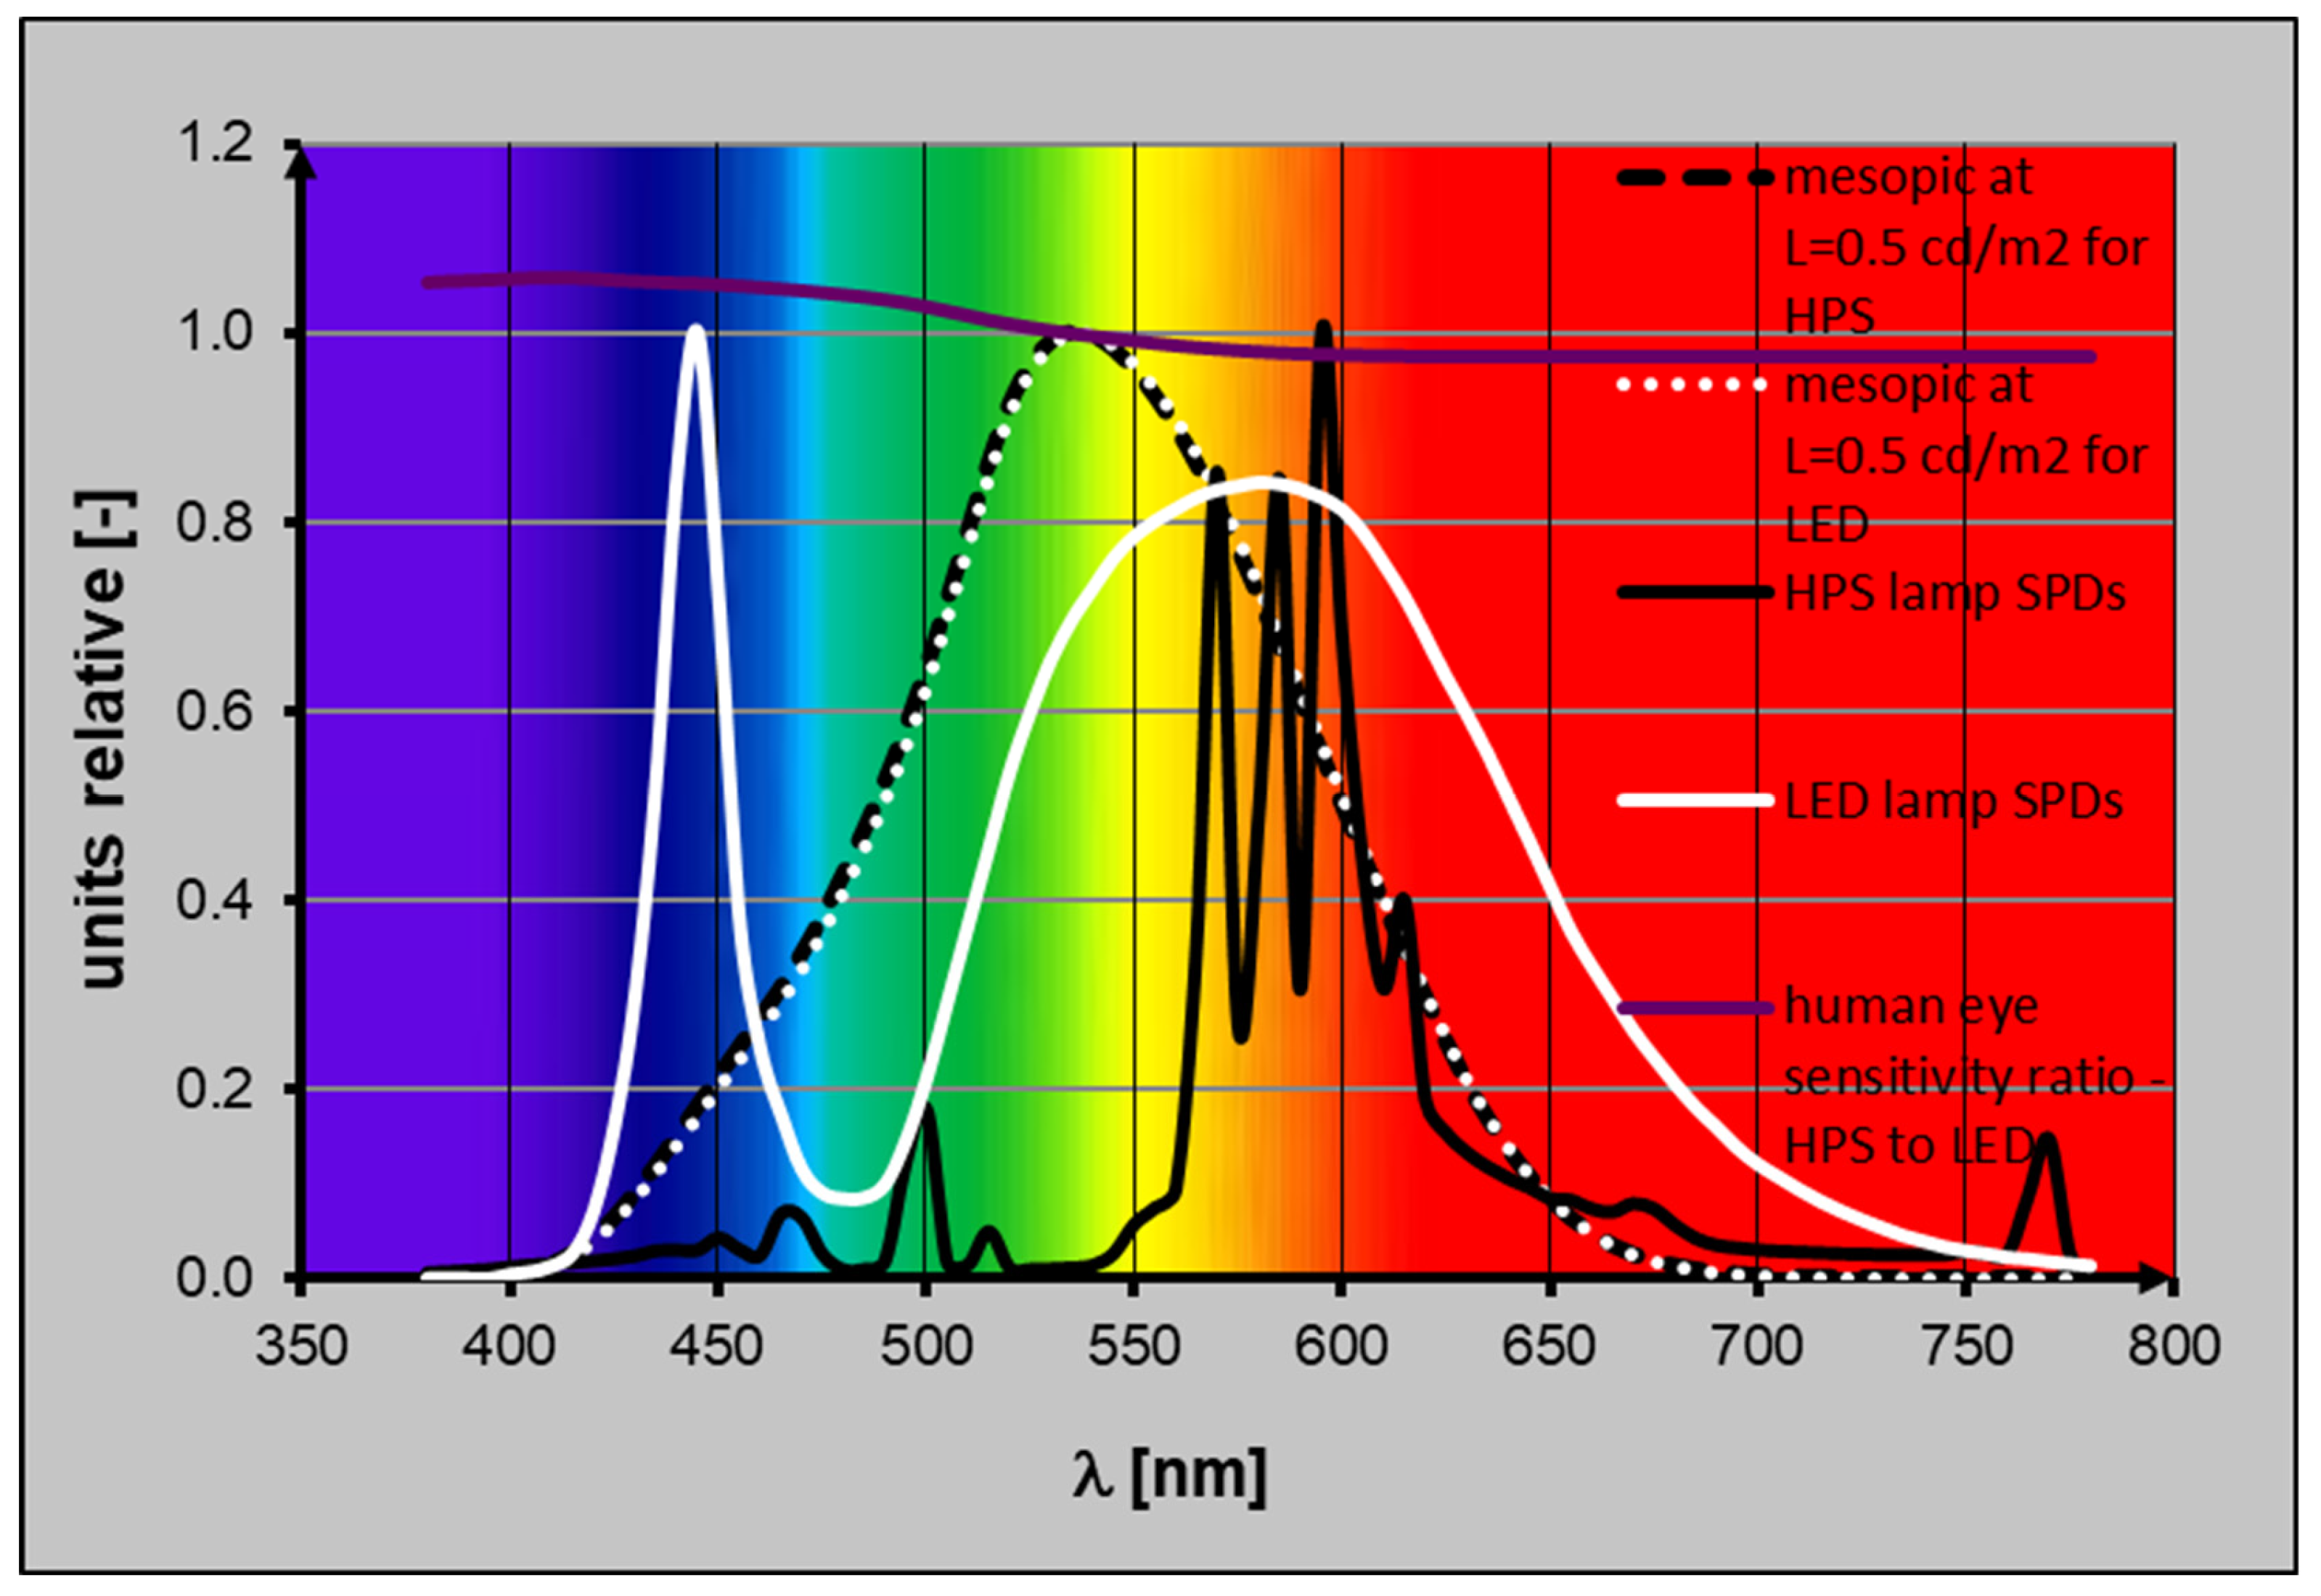
Determined by using Equation (1) and the computational methodology provided by CIE 191 [72] document, the distribution curves of spectral sensitivity of the human eye adapted to the brightness levels of typical M4 class road lighting (i.e., luminance level Le = 0.5 cd/m2) obtained with HPS lamps is shown in Figure 1. In Figure 1, the white line indicates the sensitivity of the eye in the photopic range, the black one represents the scotopic sensitivity, and the dashed grey line represents the sensitivity in the mesopic range (at luminance level Le = 0.5 cd/m2 obtained with HPS lamp). The spectral distribution of radiant power (SPDs) of the HPS lamp is shown as a purple line in Figure 1. For the same luminance level (e.g., Le = 0.5 cd/m2) obtained using light sources of different SPDs (HPS or LED), the spectral sensitivity of the human eye differs Figure 2 illustrates the spectral distribution of the HPS (black continuous line) and LED (white continuous line) lamps and the spectral efficiency of the human eye at luminance Le = 0.5 cd/m2 obtained with typical HPS lamps (dashed black curve) and for typical LED lighting (white dotted line) determined by using Equation (1) and the computational methodology provided by CIE 191 document [72]. The purple line shows the quotient of the spectral sensitivity of the human eye under HPS lighting to the spectral sensitivity of the eye under LED lighting, where in both cases, the Le road luminance was 0.50 cd/m2.
It is important to remember that in road lighting standards defining the lighting requirements, are formulated for luminance values defined in a photopic manner [77]. Therefore, the luminance values of a given lighting perceived by a person in mesopic conditions will differ from those given normatively i.e., photopically. Bearing this in mind, it should be considered whether the criteria provided in the standards for luminance values (specified for photopic vision under HPS illumination) should be replaced by corresponding mesopic luminance values Lmes [78,79]. Luminance created by HPS lighting in mesopic conditions is always lower than that provided for photopic conditions [76,80,81]. The situation is different for LED lighting where luminance perceived in mesopic conditions has always a higher value than the one determined photopically [76,80]. This fact makes one consider if it is necessary to strictly adhere to the design criteria defined for photopic conditions or whether mesopic luminance values as design criteria e.g., in case of luminaires with LED light sources should be introduced. In the scientific literature, the qualitative and quantitative parameters characterizing the exchange of road lighting from HPS to LED have been analyzed many times [82]. The scientific literature also highlights the fact that taking human visual performance factors into account in the lighting design leads to a significant improvement in energy consumption and reduction of operating costs of the lighting system [83,84]. Experimental verification of this issue (for an actual lighting installation) was undertaken by the authors of the article titled “Drivers’ impressions under high-pressure sodium and LED street lighting” [85]. They conducted the experiment in which the respondents compared lighting quality of two lighting installations—one with HSP lamps and the other with LED lamps. These comparisons were made for two cases of illumination of each of these installations. In the first case, the photopic luminance values (Lp) of the road for both LED and HPS installations were equal. In the second case, the photopic luminance values of each installation (HPS and LED) were different. Their values were chosen so that the mesopic luminance level (Lmes) for LED lighting was the same as that obtained for HPS lighting. It was obtained by calculating its Lmes mesopic luminance value for the photopic luminance Le of the road illuminated with HPS lamps using the method described in IES TM-12-12 [80] and in IES TM-24-13 [86]. Then, for LED lighting, the photopic luminance level was numerically determined to provide the same mesopic luminance value as that obtained with HPS lamps, i.e., for it to equal Lmes. This means that with LED lighting, the luminous flux value was reduced compared to the nominal one. In the mode in which both lighting installations were characterized by the same photopic luminance value, the LED installation (CCT = 4000 K) was found by most respondents to be a better lighting solution. However, in the case of alignment of Lmes mesopic luminance levels (i.e., in the case of LED lighting lower than photopic luminance), some of the respondents whose opinions were presented in this article considered the HSP lamps to be a better-quality solution.
The authors of this paper did research in order to investigate the possibility of reducing the amount of electricity consumed by a street LED lighting installation, and thus of improving its energy efficiency by utilizing at design stage the mesopic vision properties. The objective of the experiment was to reduce the luminous flux of LED lighting installation so that for a given class of lighting the road luminance corresponded to the value of mesopic luminance obtained under HPS lighting (i.e., lower than the photopic luminance). Such an experiment is technically possible as LED luminaires can precisely control the emitted luminous flux [87].

2. Materials and Methods

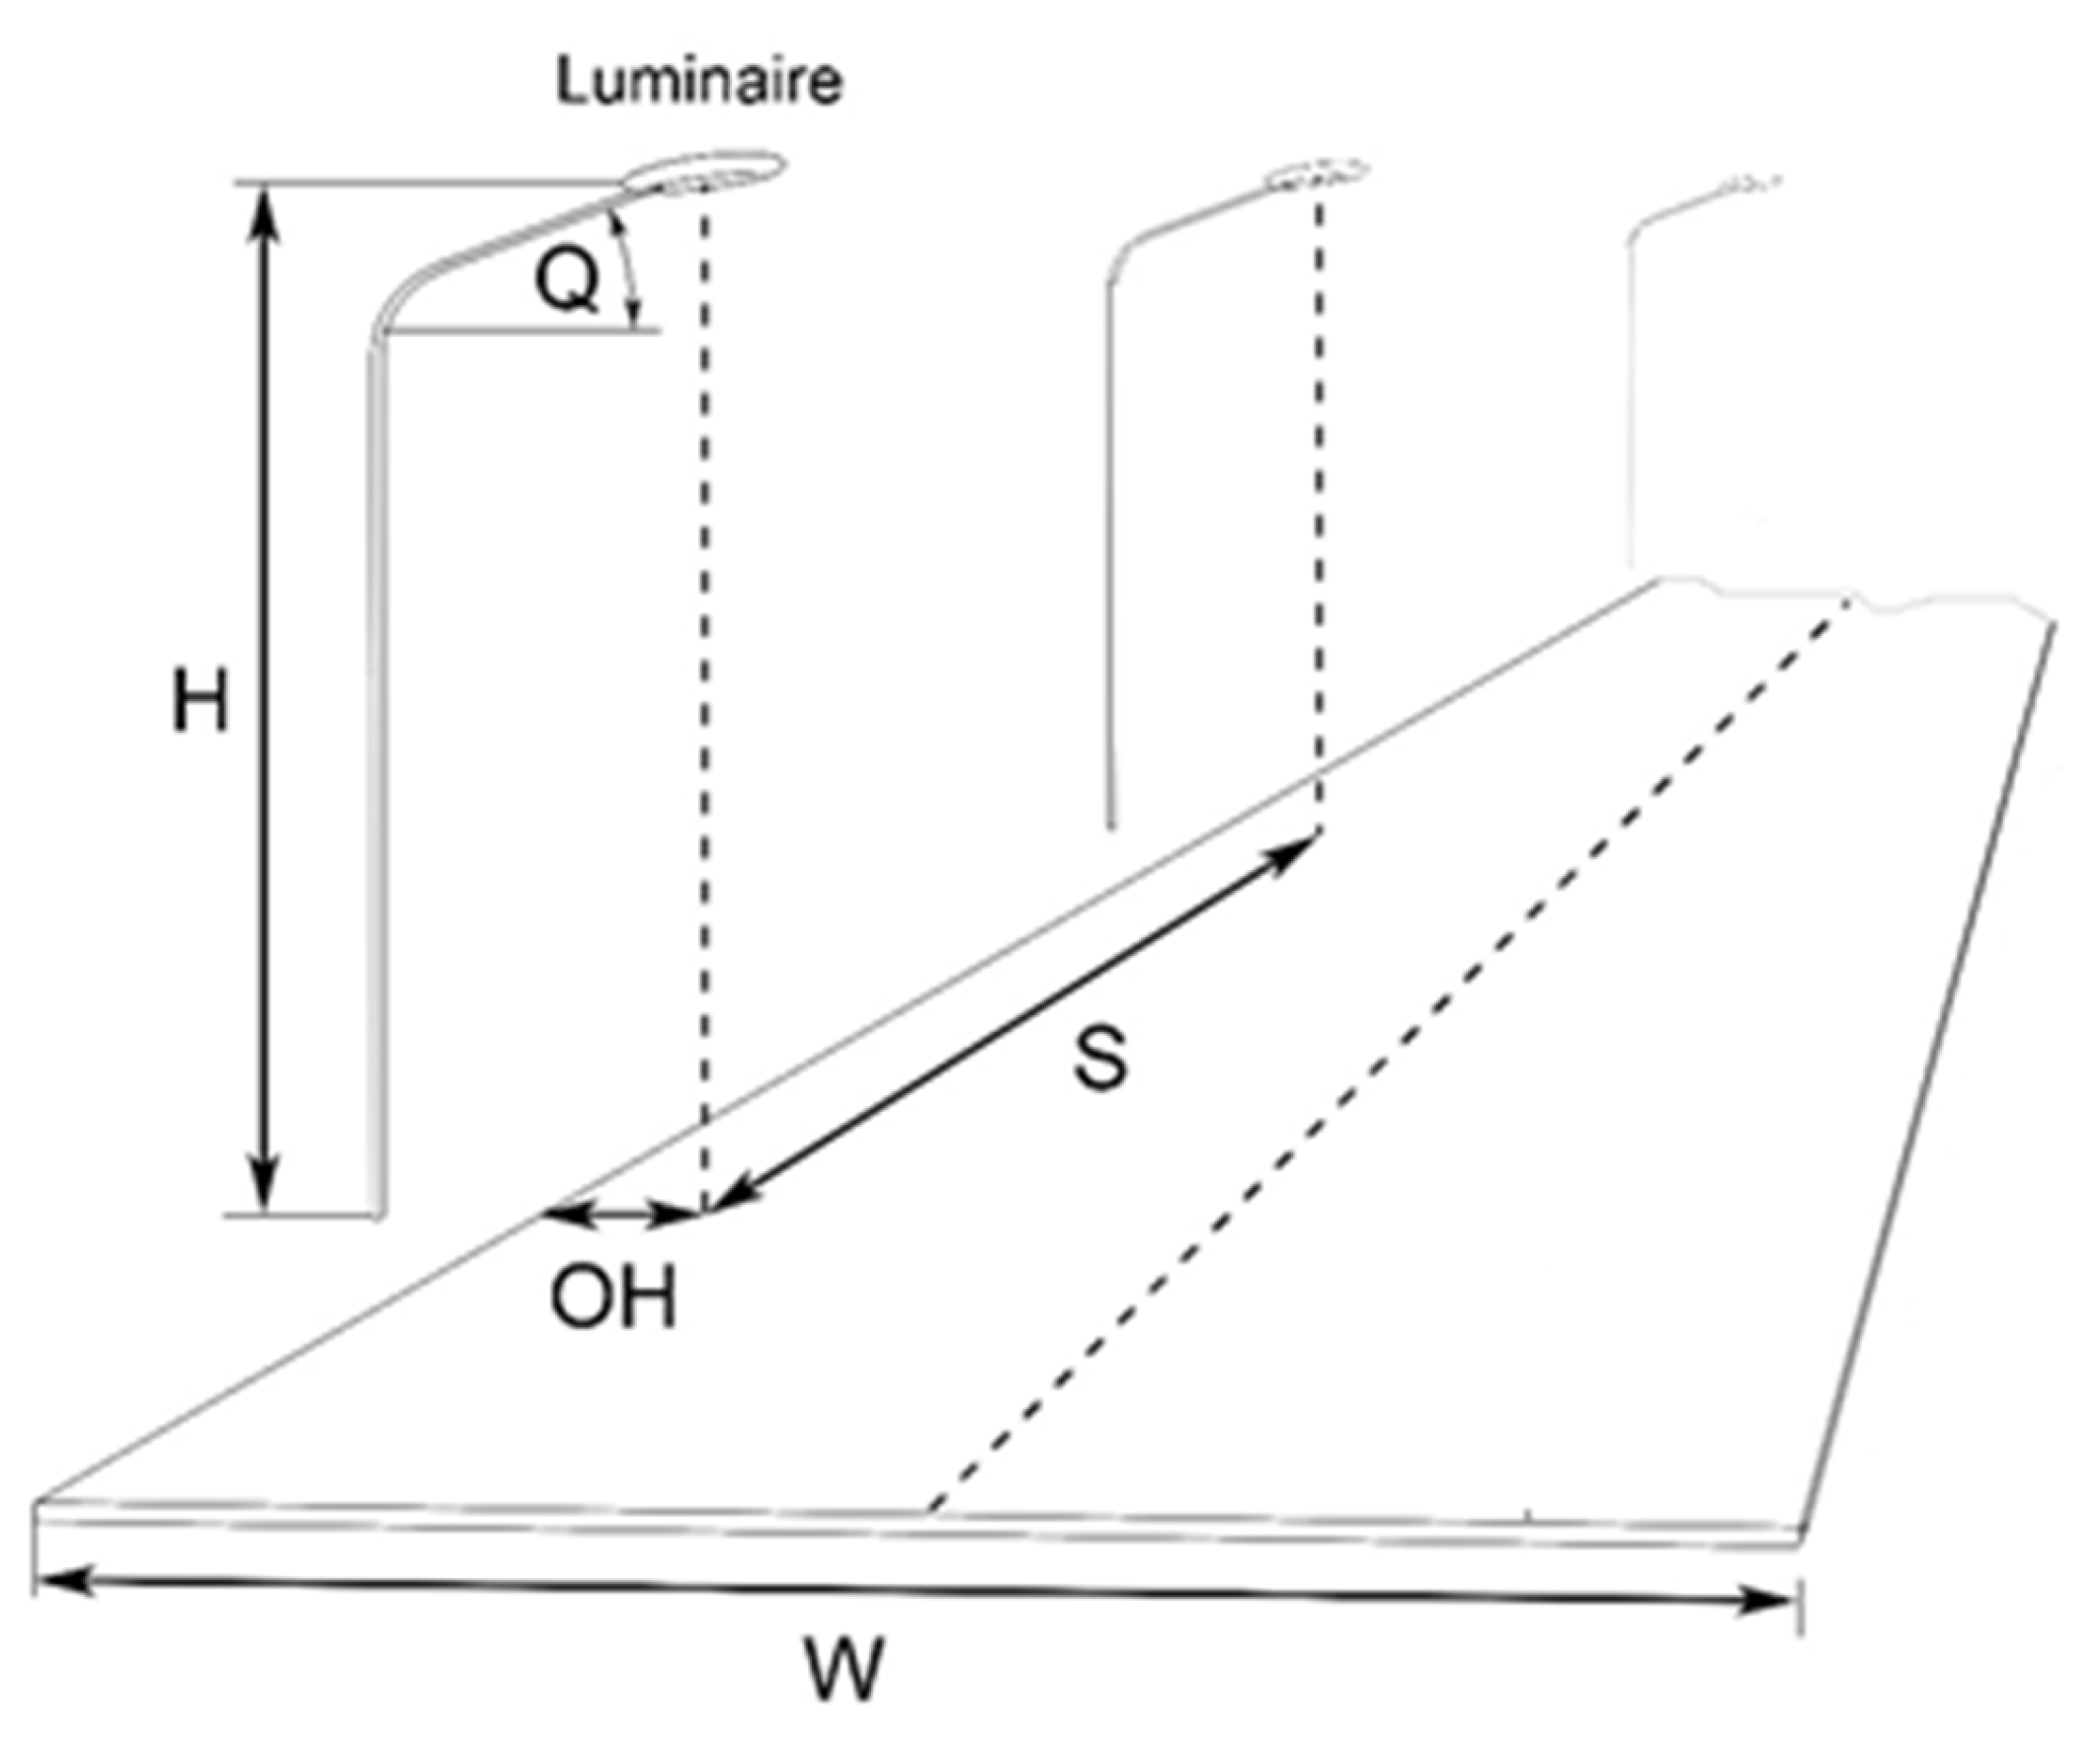
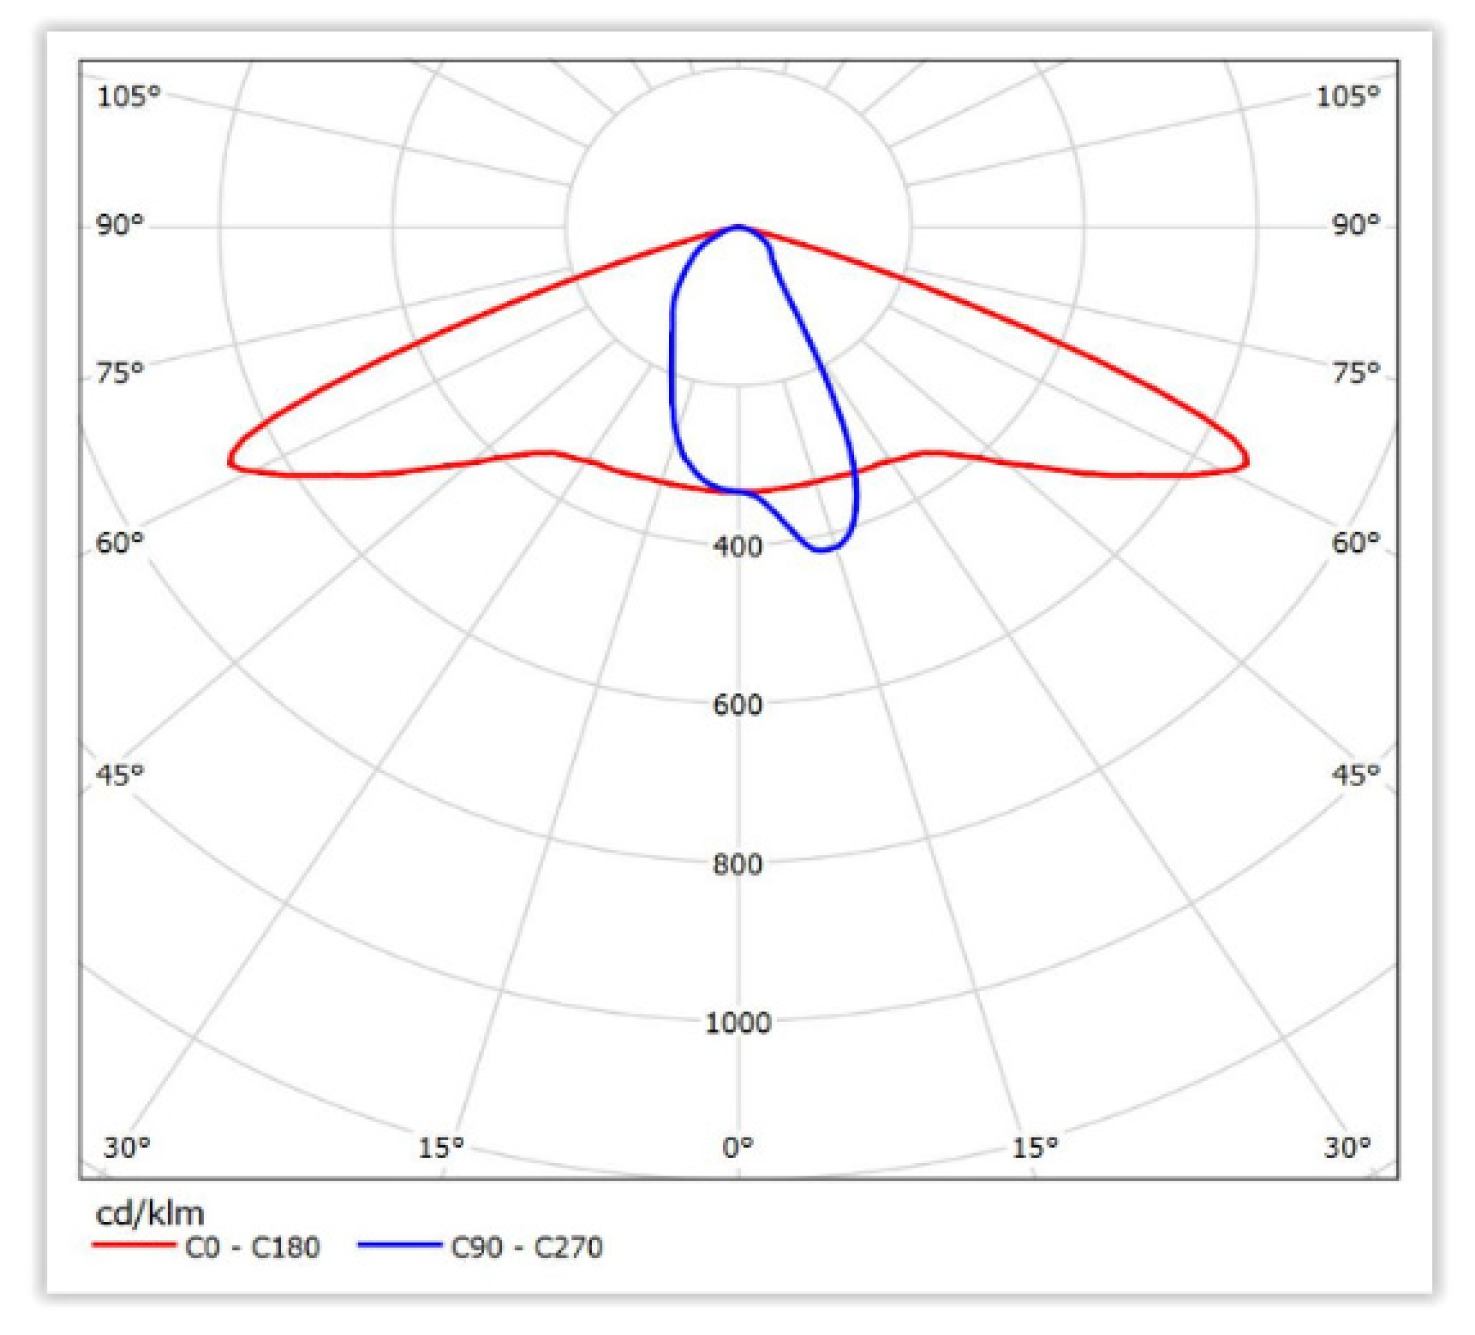
A street typical for Polish towns was chosen for the study (the required lighting class is M4) [88], located (Figure 3) in Radzymin near Warsaw. It is a single carriageway, two-lane, two-way street that is 7-m wide and about 1 km long. It has a lighting installation consisting of 40 streetlamps with 25-m distance between them, 1.50 m luminaire overhang, and the tilt angle of 0° (Figure 4). A LED lighting installation made on the basis of luminaires from a well-known EU manufacturer (Figure 5) is installed on this street. Catalogue technical parameters of this luminaire (later in the article it is marked as LED_26W) are presented in Table 2, and the luminous intensity distribution curve is shown in Figure 6. The luminaires are equipped with a local controller based on the analogue signa, which allows to control and change the emitted luminous flux and the power consumption. The luminaires are controlled by changing voltage (in the range from 1 V to 10 V) on the controller. The control characteristics of the LED_26W luminaire, i.e., the dependence of the luminous flux (Φ) emitted by it and the power consumed (P) on the value of the controller control voltage (changed in the range from 1 V to 10 V) was determined with the use of the laboratory test stand presented in Figure 7. This stand consists of an. integrating sphere of 2-m diameter; photometer B520 (by LMT company); autotransformer, power analyzer IT9121 (by ITech company); oscilloscope DS1054Z (by Rigol company); and programmable DC power supply PPS3210 (by Motech company).
Thanks to the central controller, the lighting installation consisting of such luminaires can transmit and receive a signal to and from each of the luminaires wirelessly. Data are transmitted from the central controller via the Internet to the server and databases (telemanagement option). Thanks to such a solution, it is possible to control, measure, and manage the lighting network via the Internet, e.g., with a web browser such as Google Chrome or Microsoft Edge. The time of switching it on and off depends on the time of the sunrise and the sunset on a given day. The sunrise and sunset hours on this street (for example, for the first and last day of each month in 2020) are presented in Table 3. For each day of the year from 9:00 a.m. to 03:00 p.m. the lighting installation does not work as it is the daylight and the lamps are switched off.
The lighting requirements of this roadway are classified as M4 (EN 13201:2015 standard) taking into account the values of parameters such as traffic volume, traffic composition, separation of carriageway, parked vehicles, ambient luminosity, and navigational task. Peak hours (Table 4) are from 7.00 a.m. to 9.00 a.m. and from 3.00 p.m. to 5.00 p.m. on this street and lower traffic volume is observed from 5.00 a.m. to 7.00 a.m. and from 5.00 p.m. to 11.00 p.m. However, during the night hours from 11.00 p.m. to 5.00 a.m. the traffic on this street is very light. Taking into account the fact that the traffic volume on this road is subject to significant changes during the day, according to EN 13201:2015, it is possible to reduce the luminance level of the roadway (below the requirements of M4 class) during the night hours i.e., by using lighting control. It is acceptable for this road (see Table 4, Figure 8) to reduce the luminance requirements of M4 class (0.75 cd/m2) outside the traffic peak to the luminance requirements of M5 class (0.5 cd/m2), and for night hours to the luminance requirements of M6 class (0.30 cd/m2).
As the luminance levels of the road change, so does the perception of the road user whose eye is adapted to mesopic conditions. Figure 9 shows (determined using Equation (1)) the spectral sensitivity curves of the human eye Vmes, with lighting provided by LED_26W luminaire, for luminance levels (Le) of 0.30 cd/m2 (road class M6), 0.50 cd/m2 (road class M5), and 0.75 cd/m2 (road class M4).
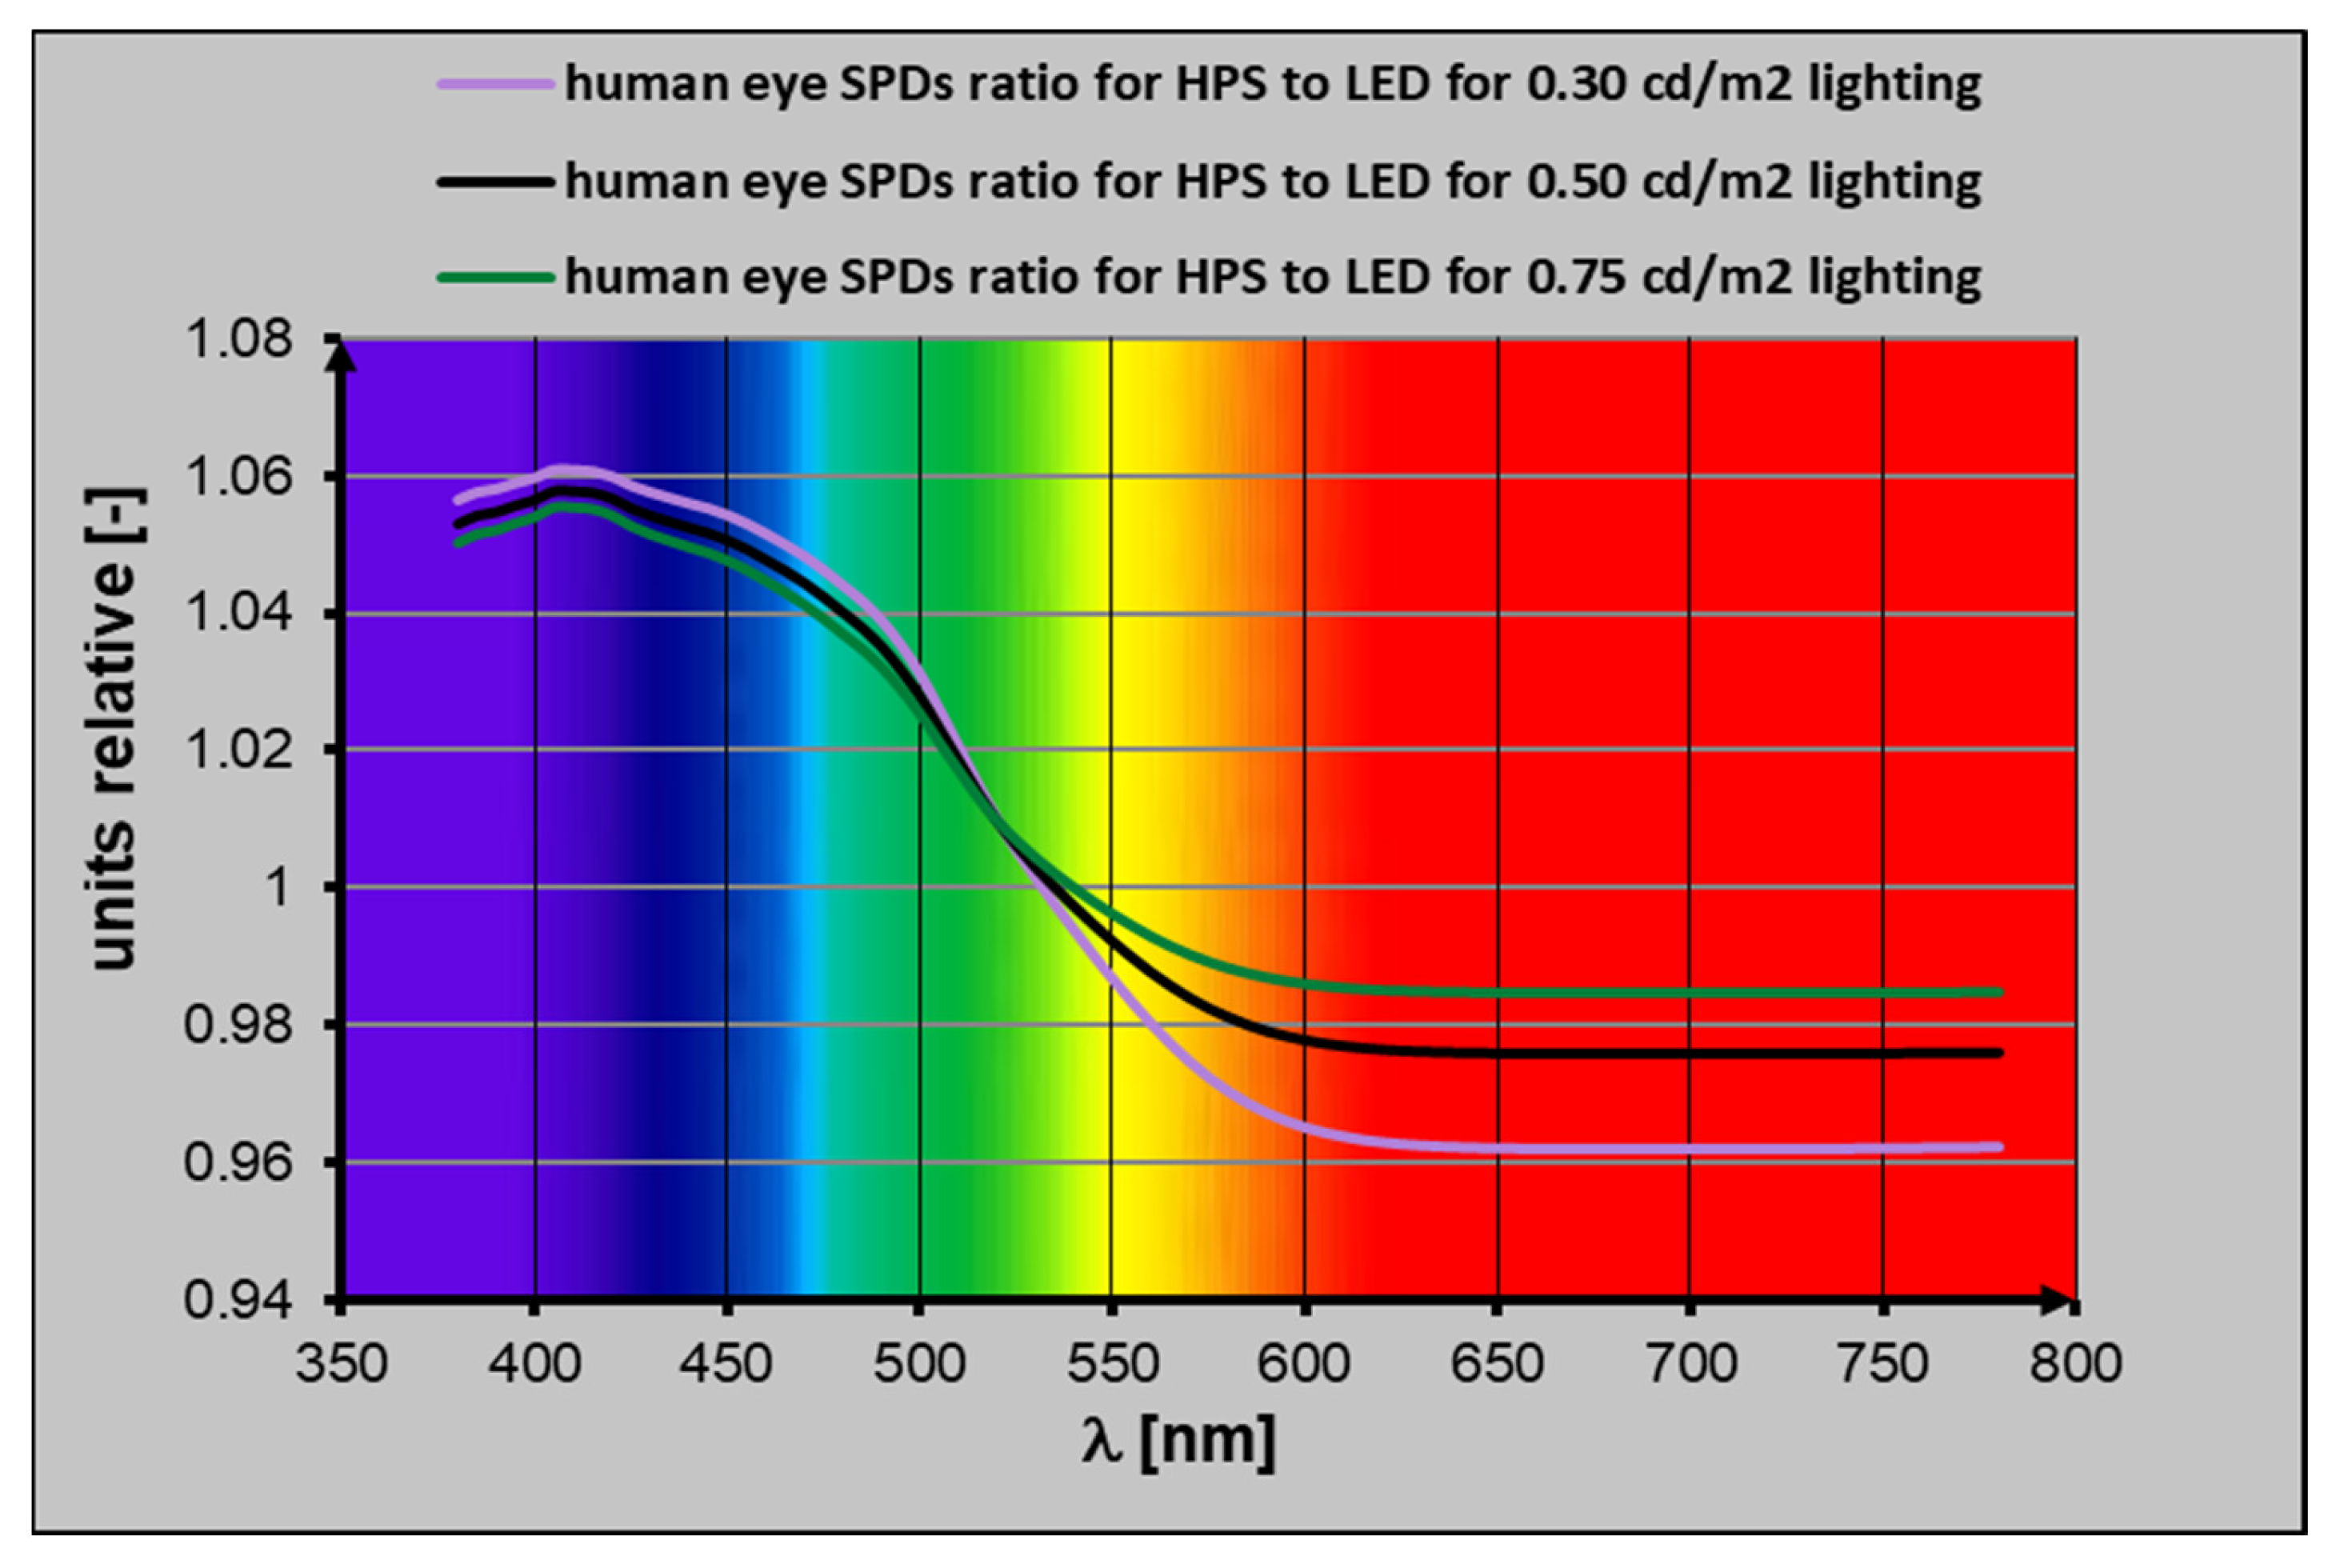
In Figure 9, the purple line represents Vmes for luminance value of 0.30 cd/m2; the dashed grey line represents Vmes for 0.50 cd/m2 and the navy-blue line represents Vmes luminance value for 0.75 cd/m2. For comparison purposes, Figure 9 also shows the curve illustrating the spectral sensitivity of the eye under photopic conditions (white line) and under scotopic conditions (black line). The spectral distribution of the SPD radiant power of this luminaire is also shown by a pink line in Figure 9. As mentioned before, the normative requirements (determined for photopic vision) for the Le luminance of the road were determined for lighting with HPS lamps (CCT 2060 K). In the case of LED lighting (CCT 4000 K), the eye sensitivity at these luminance levels is different from that of HPS lighting (Figure 10). In Figure 10, the human eye SPDs ratio for HPS to LED at different levels of lighting is presented. The green line is for 0.75 cd/m2, the black line is for 0.50 cd/m2, and violet line is for 0.30 cd/m2 luminance. The information presented in Figure 10 shows that mesopic luminance levels Lmes (Equation (2)) resulting from the normative lighting level of HPS lamps are possible at lower photopic luminance levels when using LED lamps (see Table 5). In Table 5, the third column represents the mesopic values specified for standardized photopic values and the fourth column represents the photopic luminance values at which the LED source reaches the same mesopic luminance values as the HPS source.
In order to verify the thesis of the work on whether LED street lighting can reduce electricity consumption and thus improve the energy efficiency of a given lighting installation, two lighting scenarios were established for this street (Table 6) along with a third reference scenario. For the first case, it was assumed that the road lighting was to be compliant with the luminance values required by EN 13201-Road Lighting standard for classes M4, M5, and M6 (Table 6, first column). For the second case, the street lighting photopic luminance levels created by LED (in each M lighting class provided in EN 13201:2015) were reduced to the values that provide equal their mesopic luminance level with mesopic luminance values created by the HPS lamp (Table 6, second column). The reduced values result from the conversion of the photopic luminance values created by the HPS lamp to the corresponding mesopic luminance values. At the next step for LED lighting, photopic luminance values corresponding to those mesopic luminance values are calculated. For comparison purposes, the third scenario (shown in Table 6, third column) was also introduced, in which the lighting class is fixed, (i.e., M4—with no use of the control system) for the whole period of the installation illumination.
The measurements were made using a portable testing equipment, which is shown in Figure 11. The equipment is a typical station for determining road luminance distribution [89,90,91]. After changing from a luminance meter to a digital camera, it also allows users to take overview photos. According to the current standard, such measurements should be taken for both the left and right street lane [34] and then the less favorable value (worst-case scenario) should be considered the final result. According to the requirements of EN-13201:2015 standard, the image luminance measuring device (ILMD) Techno Team LMK 98-3 Color was placed in the center of each (left/right) lane at a height of 1.5 m, 60.0 m from the measuring module (Figure 11). It has been demonstrated in earlier works of the authors of this article [63,65,91,92,93,94] and other research papers [95,96,97,98] that using this type of the meter to measure the luminance distribution of road lighting is well-justified.
Measurements were taken for 6 levels of roadway luminance i.e., 0.75 cd/m2; 0.68 cd/m2; 0.50 cd/m2; 0.43 cd/m2; 0.30 cd/m2; 0.25 cd/m2. The values 0.75 cd/m2; 0.50 cd/m2, and 0.30 cd/m2 stem directly from the EN-13201:2015 standard [34]. Their equivalents resulting from the assumption of the equality of mesopic luminance in LED lighting with those created by the HPS lamps are the respective luminance values of 0.68 cd/m2; 0.43 cd/m2 and 0.25 cd/m2. The measurements were taken in the summer during a rainy night at 10:30 p.m. (10:30 p.m. was the starting time of measurements). Before starting the measurements, the lighting system was switched on for one hour. With the changes in the luminance level of the roadway, it took 20 min to stabilize the lighting system photometric parameters (stabilization of the emitted luminous flux). Only after that time was the luminance distribution measured and the photo illustrating the given measurement scene taken.

3. Results

Table 7 summarizes the results of tests carried out to determine the control characteristics of the LED_26W luminaire. The measurements were taken using the test stand shown in Figure 7.
The first column of Table 7 shows the level of control where 10V means the maximum control of the luminaire (maximum operating parameters—100% control). The second column contains the results of the luminous flux value measurements (Φ) for a given level of luminaire control. The third column shows the results of active power (P) measurements. The measurements presented in Table 7 were used to determine the control characteristics (Figure 12), which illustrate how the level of control of the LED_26W luminaire affects the emitted luminous flux (Φ) and the active power (P) consumed by it. Based on the control curve shown in Figure 12, the values of the luminaire control signals (U) were determined, which ensure obtaining (Table 8) 6 target luminance levels Le (i.e., 0.75 cd/m2; 0.68 cd/m2; 0.50 cd/m2; 0.43 cd/m2; 0.30 cd/m2; 0.25 cd/m2). Table 8 also shows for each of the luminance levels the values of the luminous flux (Φ) of the luminaire needed to obtain the given luminance level and the active power (P) consumed for this case. These values are also given in (%) in the fourth and sixth columns.
Based on the results of the measurements in Table 8, the required luminous flux levels [%] were determined to ensure that the three lighting scenarios presented in Table 6 were implemented. In accordance with the assumed lighting scenario, the requirements for the luminous flux levels emitted by the installation are listed in Figure 13, Figure 14 and Figure 15, respectively. Regardless of the control scenario, the lighting installation is switched on in the hours from the dusk to the dawn. There is no need for it to operate during the day. If the sunrise (see Table 3) occurs earlier than the data shown in Figure 13, Figure 14 and Figure 15, the control algorithm for this lighting system will turn it off. This lighting installation can only be switched on after the sunset (see Table 3). The longest operating time of the installation will take place on the 22 December, (16 h 22 min) and the shortest on the 22 June (7 h and 17 min). For example, on the 1 January 2020, the lighting installation performing lighting scenario number 1 (control compliant with EN 13201 standard) will work as shown in Table 9. For 2020, the total operation time) of the lighting installation was 4313 h.
Electricity consumption for 40 LED_26W luminaires installed on one kilometer on Slowackiego Street in Radzymin depends on the lighting scenario in which this lighting installation operates and on the working time. For the three lighting scenarios (control systems) under consideration, the anticipated electricity consumption was determined for each month and the entire year. Table 10 summarizes the data in [kWh] and [%]. A visual illustration of electricity consumption [kWh] and [%] is shown in Figure 16.
For particular levels of luminance control, the results of luminance distribution measurements and the corresponding street pictures are shown in Figure 17, Figure 18, Figure 19, Figure 20, Figure 21 and Figure 22 (the left picture shows the street picture, and the right picture shows the luminance distribution for the observer’s position on the right lane). The values of the average road luminance resulting from these measurements are listed in Table 11. This table does not contain the information on whether this result concerns the right or the left side of the roadway. This results from the recommendations included in EN-13201:2015 standard [34] which require that the result of the luminance measurement of a given roadway to be defined as the less favorable value from among the measurements made for the right and left observer’s position on the road.

4. Discussion

In the course of the tests of photometric and electrical parameters of the LED_26W luminaire, the dependence of the luminous flux emitted by it on the voltage (changes from 1 V to 10 V) of the lamp controller was determined. In the range of control signals between 1 V and 8 V, the luminaire’s luminous flux Φ and power consumption P is a linear function. The control range from 8V to 10V causes saturation of the system—the value of the output luminous flux and the power consumed do not change (see Table 7 and Figure 12).
Based on the luminaire’s control characteristics, the system was redirected to achieve the road luminance levels required by EN 13201-Road Lighting standard for M4, M5, and M6 classes (Table 6, first column) and luminance levels reduced to those resulting from converting it to the corresponding mesopic luminance values (Table 6, second column). The photographs and luminance distributions shown in Figure 17 are related to the control of the lighting system in such a way that the luminous flux emitted by the system ensures that the lighting requirements for M4 class are met on the road. The luminous flux Φ emitted by the luminaires has a maximum value (see Table 11). The data presented in Figure 17 should be compared with the data presented in Figure 18, which were obtained when the luminous flux Φ of the lamps was 91%. In this case, the road luminance is Le=0.68 cd/m2, i.e., this luminance created by LEDs in mesopic viewing conditions has the same value as the luminance obtained with HPS lighting in M4 class (see Table 5). In the same way, Figure 19 and Figure 20 for M5 lighting class and Figure 21 and Figure 22 for M6 lighting class should be compared.
Analyzing the presented data from Table 10 and Figure 16 on an annual basis, the total annual energy consumption in Scenario 1 was 2586.92 kWh. For scenario 2 (where the mesopic vision was incorporated), energy consumption was 2202.81 kWh and dropped by about 15% in respect to scenario 1. In scenario 3 (no lighting control), the energy consumption increased to 4709.07 kWh, i.e., it increased by over 82% compared to the first lighting scenario. This means that the electricity savings are possible when using lighting control and having mesopic vision incorporated in this kind of street lighting design. These savings will be significant if the possibility of converting normative road luminance levels to those corresponding to the mesopic vision is considered.

5. Conclusions

The research was conducted for a suburban street illuminated by smart LED road luminaires with a luminous flux control system, which allows different luminance levels to be achieved on the road. This road is an access road to a town located on the outskirts of Warsaw, which is a large metropolis and the capital of Poland. Therefore, a lot of traffic occurs on this road in the morning and in the evening and it is very light at other times of the day. In accordance with EN 13201 standard, lighting control can be applied to illuminate this road. For the peak hours of the traffic, the road luminance should follow the M4 class requirements. After peak hours, it is possible to reduce the level of road illumination to M5 and for some night hours even to M6 class.
This paper compares energy consumption for different lighting scenarios of the road in question. In the first scenario, the road luminance is compliant with M4, M5, and M6 class requirements depending on the time of the day. In the second scenario, the values of luminance levels for each M lighting class provided by EN 13201 standard have been reduced to the values resulting from their conversion to the corresponding mesopic luminance values. The basis for reducing the criteria for road luminance requirements is the fact that the observer’s eye is adapted to the vision in mesopic conditions. According to the information presented in the CIE 191:2010 document, the same value of luminous flux perceived as brightness by humans in twilling (mesopic) range differs from that for photopic (daytime) conditions. When illuminating the road with LED lamps emitting a specific luminous flux, the road luminance considered in photopic conditions will have a lower value than when the mesopic vision conditions are taken as reference. In the case of HPS lamps, this issue is opposite. When the road is illuminated with an HPS lamp with a specific luminous flux, the luminance values of the road in relation to the mesopic range are lower than those determined for the photopic range.
So, it should be emphasized that the presented research has shown that a 15% saving per year in electricity consumption on the road is possible with such a conversion. Therefore, energy efficiency of a lighting installation can be improved by matching the lighting levels provided by the standard to the mesopic vision. Scenario number three does not include lighting control—all lighting is compliant with M4 class. In this case, the energy consumption is more than 82% higher than that needed in the first scenario.
The research results show a high potential for saving energy when the mesopic vision is taken into account at the design process of road lighting. Therefore, further research work is planned by the authors on this subject.

Author Contributions

Conceptualization. I.F. and D.C.; data curation. I.F. and D.C.; methodology. I.F. and D.C.; software. D.C. and I.F.; writing—original draft. I.F., D.C., J.F. and C.D.G.; writing—review and editing. I.F., D.C., J.F., and C.D.G. All authors have read and agreed to the published version of the manuscript.

Funding

This work WZ/WE-IA/3/2020 was supported by the Polish Ministry of Scientific Research and Higher Education research founds.

Institutional Review Board Statement

Not applicable.

Informed Consent Statement

Not applicable.

Data Availability Statement

Not applicable.

Acknowledgments

This work WZ/WE-IA/3/2020 was supported by the Polish Ministry of Scientific Research and Higher Education research founds.

Conflicts of Interest

The authors declare no conflict of interest.

References

  1. Li, Y.; Bhagavathula, R.; Terry, T.; Gibbons, R.; Medina, A. Safety Benefits and Best Practices for Intersection Lighting; Virginia Transportation Research Council: Charlottesville, VA, USA, 2020. [Google Scholar]
  2. Cottrell, B.H. Safety Benefits and Best Practices for Intersection Lighting. Project No. 114315USA. 2020. Available online: http://vtrc.virginiadot.org/ProjDetails.aspx?Id=656 (accessed on 22 February 2021).
  3. Bozorg, S.; Tetri, E.; Kosonen, I.; Luttinen, T. The Effect of Dimmed Road Lighting and Car Headlights on Visibility in Varying Road Surface Conditions. LEUKOS 2018, 14, 259–273. [Google Scholar] [CrossRef] [Green Version]
  4. Luckiesh, M. Artificial Light: Its Influence Upon Civilization; The Century Co.: New York, NY, USA, 1920. [Google Scholar]
  5. Bouroussis, C.A.; Doulos, L.T.; Madias, E.-N.D.; Topalis, F.V. Benchmark test on LED replacements of directional halogen lamps. In Proceedings of the Lux Europa 2013, Krakow, Poland, 17–19 September 2013; pp. 1–6. [Google Scholar]
  6. Czyzewski, D. LED substitutes of conventional incandescent lamps. Prz. Elektrotechniczny 2012, 88, 123–127. [Google Scholar]
  7. Fryc, I.; Fryc, J.; Jakubowski, P.; Wąsowski, K.A. Technical, medical and legal aspects of domestic light sources photobiological safety. Prz. Elektrotechniczny 2017, 93, 232–237. [Google Scholar] [CrossRef]
  8. Kowalska, J. Coloured light pollution in the urban environment. Photon- Lett. Pol. 2019, 11, 93–95. [Google Scholar] [CrossRef]
  9. Khanh, T.Q. Lighting Quality for Automotive Lighting. Light Eng. 2014, 22, 59–63. [Google Scholar]
  10. Adragna, C.; Pastori, E. High-efficiency multiple LED-string driver for street lighting and TV backlighting applications. In Proceedings of the 2014 AEIT Annual Conference—From Research to Industry: The Need for a More Effective Technology Transfer, AEIT 2014, Trieste, Italy, 18–19 September 2014; Institute of Electrical and Electronics Engineers: Piscataway, NJ, USA, 2015; pp. 1–6. [Google Scholar]
  11. Fryc, J.; Fryc, I. Light-emitting diodes in dermatology: Stimulation of wound healing. Dermatol. Rev. 2016, 2, 169–175. [Google Scholar] [CrossRef] [Green Version]
  12. Ibrahim, M.S.; Fan, J.; Yung, W.K.C.; Prisacaru, A.; van Driel, W.; Fan, X.; Zhang, G. Machine Learning and Digital Twin Driven Diagnostics and Prognostics of Light-Emitting Diodes. Laser Photonics Rev. 2020, 14, 1–33. [Google Scholar] [CrossRef]
  13. Fryc, I.; Prorok, M. White LED performance analyzed under their different working conditions. Prz. Elektrotechniczny 2013, 89, 274–276. [Google Scholar]
  14. Fan, J.; Yung, K.-C.; Pecht, M. Lifetime Estimation of High-Power White LED Using Degradation-Data-Driven Method. IEEE Trans. Device Mater. Reliab. 2012, 12, 470–477. [Google Scholar] [CrossRef]
  15. Czech, E.; Fryc, I. Power control method of color LEDs based luminaries, emitting constant light output, independent from the conditions of its operating environment. Prz. Elektrotechniczny 2014, 90, 270–272. [Google Scholar]
  16. Penning, J.; Stober, K.; Taylor, V.; Yamada, M. Energy Savings Forecast of Solid-State Lighting in General Illumination Applications; Technical Report; U.S. Department of Energy: Washington, DC, USA, 2014.
  17. European Union. EC Commission Regulation (EC) No 245/2009 of 18 March 2009 Implementing Directive 2005/32/EC of the European Parliament and of the Council with Regard to Ecodesign Requirements for Fluorescent Lamps Without Integrated Ballast, for High Intensity Discharge Lamps and for Ballasts and Luminaires Able to Operate Such Lamps; European Union: Bruxelles, Belgium, 2009. [Google Scholar]
  18. European Union. EC Commission Regulation (EC) No 357/2010; of 23 April 2010 amending Regulation (EU) No 185/2010 of 4 March 2010 Laying Down Detailed Measures for The Implementation of The Common Basic Standards on Aviation Security; European Union: Bruxelles, Belgium, 2010. [Google Scholar]
  19. The European Parliament and the Council Directive 2011/65/Eu of the European Parliament and of the Council of 8 June 2011 on the restriction of the use of certain hazardous substances in electrical and electronic equipment. Off. J. Eur. Union 2011, 1123. [CrossRef]
  20. BOX, P.C. Relationship between illumination and freeway accidents. J. Illum. Eng. Soc. 1971, 66, 365–393. [Google Scholar]
  21. Elvik, R. Meta-analysis of evaluations of public lighting as accident countermeasure. Transp. Res. Rec. 1995, 1485, 112–123. [Google Scholar]
  22. Jackett, M.; Frith, W. Quantifying the impact of road lighting on road safety—A New Zealand Study. IATSS Res. 2013, 36, 139–145. [Google Scholar] [CrossRef] [Green Version]
  23. Boyce, P.; Eklund, N.; Hamilton, B.; Bruno, L. Perceptions of safety at night in different lighting conditions. Light. Res. Technol. 2000, 32, 79–91. [Google Scholar] [CrossRef]
  24. Heraty, M.J. Review of Pedestrian Safety Research; Transport and Road Research Laboratory (TRRL): Crowthorne, UK, 1986. [Google Scholar]
  25. Raynham, P. An examination of the fundamentals of road lighting for pedestrians and drivers. Light. Res. Technol. 2004, 36, 307–313. [Google Scholar] [CrossRef]
  26. Peña-García, A.; Hurtado, A.; Aguilar-Luzón, M.C. Considerations about the impact of public lighting on pedestrians’ perception of safety and well-being. Saf. Sci. 2016, 89, 315–318. [Google Scholar] [CrossRef]
  27. Painter, K. The impact of street lighting on crime, fear, and pedestrian street use. Secur. J. 1994, 5, 116–124. [Google Scholar]
  28. Mattoni, B.; Burattini, C.; Bisegna, F.; Fotios, S. The pedestrian’s perspective: How do illuminance variations affect reassurance? In Proceedings of the 17th IEEE International Conference on Environment and Electrical Engineering and 2017 IEEE Industrial and Commercial Power Systems Europe, (EEEIC/I and CPS Europe), Milan, Italy, 6–9 June 2017; pp. 1–5. [Google Scholar] [CrossRef]
  29. Fotios, S.; Castleton, H. Specifying Enough Light to Feel Reassured on Pedestrian Footpaths. LEUKOS 2016, 12, 235–243. [Google Scholar] [CrossRef]
  30. Wąsowski, K.A.; Fryc, J.; Więcko, A.; Fryc, I. Bicycle lighting regulations determined by the quality of vision as well as the European Union legal requirements. Prz. Elektrotechniczny 2014, 90, 256–259. [Google Scholar] [CrossRef]
  31. Pracki, P.; Wiśniewski, A.; Czyżewski, D.; Krupiński, R.; Skarżyński, K.; Wesołowski, M.; Czaplicki, A. Strategies influencing energy efficiency of lighting solutions. Bull. Pol. Acad. Sci. Tech. Sci. 2020, 68, 711–719. [Google Scholar]
  32. European Committee for Standardization. Standard EN-13201: Road Lighting; European Committee for Standardization: Bruxelles, Belgium, 2003. [Google Scholar]
  33. Lewin, I.; Box, P.; Start, R. An Economic Study of Three Light Sources for Roadway Lighting. LEUKOS 2005, 1, 73–80. [Google Scholar] [CrossRef]
  34. European Committee for Standardization. Standard EN-13201: Road Ligting; European Committee for Standardization: Bruxelles, Belgium, 2015. [Google Scholar]
  35. Viorel, R.A.; Lucache, D.D.; Livint, G.; Gǎlǎţanu, C.D. Study on Illuminance Class Selection in Street Lighting Design. In Proceedings of the 8th International Conference on Modern Power Systems, MPS 2019, Cluj Napoca, Romania, 21–23 May 2019; pp. 1–6. [Google Scholar]
  36. Sędziwy, A.; Kotulski, L.; Basiura, A. Enhancing energy efficiency of adaptive lighting control. In Intelligent Information and Database Systems, Proceedings of the 9th Asian Conference ACIIDS 2017, Kazanawa, Japan, 3–5 April 2017; Springer: Cham, Switzerland, 2017; pp. 487–496. [Google Scholar]
  37. De Boer, J.B.; Burghout, F.; Van Heemskerck Veeckens, J.F.T. Appraisal of the quality of public lighting based on road surface luminance and glare. In Proceedings of the 14th Session of CIE, Brussels, Belgium, 2 October 1959. [Google Scholar]
  38. De Grijs, J.C. Visuele beoordelingen van verlichtingscriteria in Den Haag en Amsterdam (Visual assessments of lighting criteria in The Hague and Amsterdam). Elektrotechniek 1972, 50, 515–521. [Google Scholar]
  39. Boer, B.J. Quality Aspects in Public Lighting; Philips Engineering Report. 24; Philips: Eindhoven, The Netherlands, 1972. [Google Scholar]
  40. Economopoulos, I.-G. Photometric Parameters and Visual Performance in Road Lighting. Ph.D. Thesis, Technische Hogeschool Eindhoven, Eindhoven, The Netherlands, October 1978. [Google Scholar] [CrossRef]
  41. Wojnicki, I.; Ernst, S.; Kotulski, L.; Sedziwy, A. Advanced street lighting control. Expert Syst. Appl. 2014, 41, 999–1005. [Google Scholar] [CrossRef]
  42. Kusznier, J.; Wojtkowski, W. Spectral properties of smart LED lamps. Photon Lett. Pol. 2020, 12, 16–18. [Google Scholar] [CrossRef]
  43. Galatanu, C.D. On/Off Optimization of Public Lighting Systems Depending on the Road Class. Procedia Manuf. 2020, 46, 378–383. [Google Scholar] [CrossRef]
  44. Correa, J.; Ponce, M.; Arau, J.; Alonso, J.M. Dimming in metal-halide and HPS lamps operating at HF: Effects and modeling. In Proceedings of the Conference Record of the 2002 IEEE Industry Applications Society—37th IAS Annual Meeting, Pittsburgh, PA, USA, 13–18 October 2002; pp. 1467–1474. [Google Scholar]
  45. Li, F.; Chen, Y.; Liu, Y.; Chen, D. Comparative in Situ Study of LEDs and HPS in Road Lighting. LEUKOS 2012, 8, 205–214. [Google Scholar] [CrossRef]
  46. Jägerbrand, A.K. LED (Light-Emitting Diode) Road Lighting in Practice: An Evaluation of Compliance with Regulations and Improvements for Further Energy Savings. Energies 2016, 9, 357. [Google Scholar] [CrossRef] [Green Version]
  47. Djuretic, A.; Kostic, M. Actual energy savings when replacing high-pressure sodium with LED luminaires in street lighting. Energy 2018, 157, 367–378. [Google Scholar] [CrossRef]
  48. Hölker, F.; Moss, T.; Griefahn, B.; Kloas, W.; Voigt, C.C.; Henckel, D.; Hänel, A.; Kappeler, P.M.; Völker, S.; Schwope, A.; et al. The Dark Side of Light: A Transdisciplinary Research Agenda for Light Pollution Policy. Ecol. Soc. 2010, 15, 1–13. [Google Scholar] [CrossRef]
  49. Viorel, R.A.; Dumitru Lucache, D.; Gǎlǎţanu, C.D. Calculation of Energy Economy by Dimming LED Lamps with Maximum Performance. In Proceedings of the 2019 IEEE International Conference on Environment and Electrical Engineering and 2019 IEEE Industrial and Commercial Power Systems Europe, EEEIC/I and CPS Europe, Genova, Italy, 10–14 June 2019; pp. 1–6. [Google Scholar]
  50. Donatello, S.; Rodríguez, R.; Caldas Quintero, M.G.; Wolf, O.; Van Tichelen, P.; Van Hoof, V.; Geerken, T. Revision of the EU Green Public Procurement Criteria for Road Lighting and Traffic Signals; Publications Office of the European Union: Luxembourg, 2019; p. 127. [Google Scholar] [CrossRef]
  51. Fryc, I.; Tabaka, P. The night sky light pollution created by outdoor luminaires. Prz. Elektrotechniczny 2017, 93, 46–49. [Google Scholar] [CrossRef]
  52. Peña-García, A.; Sędziwy, A. Optimizing Lighting of Rural Roads and Protected Areas with White Light: A Compromise among Light Pollution, Energy Savings, and Visibility. LEUKOS 2020, 16, 147–156. [Google Scholar] [CrossRef]
  53. Fryc, I.; Bisegna, F.; Tabaka, P. Lighting of recreation grounds as a source of sky glow—The influence of luminaire type on this phenomenon. In Proceedings of the 2017 17th IEEE International Conference on Environment and Electrical Engineering and 2017 1st IEEE Industrial and Commercial Power Systems Europe (EEEIC/I and CPS Europe), Milan, Italy, 6–9 June 2017; pp. 1–4. [Google Scholar] [CrossRef]
  54. Chodakowski, A.; Fryc, I. Generating light with specified chromaticity coordinates. Prz. Elektrotechniczny 2008, 84, 86–89. [Google Scholar]
  55. Bergen, A. A practical method of comparing luminous intensity distributions. Light. Res. Technol. 2012, 44, 27–36. [Google Scholar] [CrossRef]
  56. Sun, C.-C.; Lee, X.-H.; Moreno, I.; Lee, C.-H.; Yu, Y.-W.; Yang, T.-H.; Chung, T.-Y. Design of LED Street Lighting Adapted for Free-Form Roads. IEEE Photon J. 2017, 9, 1–13. [Google Scholar] [CrossRef]
  57. Zhu, R.; Hong, Q.; Zhang, H.; Wu, S.-T. Freeform reflectors for architectural lighting. Opt. Express 2015, 23, 31828–31837. [Google Scholar] [CrossRef]
  58. Zalewski, S. Design of optical systems for LED road luminaires. Appl. Opt. 2015, 54, 163–170. [Google Scholar] [CrossRef] [PubMed] [Green Version]
  59. Czyzewski, D. Selected problems of defining the luminous area of electroluminescent diodes. Prz. Elektrotechniczny 2008, 84, 129–131. [Google Scholar]
  60. Czyżewski, D. Luminance distribution of LED luminous surface. Prz. Elektrotechniczny 2010, 86, 166–169. [Google Scholar]
  61. Czyżewski, D. Comparison of luminance distribution on the lighting surface of power LEDs. Photon- Lett. Pol. 2019, 11, 118–120. [Google Scholar] [CrossRef]
  62. Fryc, I.; Tabaka, P. Outdoor Areas Lighting with LEDs—The Competition Between Scotopic Efficacy and Light Pollution. Photon- Lett. Pol. 2019, 11, 75–77. [Google Scholar] [CrossRef]
  63. Czyzewski, D. Monitoring of the lighting conditions of a street illuminated with road lights equipped with LEDs. Prz. Elektrotechniczny 2010, 86, 170–172. [Google Scholar]
  64. Fryc, I. LED’s spectral power distribution under different condition of operating temperature and driving current. Prz. Elektrotechniczny 2010, 86, 187–189. [Google Scholar]
  65. Czyzewski, D. Monitoring of the first LED lighting installations in Warsaw. Prz. Elektrotechniczny 2011, 87, 13–16. [Google Scholar]
  66. De Boer, J.B.; Schreuder, D.A. Glare as a Criterion for Quality in Street Lighting. Light. Res. Technol. 1967, 32, 117–135. [Google Scholar] [CrossRef]
  67. Schreuder, D. Discomfort glare in street lighting. Light. Res. Technol. 1972, 4, 47–48. [Google Scholar] [CrossRef]
  68. Słomiński, S. Identifying problems with luminaire luminance measurements for discomfort glare analysis. Light. Res. Technol. 2016, 48, 573–588. [Google Scholar] [CrossRef]
  69. Sun, C.-C.; Jiang, C.-J.; Chen, Y.-C.; Yang, T.-H. Glare effect for three types of street lamps based on White LEDs. Opt. Rev. 2014, 21, 215–219. [Google Scholar] [CrossRef]
  70. Girard, J.; Villa, C.; Brémond, R. Discomfort Glare from Several Sources: A Formula for Outdoor Lighting. LEUKOS 2019, 1–17. [Google Scholar] [CrossRef]
  71. Eloholma, M.; Viikari, M.; Halonen, L.; Walkey, H.; Goodman, T.; Alferdinck, J.; Freiding, A.; Bodrogi, P.; Várady, G. Mesopic models—From brightness matching to visual performance in night-time driving: A review. Light. Res. Technol. 2005, 37, 155–175. [Google Scholar] [CrossRef]
  72. CIE Technical Raport CIE 191: Recommended System for Mesopic Photometry Based on Visual Performance; CIE: Vienna, Austria, 2010.
  73. Maksimainen, M.; Kurkela, M.; Bhusal, P.; Hyyppä, H. Calculation of Mesopic Luminance Using per Pixel S/P Ratios Measured with Digital Imaging. LEUKOS 2019, 15, 309–317. [Google Scholar] [CrossRef]
  74. Uchida, T.; Ohno, Y. Simplified field measurement methods for the CIE mesopic photometry system. Light. Res. Technol. 2017, 49, 774–787. [Google Scholar] [CrossRef]
  75. Goodman, T.; Forbes, A.; Walkey, H.; Eloholma, M.; Halonen, L.; Alferdinck, J.; Freiding, A.; Bodrogi, P.; Várady, G.; Szalmas, A. Mesopic visual efficiency IV: A model with relevance to nighttime driving and other applications. Light. Res. Technol. 2007, 39, 365–392. [Google Scholar] [CrossRef]
  76. Fotios, S.; Cheal, C. Predicting lamp spectrum effects at mesopic levels. Part 1: Spatial brightness. Light. Res. Technol. 2011, 43, 143–157. [Google Scholar] [CrossRef] [Green Version]
  77. Lewis, A.L. Visual Performance as a Function of Spectral Power Distribution of Light Sources at Luminances Used for General Outdoor Lighting. J. Illum. Eng. Soc. 1999, 28, 37–42. [Google Scholar] [CrossRef]
  78. Ylinen, A.-M.; Tähkämö, L.; Puolakka, M.; Halonen, L. Road Lighting Quality, Energy Efficiency, and Mesopic Design—LED Street Lighting Case Study. LEUKOS 2011, 8, 9–24. [Google Scholar] [CrossRef]
  79. Gibbons, R.; Terry, T.; Bhagavathula, R.; Meyer, J.; Lewis, A. Applicability of mesopic factors to the driving task. Light. Res. Technol. 2015, 48, 70–82. [Google Scholar] [CrossRef]
  80. Illuminating Engineering Society. IES TM-12-12. Spectral Effects of Lighting on Visual Performance at Mesopic Light Levels; Illuminating Engineering Society: New York, NY, USA, 2012. [Google Scholar]
  81. Ohashi, R.; Akashi, Y.; Uchida, T. Comparisons between off-axis detection and on-axis recognition to implement mesopic photometry in roadway lighting standards. Light. Res. Technol. 2019, 52, 540–553. [Google Scholar] [CrossRef]
  82. Fotios, S.; Cheal, C. Lighting for subsidiary streets: Investigation of lamps of different SPD. Part 2—Brightness. Light. Res. Technol. 2007, 39, 233–249. [Google Scholar] [CrossRef]
  83. White Paper. Methods for Comparing Visual Illumination Between HID and LED Luminaires to Optimize Visual Performance in Low Light Environments. Emerson 2018, 12, 1–12. [Google Scholar]
  84. Bullough, J.D. Spectral Considerations for Transportation Lighting Systems. In Proceedings of the Frontiers in Optics 2017; Optical Society of America, Washington, DC, USA, 15–19 September 2017; p. FTh3C.4. [Google Scholar]
  85. Djokic, L.; Cabarkapa, A.; Djuretic, A. Drivers’ impressions under high-pressure sodium and LED street lighting. Light. Res. Technol. 2017, 50, 1212–1224. [Google Scholar] [CrossRef]
  86. Illuminating Engineering Society. IES TM-24-13. An Optional Method for Adjusting the Recommended Illuminance for Visually Demanding Tasks Within IES Illuminance Categories P through Y Based on Light Source Spectrum; Illuminating Engineering Society: New York, NY, USA, 2013. [Google Scholar]
  87. Tetri, E.; Chenani, S.B.; Räsänen, R.-S.; Baumgartner, H.; Vaaja, M.; Sierla, S.; Tähkämö, L.; Virtanen, J.-P.; Kurkela, M.; Ikonen, E.; et al. Tutorial: Road Lighting for Efficient and Safe Traffic Environments. LEUKOS 2017, 13, 223–241. [Google Scholar] [CrossRef]
  88. Czyżewski, D.; Fryc, I. The Influence of Luminaire Photometric Intensity Curve Measurements Quality on Road Lighting Design Parameters. Energies 2020, 13, 3301. [Google Scholar] [CrossRef]
  89. Bálský, M. Luminance values extraction from digital images. In Proceedings of the 2016 IEEE Lighting Conference of the Visegrad Countries (Lumen V4), Karpacz, Poland, 13–16 September 2016; pp. 1–3. [Google Scholar]
  90. Galatanu, C.D. Improving the Luminance Measurement from Digital Images. In Proceedings of the 2019 International Conference on Electromechanical and Energy Systems (SIELMEN), Craiova, Romania, 9–11 October 2019; pp. 1–4. [Google Scholar]
  91. Czyzewski, D. Monitoring of the subsequent LED lighting installation in Warsaw in the years 2014–2015. In Proceedings of the 2016 IEEE Lighting Conference of the Visegrad Countries, (Lumen V4), Karpacz, Poland, 13–16 September 2016; pp. 1–4. [Google Scholar]
  92. Fryc, I. Accuracy of spectral correction of a CCD array for luminance distribution measurement. In Proceedings of the SPIE 5064 Lightmetry 2002: Metrology and Testing Techniques Using Light, Warsaw, Poland, 14–16 May 2003; Volume 5064, pp. 38–42. [Google Scholar]
  93. Fryc, I.; Czech, E. Application of optical fibers and CCD array for measurement of luminance distribution. In Proceedings of the SPIE 5064 Lightmetry 2002: Metrology and Testing Techniques Using Light, Warsaw, Poland, 14–16 May 2003; Volume 5064, pp. 18–21. [Google Scholar]
  94. Czyzewski, D.; Słomiński, S. Digital measurement of road lighting. Prz. Elektrotechniczny 2012, 88, 92–94. [Google Scholar]
  95. Greffier, F.; Muzet, V.; Boucher, V.; Fournela, F.; Dronneau, R. Use of an imaging luminance measuring device to evaluate road lighting performance at different angles of observation. In Proceedings of the 29th Quadrennial Session of the International Commission on Illumination (CIE), Washington, DC, USA, 14–22 June 2019; pp. 553–562. [Google Scholar]
  96. Greffier, F.; Charbonnier, P.; Tarel, J.-P.; Boucher, V.; Fournela, F. An automatic system for measuring road and tunnel lighting performance. In Proceedings of the 28th CIE session, Manchester, UK, 28 June–4 July 2015; pp. 1647–1656. [Google Scholar]
  97. Fiorentin, P.; Iacomussi, P.; Rossi, G. Characterization and Calibration of a CCD Detector for Light Engineering. IEEE Trans. Instrum. Meas. 2005, 54, 171–177. [Google Scholar] [CrossRef]
  98. Fiorentin, P.; Scroccaro, A. Detector-Based Calibration for Illuminance and Luminance Meters—Experimental Results. IEEE Trans. Instrum. Meas. 2010, 59, 1375–1381. [Google Scholar] [CrossRef]
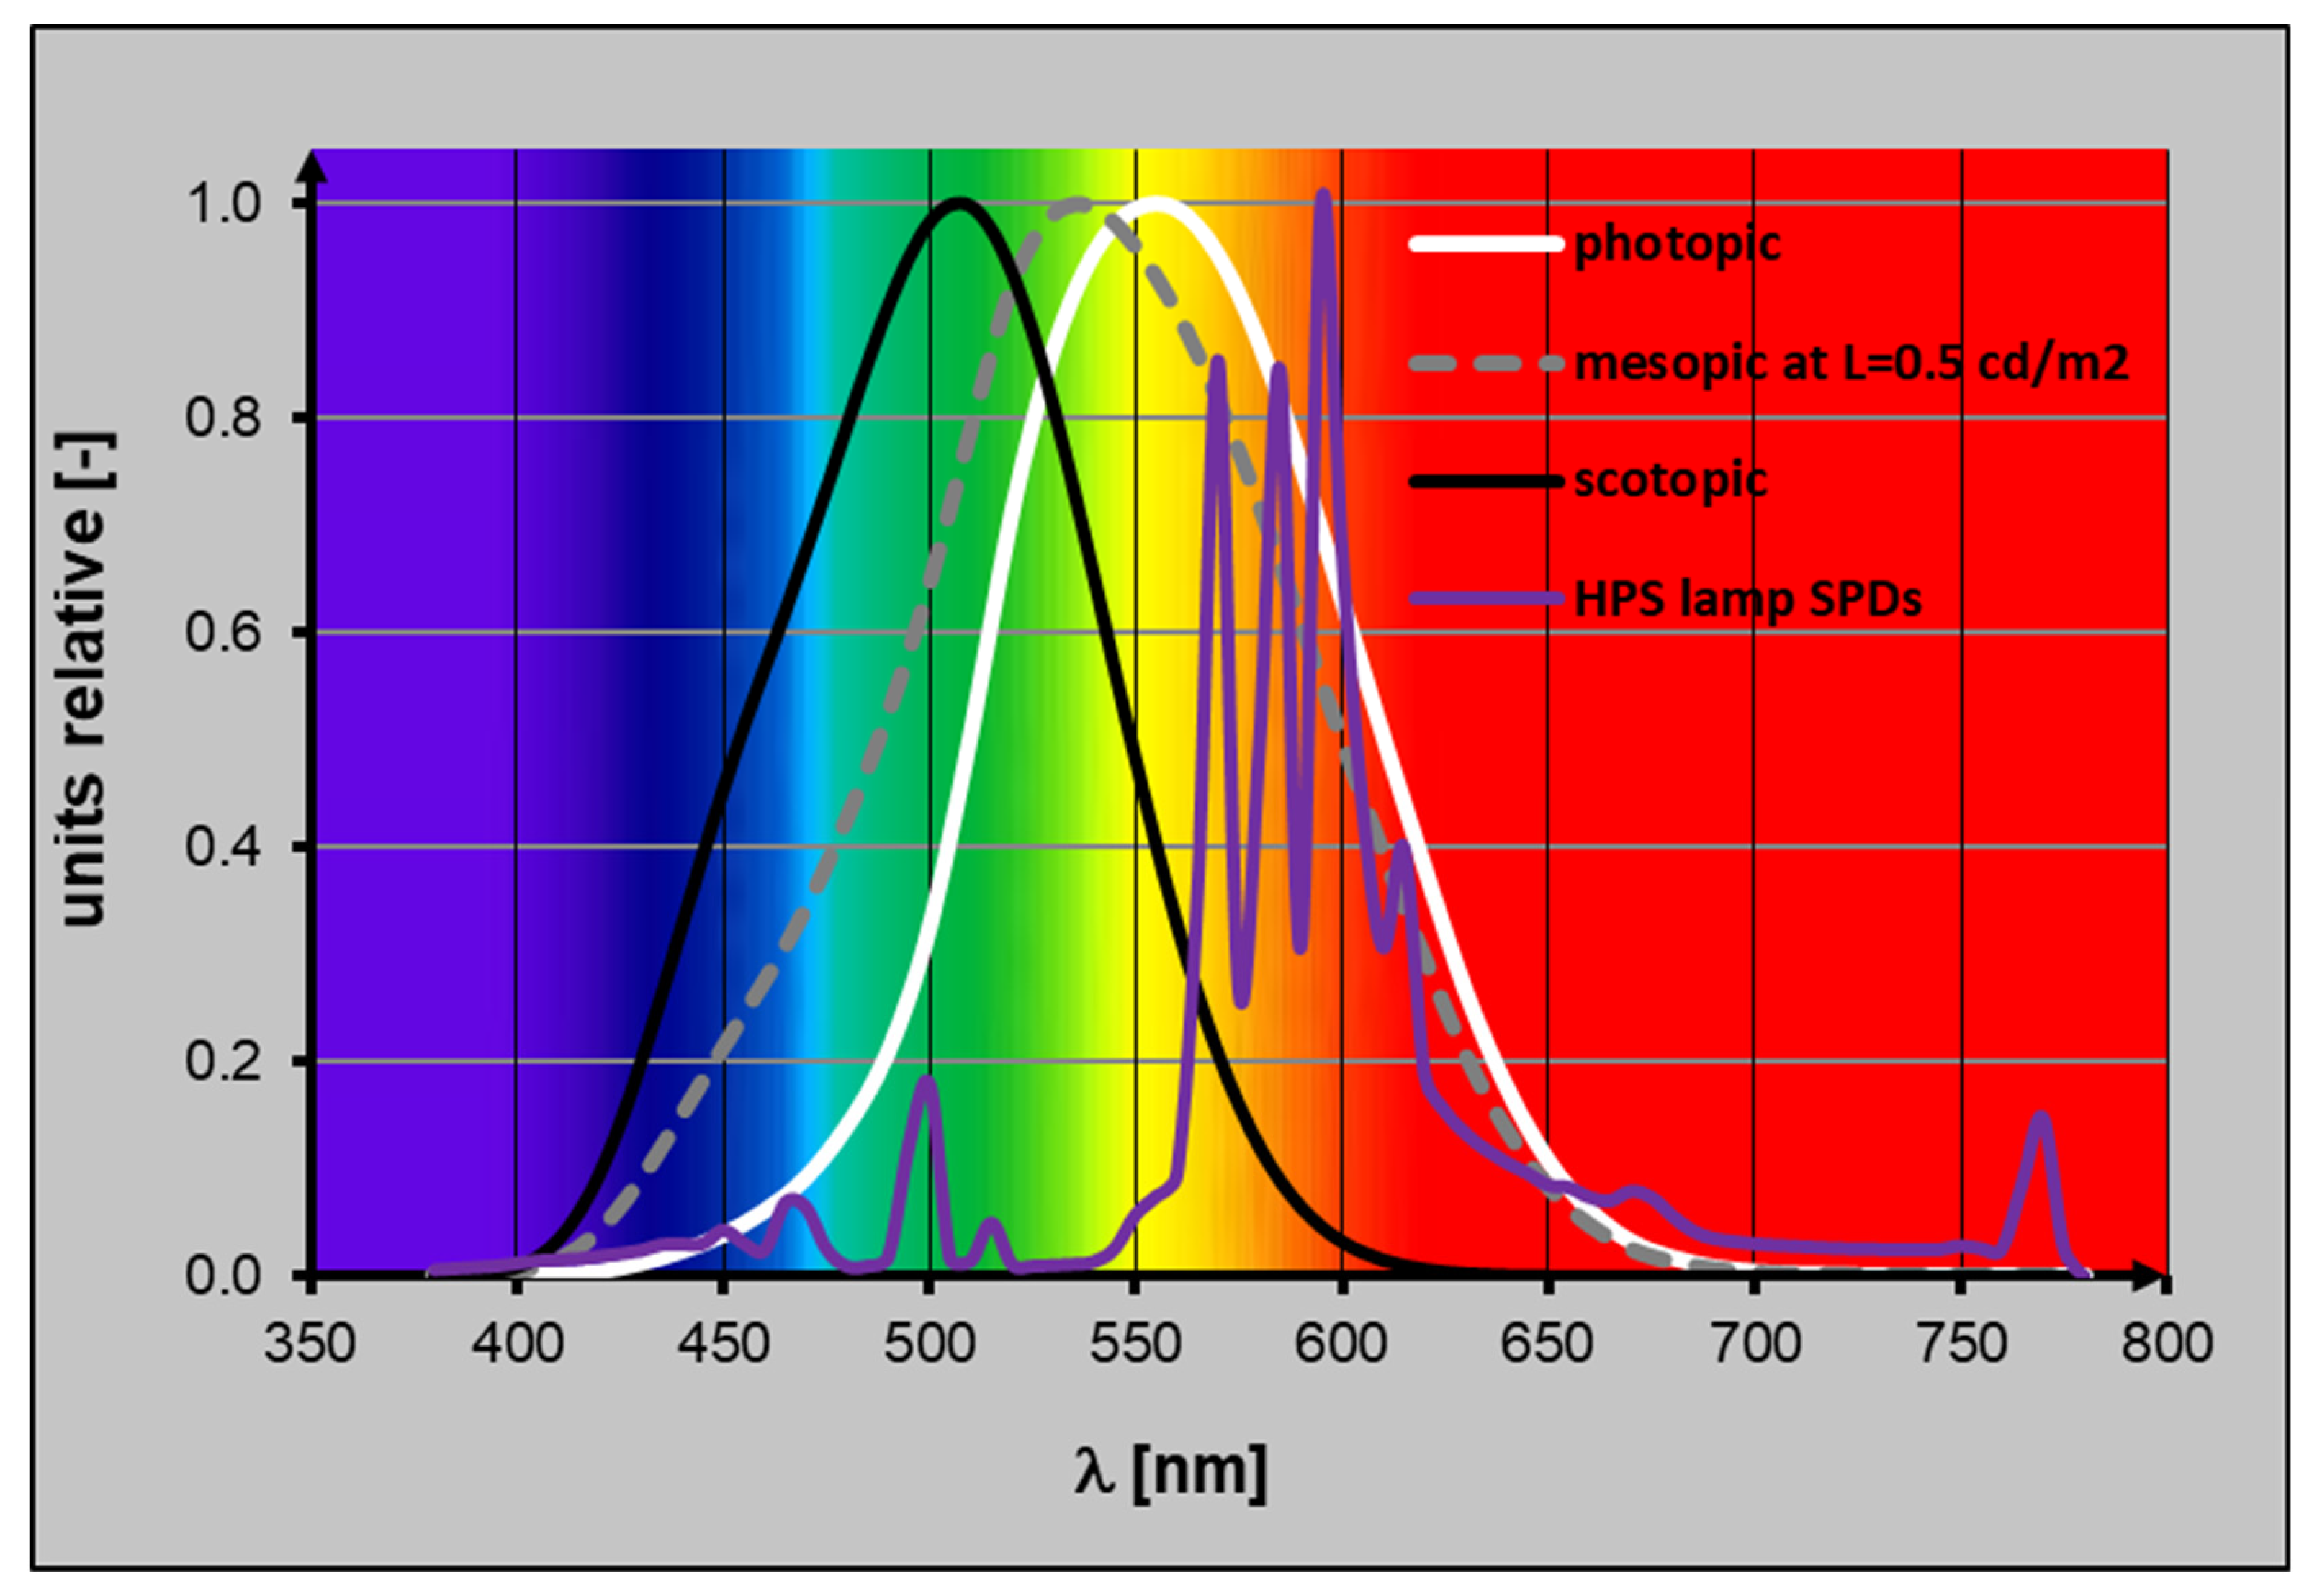
Figure 1. Spectral luminous efficiency of the human eye under photopic (white curve), scotopic (black curve), and mesopic (grey curve) vision conditions at luminance level L = 0.5 cd/m2 obtained with high-pressure sodium (HPS) lamp (spectral distribution of radiant power (SPDS) of HPS lamp (CCT = 2060 K) is show as violet curve).
Energies 14 01175 g001
Figure 2. Spectral distribution of HPS and LED lamps and the spectral efficiency of the human eye at luminance Le = 0.5 cd/m2 obtained with these lamps and for luminance Le = 0.5 cd/m2, the quotient of the spectral sensitivity of the eye at HPS lighting (CCT 2060 K) to the sensitivity of the eye at LED lighting (CCT 4000 K).
Energies 14 01175 g002
Figure 3. Slowackiego Street in Radzymin—view by Google Maps.
Energies 14 01175 g003
Figure 4. View of Slowackiego street where: H is the luminaire mounting height—7.0 m; W is the width of the roadway—7.0 m, S is the distance between streetlamps—25 m, OH—overhang which is 1.50 m, Q is the tilt equal to 0°.
Energies 14 01175 g004
Figure 5. View of road luminaire LED_26W—manufacturer’s catalogue data.
Energies 14 01175 g005
Figure 6. Luminaire light curve LED_26W.
Energies 14 01175 g006
Figure 7. The station for determining control characteristics: (1) Integrating sphere, (2) programmable DC power supply, (3) oscilloscope, (4) photometer, (5) power analyzer, (6) autotransformer.
Energies 14 01175 g007
Figure 8. Luminance levels (lighting classes) for Slowackiego Street in Radzymin, acceptable by the standard, for particular periods of the day.
Energies 14 01175 g008
Figure 9. Spectral distribution of the LED_26W road lighting luminaire (pink line) and sensitivity curves of the human eye under mesopic conditions for LED_26W lighting for luminance 0.30 cd/m2 (purple curve); 0.50 cd/m2 (dashed grey) and 0.75 cd/m2 (navy blue), as well as spectral sensitivity of the eye under photopic conditions (white line) and under scotopic conditions (black line).
Energies 14 01175 g009
Figure 10. The human eye SPDs ratio for HPS to LED at different levels of lighting. The green line is for 0.75 cd/m2, black line is for 0.50 cd/m2, and violet line is for 0.30 cd/m2 luminance.
Energies 14 01175 g010
Figure 11. View of the measuring system used to determine the road luminance distribution where S is equal to 25 m—distance (module) between luminaires, 60 m—distance of the luminance meter from the measuring field, 1.5 m—height of the luminance meter placement, ILMD—image luminance measuring device Techno Team LMK 98-3 Color, the line from ILMD shows exemplary aiming of the meter at one of the measuring points.
Energies 14 01175 g011
Figure 12. LED_26W luminaire control curve.
Energies 14 01175 g012
Figure 13. Lighting control profile—case 1 where the control system performs the control to ensure road luminance levels are compliant with EN 13201 standard (lighting scenario number 1).
Energies 14 01175 g013
Figure 14. Lighting control profile—case 2 where the control system carries out the control to execute scenario number 2 i.e., adjustment of road luminance levels to the brightness perceived in mesopic conditions.
Energies 14 01175 g014
Figure 15. Lighting scenario number 3 (no lighting control)—the installation works with full luminous flux over the whole range of operation, providing road luminance values compliant with M4 class for the whole operating time of the lighting installation.
Energies 14 01175 g015
Figure 16. Comparison of electricity consumption for lighting installation without control. with classic control (reduction values for photopic vision), and with control where the photopic reduction values for LEDs are compared against mesopic values.
Energies 14 01175 g016
Figure 17. View of the street with lighting when the luminous flux Φ of the lamps is controlled to 100% (average luminance of the roadway is Lav = 0.75 cd/m2).
Energies 14 01175 g017
Figure 18. View of the street with lighting when the luminous flux Φ of the lamps is controlled to 91% (average luminance of the roadway is Lav = 0.68 cd/m2).
Energies 14 01175 g018
Figure 19. View of the street with lighting when the luminous flux Φ of the lamps is controlled to 67% (average luminance of the roadway is Lav = 0.50 cd/m2).
Energies 14 01175 g019
Figure 20. View of the street with lighting when the luminous flux Φ of the lamps is controlled to 57% (average luminance of the roadway is Lav = 0.43 cd/m2).
Energies 14 01175 g020
Figure 21. View of the street with lighting when the luminous flux Φ of the lamps is controlled to 40% (average luminance of the roadway is Lav = 0.30 cd/m2).
Energies 14 01175 g021
Figure 22. View of the street with lighting when the luminous flux Φ of the lamps is controlled to 33% (average luminance of the roadway is Lav = 0.25 cd/m2).
Energies 14 01175 g022
Table 1. Requirements of M road lighting classes according to EN 13201:2015 standard.
Lighting ClassesLav
[cd/m2]
Uo
[–]
UI
[–]
fTI
[%]
REI
[–]
M12.000.400.70100.35
M21.500.400.70100.35
M31.000.400.60150.30
M40.750.400.60150.30
M50.500.350.40150.30
M60.300.350.40150.30
Symbols of column names; Lav [cd/m2] = average luminance (minimum maintained), Uo [–] = overall uniformity (minimum), Ul [–] = longitudinal uniformity (minimum); fTI [%] = threshold increment (maximum), REI [–] = edge illuminance ratio (minimum).
Table 2. Technical parameters of LED_26W luminaire.
Technical ParameterLuminaire (LED_26W)
Light source typeLED
Number of light sources16
Current LED500 mA
Luminaire luminous flux2900 lm
Luminaire power26 W
Luminaire lighting efficiency126 lm/W
Luminaire efficiency83%
Light colorNatural White (CCT 4000 K)
Table 3. Sunrise and sunset hours (at the beginning and end of the month—Slowackiego Street, Radzymin).
MonthSunrise Hour
for the First Day
of the Month
Sunset Hour
for the First Day
of the Month
Sunrise Hour
for the Last Day
of the Month
Sunset Hour
for the Last Day
of the Month
January7:46:00 a.m.3:31:00 p.m.7:19:00 a.m.4:18:00 p.m.
February7:19:00 a.m.4:18:00 p.m.6:23:00 a.m.5:12:00 p.m.
March6:20:00 a.m.5:14:00 p.m.6:11:00 a.m.7:07:00 p.m.
April6:09:00 a.m.7:09:00 p.m.5:06:00 a.m.7:58:00 p.m.
May5:04:00 a.m.8:00:00 p.m.4:21:00 a.m.8:44:00 p.m.
June4:21:00 a.m.8:45:00 p.m.4:20:00 a.m.8:58:00 p.m.
July4:21:00 a.m.8:58:00 p.m.4:58:00 a.m.8:25:00 p.m.
August4:59:00 a.m.8:24:00 p.m.5:48:00 a.m.7:22:00 p.m.
September5:50:00 a.m.7:20:00 p.m.6:37:00 a.m.6:12:00 p.m.
October6:39:00 a.m.6:10:00 p.m.6:32:00 a.m.4:05:00 p.m.
November6:34:00 a.m.4:03:00 p.m.7:24:00 a.m.3:25:00 p.m.
December7:25:00 a.m.3:24:00 p.m.7:46:00 a.m.3:31:00 p.m.
Table 4. Possible road lighting classes depending on time of day.
Hours Range Lighting Classes
0:00 a.m.–5:00 a.m.M6
5:00 a.m.–7:00 a.m.M5
7:00 a.m.–9:00 a.m.M4
9:00 a.m.–03:00 p.m.day light—lamps off
03:00 p.m.–05:00 p.m.M4
05:00 p.m.–11:00 p.m.M5
11:00 p.m.–0:00 a.m.M6
Table 5. Average luminance levels for different lighting classes, with the observer’s eye adjusted to different lighting conditions (photopic/mesopic vision).
Lighting ClassLuminance Le
[cd/m2]
(Photopic Vision
—for HPS Lamp)
Luminance
Lmes
[cd/m2]
(Mesopic Vision—for HPS Lamp and for LED Lamp)
Luminance
Le
[cd/m2]
(Photopic Vision—for LED Lamp Providing
Lmes Equal to Lmes with HPS Lamp
M40.750.710.68
M50.500.470.43
M60.300.270.25
Table 6. Luminance values for given lighting scenarios.
Hours RangeLuminance
[cd/m2]
Scenario 1
Luminance
[cd/m2]
Scenario 2
Luminance
[cd/m2]
Scenario 3
0:00 a.m.–5:00 a.m.0.300.250.75
5:00 a.m.–7:00 a.m.0.500.430.75
7:00 a.m.–9:00 a.m.0.750.680.75
9:00 a.m.–3:00 p.m.lamps offlamps offlamps off
3:00 p.m.–5:00 p.m.0.750.680.75
5:00 p.m.–11:00 p.m.0.500.430.75
11:00 p.m.–0:00 a.m.0.300.250.75
Table 7. Dependence of the luminous flux and the power consumed on the voltage signal controlling the LED_26W luminaire.
Control Signal
(U) [V]
Luminous Flux
(Φ) [lm]
Consumed Power
(P) [W]
10.02849.927.27
9.52849.927.25
9.02849.927.22
8.52849.927.21
8.02831.926.98
7.52677.825.43
7.02510.223.78
6.52359.322.17
6.02180.420.77
5.52006.618.96
5.01837.017.42
4.51663.215.85
4.01471.914.21
3.51264.512.57
3.01071.110.84
2.5873.29.25
2.0680.27.79
1.5492.96.18
1.0290.54.57
Table 8. Overview of control levels for LED_26W luminaire in order to obtain the intended luminance levels.
Average Luminance Level
(Le)
[cd/m2]
Control Signal
(U)
[V]
Luminous Flux
(Φ)
[lm]
Luminous Flux
(Φ)
[%]
Active Power
(P)
[W]
Active Power
(P)
[%]
0.7510.002849.910027.27100
0.687.252591.39124.3888
0.505.221907.96718.1365
0.434.421624.75715.6056
0.303.171140.84011.4241
0.252.65940.0339.7735
Table 9. Required levels of luminous flux emitted by lighting installations in order to ensure the required levels of road luminance on 1 January 2020 (for given lighting scenario).
Hours RangeScenario 1
(Φ)
[%]
Scenario 2
(Φ)
[%]
Scenario 3
(Φ)
[%]
0:00 a.m.–5:00 a.m.4033100
5:00 a.m.–7:00 a.m.6757100
7:00 a.m.–7:46 a.m.10091100
7:46 a.m.–3:31 p.m.lamps offlamps offlamps off
3:00 p.m.–5:00 p.m.10091100
5:00 p.m.–11:00 p.m.6757100
11:00 p.m.–0:00 a.m.4033100
Table 10. Energy consumption for 1 km of lighting installation and various lighting control schemes.
MonthEnergy Consumption
(Scenario 1)
[kWh] and [%]
Energy Consumption
(Scenario 2)
[kWh] and [%]
Energy Consumption
(Scenario 3)
[kWh] and [%]
January321.13100%275.9685.93%532.37165.78%
February250.86100%213.4785.10%446.10177.83%
March219.29100%185.8384.74%409.15186.58%
April167.53100%141.6084.52%329.26196.54%
May135.96100%114.6284.30%280.21206.10%
June114.96100%96.8384.23%241.31209.91%
July127.32100%107.2584.24%266.70209.47%
August160.27100%135.3384.44%321.05200.32%
September198.32100%167.9584.69%375.21189.19%
October253.54100%215.5585.02%456.37180.00%
November298.23100%255.8085.77%501.45168.14%
December339.51100%292.6256.19%550.75162.22%
SUM2586.92(100%)2202.81(85.15%)4709.93(182.07%)
Table 11. Summary of results of average luminance values for different levels of LED_26W luminaires’ control on the tested road.
Control Signal
[V]
Luminous Flux
(Φ)
[%]
Active Power
(P)
[%]
Average Luminance Value of Road Surface (Le)
[cd/m2]
Longitudinal
Uniformity
(Ul)
[–]
Overall
Uniformity
(Uo)
[–]
10.01001000.770.620.40
7.2591880.680.610.41
5.2267650.510.610.40
4.4257560.430.610.40
3.1740410.310.620.41
2.6533350.250.610.40
Publisher’s Note: MDPI stays neutral with regard to jurisdictional claims in published maps and institutional affiliations.