Abstract
This paper presents a finite element method (FEM)-based model, which describes the magnetic circuit of the BMW i3 traction machine. The model has been reconstructed based on data available in the public domain. The reader is provided with numerical data regarding flux linkage surfaces in d- and q-axes, as well as with all the information needed to develop a space-vector model of the machine in steady-state, taking into consideration the non-linearity of the magnetic circuit. Hence, the data of a highly-saturated machine from a renowned product are provided, which can serve as a reference design for research. After that, torque curve and partial load operation points are calculated. Finally, the machine model is linearized and the calculations are repeated with the simplified linearized model. The results from both models are then compared with each other. This comparison is intended to assess the magnitude of the expected inaccuracies, when simplified analytical tools are applied to highly-saturated machines (which are the backbone of automotive electrical drivetrains). It is especially important with regard to preliminary design of electrical drivetrains, as at this stage detailed machine geometry and materials are not known.
1. Introduction
The electric drive has been gaining popularity in the automotive industry over the past few decades. As automotive applications impose very demanding requirements on drive performance, it has pushed research activities towards the development of highly-efficient, high-power-density, high-torque-density and at the same time cost-effective solutions [1]. As a result, over the years voltage-source inverter fed permanent magnet synchronous machines (PMSM) have become the backbone of not only traction drives, but also drives mounted in auxiliary devices and actuators [1]. In order to meet these strict and often contradicting requirements, PMSM-based drives need to operate in the field-weakening mode and the machines are designed with highly-saturated magnetic circuits [1,2]. Precise analysis of such drives requires complex magnetic field models based on a finite element method (FEM) simulation [3,4,5]. On the other hand, at the preliminary drivetrain design stage, machine dimensions and materials are not known and some simple analytic models are much more desired for this purpose [6].
Most analyses regarding an inverter-fed PMSM operating in the field-weakening region were carried out using analytical formulas basing on a simplified constant parameter model, which assumes linearity of the magnetic circuit [6,7,8,9,10,11]. The main advantage of this approach is that it allows to consider interactions between machine design and power rating utilization of the inverter. The tight interrelationship between the design of the machine, the desired constant-power speed range and the resulting inverter and machine overrating factors was investigated in [12] based on the same simplified model. It was derived in [6] that there exist many different machine parameter sets meeting the same requirements imposed on torque vs. speed curve performance. However, incorrect selection of a particular set can lead to severe over-sizing of drive inverter power rating. This simplified analytical model was used in [13,14,15] as well in order to find optimal parameters set for the designed machine. It allowed the authors to achieve the required torque vs. speed performance and take into account the drive inverter power rating at the same time. In [16], the same model was also used in order to predict drive behavior in case of a fault of power electronics. It allowed to identify design decisions which should be made in order to make the drive robust against uncontrolled braking operation or damage of the DC-link capacitor.
Even though the simplified analytic model is a very powerful design tool, it neglects the effects of iron core saturation. From a practical point of view, it is then important to know how precise the results obtained with this model can be if the analyzed machine exhibits high magnetic saturation in reality. Reference [17] can serve as a great example. The authors investigated the influence of the buried magnet arrangement of the machine on the efficiency and drivability performance of a four-wheel-drive electric car. Various rotor arrangements were compared based on the energy consumption along four driving cycles. Even though it is a common fact that the automotive traction machines are intentionally designed to be highly-saturated, the simplified linear model was used for the calculation of the operating points needed for the efficiency maps generation. It allowed the authors to substantially reduce the complexity of this very challenging analysis.
This paper has two goals. Firstly, it compares torque vs. speed curves and partial load operational points of the PMSM drive, which are calculated using two different models. The first one, the space-vector steady-state model, is more exact, but also more complicated, since it takes into consideration non-linear flux linkage surfaces [18]. The second model, the loss-less linearized model with constant machine parameters, is less precise, but at the same time it is a very simple solution [6]. They were compared on the basis of an FEM model of the BMW i3 traction machine, which is an extreme example of a highly-saturated machine. The model was reconstructed based on information available in the public domain [19,20,21]. It leads to the second goal of this paper, which is to provide the reader with data of the non-linear steady-state model for a highly-saturated machine from a renowned product, which can serve as a reference design for research. It should be mentioned that such a reference FEM model of this machine has already been created in [22]. Nevertheless, it was only used as a reference to the proposed solution and there was no focus on making this model reproducible by the reader. Additionally, it was created based only on reference [19], which does not provide all the sufficient information needed to model the BMW i3 traction machine (see Section 2 for details). It remains unclear how this missing information was complemented and/or estimated. In contrast, the description provided here provides full transparency of the information sources used for the model creation.
The results presented in this paper allow to quantify the influence of the iron core saturation on the torque performance calculated with the linearized model. It allows designers to estimate the order of magnitude of errors which they should account for using simplified analytic tools. According to the authors’ best knowledge, such an attempt has not been documented before. Commonly, during analyses regarding this topic, authors just state that it is important to include saturation effects [23,24,25,26,27,28] in the analysis, without any further discussion. An attempt to analyze this effect more precisely was made in [29]. It was described how the saturation effect qualitatively influences the choice of proper current set-points in the -plane. Nevertheless, the results were not quantified and the influence on the torque vs. speed curve calculation was not presented.
2. Materials and Methods
The analysis is performed based on the example of the BMW i3 traction motor. This machine has been chosen for various reasons. First of all, it is an excellent example of a highly-saturated PMSM. Additionally, it is part of a high-end product from a high-tier manufacturer.
The used machine model has been reconstructed based on information available in the public domain. The main source of the data is a tear-down analysis report published by the Oak Ridge National Laboratory (ORNL) [19]. Some additional information about slot geometry, winding configuration and identified materials was provided by prof. Hendershot during his appearance at [20]. System parameters such as DC-bus voltage, maximal current, etc. were given in the presentation from BMW [21].
2.1. Machine Geometry and Winding Configuration
The machine model was created in the FEM electromagnetic field simulation software ANSYS Maxwell 2D (2018.1.0) [30]. The modeled geometry along with the most important dimensions are presented in Figure 1. These dimensions were published in the ORNL report [19]. As exact rotor geometry information was not published, it was reconstructed based on a photograph from the same report.
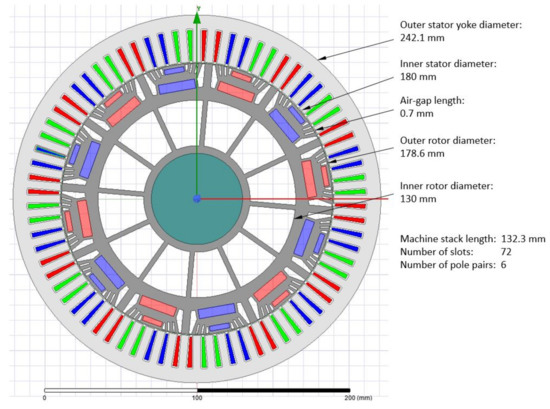
Figure 1.
The BMWi3 traction machine geometry view and its main dimensions.
Slot geometry is shown in Figure 2. The main dimensions in this picture were presented in [20]. The remaining dimensions were reconstructed based on a picture included in [20].
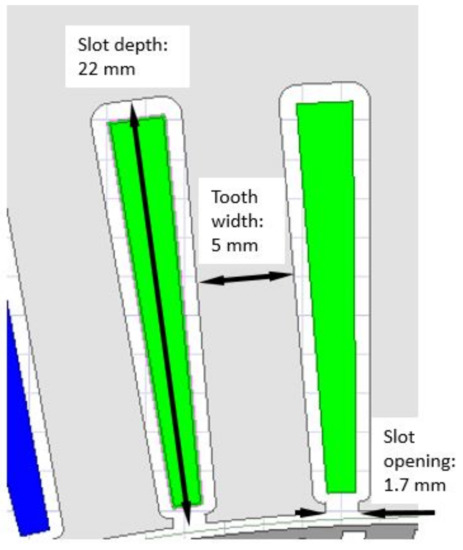
Figure 2.
The main dimensions of a slot.
The winding configuration of the machine was presented in [20] as well. It consists of six Y connected three-phase windings with isolated neutral points, which are connected in parallel. Therefore, there is one Y system per pole pair. A single phase winding of each system is placed in four slots, with nine turns per coil. The exact placement of coil sides in particular slots is presented in Figure 3. A, B and C are the phase names. The symbol ’+’ means the forward direction coil side and the symbol ’-’ means the return direction coil side.
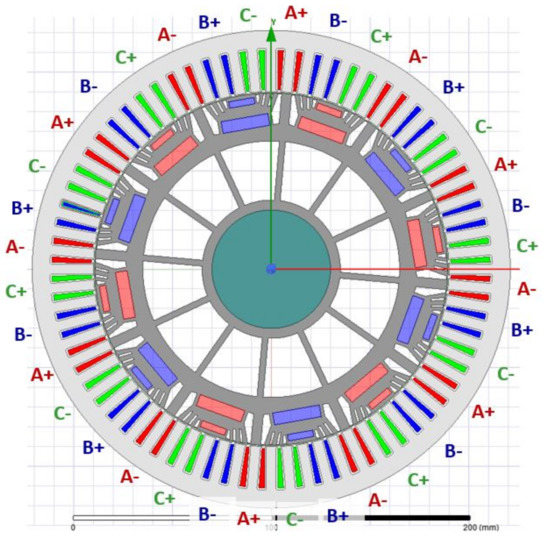
Figure 3.
Organization of the coil sides.
2.2. Definition of the Used Materials
The materials used in the machine were identified by ORNL and provided in [20]. From the magnetic circuit simulation point of view, the most important are parameters of the used steel and magnets.
It has been identified that the rotor core, stator yoke and stator teeth are all made of the same material, i.e., M-19 29 Ga steel. The magnetization curve of this steel shown in Figure 4 has been reconstructed based on the characteristics given in [31].
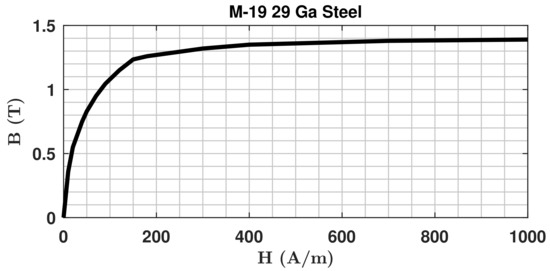
Figure 4.
Magnetization curve of the used steel.
The rotor magnet material has been identified to be Neodymium Iron Boron 38/23. According to [32], the characteristics of this material are: magnetic coercivity kA/m; magnetic remanence T.
2.3. Model Summary
For the readers’ convenience, all important machine parameters have been summarized in the form of tables in Appendix A. Mechanical dimensions are provided in Table A1, winding information in Table A2 and material information in Table A3.
Please note that the presented FEM model has also been included in the Supplementary Materials attached to this paper (in the Ansys Maxwell file format).
For readers using other FEM simulation software, the machine geometry has been additionally exported in the form of a .dxf file. This geometry together with the information from previous subsections is sufficient to fully recreate the model.
3. Results
3.1. FEM Simulation Results
Figure 5 shows exemplary flux density simulation results obtained with the model.
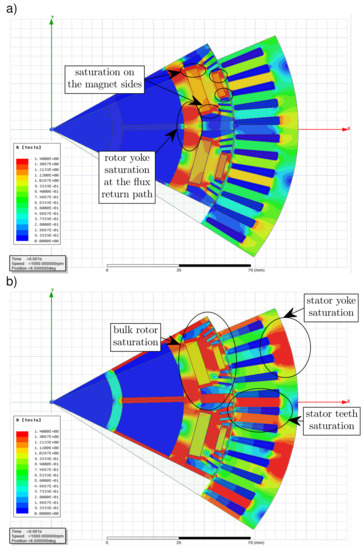
Figure 5.
Magnetic circuit saturation of the BMW i3 traction machine: (a) flux density plot at no current state, (b) flux density plot at the working point corresponding to the peak torque (). These plots were obtained with the “Ansys Maxwell” software.
It is important to note that the used steel saturates rapidly above approximately 1.25 T (see Figure 4). The first field plot (Figure 5a) shows the state when no currents are fed into the windings. In this state, the magnetic circuit is saturated at magnet sides. This is a necessary feature of every interior permanent magnet synchronous machine (IPMSM) design [1], as it provides very high reluctance to the leakage flux path around magnet sides and therefore forces the magnetic flux out of the rotor through the air gap. It is worth mentioning that even in this current-less state the rotor yoke is saturated at a flux return path (which indicates relatively high core material utilization). The second plot (Figure 5b) shows the state when currents resulting in the peak torque of the drive are fed into the windings (it is explained later in this paper how the values of these currents were obtained). It can be seen that these currents cause significant saturation in the stator yoke, the stator teeth, as well as bulk rotor saturation.
The FEM simulation was carried out for many different combinations of the d- and q-axis currents and for one full electrical period. It should be taken into consideration that the rotor of this machine is segmented in six parts in the axial direction (see the report [19]). These segments are rotated consecutively by one mechanical degree providing rotor skewing, which helps to partly eliminate adverse spatial harmonics in torque and induced voltage. It was considered in the analysis in such a way that the simulation was carried out for six different initial rotor positions and the results were averaged.
Please note that all the results (after averaging due to rotor skewing) are provided to the reader in Supplementary Materials attached to this paper. The attached spreadsheet includes the following signals as functions of mechanical angle: machine torque, d-axis flux linkage, q-axis flux linkage and induced voltages in all three phases.
The following part of the analysis focuses mainly on torque vs. speed curve calculation. From this point of view only average torque values are important and the spatial harmonics should be neglected. Hence, the torque and flux linkage values were averaged over one electrical period. The obtained numerical values are given in Appendix A providing the reader with the possibility to reproduce all the following results. The d- and q-axis flux linkage values can be found in Table A4 and Table A5, respectively. Torque values can be found in Table A6. The peak to peak torque ripple values were calculated as well (see Table A7). Values for intermediate current operation points were obtained via cubic interpolation and plotted in the form of three dimensional surfaces in Figure 6.
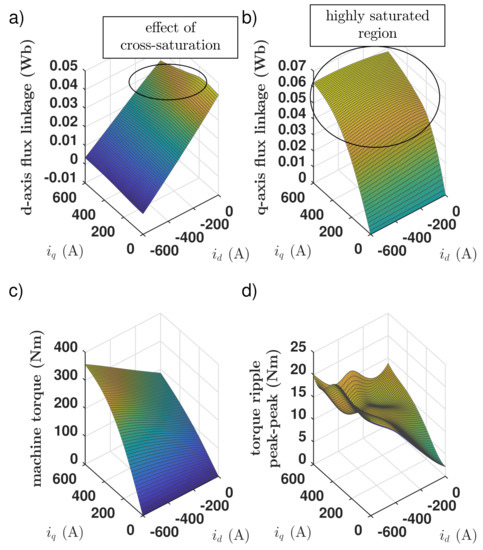
Figure 6.
Surface plots of the FEM simulation results for the BMW i3 traction machine: (a) d-axis flux linkage averaged over one electrical period, (b) q-axis flux linkage averaged over one electrical period, (c) torque averaged over one electrical period, (d) peak to peak torque ripple.
Severe magnetic circuit saturation due to an increase of the q-axis current component can be clearly seen in the q-axis flux linkage surface (Figure 6b). On the other hand, the d-axis flux linkage surface is relatively linear (Figure 6a), although it bends slightly downwards with the rising q-axis flux linkage value in a low d-axis current range. This is due to the so called cross-saturation effect caused by the fact that both d- and q-axis fluxes share some common path in the magnetic circuit [18]. This effect is also visible in the q-axis flux linkage surface, as the d-axis de-magnetization (i.e., rise in the de-magnetizing d-axis current magnitude) causes a slight increase in the q-axis flux linkage value. All the above findings indicate that the modeled machine exhibits significant iron core saturation in its feasible operation range. Hence, it has proven to be a very good candidate for comparison with the linearized model, since the obtained discrepancy between the results calculated with these two models can be expected to be close to its realistic extreme values.
The model was validated based on the locked rotor test results published in the ORNL report [19] (see Figure 7). During such a test the rotor is locked and currents of constant amplitude and various space-vector angles (with respect to d-axis) are fed into the windings. Importantly, the machine torque contains spatial harmonics and thus the value measured in the locked rotor test depends on the position in which the rotor has been locked. In order to take it into consideration, the simulation values used for the comparison in Figure 7 are the values averaged over one electrical period and the expected torque ripple is shown in the form of shaded areas. For this validation the torque and the torque ripple values presented in Figure 6c,d were used. The values corresponding to the measurement points were calculated using cubic interpolation.
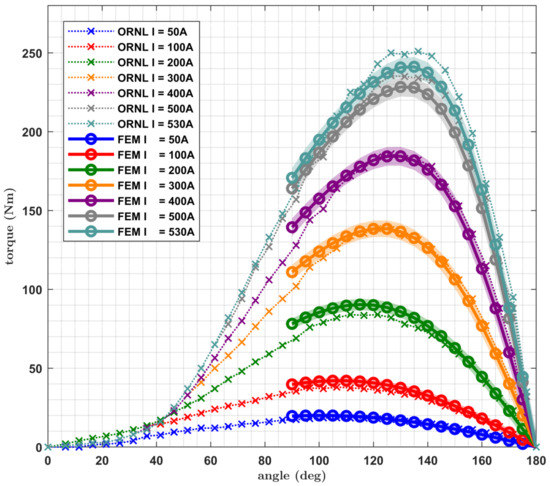
Figure 7.
Comparison of the experimental locked rotor test results obtained by the Oak Ridge National Laboratory (ORNL) [19] (dotted lines with cross markers) with corresponding values obtained with the FEM model (solid lines with circle markers). Simulation results are averaged over one electrical period and the shaded areas indicate the amount of torque ripple.
It should be considered that the rotor geometry of the machine is relatively complex and it was reconstructed based only on a photograph. Hence, it is obvious that some inaccuracies of the model should be expected. A difference between torque values calculated with the FEM model and the measurement results is especially visible at angles around 90 degrees (i.e., for low d-axis current). In the authors’ opinion, the obtained accuracy is sufficient to positively validate the presented model.
3.2. Calculations Based on the Non-Linear Model
The torque vs. speed curve can now be calculated using the following non-linear steady-state model [18]:
where and are d- and q-axis terminal voltage space-vector components (V); and are d- and q-axis current space-vector components (A); R is stator phase resistance (); is electrical rotor speed (rad/s); and are d- and q-axis flux linkages (Wb), which are non-linear functions of the current space-vector components (i.e., and ); p is the number of pole pairs; is machine torque (Nm).
The torque maximizing operation points were calculated based on (1) and the values listed in Table 1 using a numerical search algorithm created in MATLAB (R2017b) software [33]. The results are shown in Figure 8a, where the filled dots represent the obtained operation points for the consecutively rising speed. The same points can be identified on the torque vs. speed curve shown in Figure 8b. The first one corresponds to the peak torque in the base operation speed range and lies in a place where the possibly uppermost torque iso-line (blue lines in Figure 8a) is tangential to the current limitation circle (red circle in Figure 8a). The flux density plot in Figure 5b was obtained for exactly this operation point, which can be described with the following current space-vector component values:

Table 1.
The BMW i3 drive system parameters [20,21] used for the numerical search algorithm calculations.
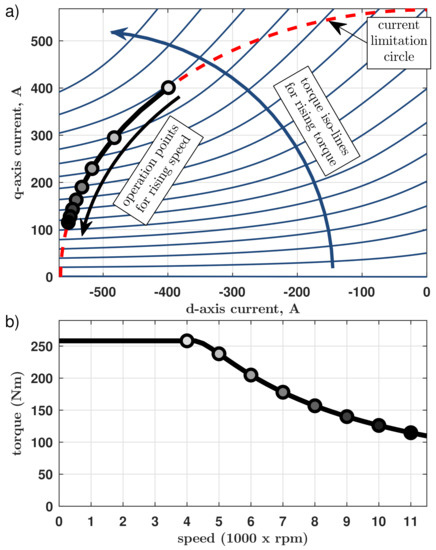
Figure 8.
The results of the BMW i3 traction drive maximal torque analysis, based on a numerical search algorithm and the non-linear flux linkage surfaces obtained with FEM simulation: (a) current space-vector locus, (b) torque vs. speed curve. The filled dots are the operation points for different speeds.
It is common knowledge that there exist two general drive classes regarding their behavior during field-weakening operation. The first is the finite maximal speed drive class. In such a case, there is only one field-weakening operating mode, i.e., current and voltage limited operating mode. During such operation, the current space-vector locus follows a current limitation circle up to the maximal speed of the drive. The second class is the infinite maximal speed drive class. In this case, there exists an additional operating mode above some threshold speed. This is a voltage limited operation according to a so-called maximal torque per voltage (MTPV) control strategy. During such an operation, the current space-vector locus follows a path from the current limitation circle into the so-called machine characteristic current point. All these characteristics are explained in detail in [6,10].
It can be identified in Figure 8a that the analyzed drive exhibits only one field-weakening operation mode, i.e., current and voltage limited operation along the current limitation circle path. This operation mode is maintained up to the maximal speed of this drive (i.e., 11,400 rpm) and the MTPV operation region has not been identified (which means that this is the finite maximal speed drive according to [6,10]).
3.3. Calculations Based on the Linearized Model
The goal of this paper was to quantify the influence of iron core saturation and voltage drop across the winding resistance on the results obtained with the following simplified model (for the details of this model please refer to [6,10]):
where and are d- and q-axis inductances calculated for some particular linearization point (H); is permanent magnet flux linkage calculated for some particular linearization point (Wb). In order to do so, the torque vs. speed curve for the BMW i3 traction drive should be now calculated with analytical formulas derived using this model, which can be found in [6]. The results can be then compared with these obtained using the previously introduced more complicated model (1). For convenience, in the course of this paper the following names are going to be used, in order to distinguish between the two models:
- ‘Non-linear model’—the space-vector model in steady-state defined with Equation (1), which includes voltage drop across stator resistance and non-linear flux linkage surfaces.
- ‘Linearized model’—the simplified model defined with Equation (3), which neglects voltage drop across stator resistance and assumes constant machine parameters (hence the term ‘linearized’).
As the linearized model uses constant machine parameter values, the non-linear flux linkage surfaces obtained in FEM simulation (see Figure 6) should be linearized at some operation point. In the presented analysis, the peak torque operation point (2) was chosen. The linearized machine parameters can be calculated from the flux linkages definition:
as follows:
The obtained linearized system parameters have been summarized in Table 2. These data follow the nomenclature introduced in [6]:
where is the machine saliency factor; is the drive characteristic factor; is the maximal phase current of the drive (A); is a machine characteristic current, i.e., d-axis current magnitude needed to reduce the d-axis flux linkage to zero (A).

Table 2.
The BMW i3 traction drive parameters obtained for the linearized model (3) for the current and voltage limitations listed in Table 1.
It is a well-known fact that the field-weakening performance of an inverter-fed PMSM drive depends on the relationship between the motor characteristic current and the maximal current of the drive [8,10,13]. In [6], the authors proposed to describe this relationship with a single variable, i.e., the drive characteristic factor . It was also derived that the value of this factor can deliver information about the necessity to over-size the drive inverter power rating.
For , the drive has a finite maximal speed and the ratio of this speed to the base speed rises with the value of this factor. The peak power value of drives from this class is equal to the volt-ampere rating of the inverter needed to operate these drives within their specifications. It means that for this class the power rating of the power electronic converters does not need to be over-sized.
For , the drive has an infinite maximal speed and the true constant power speed region rises when this factor is increased. Unfortunately, together with the value of the ratio between the volt-ampere rating of the power electronics inverter needed to operate the drive and the peak power at the machine shaft also rises. Hence, in this case the inverter power rating needs to be over-sized. A detailed discussion regarding this topic can be found in [6].
For the reasons explained above, it is common practice to design the drives in such a way that the characteristic factor has a value possibly close to the unity. It provides a good trade-off between field-weakening performance and power converter sizing. The analyzed BMW i3 drive is a perfect example of this design trend. Please note that the obtained drive characteristic factor value for this drive (see Table 2) is slightly smaller than the unity, but very close to it. As the drive belongs to the finite maximum speed class (i.e., ), there should be no MTPV operation region, which matches the results obtained with the non-linear model (see Figure 8).
Now, the torque vs. speed curve can be calculated based on the linearized model using analytical formulas. Please note, that different equivalent forms of these equations can be found in the literature [6,8,10]. The solution derived in [6] is going to be rewritten here for the reader’s convenience. It bases on the following normalized quantities in a per-unit system:
where the superscript () denotes the per-unit quantity (p.u.); i is current (A); is electrical angular speed (rad/s); T is torque (Nm); is the maximal phase voltage (V); is the base electrical angular speed for the normalization (rad/s); is the base torque for the normalization (Nm). The following formulas allow to calculate per-unit values of currents, torque and speed, which can be converted into physical quantities with (7).
The per-unit peak torque in the base speed region can be calculated with:
The per-unit transition speed between the base speed region and the field-weakening speed region equals:
The per-unit torque in the field-weakening speed operation range can be expressed as a function of the per-unit speed as:
3.4. Comparison of the Results—Maximal Torque
The results of the maximal torque vs. speed calculations for both methods are shown in Figure 9 (all data for the non-linear model are marked with black and for the linearized model with gray).
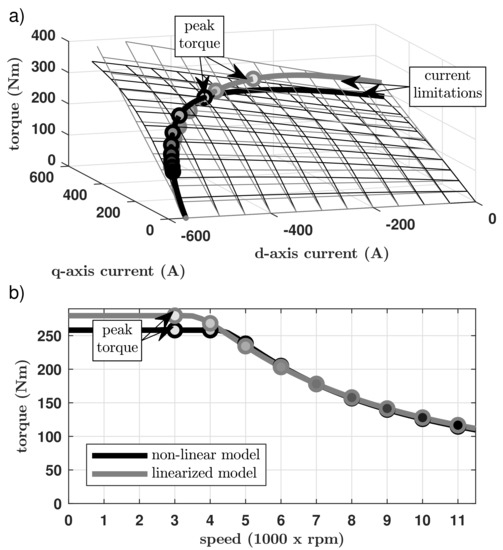
Figure 9.
Comparison of the maximal BMW i3 traction drive torque calculated with two different methods, i.e., the numerical search algorithm based on the non-linear machine model (black) and analytical equations based on the linearized machine model (gray): (a) torque surfaces, (b) torque vs. speed curves. The filled dots are the operation points for different speeds.
It can be seen that both torque surfaces diverge significantly from each other in the high q-axis current region (see Figure 9a). On the other hand, matching between the surfaces is relatively good in the low q-axis current region. It can be observed, that operation points in the field-weakening speed range (i.e., above ca. 4000 rpm) lie in this quasi linear region, hence the torque vs. speed curves obtained with the two methods match very well in this speed range (see Figure 9b). On the other hand, a vast part of the current limitation boundaries (solid quasi quarter-circular curves on the surfaces) lies in the saturated region of the torque surface (see Figure 9a). It is a well-known fact [6,7,8,9,10,11,12] that the peak torque operation point lies somewhere on this boundary and since both surfaces diverge significantly in this region, completely different peak torque operation points were identified with both methods. As a result, there is a relatively big difference in the peak torque value obtained with both models: 279.7 Nm with the linearized model vs. 258.2 Nm with the non-linear model.
3.5. Comparison of the Results—Partial Load Operation
Based on the above-mentioned findings, it is then interesting to obtain linearized model inaccuracy in calculating the torque value for partial load operation. For this reason, the torque vs. speed curves were calculated with both models once more, but this time for many different values of the maximal current. The results can be found in Figure 10b.
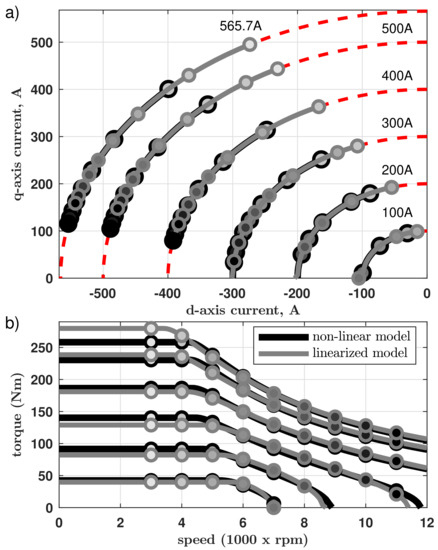
Figure 10.
Comparison of the partial load torque vs. speed calculations for the BMW i3 traction drive calculated with two different methods, i.e., the numerical search algorithm based on the non-linear machine model (black) and analytical equations based on the linearized machine model (gray): (a) current space-vector loci, (b) torque vs. speed curves. The consecutive curves were calculated for many different values of the current limitation.
It can be noticed that the differences between torque values calculated with both models in the base speed region are much bigger than in the field-weakening speed region. Hence, a more detailed analysis of this operational region is needed. The calculation results for this case are presented in Figure 11. The current space-vector loci for the peak torque calculated with different current limitation values are presented in Figure 11a. Again, the solid quasi quarter-circular curves on the surfaces indicate current limitation curves for different current values. A corresponding torque vs. phase current magnitude plot is shown in Figure 11b. The curves were calculated for values up to the 650 A (which is a 115% of the feasible operation range of this drive) for illustrative purposes. The blue filled dots indicate the actual maximal phase current limitation of the drive (i.e., 565.7 A).
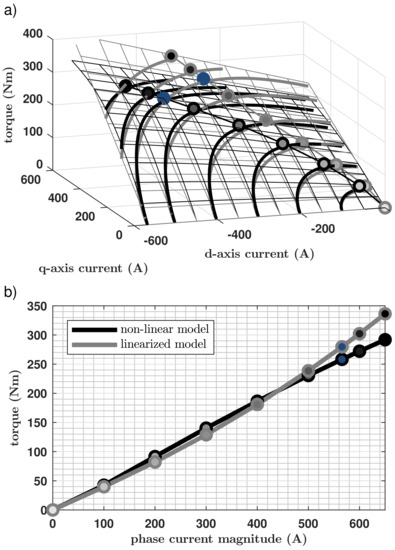
Figure 11.
Comparison of the partial load torque vs. current magnitude for the BMW i3 traction drive calculated with two different methods, i.e., a numerical search algorithm based on the non-linear machine model (black) and analytical equations based on the linearized machine model (gray): (a) operation points locus at torque surfaces, (b) torque vs. phase current magnitude. The filled dots are the operation points calculated for different phase current limitations. The points corresponding to the actual peak phase current of the drive (i.e., 565.7 A) are marked with blue.
4. Discussion
It can be identified that torque values in the field-weakening speed region match relatively well for both models. The current space-vector loci calculated with both methods follow exactly the same path in the -plane (see Figure 10a). These paths are current limitation circles for the consecutive maximal current values. This is going to be the case for every finite speed drive, as for this drive class, this path is predefined. It should be mentioned that these results can not be extended to the infinite speed drive class, because the current locus path for these drives during the MTPV operation is not predefined. It can be then expected that the results obtained with both models can diverge from each other much more, as in the case presented here.
There is also one more important observation, which should be pointed out clearly. Even though the torque vs. phase current magnitude curves for each model match relatively well with others in the partial load operation range, the corresponding current operation points in the -current plane are very different. It means that the linearized model is incapable of calculating proper current space-vector components for the maximal torque per current (MTPC) operation (see [6,10]).
In the authors’ opinion, the results obtained with the linearized model match surprisingly well these obtained with the non-linear one (it should be remembered that the analyzed example is an extreme case of a highly-saturated machine). These results are rather unexpected, as it seems to be common belief that the linearized model is not feasible for calculating the torque performance of highly-saturated machines. Even though peak torque for the actual maximal current was calculated with a 21.5 Nm (8%) error, torque values for the partial load and field-weakening operation are still relatively accurate.
Having some basic impression of the extent to which the magnetic circuit of the designed machine is going to be utilized (in terms of material magnetic saturation), some error margin can be assumed and the linearized model can be still successfully applied for the torque vs. speed curve estimation. It is important to emphasize that the conclusions drawn in this paper should be limited to the finite maximal speed drive class. Only for this class the current locus path during the field-weakening operation is predefined to go along the current limitation circle and this is probably the cause of such good performance of the linearized model in the field-weakening speed region.
5. Conclusions
Complex information about the BMW i3 traction machine has been provided, i.e., mechanical dimensions, winding layout information and material definition (see Table A1, Table A2, Table A3). The presented FEM model and its geometry are included in the Supplementary Materials. The FEM simulation results including spatial harmonics information are given too.
Torque and flux linkage values averaged over one electrical period are provided as well (see Table A4,Table A5, Table A6). These numerical values, together with data from Table 1 fully define the space-vector model of this drive during steady-state operation, which also takes into consideration non-linearity of the magnetic circuit. Along with the references [19,20,21], the reader is provided comprehensive information about a high-end industrial product, which can be used as a reference design during research studies.
It has been shown that the presented motor is an extreme example of a highly-saturated IPMSM. Based on the presented results, it can be concluded that to some extent the simplified linearized machine model can be successfully applied for the torque vs. speed curve estimation of a highly-saturated machine. Nevertheless, some proper error margin should be taken into consideration.
It seems obvious that using exact information about the magnetic circuit non-linearity is the correct way to obtain accurate results. Nevertheless, in the authors’ opinion, it was very valuable (from both practical point of view and out of pure scientific curiosity) to explore the magnitude of the inaccuracies obtained, when the linearized model is applied instead.
Supplementary Materials
The following are available online at https://www.mdpi.com/article/10.3390/en14092343/s1.
Author Contributions
Conceptualization, M.G.; methodology, M.G.; software, M.G.; validation, M.G.; formal analysis, M.G.; investigation, M.G.; resources, L.M.G.; data curation, M.G.; writing—original draft preparation, M.G.; writing—review and editing, L.M.G.; visualization, M.G.; supervision, L.M.G.; project administration, L.M.G.; funding acquisition, L.M.G. All authors have read and agreed to the published version of the manuscript.
Funding
This research received no external funding.
Institutional Review Board Statement
Not applicable.
Informed Consent Statement
Not applicable.
Data Availability Statement
The data presented in this study are available partly in article and partly in Supplementary Material.
Conflicts of Interest
The authors declare no conflict of interest.
Abbreviations
The following abbreviations are used in this manuscript:
| FEM | Finite Element Method |
| IPMSM | Interior Permanent Magnet Synchronous Machine |
| MTPC | Maximal Torque Per Current |
| MTPV | Maximal Torque Per Voltage |
| ORNL | Oak Ridge National Laboratory |
| PMSM | Permanent Magnet Synchronous Machine |
Appendix A. BMW i3 Traction Machine Data and FEM Simulation Results

Table A1.
Mechanical dimensions of the machine.
Table A1.
Mechanical dimensions of the machine.
| Parameter Name | Value | Unit |
|---|---|---|
| overall motor assembly mass | 42 | kg |
| outer housing mass (incl. one bearing) | 6.9 | kg |
| stator mass | 20.8 | kg |
| rotor mass | 14.2 | kg |
| stator outer diameter | 242.1 | mm |
| stator inner diameter | 180.0 | mm |
| rotor outer diameter | 178.6 | mm |
| rotor inner diameter | 130.3 | mm |
| shaft diameter | 60.0 | mm |
| stack length | 132.3 | mm |
| tooth width | 5.0 | mm |
| slot opening | 1.7 | mm |
| slot depth | 22.0 | mm |

Table A2.
Parameters of the machine winding.
Table A2.
Parameters of the machine winding.
| Parameter Name | Value | Unit |
|---|---|---|
| number of slots | 72 | - |
| number of pole pairs | 6 | - |
| stator turns per coil | 9 | - |
| number of wires “in hand” | 12 | strands/turn |
| wire size | 21 | AWG |
| slot fill factor | 54.43 | % |
| parallel circuits per phase | 6 one neutral/phase | |
| coils in series per phase | 1 per leg | |
| winding notes | full pitch, concentrically wound | |
| 6 independent neutrals | ||

Table A3.
Materials used in various machine parts.
Table A3.
Materials used in various machine parts.
| Machine Part | Material |
|---|---|
| stator core | magnetic steel: M-19 29 Ga |
| stator coil | copper: 100% IACS |
| stator liner | epoxy resin |
| rotor core | magnetic steel: M-19 29 Ga |
| rotor magnet | neodymium iron boron: 38/23 |
| rotor sleeve | stainless steel: 304 |
| shaft | cold rolled steel: CR10 |
| hub | non-magnetic |

Table A4.
Flux linkage in the d-axis calculated with the FEM model (mWb) (values averaged over one electrical period).
Table A4.
Flux linkage in the d-axis calculated with the FEM model (mWb) (values averaged over one electrical period).
| q-axis Current (A) | ||||||||
|---|---|---|---|---|---|---|---|---|
| 0 | 100 | 200 | 300 | 400 | 500 | 600 | ||
| ine d-axis current (A) | −600 | 1.0 | 1.3 | 2.0 | 2.7 | 3.2 | 3.4 | 3.6 |
| −500 | 7.7 | 8.0 | 8.6 | 9.0 | 9.1 | 9.0 | 8.8 | |
| −400 | 14.5 | 14.8 | 15.3 | 15.4 | 15.1 | 14.6 | 14.1 | |
| −300 | 21.5 | 21.8 | 22.3 | 22.2 | 21.3 | 20.3 | 19.4 | |
| −200 | 28.6 | 29.0 | 29.5 | 29.0 | 27.6 | 26.0 | 24.6 | |
| −100 | 35.9 | 36.5 | 37.0 | 35.6 | 33.6 | 31.5 | 29.8 | |
| 0 | 43.6 | 44.4 | 44.0 | 41.5 | 39.0 | 36.6 | 34.5 | |

Table A5.
Flux linkage in the q-axis calculated with the FEM model (mWb) (values averaged over one electrical period).
Table A5.
Flux linkage in the q-axis calculated with the FEM model (mWb) (values averaged over one electrical period).
| q-axis Current (A) | ||||||||
|---|---|---|---|---|---|---|---|---|
| 0 | 100 | 200 | 300 | 400 | 500 | 600 | ||
| ine d-axis current (A) | −600 | 0.0 | 18.8 | 35.2 | 47.4 | 55.4 | 60.0 | 62.7 |
| −500 | 0.0 | 19.8 | 36.8 | 48.9 | 56.3 | 60.3 | 62.8 | |
| −400 | 0.0 | 20.8 | 38.2 | 49.9 | 56.6 | 60.2 | 62.5 | |
| −300 | 0.0 | 21.8 | 39.4 | 50.2 | 56.3 | 59.6 | 61.8 | |
| −200 | 0.0 | 22.8 | 40.3 | 49.9 | 55.2 | 58.5 | 60.8 | |
| −100 | 0.0 | 23.9 | 40.8 | 48.9 | 53.4 | 56.9 | 59.3 | |
| 0 | 0.0 | 24.9 | 40.1 | 46.7 | 51.3 | 54.8 | 57.6 | |

Table A6.
Machine torque calculated with the FEM model (Nm) (values averaged over one electrical period).
Table A6.
Machine torque calculated with the FEM model (Nm) (values averaged over one electrical period).
| q-axis Current (A) | ||||||||
|---|---|---|---|---|---|---|---|---|
| 0 | 100 | 200 | 300 | 400 | 500 | 600 | ||
| ine d-axis current (A) | −600 | −1.4 | 100.6 | 190.2 | 259.5 | 307.8 | 337.7 | 357.1 |
| −500 | −1.1 | 94.2 | 177.7 | 241.0 | 283.8 | 310.5 | 329.5 | |
| −400 | −0.9 | 86.3 | 162.1 | 218.6 | 256.3 | 281.3 | 300.3 | |
| −300 | −0.6 | 76.8 | 144.1 | 193.3 | 227.0 | 251.2 | 270.9 | |
| −200 | −0.3 | 65.9 | 123.9 | 166.6 | 197.3 | 221.4 | 241.8 | |
| −100 | −0.1 | 53.7 | 101.9 | 138.8 | 167.9 | 192.3 | 213.4 | |
| 0 | 0.0 | 39.7 | 78.1 | 110.9 | 139.4 | 164.0 | 185.7 | |

Table A7.
Machine torque ripple (peak-to-peak) calculated with the FEM model (Nm).
Table A7.
Machine torque ripple (peak-to-peak) calculated with the FEM model (Nm).
| q-axis Current (A) | ||||||||
|---|---|---|---|---|---|---|---|---|
| 0 | 100 | 200 | 300 | 400 | 500 | 600 | ||
| ine d-axis current (A) | −600 | 21.06 | 21.62 | 21.49 | 22.51 | 21.69 | 18.63 | 19.99 |
| −500 | 18.53 | 18.94 | 16.86 | 16.89 | 16.93 | 14.06 | 16.55 | |
| −400 | 15.90 | 16.15 | 13.83 | 12.84 | 12.50 | 10.27 | 15.28 | |
| −300 | 12.30 | 12.71 | 12.56 | 12.01 | 11.99 | 11.36 | 16.45 | |
| −200 | 8.56 | 9.17 | 10.22 | 11.61 | 10.86 | 10.19 | 13.83 | |
| −100 | 5.02 | 5.74 | 8.03 | 10.37 | 10.35 | 11.08 | 12.12 | |
| 0 | 2.16 | 3.66 | 6.77 | 9.39 | 11.18 | 12.23 | 13.79 | |
References
- Lovelace, E.C.F. Optimization of a Magnetically Saturable Interior Permanent-Magnet Synchronous Machine Drive. Ph.D. Thesis, Massachusetts Institute of Technology, Cambridge, MA, USA, 2000. Available online: http://pdfs.semanticscholar.org/c9ca/8d246d4e2e2c3effd05c1d832c78223fcfa9.pdf?_ga=2.137131315.2073111183.1580043790-153552457.1580043790 (accessed on 10 March 2021).
- Grunditz, E.A. Design and Assessment of Battery Electric Vehicle Powertrain, with Respect to Performance, Energy Consumption and Electric Motor Thermal Capability. Ph.D. Thesis, Chalmers University of Technology, Goteborg, Sweden, 2016. Available online: http://www.chalmers.se/SiteCollectionDocuments/Energi%20och%20milj%C3%B6/Elteknik/EmmaGrunditz_PhDthesis_lowrez.pdf (accessed on 10 March 2021).
- Finken, T.; Hombitzer, M.; Hameyer, K. Study and comparison of several permanent-magnet excited rotor types regarding their applicability in electric vehicles. In Proceedings of the 2010 Emobility—Electrical Power Train, Leipzig, Germany, 8–9 November 2010; pp. 1–7. [Google Scholar]
- Cavagnino, A.; Bramerdorfer, G.; Tapia, J.A. Optimization of electric machine designs—Part I. IEEE Trans. Ind. Electron. 2017, 64, 9716–9720. [Google Scholar] [CrossRef]
- Cavagnino, A.; Bramerdorfer, G.; Tapia, J.A. Optimization of electric machine designs—Part II. IEEE Trans. Ind. Electron. 2017, 65, 1700–1703. [Google Scholar] [CrossRef]
- Gierczynski, M.; Grzesiak, L. Per Unit Approach Based Assessment of Torque Production Capability of PMSMs Operating in the Field Weakening Region. In Proceedings of the 2019 Fourteenth International Conference on Ecological Vehicles and Renewable Energies (EVER), Monte-Carlo, Monaco, 8–10 May 2019; pp. 1–15. [Google Scholar]
- Schiferl, R.F.; Lipo, T.A. Power capability of salient pole permanent magnet synchronous motors in variable speed drive applications. IEEE Trans. Ind Appl. 1990, 26, 115–123. [Google Scholar] [CrossRef]
- Morimoto, S.; Takeda, Y.; Hirasa, T.; Taniguchi, K. Expansion of operating limits for permanent magnet motor by current vector control considering inverter capacity. IEEE Trans. Ind Appl. 1990, 26, 866–871. [Google Scholar] [CrossRef]
- Adnanes, A.K.; Undeland, T.M. Optimum torque performance in PMSM drives above rated speed. In Proceedings of the Conference Record of the 1991 IEEE Industry Applications Society Annual Meeting, Dearborn, MI, USA, 28 September–4 October 1991; pp. 169–175. [Google Scholar]
- Soong, W.L. Design and Modelling of Axially-Laminated Interior Permanent Magnet Motor Drives for Field-Weakening Applications. Ph.D. Thesis, University of Glasgow, Glasgow, Scotland, 1993. Available online: http://theses.gla.ac.uk/75707/1/13818424.pdf (accessed on 10 March 2021).
- Soong, W.L.; Miller, T.J.E. Theoretical limitations to the field-weakening performance of the five classes of brushless synchronous AC motor drive. In Proceedings of the 1993 Sixth International Conference on Electrical Machines and Drives, Oxford, UK, 8–10 September 1993; pp. 127–132. [Google Scholar]
- Jahns, T.M. Component Rating Requirements for Wide Constant Power Operation of Interior PM Synchronous Machine Drives. In Proceedings of the Conference Record of the 2000 IEEE Industry Applications Conference, Rome, Italy, 8–12 October 2000; pp. 1697–1704. [Google Scholar]
- Morimoto, S.; Sanada, M.; Takeda, Y.; Taniguchi, K. Optimum machine parameters and design of inverter-driven synchronous motors for wide constant power operation. In Proceedings of the 1994 IEEE Industry Applications Society Annual Meeting, Denver, CO, USA, 2–5 October 1997; pp. 177–182. [Google Scholar]
- Bianchi, N.; Bolognani, S.; Chalmers, B.J. Salient-rotor PM synchronous motors for an extended flux-weakening operation range. IEEE Trans. Ind Appl. 2000, 36, 1118–1125. [Google Scholar] [CrossRef]
- Soong, W.L.; Reddy, P.B.; El-Refaie, A.M.; Jahns, T.M.; Ertugrul, N. Surface PM Machine Parameter Selection for Wide Field-Weakening Applications. In Proceedings of the 2007 IEEE Industry Applications Annual Meeting, New Orleans, LA, USA, 23–27 September 2007; pp. 882–889. [Google Scholar]
- Jahns, T.M.; Caliskan, V. Uncontrolled generator operation of interior PM synchronous machines following high-speed inverter shutdown. IEEE Trans. Ind Appl. 1999, 35, 1347–1357. [Google Scholar] [CrossRef]
- Asef, P.; Bargallo, R.; Lapthorn, A.; Tavernini, D.; Shao, L.; Sorniotti, A. Assessment of the Energy Consumption and Drivability Performance of an IPMSM-Driven Electric Vehicle Using Different Buried Magnet Arrangements. Energies 2021, 14, 1418. [Google Scholar] [CrossRef]
- Richter, J. Permanentmagneterregte Synchronmaschine. In Modellbildung, Parameteridentifikation und Regelung Hoch Ausgenutzter Synchronmaschinen; KIT Scientific Publishing: Karlsruhe, Germany, 2016; pp. 10–29. Available online: https://publikationen.bibliothek.kit.edu/1000057097 (accessed on 10 March 2021).
- Oak Ridge National Laboratory, FY 2016 Annual Progress Report for Electric Drive Technologies Program July 2017. Available online: http://www.energy.gov/sites/prod/files/2017/08/f36/FY16%20EDT%20Annual%20Report_FINAL.pdf (accessed on 10 March 2021).
- Hendershot, J. Connect tutorial E-Car Project Insight: BMW i3 Electric Traction Drive—YouTube. Available online: http://www.youtube.com/watch?v=xt-nfcwv6Kc (accessed on 10 March 2021).
- Merwerth, J.; BMW Group. The hybrid-synchronous machine of the new BMW i3 & i8. Available online: http://hybridfordonscentrum.se/wp-content/uploads/2014/05/20140404_BMW.pdf (accessed on 10 March 2021).
- Li, Y.; Yang, H.; Lin, H.; Fang, S.; Wang, W. A Novel Magnet-Axis-Shifted Hybrid Permanent Magnet Machine for Electric Vehicle Applications. Energies 2019, 12, 641. [Google Scholar] [CrossRef]
- Chalmers, B.J.; Musaba, L.; Gosden, D.F. Variable-frequency synchronous motor drives for electric vehicles. IEEE Trans. Ind Appl. 1996, 32, 896–903. [Google Scholar] [CrossRef]
- Jolly, L.; Jabbar, M.A.; Qinghua, L. Optimization of the constant power speed range of a saturated permanent-magnet synchronous motor. IEEE Trans. Ind Appl. 2006, 42, 1024–1030. [Google Scholar] [CrossRef]
- Legranger, J.; Friedrich, G.; Vivier, S.; Mipo, J.C. Combination of Finite-Element and Analytical Models in the Optimal Multidomain Design of Machines: Application to an Interior Permanent-Magnet Starter Generator. IEEE Trans. Ind Appl. 2010, 46, 232–239. [Google Scholar] [CrossRef]
- Wang, F.; Chang, C.; Liu, B. Analysis of PMSM control performance based on the mathematical model and saturated parameters. In Proceedings of the 2014 IEEE Conference and Expo Transportation Electrification Asia-Pacific (ITEC Asia-Pacific), Beijing, China, 31 August–3 September 2014; pp. 1–5. [Google Scholar]
- Decker, S.; Brodatzki, M.; Bachowsky, B.; Schmitz-Rode, B.; Liske, A.; Braun, M.; Hiller, M. Predictive Trajectory Control with Online MTPA Calculation and Minimization of the Inner Torque Ripple for Permanent-Magnet Synchronous Machines. Energies 2020, 13, 5327. [Google Scholar] [CrossRef]
- Gemassmer, T. Effiziente und Dynamische Drehmomenteinpraegung in Hoch Ausgenutzten Synchronmaschinen mit Eingebetteten Magneten. Ph.D. Thesis, Karlsruhe Institute of Technology, Karlsruhe, Germany, 2015. Available online: https://publikationen.bibliothek.kit.edu/1000046666 (accessed on 16 April 2021).
- Dutta, R.; Chong, L.; Rahman, M.F. Analysis of CPSR in motoring and generating modes of an IPM motor. In Proceedings of the 2011 IEEE International Electric Machines & Drives Conference (IEMDC), Niagara Falls, ON, Canada, 14–17 May 2011; pp. 1474–1479. [Google Scholar]
- Ansys Maxwell: Low Frequency Electromagnetic Field Simulation. Available online: http://www.ansys.com/products/electronics/ansys-maxwell (accessed on 10 March 2021).
- Selected Magnetic Steel Data—Power Magnetic Devices—Wiley Online Library. Available online: http://onlinelibrary.wiley.com/doi/pdf/10.1002/9781118824603.app3 (accessed on 10 March 2021).
- Neodymium Iron Boron Magnets Datasheet. Available online: http://www.eclipsemagnetics.com/site/assets/files/2418/ndfeb_neodymium_iron_boron-standard_ndfeb_range_datasheet_rev1.pdf (accessed on 10 March 2021).
- MATLAB. Available online: http://www.mathworks.com/products/matlab.html (accessed on 10 March 2021).
Publisher’s Note: MDPI stays neutral with regard to jurisdictional claims in published maps and institutional affiliations. |
© 2021 by the authors. Licensee MDPI, Basel, Switzerland. This article is an open access article distributed under the terms and conditions of the Creative Commons Attribution (CC BY) license (https://creativecommons.org/licenses/by/4.0/).