Article

Analysis of NVH Behavior of Synchronous Reluctance Machine for EV Applications

1
Faculty of Electrical and Computer Engineering, Cracow University of Technology, Warszawska 24 Str., 31-155 Cracow, Poland
2
Bosch Romania, 400158 Cluj-Napoca, Romania
3
Faculty of Electrical Engineering, Technical University of Cluj-Napoca, Str. Memorandumului nr. 28, 400114 Cluj-Napoca, Romania
*
Authors to whom correspondence should be addressed.
Energies 2022, 15(8), 2785; https://doi.org/10.3390/en15082785
Submission received: 19 December 2021 / Revised: 7 March 2022 / Accepted: 30 March 2022 / Published: 11 April 2022

Abstract

:
In this paper, an analysis of noise and vibration of a synchronous reluctance machine for EV applications is performed. The analyzed machine was designed for electric vehicle application. The noise and vibration of a synchronous reluctance machine were first estimated during simulations; next, the obtained results were validated during laboratory tests. The analyzed model of the machine was simplified and included only stator core as it was assumed to be the main source of the machine vibration and generated noise. To simulate the noise and vibration of the machine, multiphysics modeling of the machine was performed. Laboratory tests proved the correctness of performed simulations. The obtained results allowed us to investigate the influence of the machine’s operating point on the generated noise and vibration. The frequency of the magnetic radial forces were proven to be the dominant factor in noise generation. The influence of the load and current angle on the machine’s noise and vibration was proven to be negligible. It was also proven that considering only the stator structure in numerical analysis of the noise and vibration of the machine leads to valuable results.

1. Introduction

Reluctance machines are becoming very popular nowadays due to their advantages such as low cost and a simple construction which does not require any external excitation source. Power electronics development makes it possible for the reluctance machines to be used in drive systems in many industry applications. This makes them of great interest nowadays [1]. Currently, reluctance motors can be divided into four types: those with a salient poles rotor, a rotor with circumferential segments, a rotor with magnetic barriers and magnetically anisotropy laminations-consisting rotors [2]. Each of these types has its advantages and disadvantages such as efficiency, power factor or cost. A synchronous reluctance machine (SynRM) is another type of variable reluctance machine whose stator geometry is based on a cylindrical structure. The stator of a synchronous reluctance motor is identical to that of an induction motor and only the rotor has salient poles [3]. The rotor does not require any cage or field winding, making it potentially less expensive than a permanent magnet motor or an induction motor [4]. The most common types of reluctance motors are the simple salient pole, the transversally and the axially laminated rotor [5]. Conventional SynRMs have simple rotor geometry but unfortunately this significantly lowers their performance due to a quite low ratio between the direct and quadrature inductances. The axially laminated rotors have a higher saliency ratio values and performance, but on the other hand eddy current losses are large. This is caused by the fact that the laminations are placed perpendicularly to the magnetic field lines and the magnetic field penetrates a very big surface of steel sheet. In practice, transversally laminated rotor topology is the optimal choice for industrial manufacturing [6,7]. Moreover, the transverse-laminated rotor structure can be easily skewed, which allows the torque ripple to decrease. The transversally laminated SynRM design can be further optimized by proper design and distribution of flux barriers in the rotor [8,9]. The shape of flux barriers and the combination of stator slots and flux barriers number also has an impact on the machine’s performance [10,11].
The SynRM often operates at very high rotational speeds. This generates very high stress in the material, which can damage the rotor. Additionally, high rotational speeds combined with magnetic field harmonics can cause the structure to vibrate at a resonance frequency. These phenomena should be minimized. For this reason, the ability to predict vibroacoustic behavior of the machine is very important in the design process. Estimation of electric machines’ noise and vibration and their optimization [12] is a significant step in the design process of an electric machine especially for EV applications.
The authors of [13] investigated a white noise which radiated from the powertrain and built models of the stator and bearing to simulate the radiated noise. The author of [14] described various sources of the electric machines noise and means of its reduction. Numerical computation of the acoustic noise of electric machines was presented in [15]. Simulation of noise and vibration of electric machines was also investigated in [16,17,18]. In [19] the authors performed noise, vibration and harshness (NVH) modeling of servo and traction drives.
NVH behavior of electric machine is crucial in EV applications since the noise and vibration contribute significantly to the overall sound quality in the passenger compartment and outside the vehicle. Due to that fact, the analysis of noise and vibration of electric machine used in EV application is very important. In [20] the authors made an analysis of noise and vibration of a switched reluctance machine (SRM) for EV application. Because the noise and vibration is a serious issue, NVH analysis is carried out not only for standalone electric machines but also for the entire powertrain or vehicle. In [21] the authors presented an integrated approach to NVH analysis in electric vehicle drivetrains. Noise reduction is a significant step in design process of electric drives for EV applications. Such a process of noise reduction of SRM was presented in [22,23].
In this paper, the noise and vibration of the synchronous reluctance machine is investigated. The vibration of the machine caused by electromagnetic forces was simulated using FEM structural analysis. The results obtained from the simulation were validated during laboratory tests. In the simulations, only the stator of the machine was considered because the deformation of the stator core was assumed to be the main source of noise and vibration of the machine. The torque ripple was not considered during the tests since it was proven in [24] that the noise is caused by radial forces and there is little relation between torque ripple and noise generated by the machine.
The first part contains a general introduction and analysis of reluctance machine applications in electric vehicles and related NVH issues.
The second part contains general information about the noise and vibration of the machine and presents results of modal analysis and NVH simulation of the synchronous reluctance machine.
The third part contains a description of laboratory tests, design data of examined machine and analysis of the results obtained from simulation and laboratory tests.

2. Noise and Vibration in Synchronous Reluctance Machine

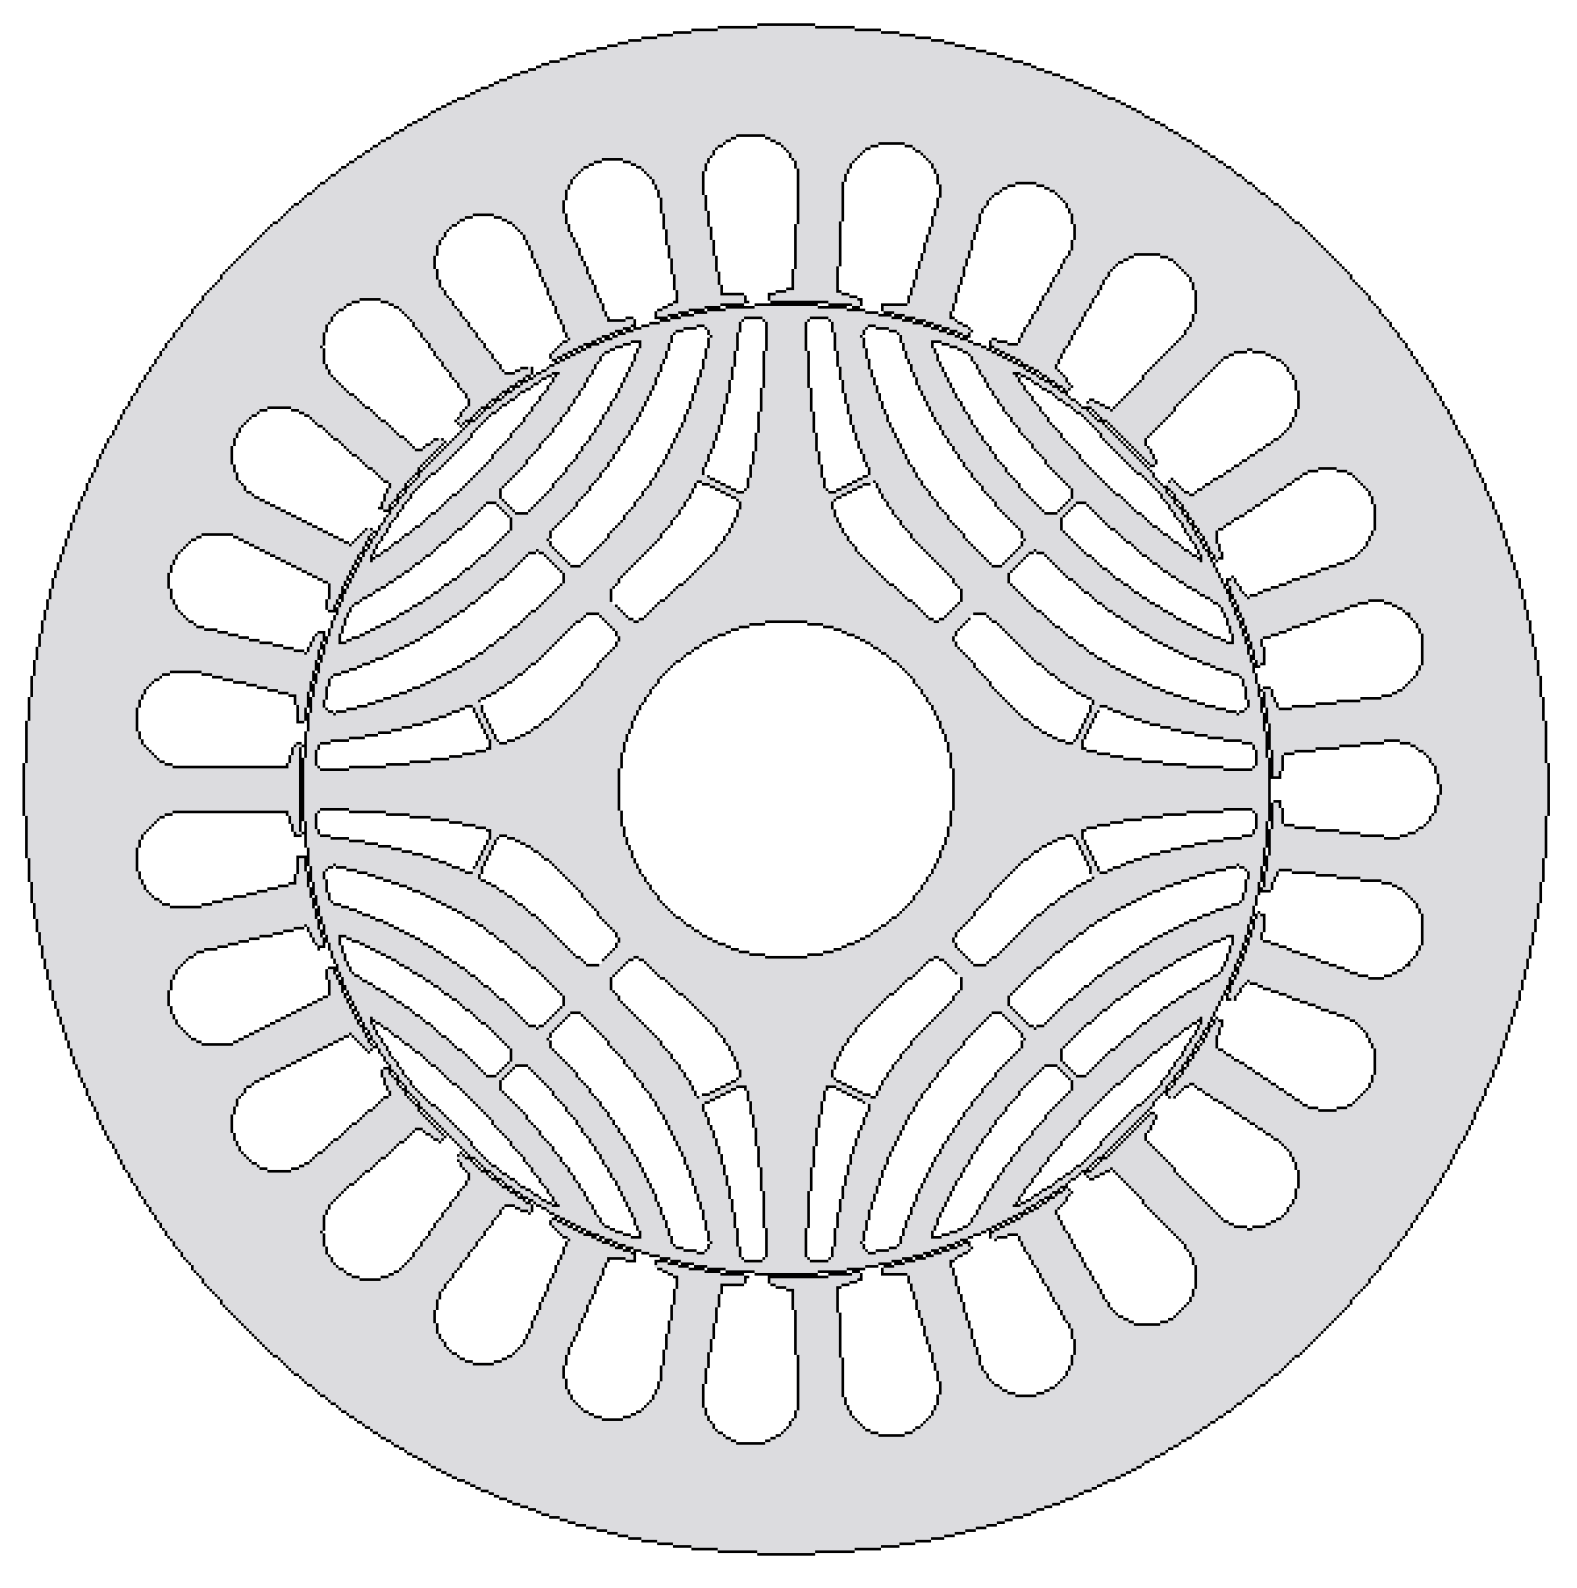
2.1. General Information
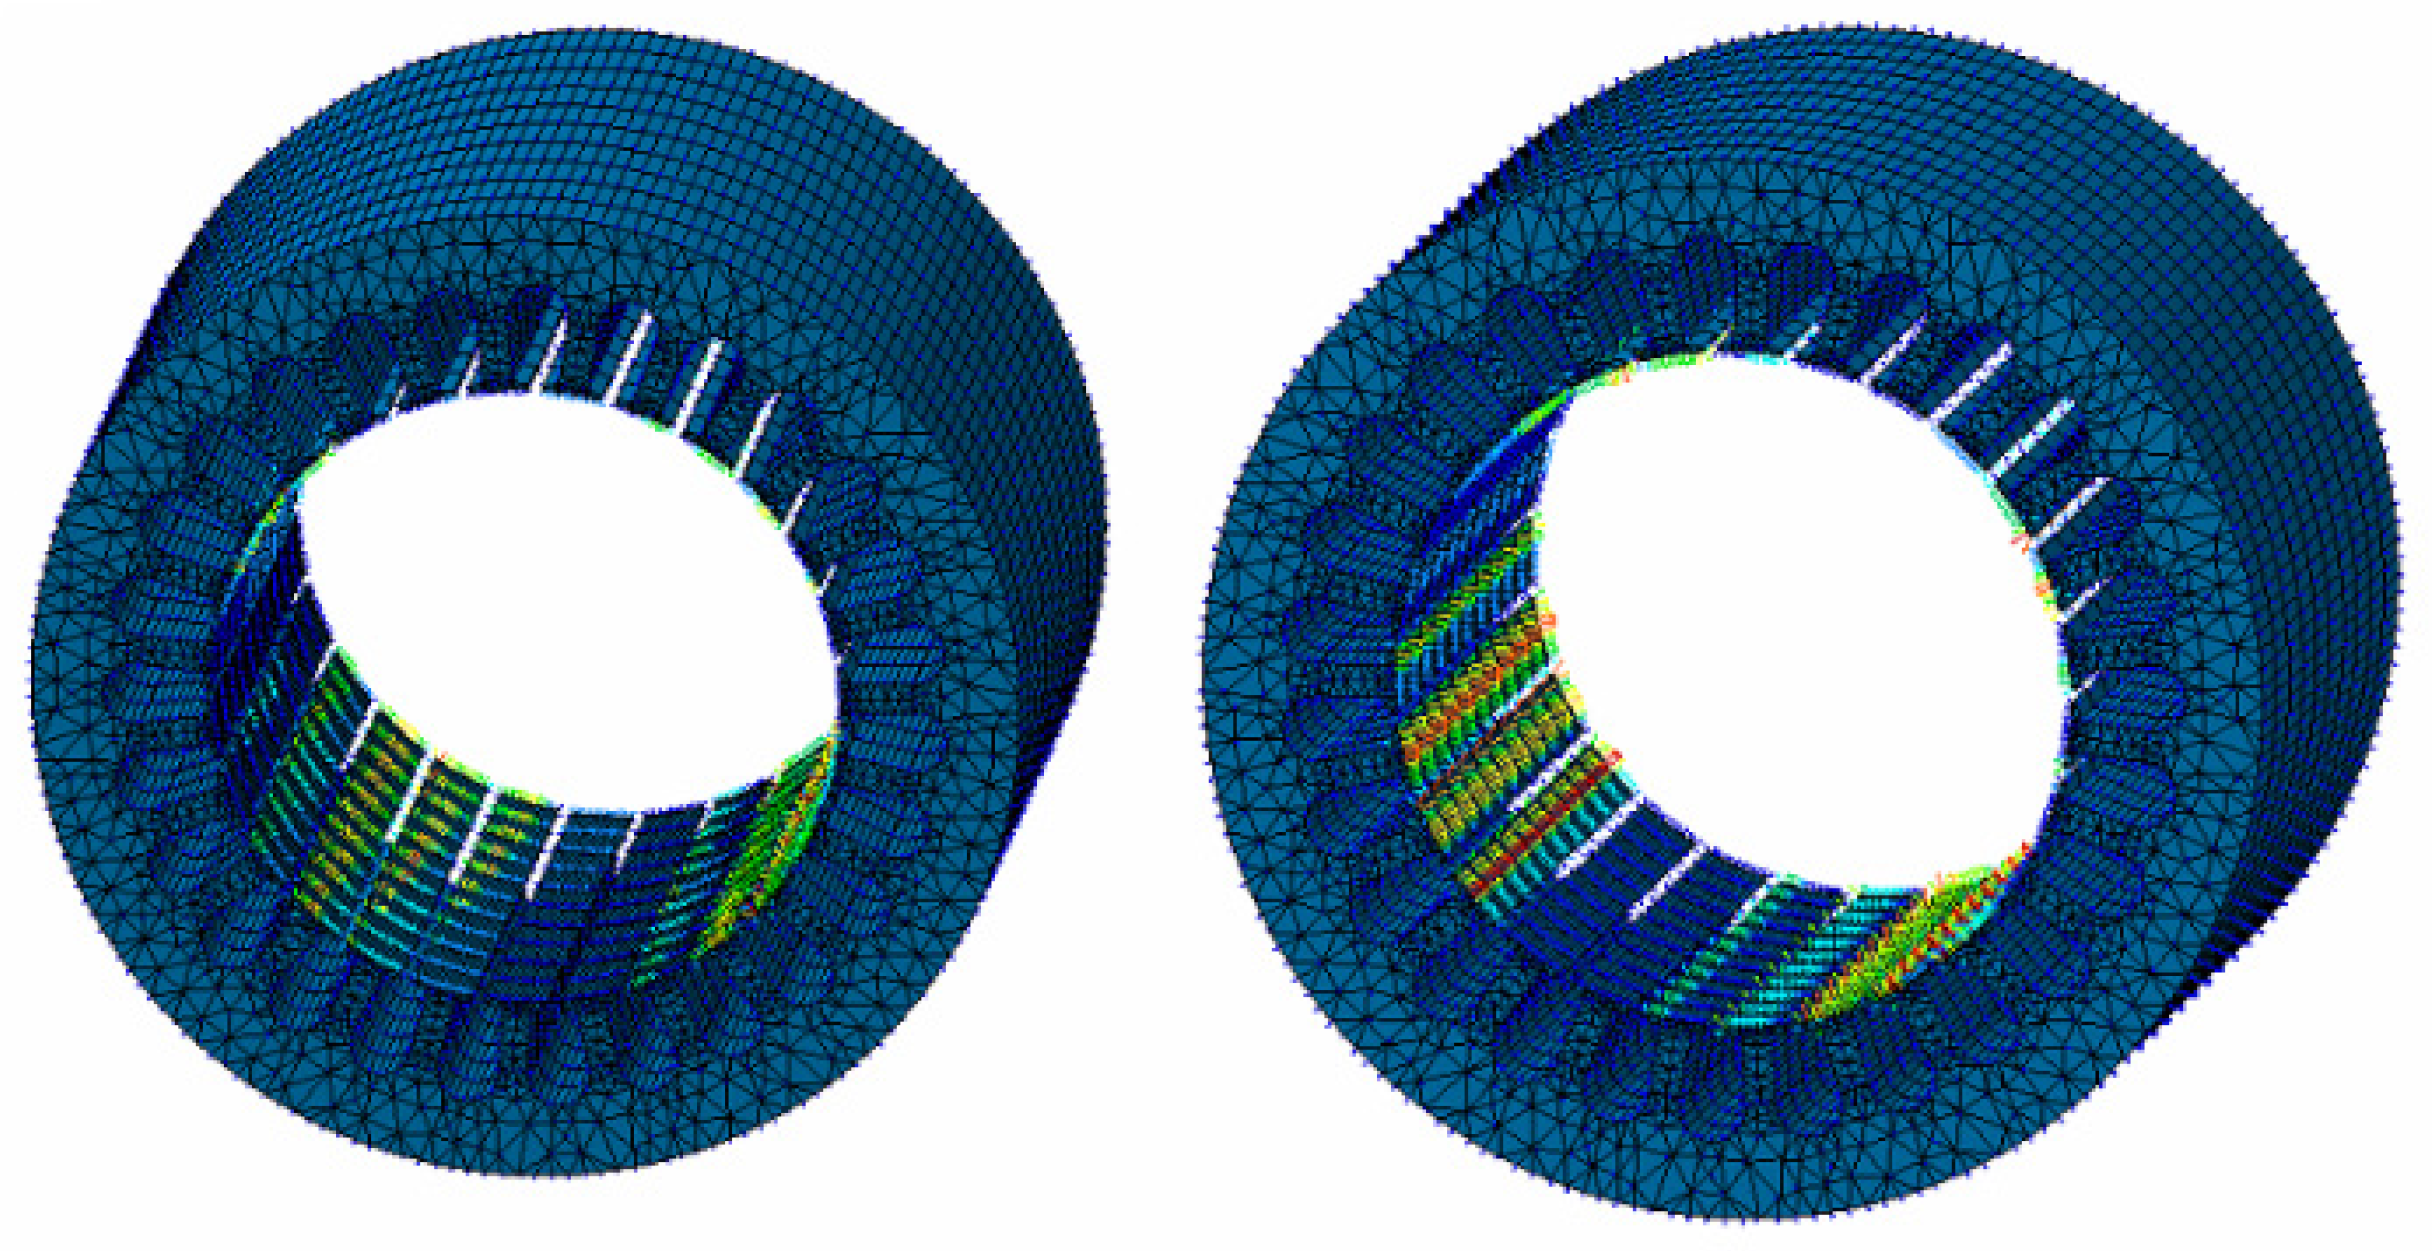
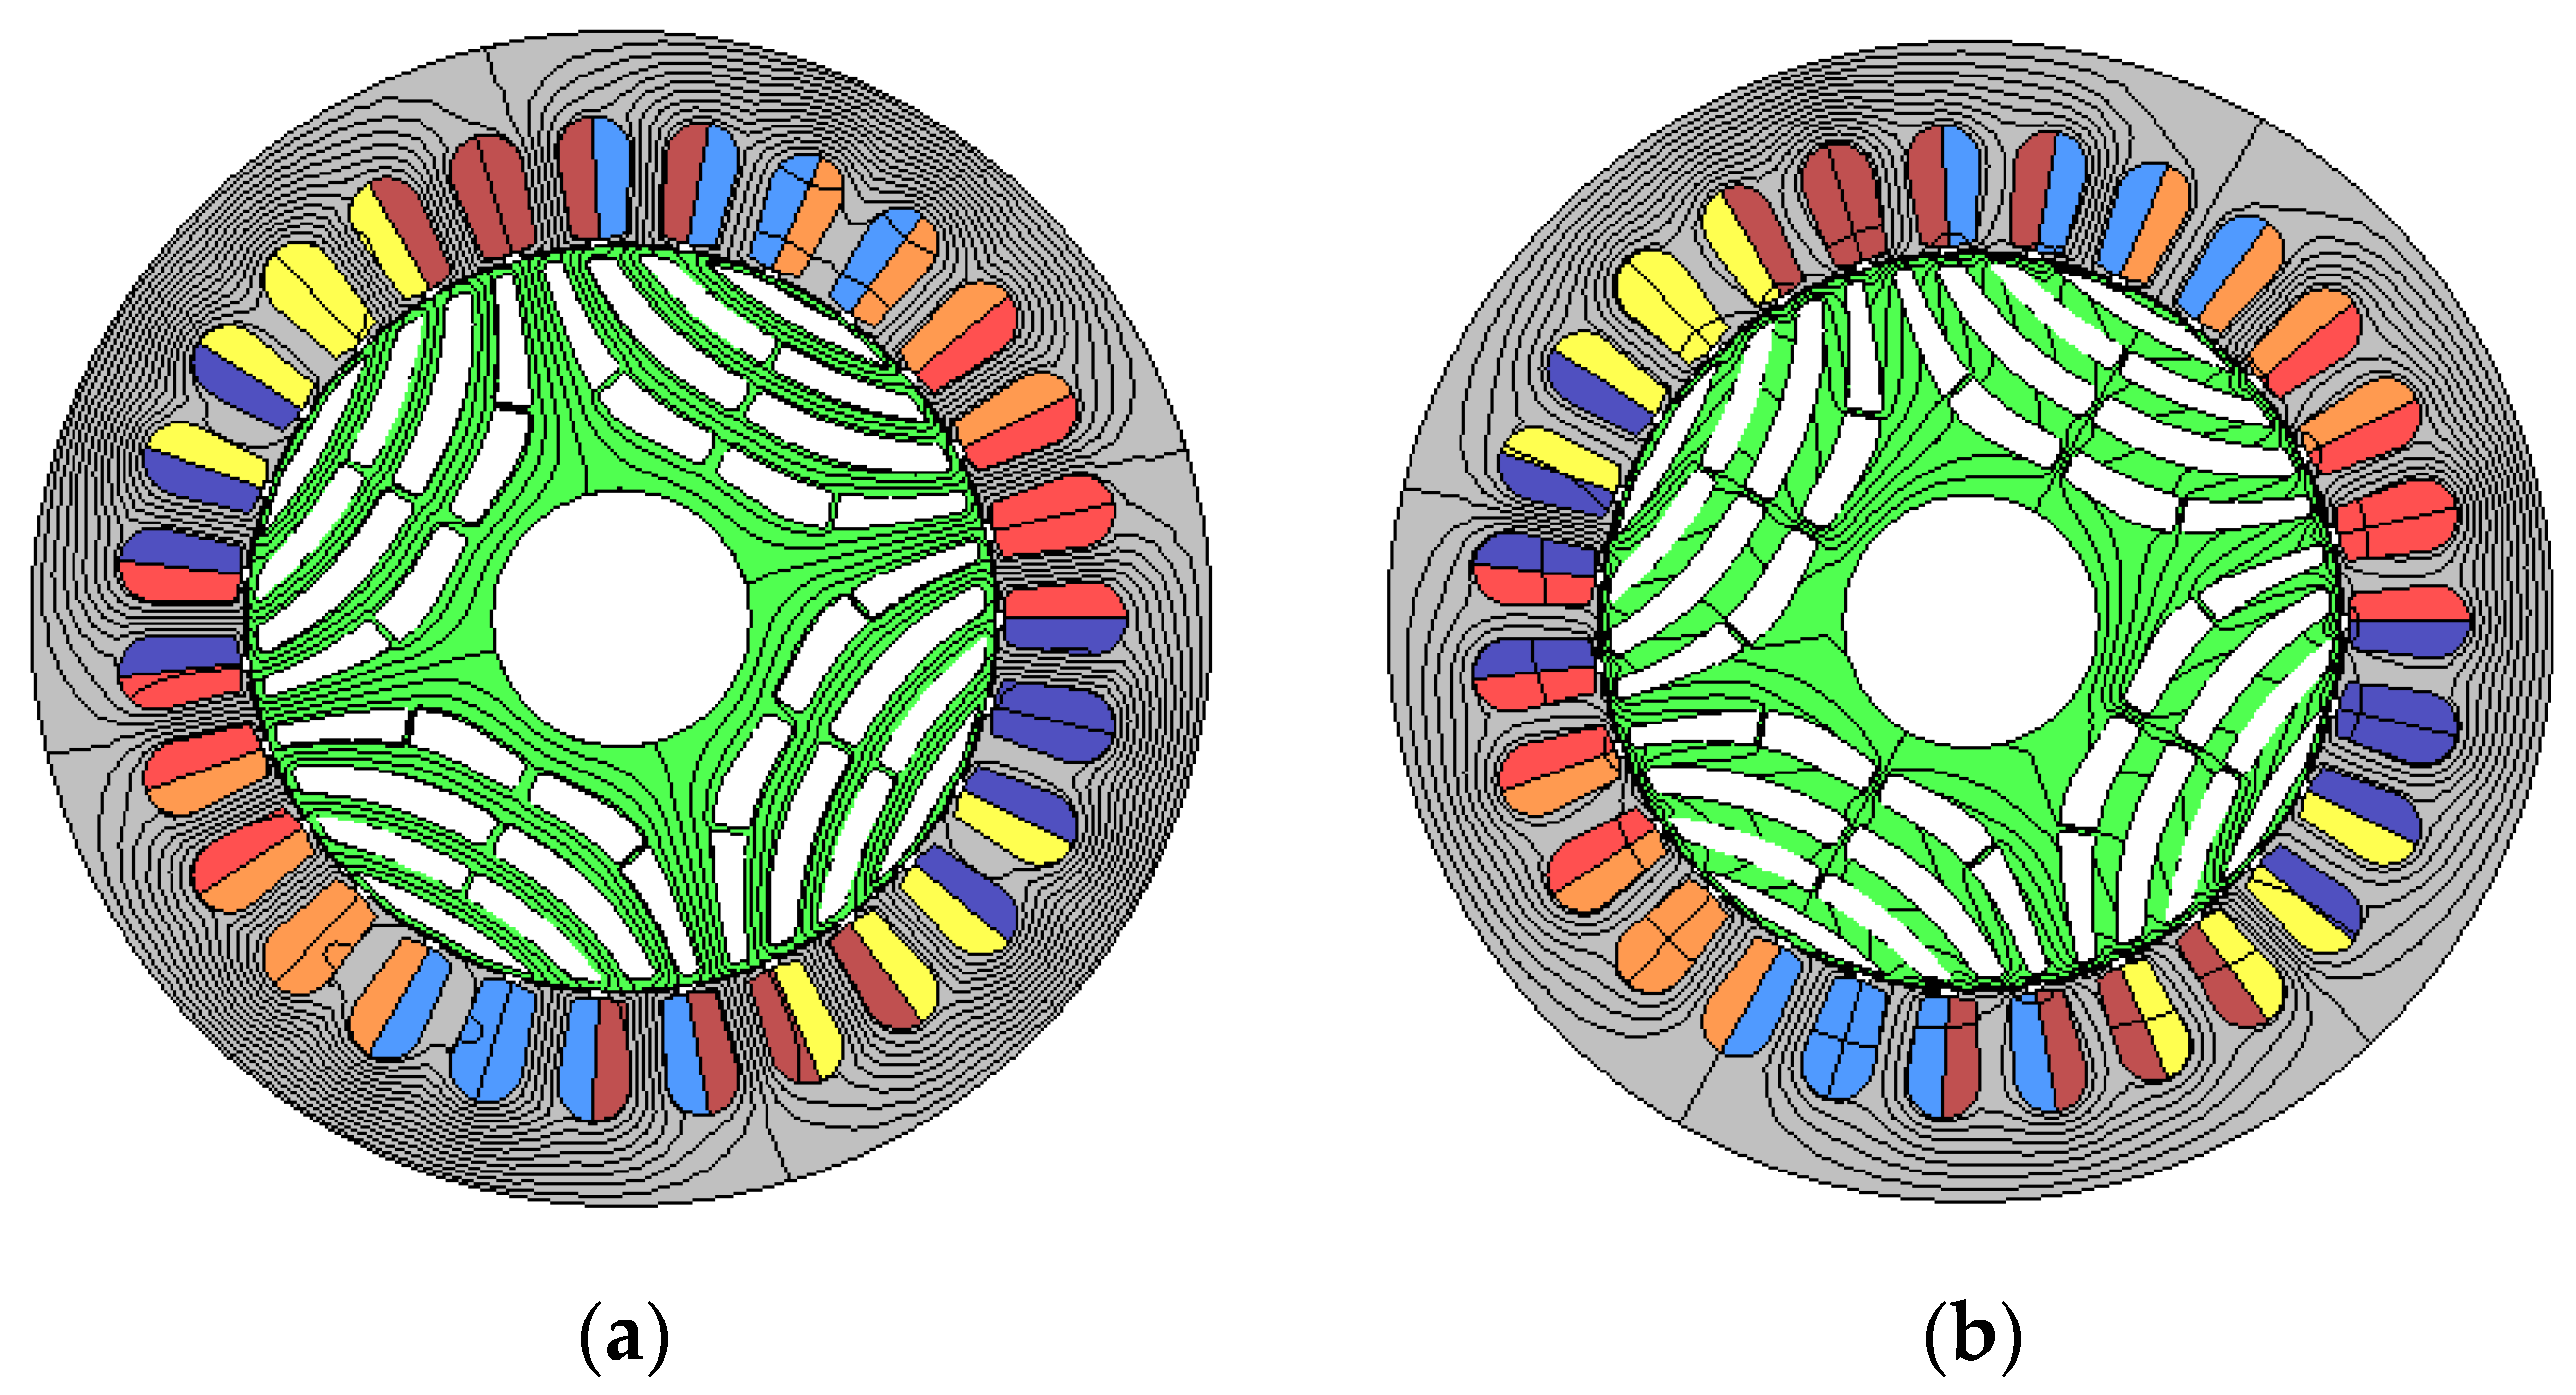
The noise generated by the machine is mainly caused by the radial forces acting on the stator. These forces are responsible for deformation of the entire structure of the machine, which leads to vibration of the machine and noise generation. The noise and vibration of the machine was estimated using modal analysis of the stator core of the machine [25,26]. We can assume that the noise generated by the machine comes from deformation of the stator structure. The housing of the machine has direct contact with the surrounding air and when the stator deforms the housing is also deformed, which causes the surrounding air particles to move, and a sound waveform is generated. Considering only the stator core in the simulation is quite a big simplification because the presence of the winding and the machine’s housing has an impact on the natural frequencies of the entire machine. Moreover, the mounting of the machine also affects the vibration of the structure. However, the results of simulations and laboratory tests proved that even using a simplified model during numerical analysis of the machine, it is possible to obtain accurate results.

2.2. NVH Simulation

The modal analysis of the stator was performed in VirtualLab® software using a finite element method. Only the stator core was investigated, thus the influence of the winding and the housing was omitted. Modal analysis allowed us to obtain resonance frequencies and corresponding normal modes of the structure. With this information it was possible to estimate the noise and vibration of the machine operating in various states.
Several normal modes of the stator are presented in Figure 1.
Each normal mode of the structure has a corresponding resonance frequency at which it occurs, and a corresponding deformation pattern [27]. Every solid body has an infinite number of normal modes and resonance frequencies, but the higher the resonance frequency the lower the impact of the normal mode since it is hard to excite the structure to vibrate at very high frequency. When the resonance frequencies and the normal modes of the stator structure were calculated, it was possible to simulate the NVH behavior of the machine in various operating states. Since the stator vibration is caused by the radial magnetic forces caused by the magnetic field in the machine, it was necessary to calculate the distribution of radial forces in the stator. Only the radial forces acting on the inner surface of the stator were considered during the simulation. The distribution of radial forces on the inner surface of the stator is presented in Figure 2 for the machine with skewed and non-skewed rotor [13].
The electromagnetic forces were calculated during electromagnetic analysis using finite element method in JMAG software.
The analyzed machine had a skewed rotor and thus the electromagnetic analysis was performed using a 2D model with five slices along the axial length of the machine. One can see that for the machine with skewed rotor, the distribution of the radial forces on the stator inner surface is not uniform along the axial length of the machine. The amplitude of the radial forces is different in various parts of the stator. This is shown in Figure 3. The radial forces distribution is displayed for three slices of the machine. The points in which the slices of the machine were considered are also presented.
One can see that the amplitudes of the radial forces vary in different parts of the machine. Once the radial forces were calculated during electromagnetic simulation, they were mapped to the structural mesh of the stator structure and combined with the previously calculated normal modes, the analysis of noise and vibration of the machine could be performed.
The amplitude of the vibrations depends on the amplitudes of radial forces and on the rotational speed. The amplitudes of the radial forces change with the magnetic flux density in the machine. The higher the value of magnetic flux density in the machine the higher amplitudes of radial forces. In order to weaken the radial forces, one needs to weaken the magnetic flux in the machine. This can be achieved by changing the current angle by increasing the iq current component.
By changing the id and iq current components one can change the magnetic flux of the machine as shown in Figure 4.
When the machine operates at current angles close to 90 electrical degrees, the magnetic flux in the machine is weakened.
During the simulations, the vibrations of the stator structure were measured at various rotational speeds and at different current angles to investigate the impact of the rotational speed and the current angle on the vibration of the structure.
The results of the simulations are presented below.
Figure 5 shows the comparison of vibration measured at two rotational speeds at different current angles. In case of the machine operating at 600 rpm, the vibration looks similar for both current angles; however, at 4500 rpm the vibration amplitude is lower for the higher current angle as the radial forces are lower. Additionally, it can be noticed that the vibration amplitude is higher when the machine operates at 600 rpm. This is because, depending on the rotational speed, the frequency of the applied force is different and various normal modes of the structure respond, which causes the vibrations to increase at certain frequencies. This proves that the vibration of the machine depends not only on the amplitude of the radial forces but also on their frequency.
Non-uniform radial force distribution on the inner surface of the stator caused by rotor skew has an impact on the vibration of the stator structure. The simulation results presented in Figure 6 show the vibration of the structure measured in three points on the stator along the axial length. One can see that in various points on the stator the vibration amplitude is different, which is caused by the non-uniform radial force distribution.
The vibration of the stator was investigated for four different rotational speeds. One can see that the amplitudes of the vibrations vary depending on the point on the stator in which they were measured. However, this difference between the amplitudes changes with the rotational speed. This is because at some rotational speeds, various normal modes are excited, which leads to very high vibrations of the structure.

3. Laboratory Tests

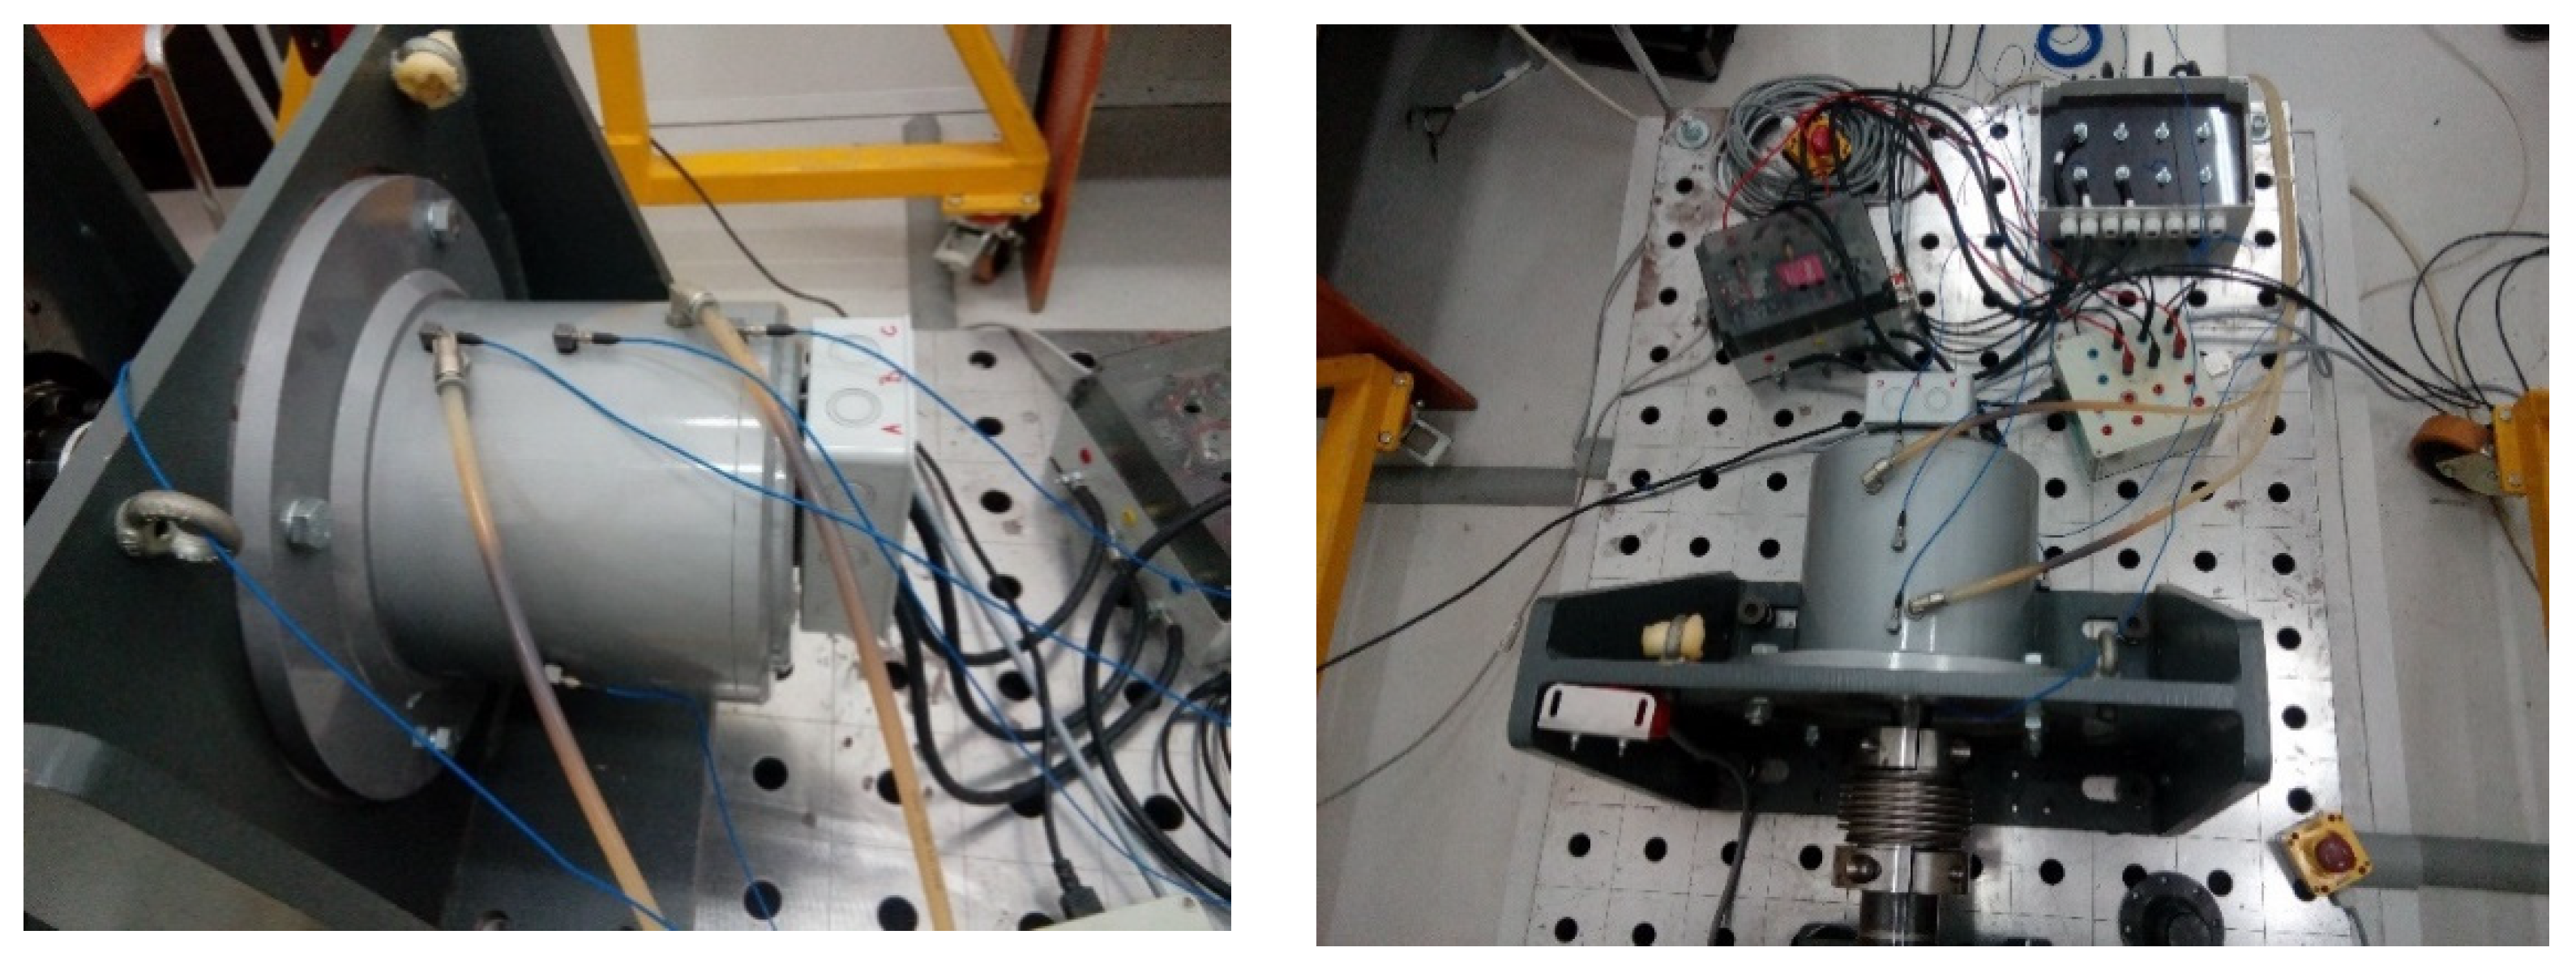
3.1. Laboratory Test Bench

The laboratory stand used during the measurements consists of tested SynRM and an induction machine operating as a load. Cross section of the tested machine is presented in Figure 7. Mechanical coupling of the SynRM with induction machine is presented in Figure 8. Both machines were supplied from four quadrant inverters. The switching frequency of the induction machine was 8 kHz. Before the experiment, the rotor of the examined machine was balanced.
Test bench specifications are presented in Table 1.
Tests that can be carried out on the test bench:
  • No-load test
  • Different level of loads
  • Different speed/torque profiles
Main dimensions of the machine are contained in Table 2.
Vibration sensors’ placement and water-cooling connection is shown in Figure 9.
The vibration sensors were placed in x, y and z direction on machine’s housing. Additionally, as shown in Figure 9, on the top of the machine three sensors were placed along machine’s axial length. The system was controlled using dSPACE hardware with dedicated software. Control model of the drive was built in Matlab/Simulink.
Selected parameters of the vibration sensor and the microphone are presented in Table 3 and Table 4.
Diagram of the test bench is presented in Figure 10.

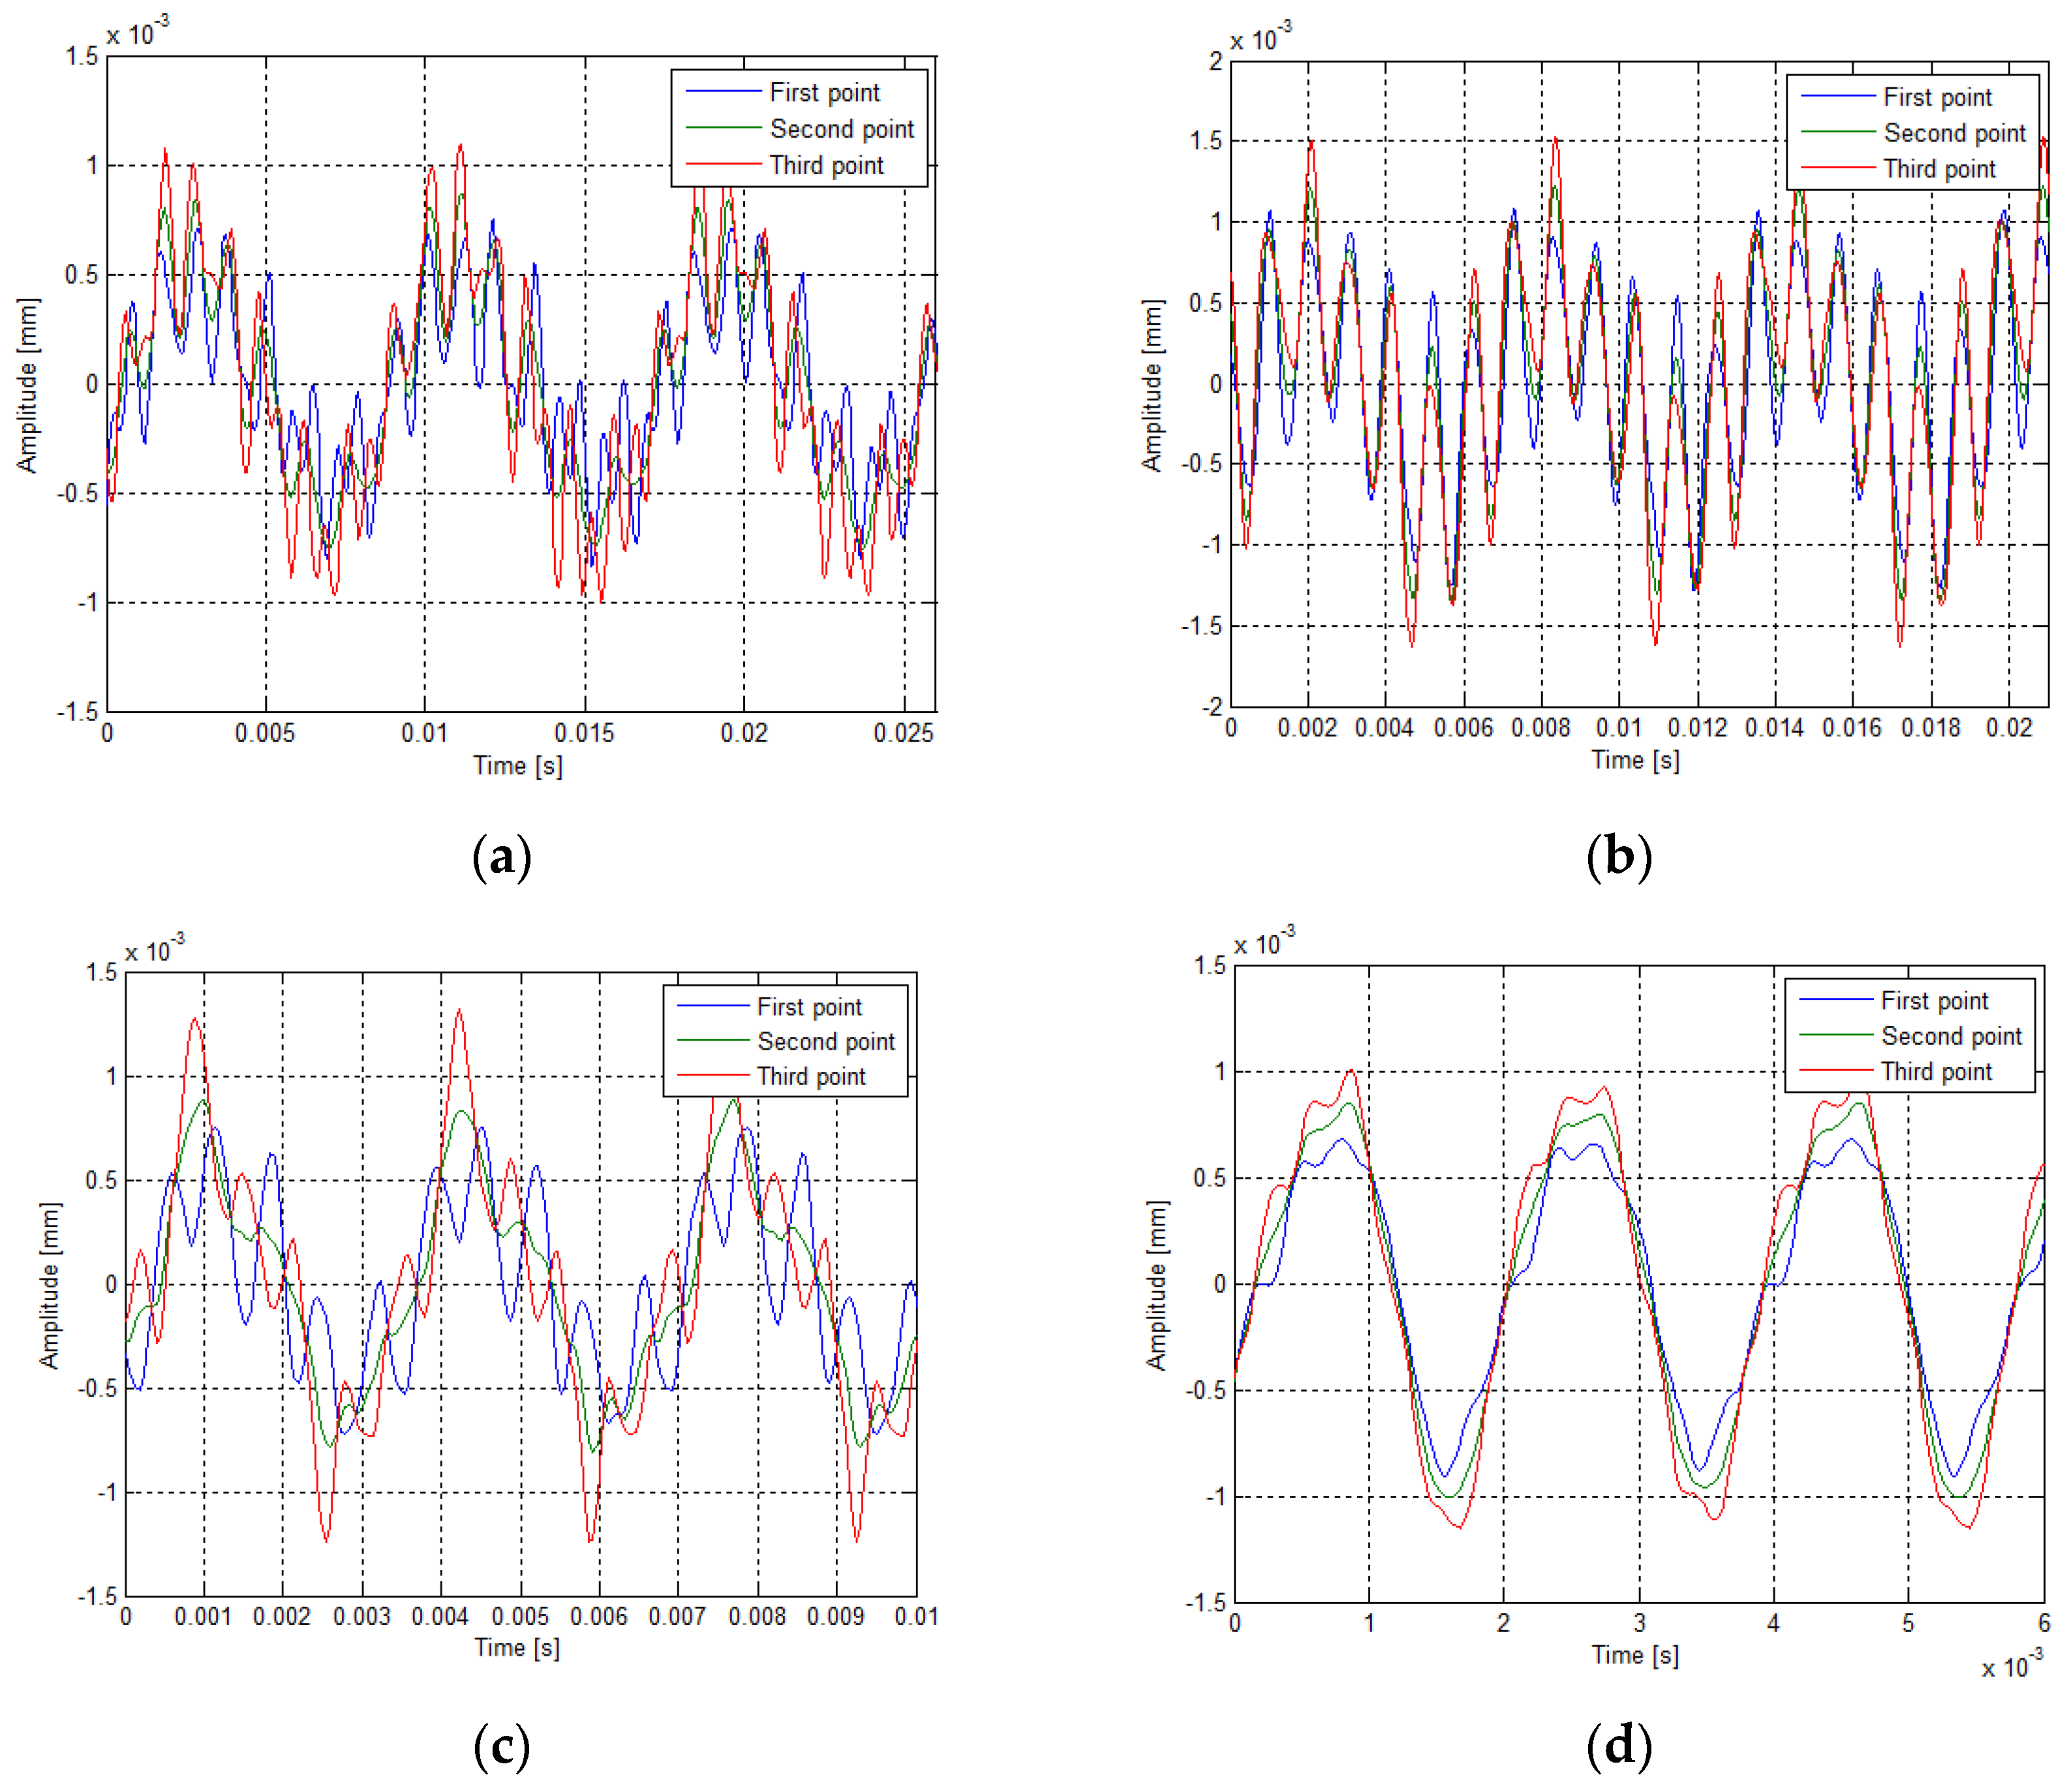
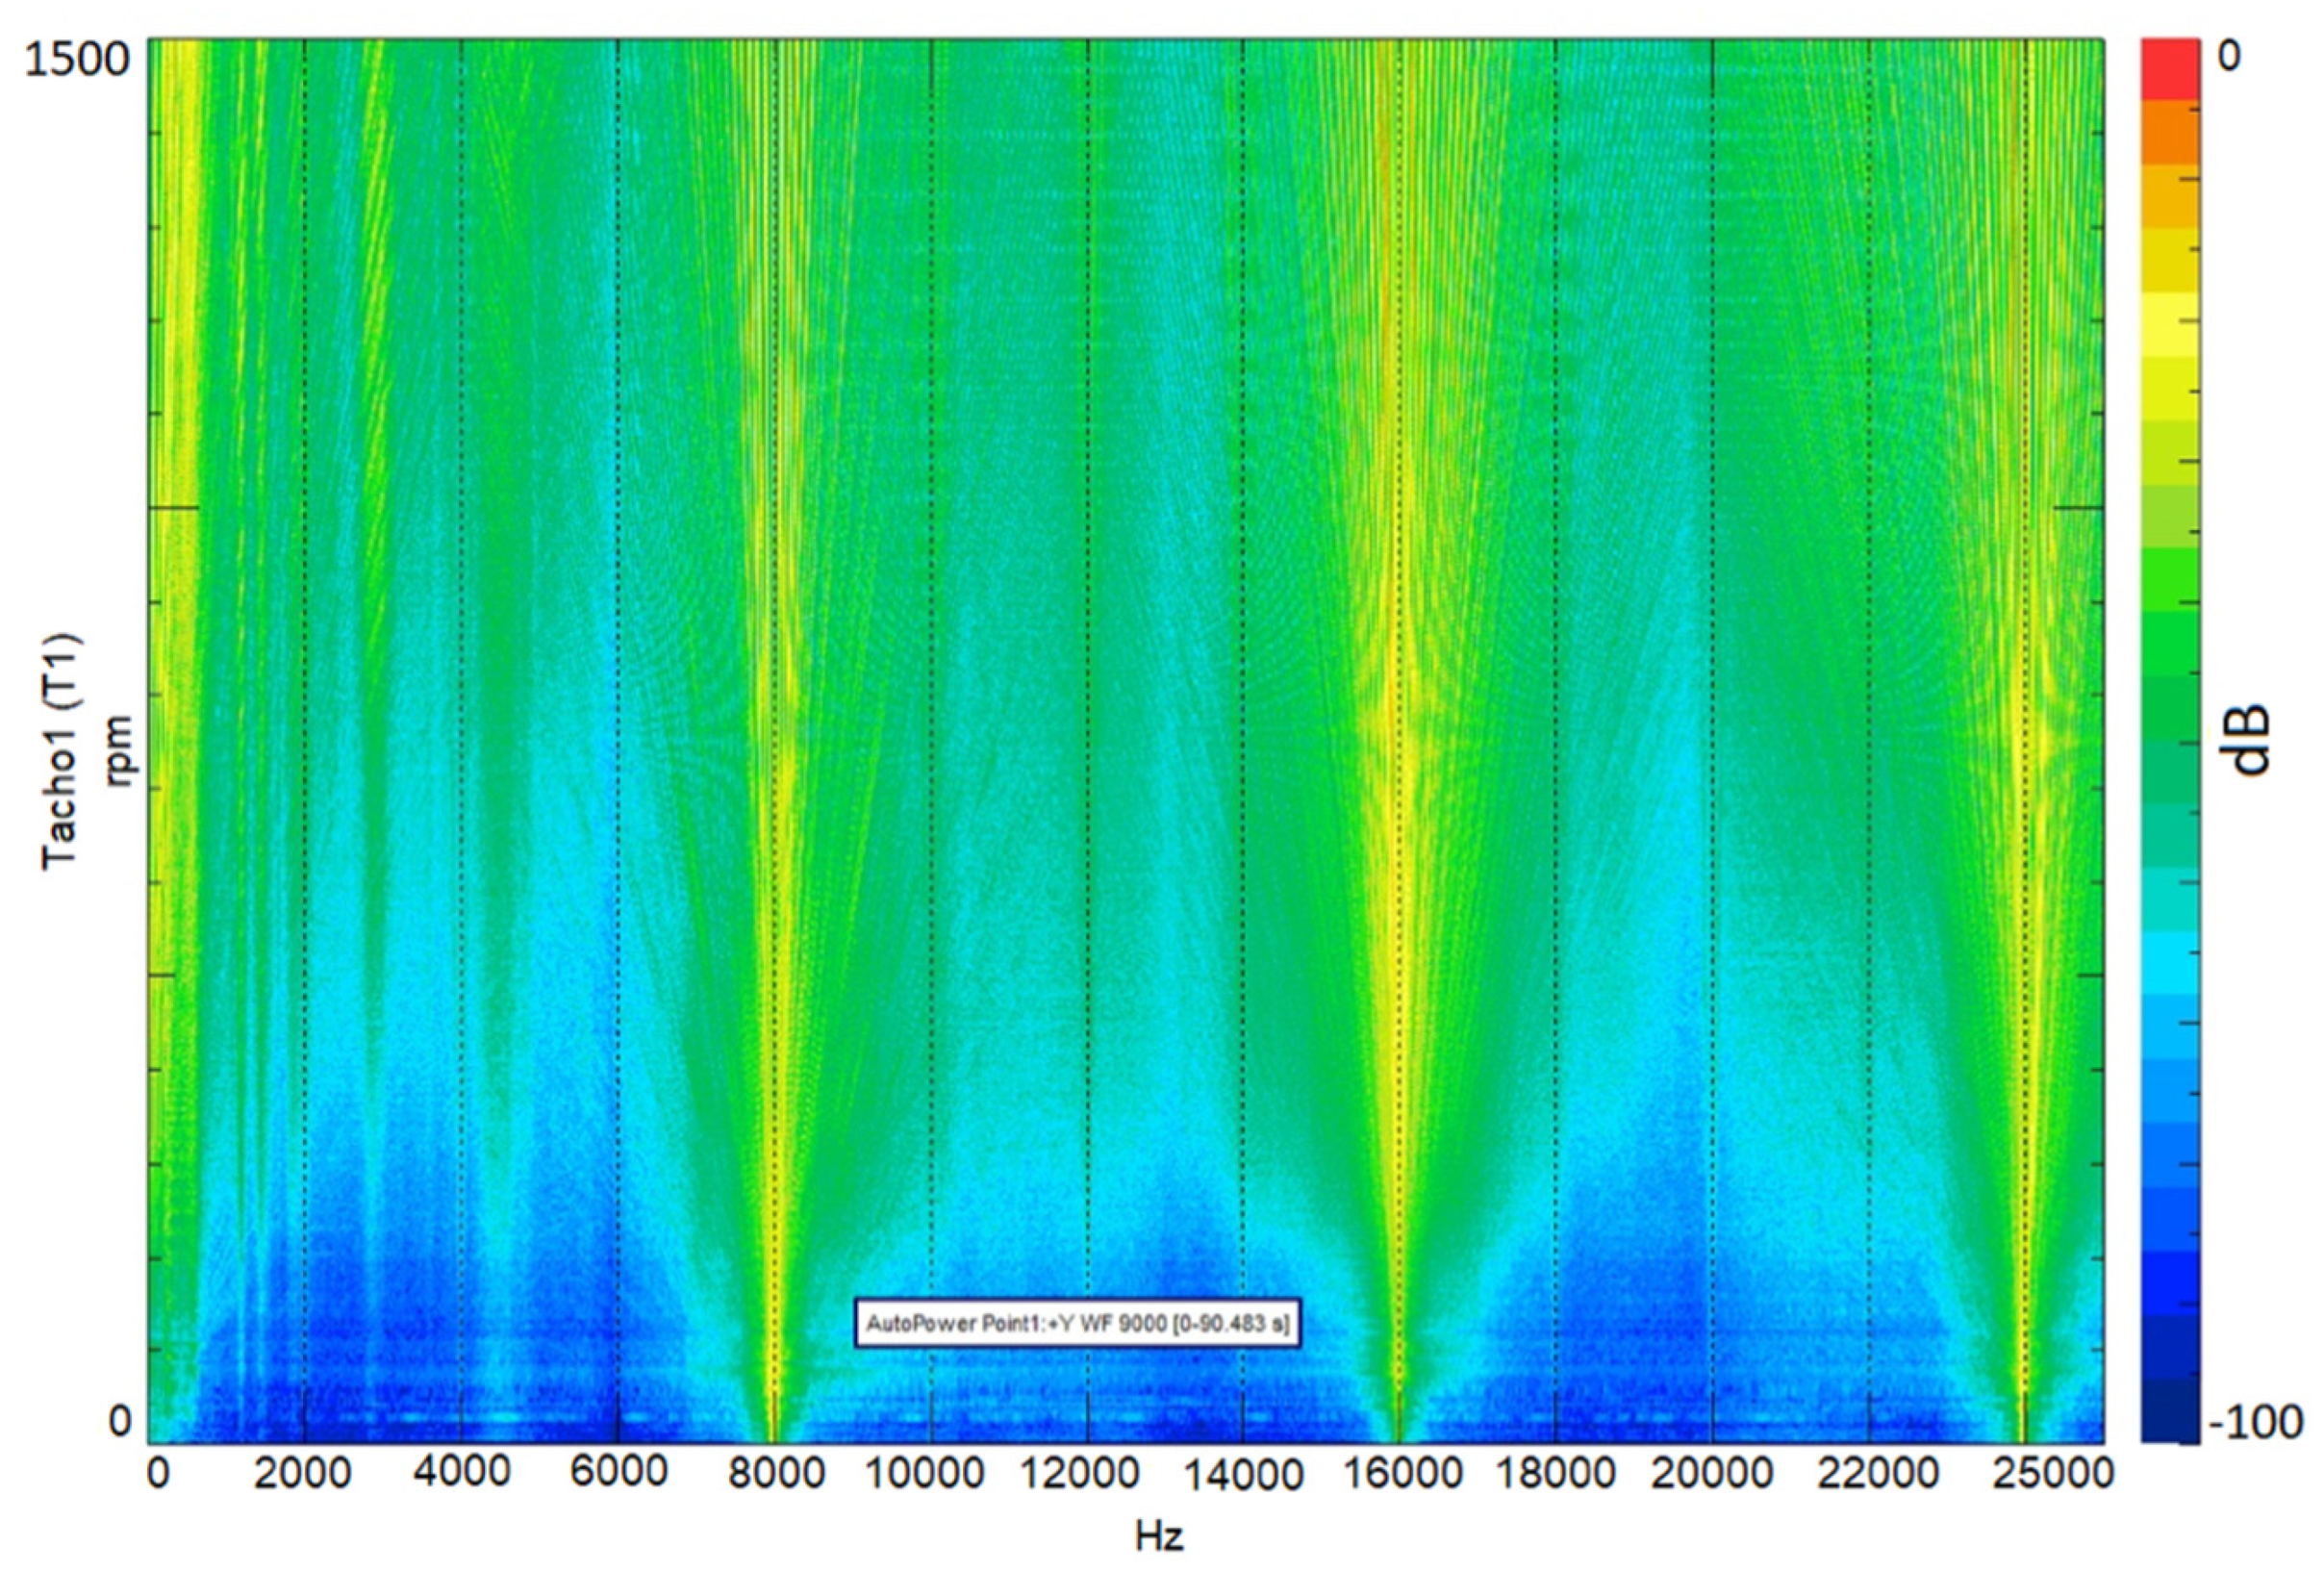
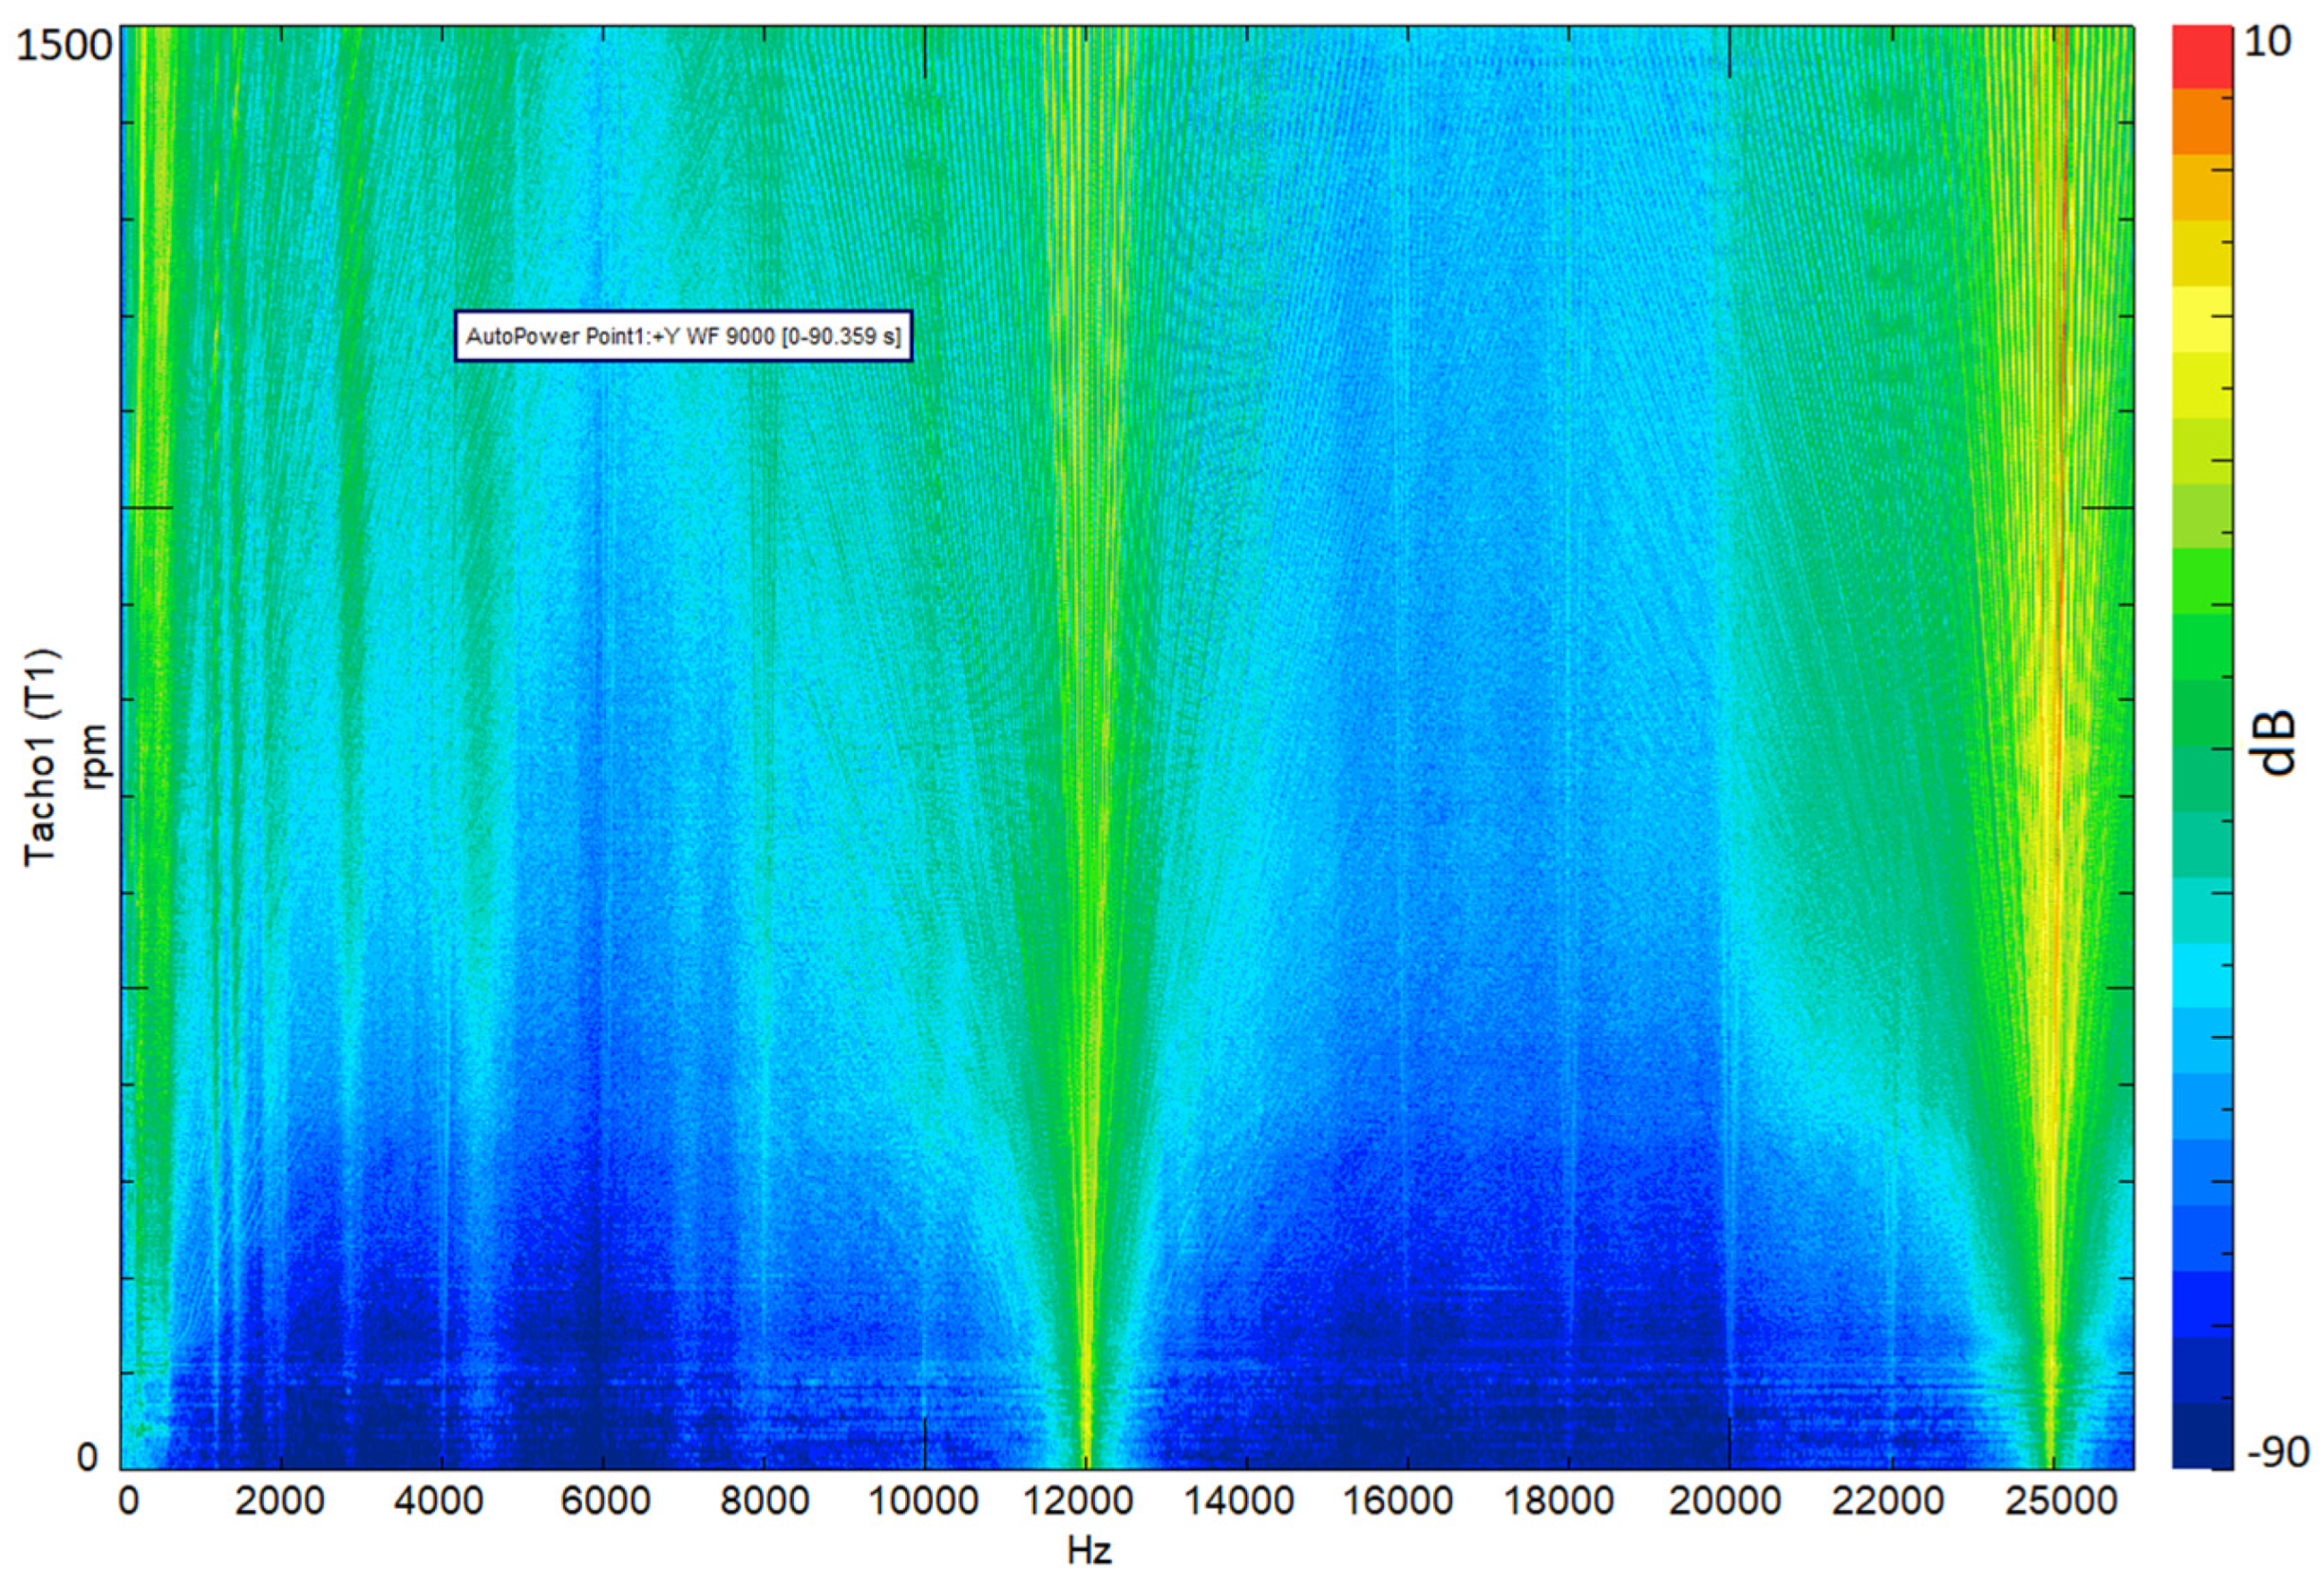
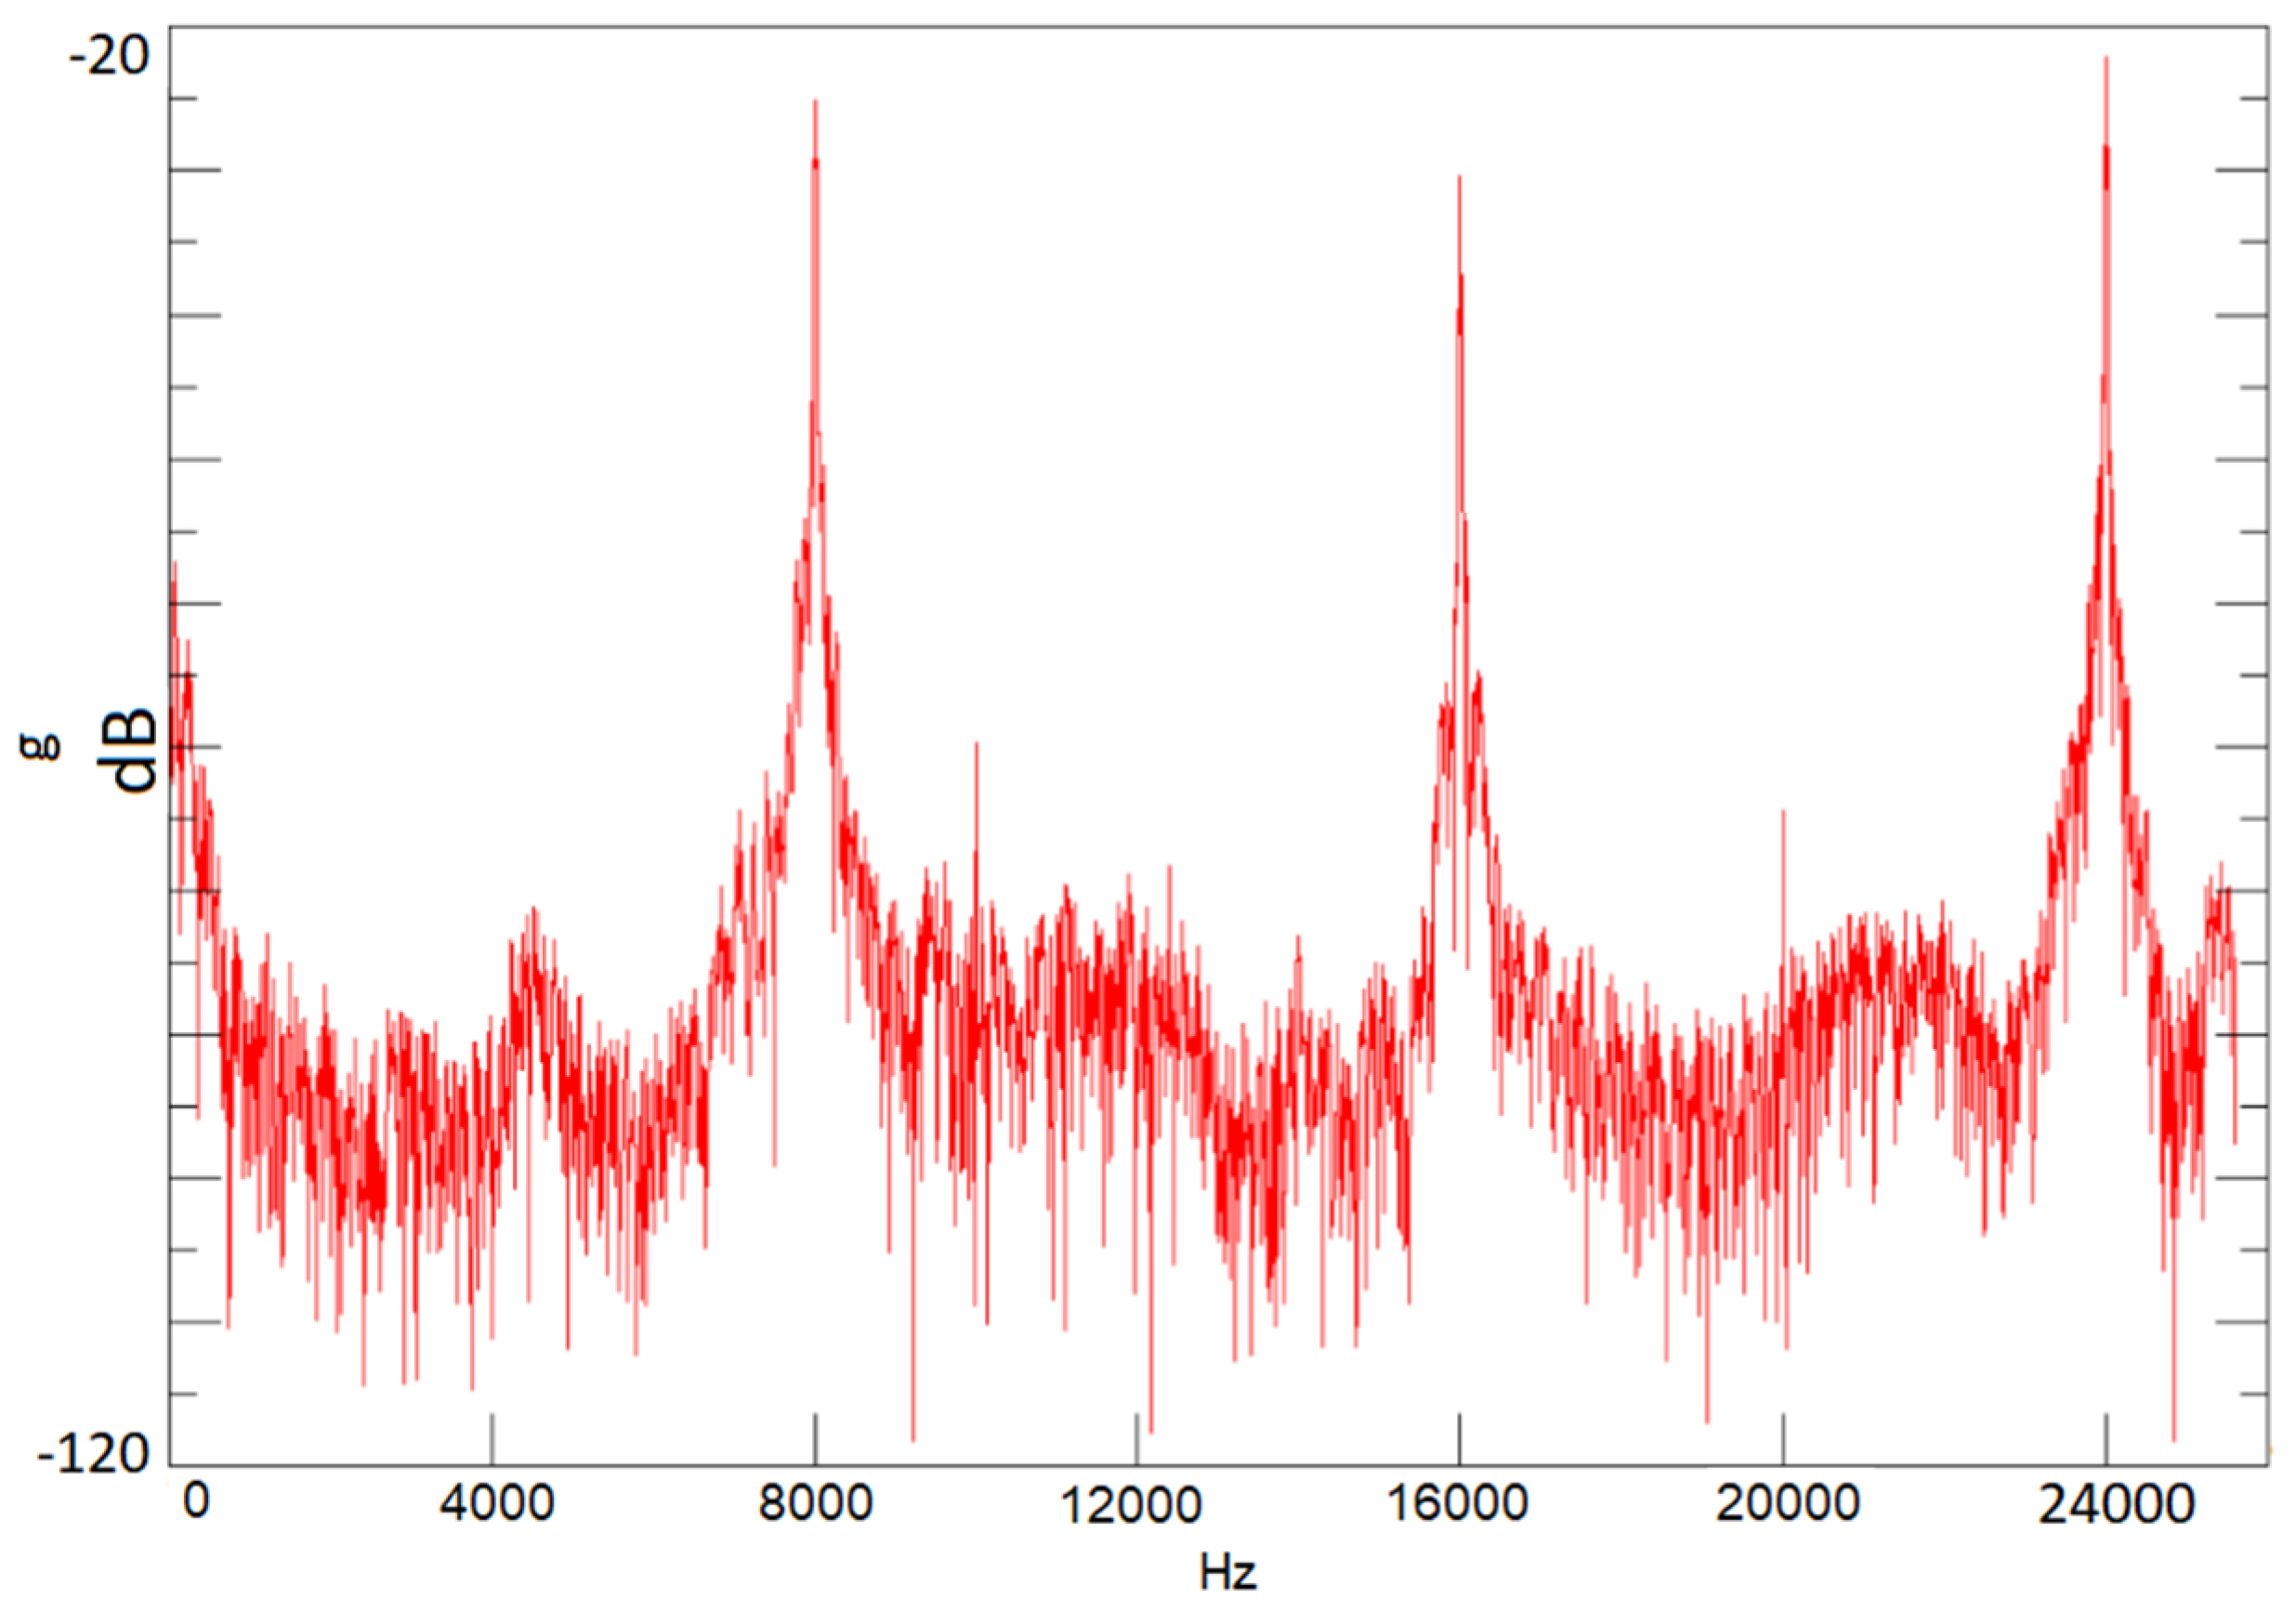
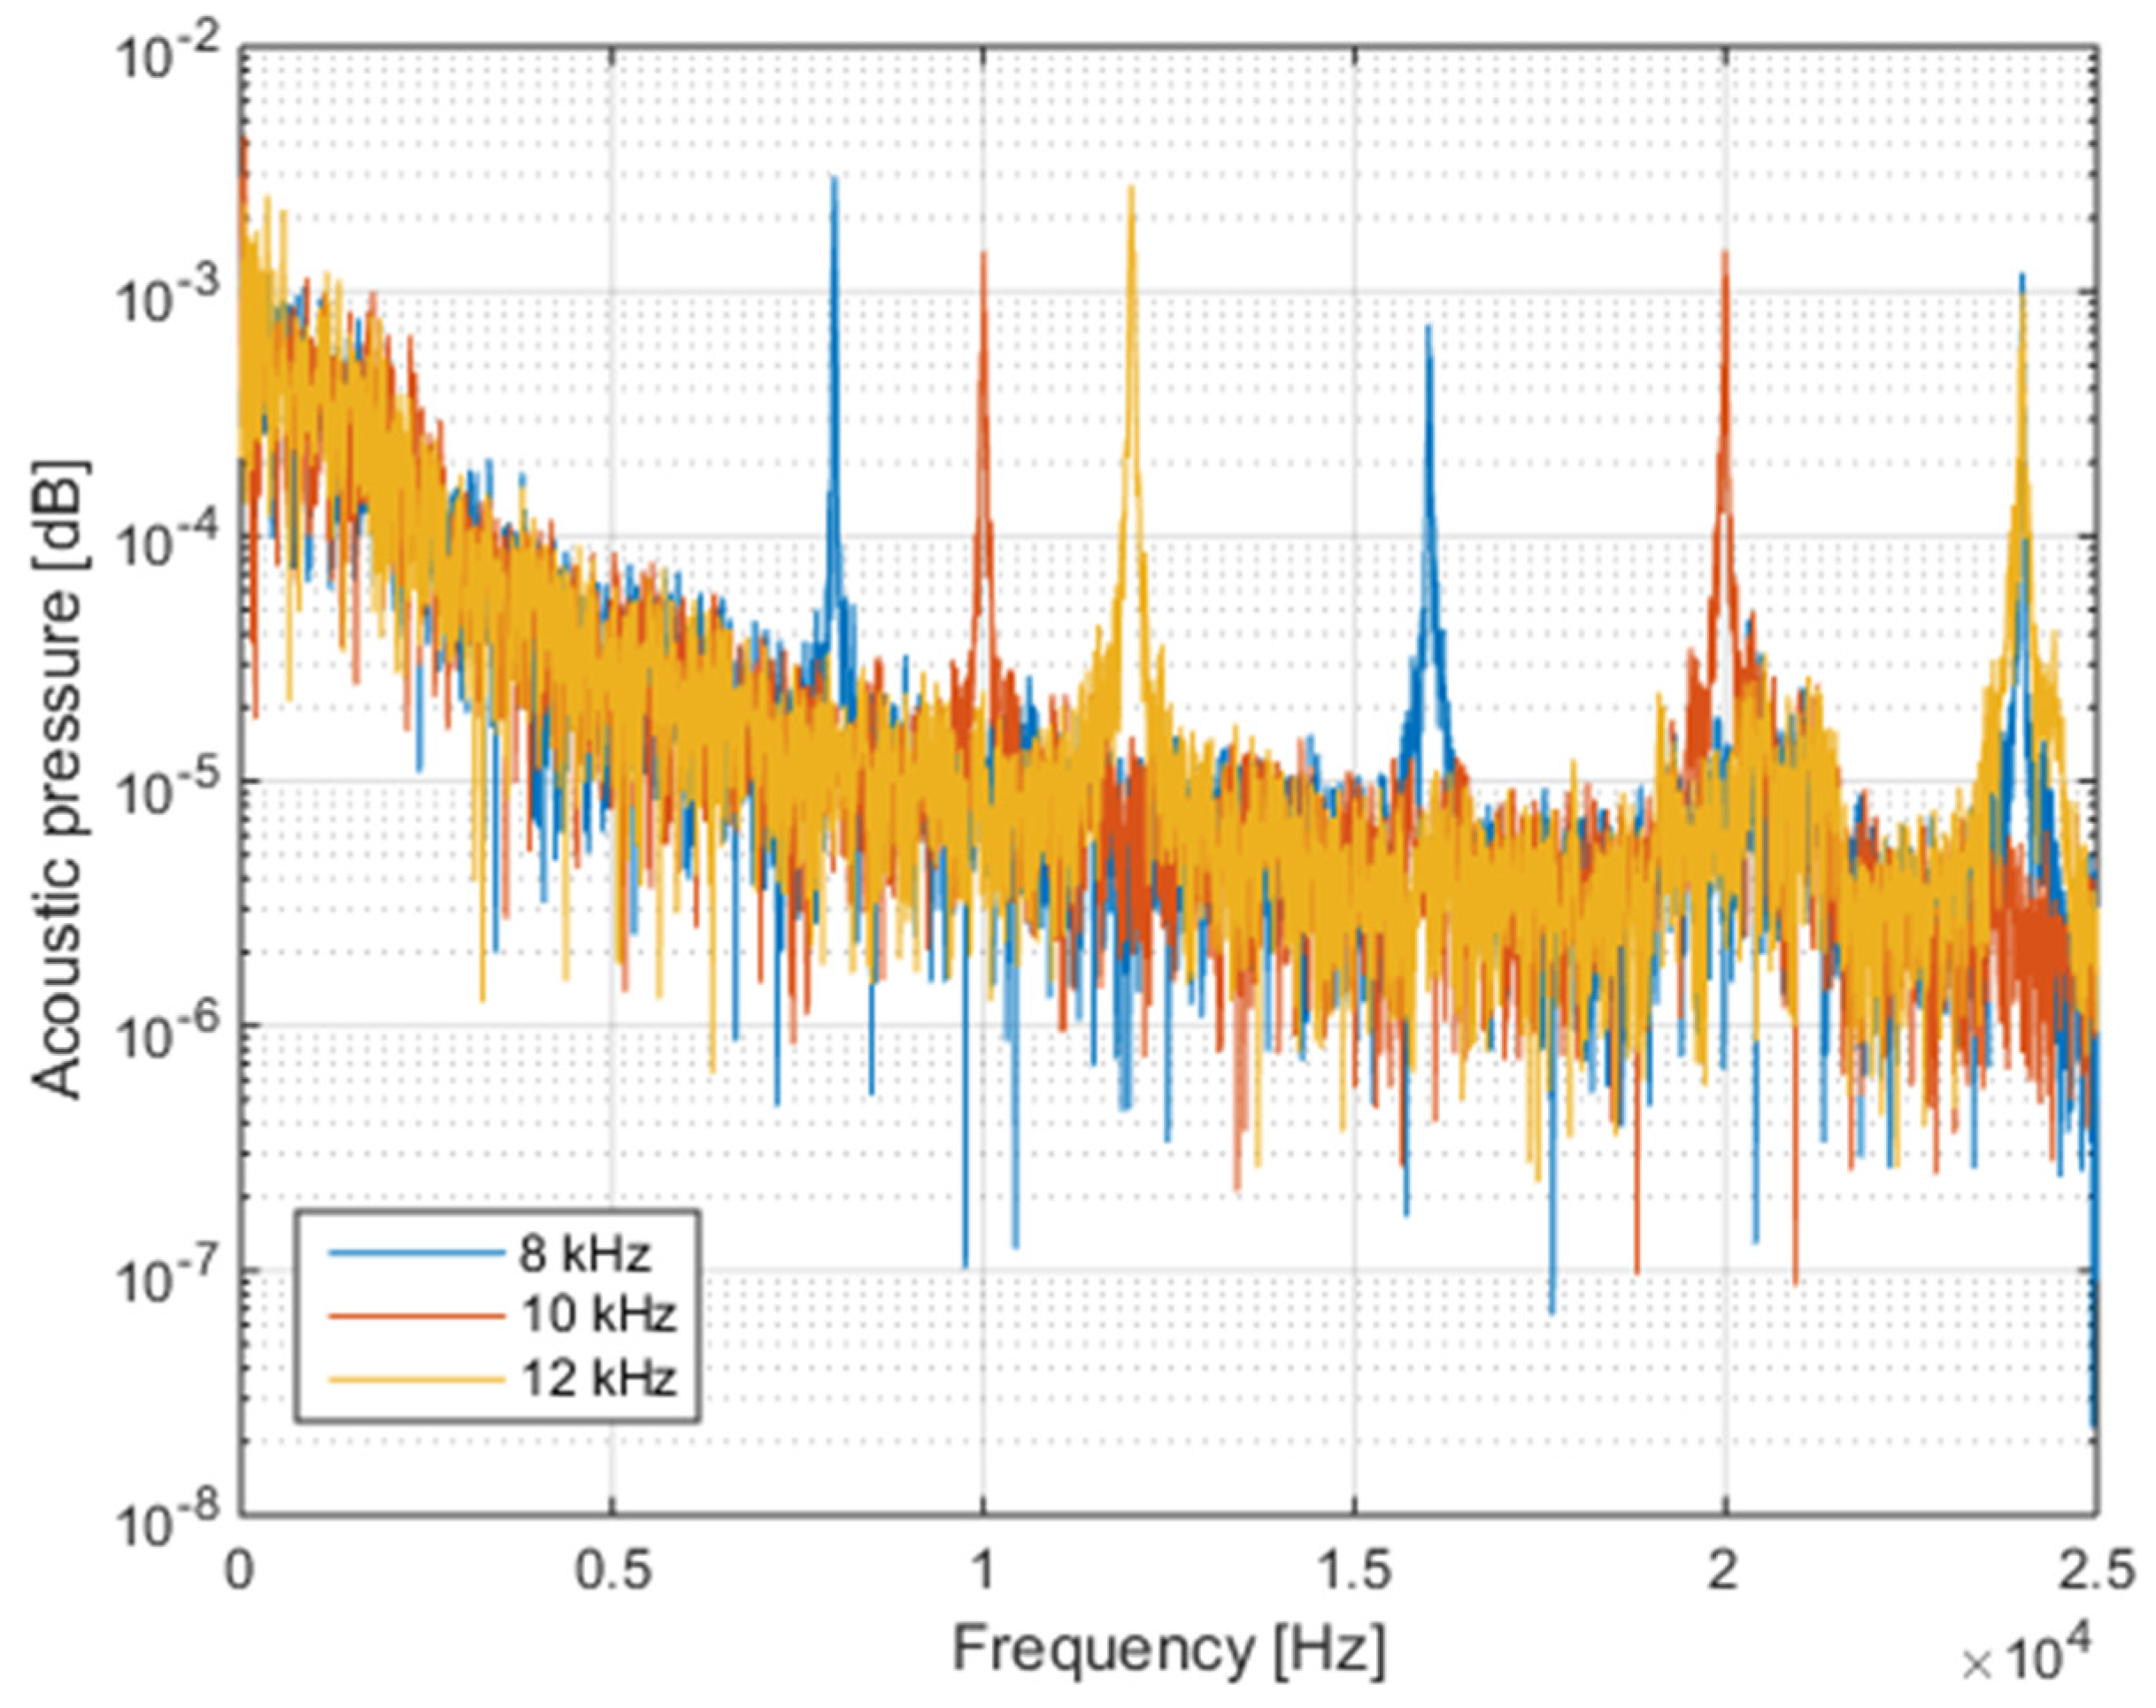
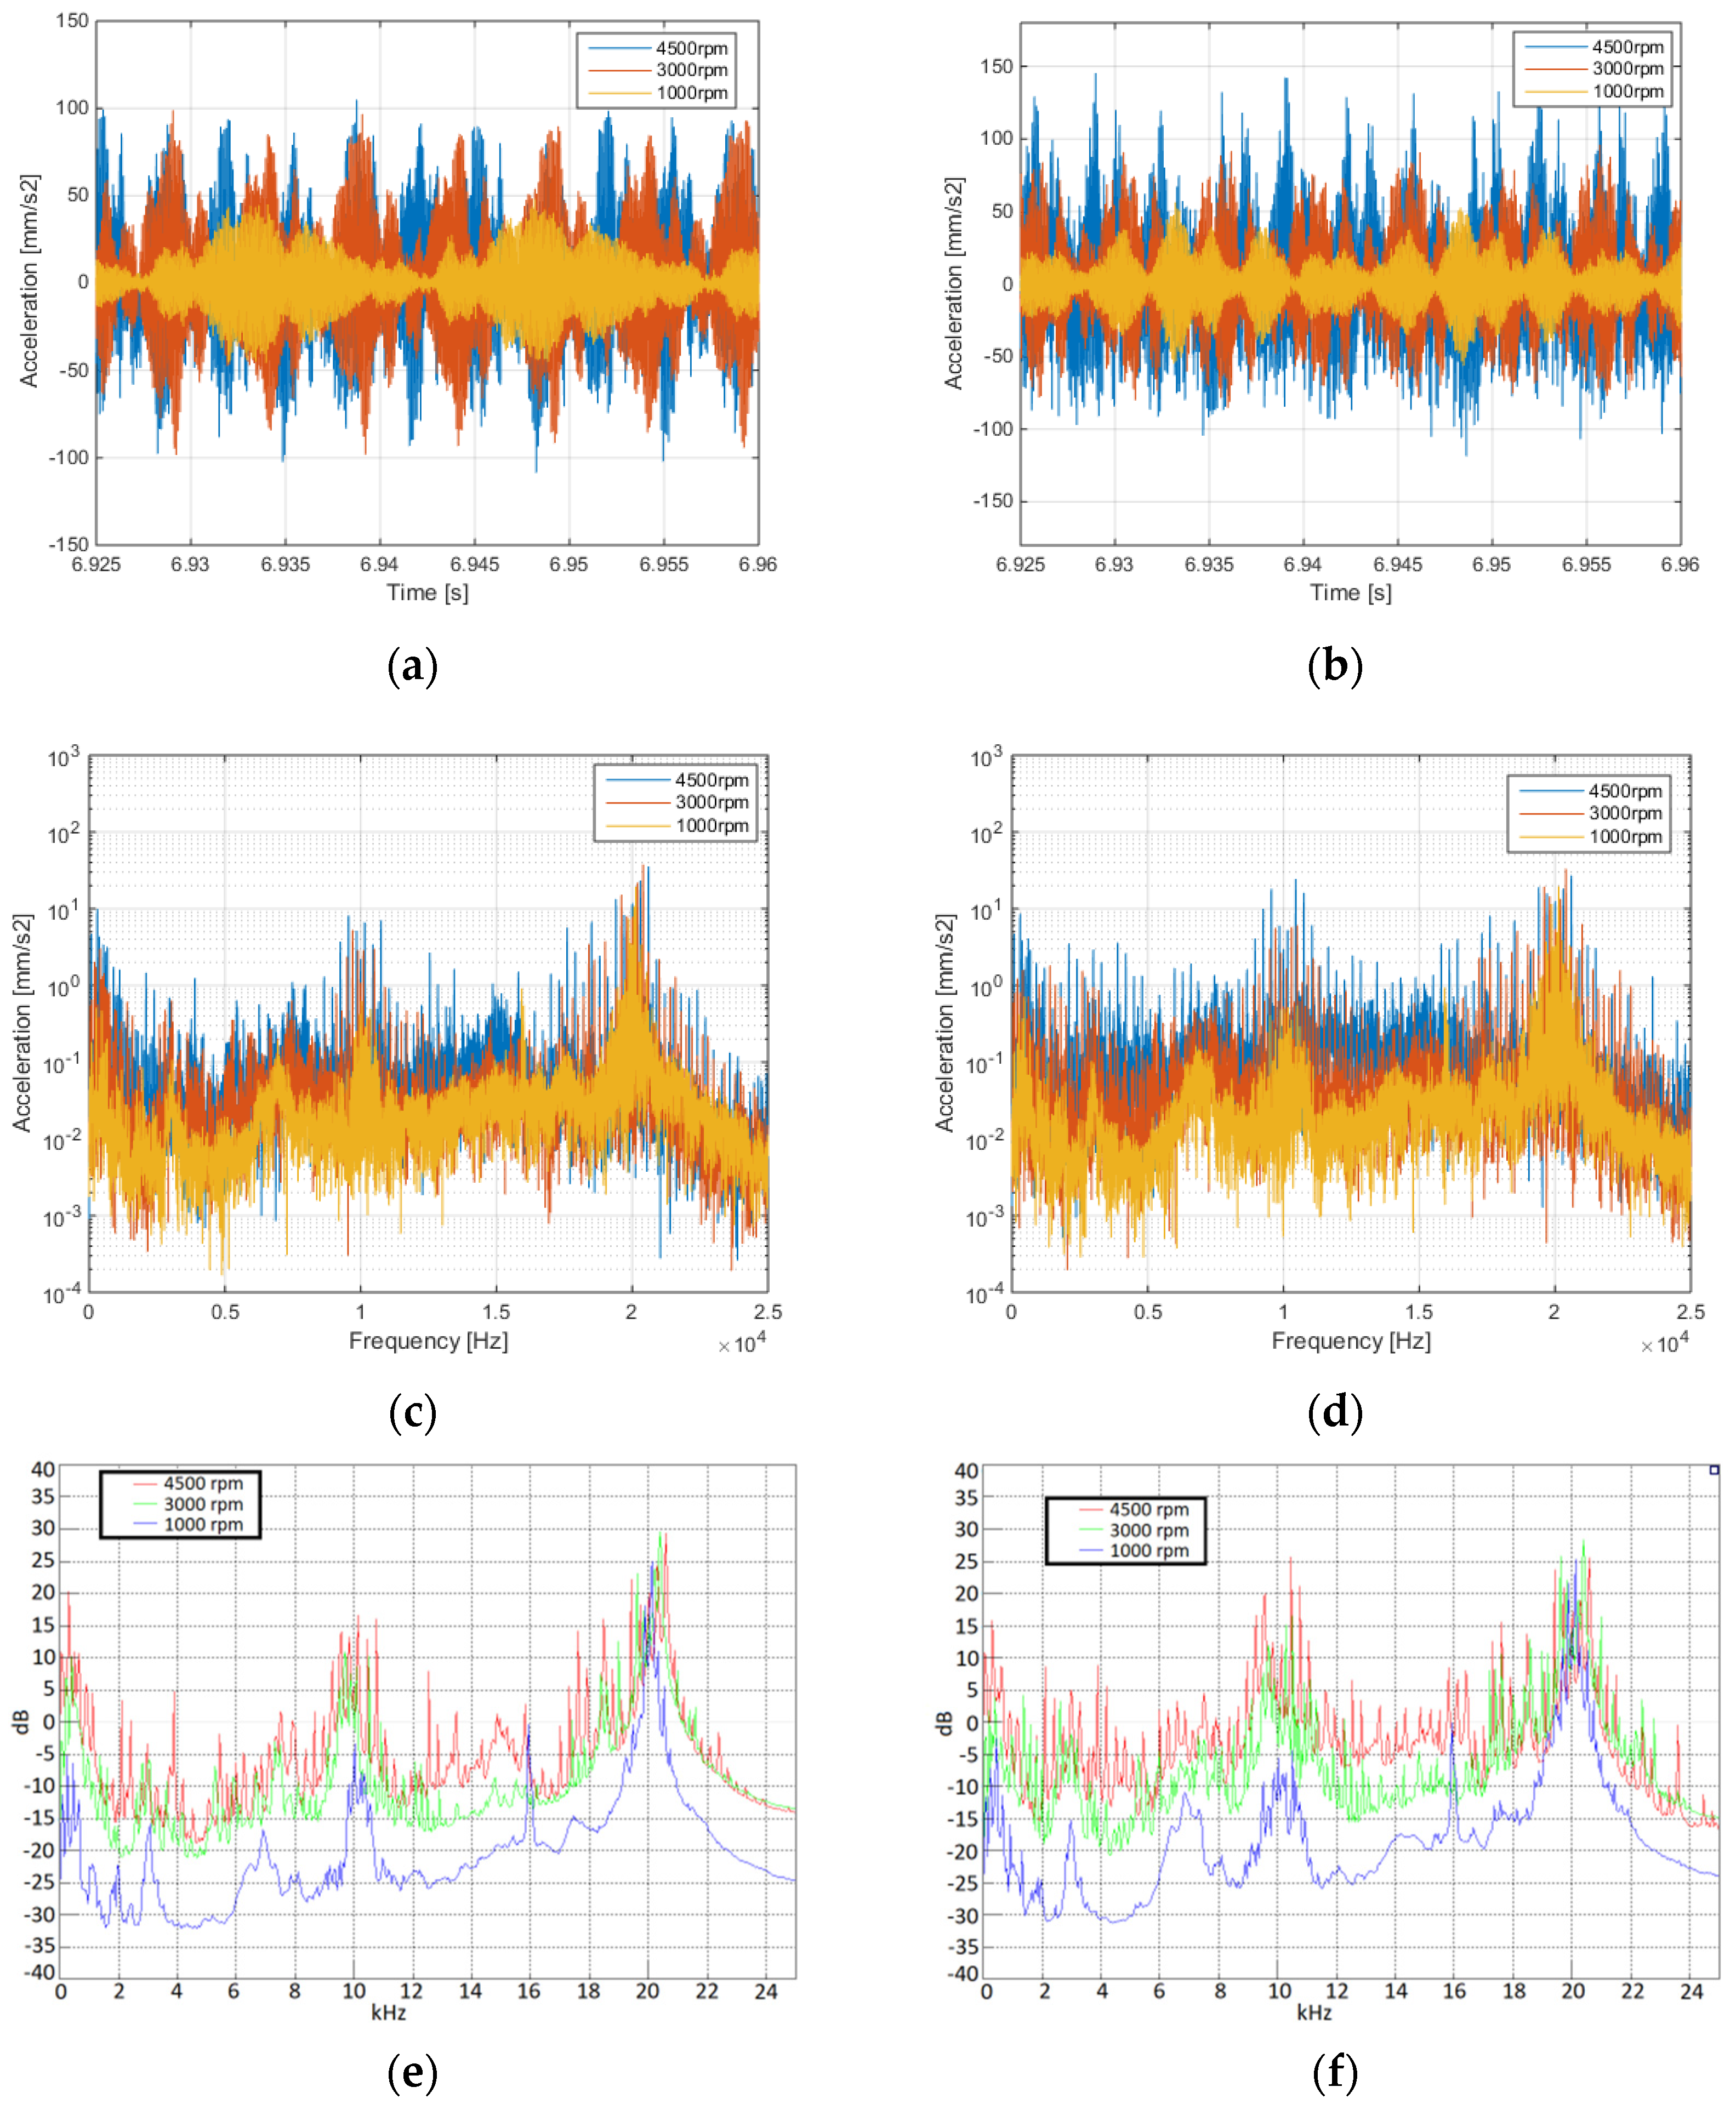
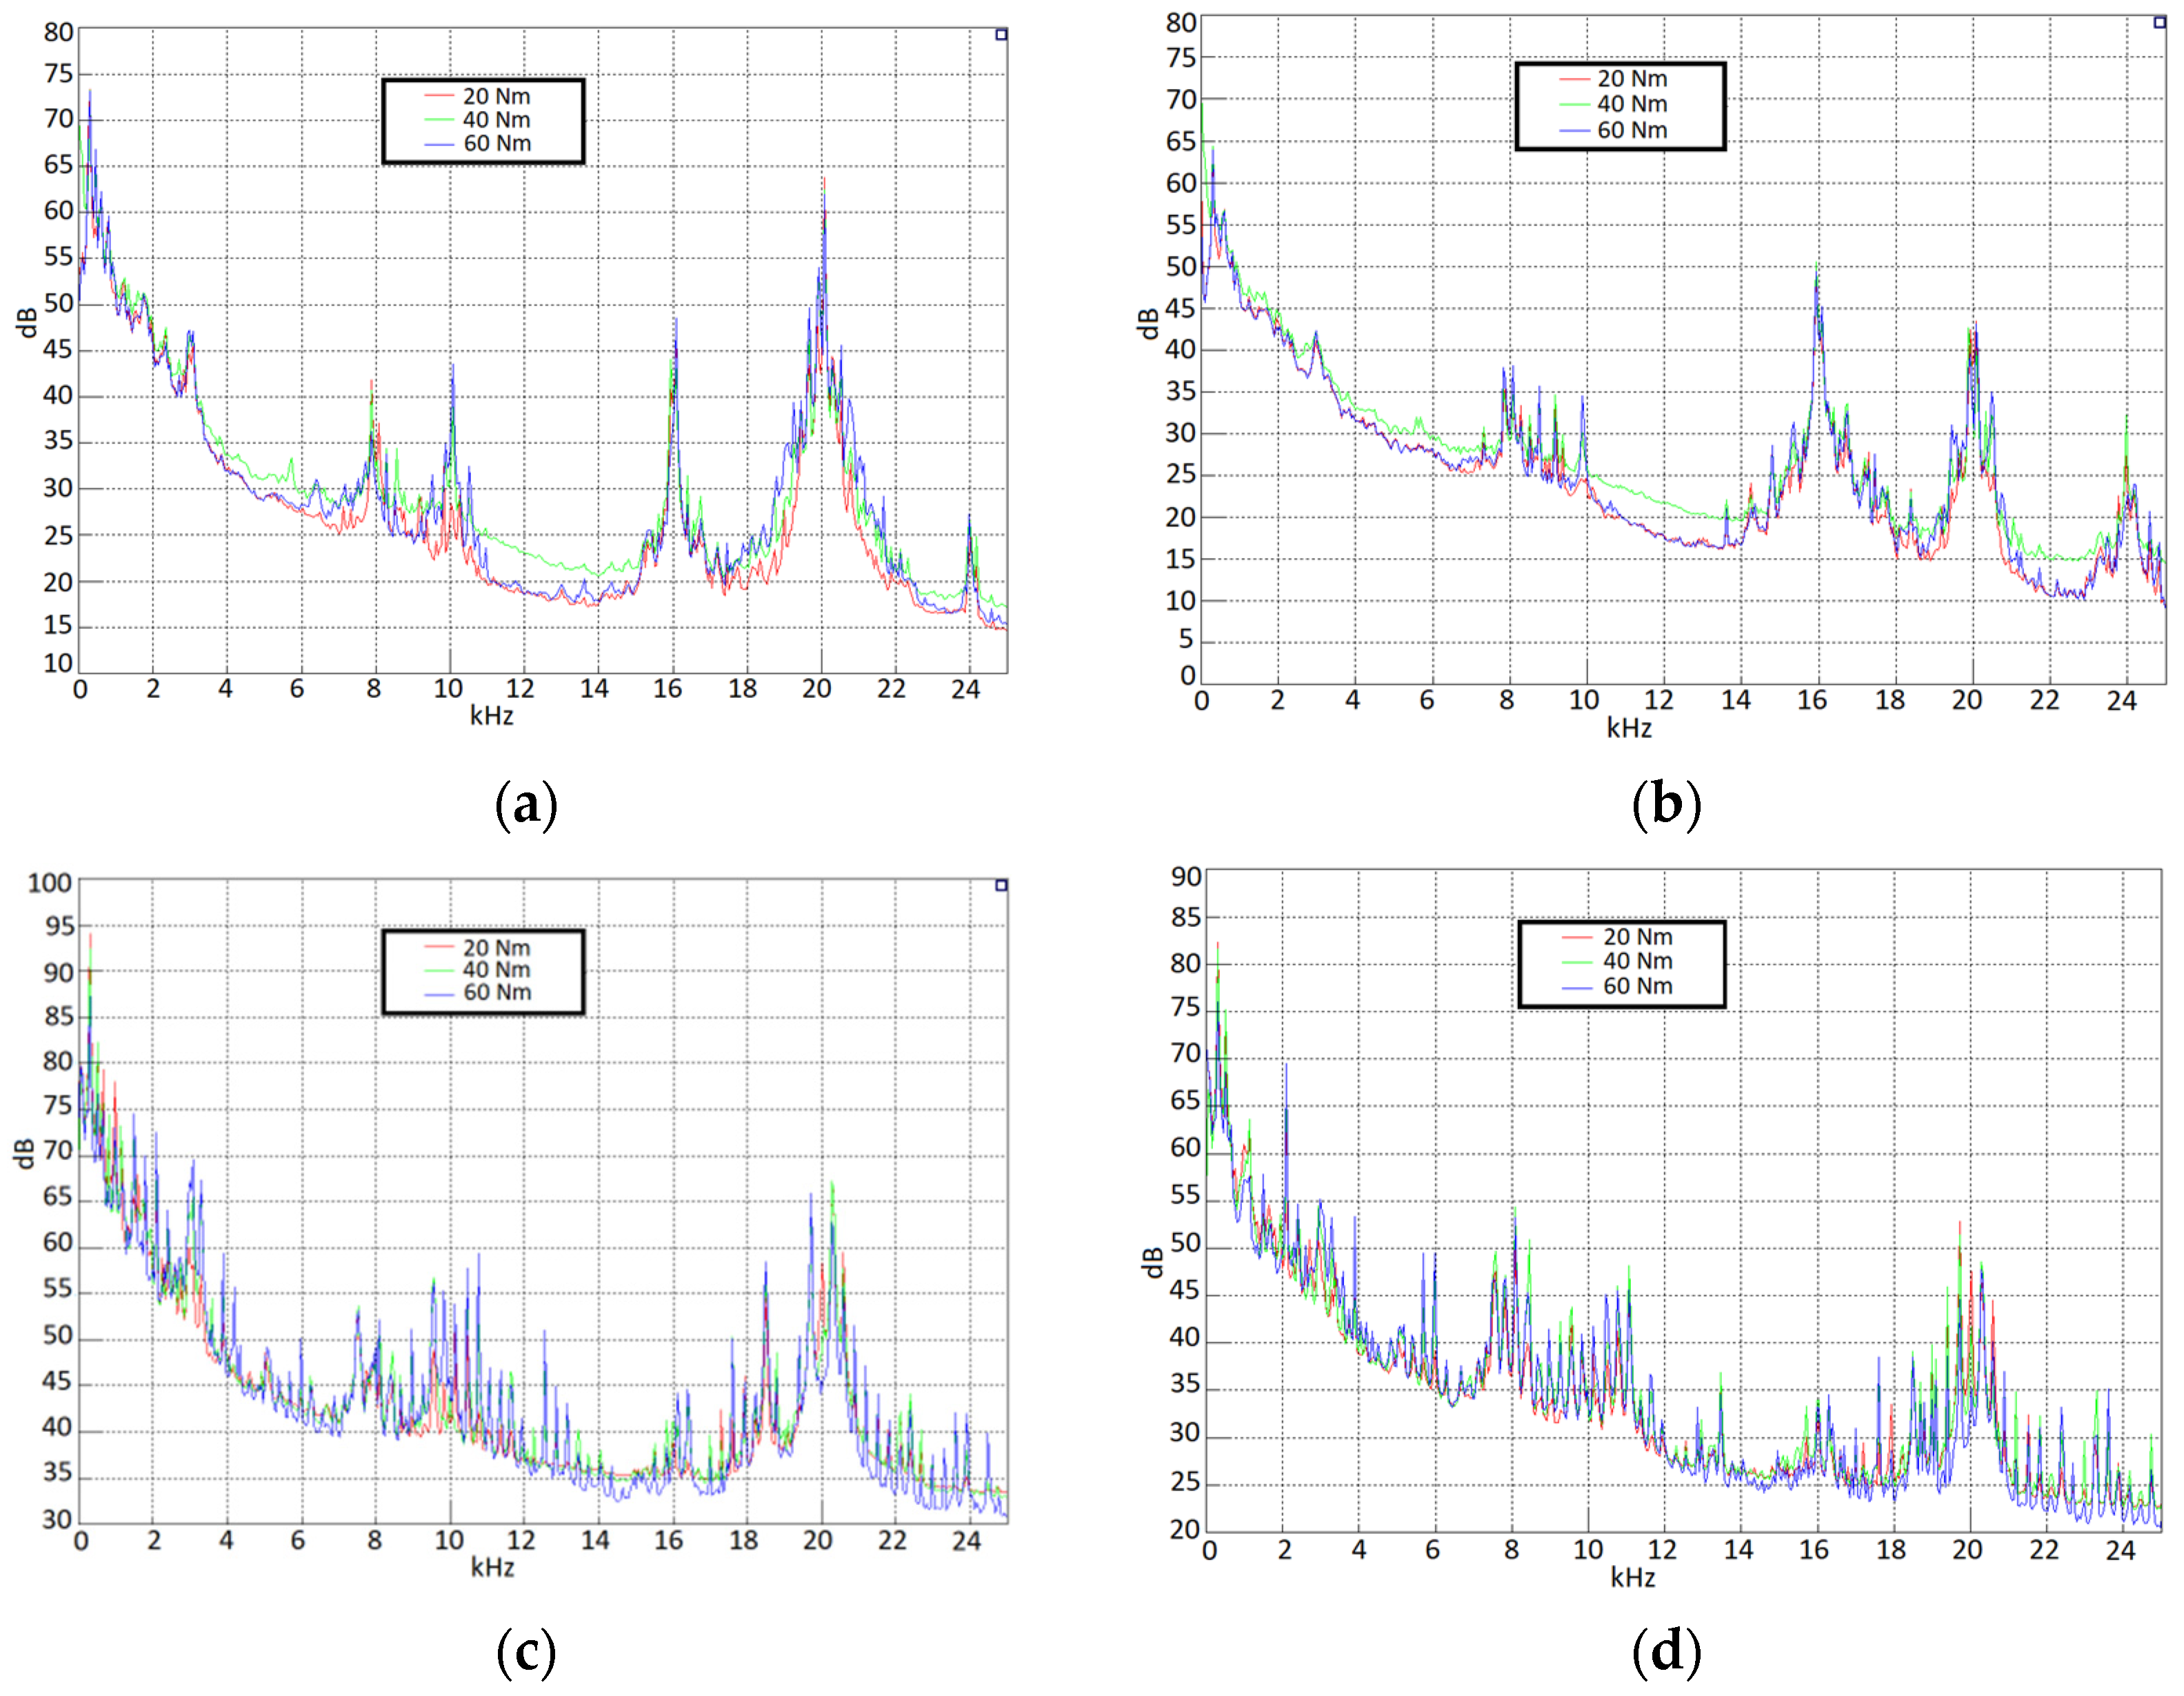
3.2. Experimental Results

Laboratory tests were carried out to validate the simulation results. The goals of NVH simulations were:
  • Investigation of noise and vibration level;
  • Investigation of the influence of current angle and load on noise and vibration;
  • Investigation of the influence of switching frequency on noise;
  • Identification of normal modes and natural frequencies.
The tests were run in no-load and load conditions of the machine. The machine was supplied from an inverter and only steady-state tests were analyzed (no dynamic state tests were performed). A no-load state was used to investigate the impact of switching frequency on noise and vibration of the machine. In the load state, the impact of the current angle and load torque on noise and vibration was analyzed. The sampling frequency was 50 kHz. The measurements of noise and vibration signals were triggered using TestLAB software.
The SynRM was run from 0 to 1500 rpm to measure the machine’s vibration and obtain the information about the normal mode frequencies of the structure.
In Figure 11 one can see vibration of the SynRM measured in three points along its axial length. Like in the numerical tests, the vibration varies along the machine’s axial length due to non-uniform radial forces distribution caused by skewing the stator core. Moreover, in the case of laboratory tests this effect was amplified by the assembly of the machine.
The vibration signal was measured at three switching frequencies of the inverter: 8 kHz, 10 kHz, and 12 kHz.
It can be noticed that the vibration signal in the colormap has higher amplitudes at switching frequency. This is caused by the PWM, signal whose harmonics are present in the spectrum of vibration signal. For 8 kHz switching frequency, in the colormap one can observe the vibrations at 8 kHz, 16 kHz and 24 kHz (Figure 12) since these are the first-, second- and third-order harmonics of the switching frequency. The situation is similar in case of 10 kHz and 12 kHz switching frequency. For the 10 kHz switching frequency, the vibration occurs at 10 kHz and 20 kHz (Figure 13) and for the 12 kHz switching frequency the vibration occurs at 12 kHz and 24 kHz (Figure 14). The switching frequency signal and its harmonics contribute to vibration and noise signal.
Figure 15 shows an example FFT of the machine’s vibration signal generated at 8 kHz switching frequency in dB scale. In this figure one can see amplitude peaks at 8, 16 and 24 kHz.
Stator’s natural frequencies can be found in the vibration colormap. The resonance frequencies appear on the colormap as vertical line of higher amplitude. This is presented in Figure 16. One can notice three typical modes of the stator: ovalization, triangular and square mode. These modes have their corresponding natural frequencies.
One can see that the noise of the switching frequency and its harmonics are present in the acoustic signal of the machine. A comparison of acoustic noise FFTs is shown in Figure 17.
Just like in the case of the vibration signal, switching frequency harmonics are rotational-speed independent. The higher switching frequency the more noise the machine generates.
In load state the vibration of the machine was measured for various loads at different rotational speed and current angles using the accelerometers mounted on the machine, as presented in Figure 9. The operating points of the machine at different load and current angles are presented in Table 5. Red color indicates operating points which could not be measured due to technical limitations of the test bench. The examined machine was supplied from the inverter at 10 kHz PWM frequency.
The comparison of vibration signals from three accelerometers mounted on the machine in Y direction is shown in Figure 18. The vibration of the machine along its axial length is not uniform as it was in case of a no-load state. This is caused by the fact that the machine has a skewed rotor, which makes the radial forces distribution non-uniform along the axial length of the machine. Moreover, the mounting of the machine significantly limits the vibration level close to the mounting plate.
The rotational speed affects the vibration of the machine because at different frequencies the normal modes of the machine are excited in different manner. Comparison of vibration for different rotational speeds is presented below.
Figure 19, shows example results of vibration measurement for three different values of rotational speed and two different values of load torque. Figure 19a,b show time waveform of vibration signal for 20 Nm and 60 Nm load, respectively. It can be noticed that the higher the speed, the higher the amplitude of vibration signal. Comparison of the FFT of vibration signal as shown in Figure 19c,d gives a better image of how the speed influences the vibration of the structure. The power spectrum of the vibration signal is shown in Figure 19e,f. One can see clearly that the vibration strongly depends on the rotational speed. The highest amplitude of both the signal’s FFT and the power spectrum occurs at 20 kHz, which is double the switching frequency.
The load has also an impact on the vibration of the structure. One can see in Figure 20 that the vibration changes along with the load. Higher torque requires a higher phase current, which in turn increases the magnetic field in the machine and causes the radial magnetic forces to rise.
The influence of the load on vibration, however, is not as strong as the influence of rotational speed. In Figure 20a,b one can see the time waveforms of vibration signals for different load values at 1000 rpm and 4500 rpm, respectively. As one can notice, the amplitude of vibration is affected by the load; a higher load increases the vibration amplitude. This effect is more visible at 4500 rpm rather than at 1000 rpm. The FFT of the vibration signals is shown in Figure 20c,d. One can see that the amplitudes are quite similar; at some frequencies the higher amplitudes of vibration occur for the highest load.
Comparison of the power spectrum shows the load’s impact on the machine’s vibration. One can observe that for the highest load (60 Nm) the amplitudes of power spectrum achieve the highest values, but at some frequencies the amplitudes of power spectrum are the highest for the lowest load (20 Nm).
Although the current angle has an influence on the radial forces acting on the stator, its impact on the machine’s vibration is not that clear. In Figure 21, one can see the comparison of the vibration measured at two different rotational speeds for the same load. It can be noticed that the vibration signals’ amplitudes are similar for different current angles. In case of 1000 rpm rotational speed, the difference in amplitudes at different current angles is clearer than in the case of 3000 rpm. When comparing the power spectrum of the vibration signal, one can notice that for 1000 rpm at some frequencies the vibration is higher for the lowest current angle (higher radial forces) but around 10 kHz and 20 kHz, which are switching frequency and its double, the vibrations for all measured current angles are quite similar. In case of machine running at 3000 rpm, the power spectrum of vibration signal achieves the highest values for a 60° current angle, which is quite strange since at this current angle, the flux and thus the radial forces are the lowest. This proves that the vibration of the stator is affected not only by the amplitude of the radial force but also, for the most part, by the frequency of the radial forces, since it excites the particular normal modes of the structure.
The acoustic signal was measured using two microphones: one placed next to the motor and another hung 1.5 m above the machine. Below, one can see a comparison of noise power spectrum measured in two different points at different rotational speeds.
In Figure 22 one can see the comparison of the noise power spectrum obtained from two microphones. As one could expect, the power spectrum achieves higher values for the signal measured by the microphone closer to the machine. The difference is more visible for higher rotational speeds. Figure 22a,b show the power spectrum of noise measured at 1000 rpm at 20 Nm and 60 Nm, respectively. The power spectrum of noise measured at 3000 rpm for the same load is shown in Figure 22c,d. The difference in power spectrum for two different microphones is greater for higher speeds. One can see peaks at 8 kHz and 16 kHz which are the switching frequency and its double of the supply system of the induction machine.
Comparison of the noise power spectrum measured at different rotational speeds is shown in Figure 23.
Noise power achieves higher values as the rotational speed increases. One can see that the noise has the greatest power at 4500 rpm and is the lowest at 1000 rpm. One can see that the noise power spectrum achieves higher values for the noise signal measured by the microphone closer to the machine.
Figure 24 presents the comparison of the noise power spectrum for different load values to show the influence of the load on the noise emitted by the machine.
It can be observed that the load has also some effect on the noise generated by the machine. Around the switching frequency (10 kHz) and its double, the power spectrum of the noise behaves as one might expect: the higher the load the higher the noise power spectrum. However, in some frequency ranges this rule is not followed. This is caused by the fact that in the laboratory during the tests there were two machines, both contributing to the overall noise measured by the microphones.
At higher speed, the effect of the load on the noise is less visible.
The impact of current angle on the noise is shown in Figure 25.
Similarly, to the vibration signal, the impact of the current angle on the noise is not very clear. Although the radial forces are the weakest for the highest current angle, this does not seem to affect the noise. The rotational speed and thus the radial forces frequency is the dominant factor in vibration and noise generation.
The machine’s calculated natural frequencies and vibrational signal were compared with the measured ones to verify the correctness of the model.
A comparison of measured and calculated resonance frequency of the machine’s normal modes is presented in Table 6.
As one can see, there is a difference between the calculated and measured natural frequencies. The measured frequencies are higher than the calculated one. The difference is caused by the fact that during the simulation, only the stator core was considered. The windings, the housing and the water jacket were not modeled. The presence of the windings and housing increases the natural frequencies of the entire machine, which is shown in Table 6.
Figure 26 shows a comparison of vibration signal obtained from measurements and simulation.
One can see that the vibration signal along axial length of the stator changes both in measurements and in simulation. The amplitude of the signal is greater on one end of the stator. The vibration signal waveforms are different, however. In case of simulation, the machine was supplied from sinusoidal current source, but during measurements the machine was supplied from an inverter with PWM. The amplitudes and harmonics present in the vibration signal are different in measured and simulated signals. However, it was possible to predict the behavior of the structure by running NVH simulations.

4. Conclusions

This paper presents the results of NVH analysis of a synchronous reluctance machine designed for EV application. Multiphysics analysis consisting of NVH, and electromagnetic analyses were performed to estimate the vibration and the noise generated by the machine. The natural frequencies of the stator core were calculated using modal analysis. The presence of the stator winding and the housing was neglected, thus the obtained natural frequencies were lower than the measured frequencies. Due to this simplification, the obtained values of resonance frequencies were lower than the actual resonance frequencies obtained from the measurement. However, the NVH behavior of the machine was properly modeled. Despite the simplified machine model used, the simulation provided valuable information about the NVH behavior of the machine. It was proven that the rotational speed of the rotor has the biggest impact on the noise and vibration of the machine. The vibration of the stator structure is caused by the variation of the radial magnetic forces. However, it was shown that the amplitude of the radial forces has a lower impact on the noise and vibration than the frequency of these forces. Additionally, the non-uniform axial distribution of radial forces on the stator inner surface caused by the rotor skew affects the vibration of the machine.

Author Contributions

Conceptualization, A.D.; methodology A.D. and A.P.; validation, A.D., A.P., C.M. and M.S.; investigation, A.D. and A.P.; writing—original draft preparation, A.D. writing—review and editing, A.D., C.M. and M.S.; supervision, M.S. and C.M. All authors have read and agreed to the published version of the manuscript.

Funding

This article is financed by the Polish National Agency for Academic Exchange as part of the ACADEMIC INTERNATIONAL PARTNERSHIPS PROGRAM Project title: EMMAT E-mobility, Sustainable Materials and Technologies Project no. PPI/APM/2018/1/00027.

Institutional Review Board Statement

Not applicable.

Informed Consent Statement

Not applicable.

Data Availability Statement

Not applicable.

Conflicts of Interest

The authors declare no conflict of interest.

References

  1. Tahi, S.; Ibtiouen, R.; Bounekhla, M. Design Optimization of Two Synchronous Reluctance Machine Structures with Maximized Torque and Power Factor. Prog. Electromagn. Res. 2011, 35, 369–387. [Google Scholar] [CrossRef] [Green Version]
  2. Zhou, E. Magnetic Circuit Analysis and Parametric Calculation of the new Type of Reluctance Motors. Sci. China Ser. A-Math. Phys. Astron. Technol. Sci. 1983, 26, 1218–1230. [Google Scholar]
  3. Lipo, T.A. Synchronous Reluctance Machines-A Viable Alternative for AC Drives? Electr. Mach. Power Syst. 1991, 19, 659–671. [Google Scholar] [CrossRef]
  4. Matsuo, T.; Lipo, T. Rotor design optimization of synchronous reluctance machine. IEEE Trans. Energy Convers. 1994, 9, 359–365. [Google Scholar] [CrossRef]
  5. Kolehmainen, J. Synchronous Reluctance Motor With Form Blocked Rotor. IEEE Trans. Energy Convers. 2010, 25, 450–456. [Google Scholar] [CrossRef]
  6. Rizk, J.; Nagrial, M.; Hellany, A. Optimum Design Parameters for Synchronous Reluctance Motors. In Proceedings of the 14th International Middle East Power Systems Conference (MEPCON’ 10), Cairo, Egypt, 19–21 December 2010. [Google Scholar]
  7. Vagati, A.; Canova, A.; Chiampi, M.; Pastorelli, M.; Repetto, M. Design refinement of synchronous reluctance motors through finite-element analysis. IEEE Trans. Ind. Appl. 2000, 36, 1094–1102. [Google Scholar] [CrossRef]
  8. Bacco, G.; Bianchi, N. Choice of flux-barriers position in synchronous reluctance machines. In Proceedings of the 2017 IEEE Energy Conversion Congress and Exposition (ECCE), Cincinnati, OH, USA, 1–5 October 2017; pp. 1872–1879. [Google Scholar]
  9. Barta, J.; Ondrusek, C. Rotor Design and Optimization of Synchronous Reluctance Machine. Sci. J. 2015, 9, 4738358. [Google Scholar] [CrossRef]
  10. Palmieri, M.; Perta, M.; Cupertino, F.; Pellegrino, G. Effect of the numbers of slots and barriers on the optimal design of synchronous reluctance machines. In Proceedings of the 2014 International Conference on Optimization of Electrical and Electronic Equipment (OPTIM), Bran, Romania, 22–24 May 2014; pp. 260–267. [Google Scholar]
  11. Oprea, C.; Dziechciarz, A.; Martis, C. Comparative analysis of different synchronous reluctance motor topologies. In Proceedings of the 2015 IEEE 15th International Conference on Environment and Electrical Engineering (EEEIC), Rome, Italy, 10–13 June 2015; pp. 1904–1909. [Google Scholar]
  12. Saucy, H.; Dupont, J.-B.; Bouvet, P. Noise radiated by electric motors: Simulation process and overview of the optimization approaches. In Proceedings of the 32nd Electric Vehicle Symposium (EVS32), Lyon, France, 19–22 May 2019. [Google Scholar]
  13. Verma, S.P. Noise and vibrations of electrical machines and drives; their production and means of reduction. In Proceedings of the International Conference on Power Electronics, Drives and Energy Systems for Industrial Growth, New Delhi, India, 8–11 January 1996. [Google Scholar]
  14. Kumar, D.; Sambharam, T.; Kottalgi, S.; Mandloi, P.; Kesarkar, O. Electric Vehicle Powertrain Multiphysics NVH Simulation. In Proceedings of the IECON 2018-44th Annual Conference of the IEEE Industrial Electronics Society, Washington, DC, USA, 21–23 October 2018. [Google Scholar]
  15. Gao, B.; O’Boy, D.J.; Mavros, G. Real-Time Sound and Vibration Modelling for Electric Motor. In Proceedings of the Noise and Vibration Conference & Exhibition, Grand Rapids, MI, USA, 7–10 September 2021. [Google Scholar]
  16. Saito, A.; Kuroishi, M.; Nakai, H. Vibration Prediction Method of Electric Machines by using Experimental Transfer Function and Magnetostatic Finite Element Analysis. J. Phys. Conf. Ser. 2016, 744, 012088. [Google Scholar] [CrossRef] [Green Version]
  17. Sarrazin, M.; Gillijns, S.; Anthonis, J.; Janssens, K.; van der Auweraer, H.; Verhaeghe, K. NVH analysis of a 3 phase 12/8 SR motor drive for HEV applications. In Proceedings of the 2013 World Electric Vehicle Symposium and Exhibition (EVS27), Barcelona, Spain, 17–20 November 2013. [Google Scholar]
  18. Kotter, P.; Oliver, Z.; Konrad, W. Efficient Noise-Vibration-Harshness Modelling of Servo- and Traction Drives. IFAC-PapersOnLine 2016, 49, 330–338. [Google Scholar] [CrossRef]
  19. Khadersab, A.; Gandhi, S.; Joshi, M.; Dargad, D. Modal Analysis of an Electric Motor Casing-In Comparison with FFT Analyzer. Int. J. Eng. Res. Technol. 2014, 3, IJERTV3IS031520. [Google Scholar]
  20. Li, H.; Zhang, D.; Xu, P.; Cao, C.; Hu, N.; Yan, X.; Song, Z.; Hu, Z. Analysis on the vibration modes of the electric vehicle motor stator. Vibroengineering Procedia 2019, 22, 81–86. [Google Scholar] [CrossRef]
  21. Robert, H.; Annabel, S.; Melanie, M.; Barry, J. Integrated approach to NVH analysis in electric vehicle drivetrains. In Proceedings of the 9th International Conference on Power Electronics, Machines and Drives (PEMD 2018), Liverpool, UK, 17–19 April 2019. [Google Scholar]
  22. Sathyan, S.; Aydin, U.; Belahcen, A. Acoustic Noise Computation of Electrical Motors Using the Boundary Element Method. Energies 2020, 13, 245. [Google Scholar] [CrossRef] [Green Version]
  23. Samani, N.; Ganji, B. Noise reduction of switched reluctance motors. In Proceedings of the 2017 8th Power Electronics, Drive Systems & Technologies Conference (PEDSTC), Mashhad, Iran, 14–16 February 2017; pp. 300–304. [Google Scholar] [CrossRef]
  24. Chauvicourt, F.; Faria, C.; Dziechciarz, A.; Martis, C. Influence of Rotor Geometry on NVH Behavior of Synchronous Reluctance Machine. In Proceedings of the 2015 Tenth International Conference on Ecological Vehicles and Renewable Energies (EVER 2015), Grimaldi Forum, Larotto, Monaco, 31 March–2 April 2015. [Google Scholar]
  25. Deng, C.; Deng, Q.; Liu, W.; Yu, C.; Hu, J.; Li, X. Analysis of Vibration and Noise for the Powertrain System of Electric Vehicles under Speed-Varying Operating Conditions. Math. Probl. Eng. 2020, 2020, 6617291. [Google Scholar] [CrossRef]
  26. Khadersab, A. Modal Analysis of Electric Motor Casing. Int. J. Eng. Res. 2014. [Google Scholar]
  27. Zhang, Z.; Yaman, S.; Mohamad, S.; Suryadev, S.; Chengxiu, C.; Mahesh, K. Effectiveness of Power Electronic Controllers in Mitigating Acoustic Noise and Vibration in High-Rotor Pole SRMs. Energies 2021, 14, 702. [Google Scholar] [CrossRef]
Figure 1. Normal modes of stator’s structure: (a,b) first mode—928 Hz; (c,d) second mode—2485 Hz; (e,f) fourth mode—4433 Hz.
Energies 15 02785 g001
Figure 2. Radial forces acting on the inner surface of the stator: machine with skew (left) and machine without skew (right).
Energies 15 02785 g002
Figure 3. Radial forces acting on the stator with skewed rotor (left), points on the stator where the radial forces were measured (right).
Energies 15 02785 g003
Figure 4. Magnetic field in machine: (a) flux lines for d-axis MMF—0 degrees current angle; (b) flux lines for q-axis MMF—90 degrees current angle.
Energies 15 02785 g004
Figure 5. Vibration of the stator at specific point for two different current angles at two rotational speeds: 600 rpm (left) and 4500 rpm (right).
Energies 15 02785 g005
Figure 6. Vibrations of stator’s structure measured in three points for machine with skewed rotor: (a) 1800 rpm; (b) 2400 rpm; (c) 4500 rpm; and (d) 8000 rpm.
Energies 15 02785 g006
Figure 7. Cross section of SynRM’s final topology.
Energies 15 02785 g007
Figure 8. Mechanical coupling of the SynRM with induction machine (left), SynRM in a test bench (right).
Energies 15 02785 g008
Figure 9. Vibration sensors’ placement and water-cooling connection.
Energies 15 02785 g009
Figure 10. Test bench system diagram.
Energies 15 02785 g010
Figure 11. Vibration in three points on the machine.
Energies 15 02785 g011
Figure 12. Vibration measured at 8 kHz switching frequency.
Energies 15 02785 g012
Figure 13. Vibration measured at 10 kHz switching frequency.
Energies 15 02785 g013
Figure 14. Vibration measured at 12 kHz switching frequency.
Energies 15 02785 g014
Figure 15. FFT of vibration signal at 8 kHz switching frequency—dB scale.
Energies 15 02785 g015
Figure 16. Vibration signal frequency spectrum with natural mode frequencies marked.
Energies 15 02785 g016
Figure 17. Comparison of acoustic signal frequency spectrum.
Energies 15 02785 g017
Figure 18. Vibration of the machine at 45 deg current angle: (a) 1000 rpm and 20 Nm; (b) 1000 rpm and 60 Nm; (c) 4500 rpm and 20 Nm; (d) 4500 rpm and 60 Nm.
Energies 15 02785 g018
Figure 19. Vibration of the machine at various rotational speeds at 45 deg current angle: (a) 20 Nm—time waveform; (b) 60 Nm—time waveform; (c) 20 Nm—FFT; (d) 60 Nm—FFT; (e) 20 Nm—power spectrum; (f) 60 Nm—power spectrum.
Energies 15 02785 g019
Figure 20. Vibration of the machine at various loads at 45 deg current angle: (a) 1000 rpm—time waveform; (b) 4500 rpm—time waveform; (c) 1000 rpm—FFT; (d) 4500 rpm—FFT; (e) 1000 rpm—power spectrum; (f) 4500 rpm—power spectrum.
Energies 15 02785 g020
Figure 21. Vibration of the machine at various current angles: (a) 1000 rpm—time waveform; (b) 3000 rpm—time waveform; (c) 1000 rpm—FFT; (d) 3000 rpm—FFT; (e) 1000 rpm—power spectrum; (f) 3000 rpm—power spectrum.
Energies 15 02785 g021
Figure 22. Power spectrum of noise signal measured by two different microphones—next to the machine (red) and 1.5 m above the machine (green) at 45 deg current angle: (a) 1000 rpm 20 Nm; (b) 1000 rpm 60 Nm; (c) 4500 rpm 20 Nm; and (d) 4500 rpm 60 Nm.
Energies 15 02785 g022
Figure 23. Noise at different rotational speeds at 20 Nm load at 45 deg current angle: microphone next to the machine (left) and hung 1.5 m above (right).
Energies 15 02785 g023
Figure 24. Noise at different rotational speeds at 45 deg current angle: (a) 1000 rpm microphone next to the machine; (b) 1000 rpm microphone 1.5 m above the machine; (c) 4500 rpm microphone next to the machine; (d) 4500 rpm microphone 1.5 m above the machine.
Energies 15 02785 g024
Figure 25. Noise power spectrum at different current angles at 1000 rpm (left) and 3000 rpm (right).
Energies 15 02785 g025
Figure 26. Comparison of measured (left) and calculated (right) vibration signal.
Energies 15 02785 g026
Table 1. Test bench specification.
Range of Voltage0–400 VAC/0–600 VDC
Maximum current200 A (for 2-phase SRM and 3-phase AC machines)
100 A (for 4-phase SRM and 5-phase AC machines)
Rated power29 kW
Max power89 kW
Rated speed4000 rpm
Max speed12,000 rpm
Max torque320 Nm
Measured signals
  • Currents
  • Voltages
  • Torque
  • Speed
  • Noise
  • Vibration
  • Temperature
Table 2. SynRM’s main dimensions.
Active axial length145 mm
Air gap0.45 mm
Stator outer diameter205 mm
Stator inner diameter131 mm
Rotor diameter130 mm
Shaft diameter45 mm
Table 3. Vibration sensor’s parameters.
Sensitivity (±10%)10.2 mV/(m/s2)
Measurement range±490 m/s2 pk
Frequency range (±5%)0.5 to 3000 Hz
Resonant frequency≥40 kHz
Phase response (±5°) (at 21 °C)2 to 3000 Hz
Broadband resolution (1 to 10,000 Hz)0.0015 m/s2 rms
Non-linearity≤1%
Transverse sensitivity≤5%
Table 4. Microphone’s parameters.
Frequency range (±1 dB)10 to 25 kHz
Frequency range (±2 dB)5 to 70 kHz
Dynamic range lower limit with GRAS preamplifier44 dB(A)
Dynamic range upper limit with GRAS CCP preamplifier168 dB
Set sensitivity @ 250 Hz (±3 dB)1.45 mV/Pa
Output impedance<50 Ω
Temperature range, operation−30 to 85/−22 to 185 °C/°F
Table 5. Motor phase current RMS values for various load and current angles at different rotational speeds.
Current AngleRotational SpeedTorque
20 Nm30 Nm40 Nm50 Nm60 Nm70 Nm
40 deg1000 rpm63 A80 A108 A132 A162 A190 A
1500 rpm60 A78 A107 A130 A160 A184 A
2000 rpm58 A77 A97 A122 A150 A172 A
3000 rpm57 A76 A97 A126 A141 A159 A
4500 rpm56 A76 A96 A120 A143 A158 A
45 deg1000 rpm58 A77 A104 A126 A153 A176 A
1500 rpm58 A78 A98 A124 A151 A169 A
2000 rpm58 A77 A94 A122 A148 A161 A
3000 rpm57 A76 A97 A120 A142 A162 A
4500 rpm61 A80 A108 A130 A149 A164 A
50 deg1000 rpm59 A76 A101 A124 A149 A177 A
1500 rpm64 A78 A103 A123 A148 A173 A
2000 rpm60 A81 A105 A124 A151 A164 A
3000 rpm60 A83 A116 A137 A161 A182 A
4500 rpm89 A121 A171 A197 A
60 deg1000 rpm65 A83 A108 A133 A162 A182 A
1500 rpm66 A91 A117 A144 A176 A187 A
2000 rpm77 A106 A128 A158 A180 A192 A
3000 rpm110 A160 A184 A
4500 rpm118 A163 A190 A
Table 6. Machine’s normal modes frequencies comparison.
OvalizationTriangularSquare
Simulation928 Hz2485 Hz4433 Hz
Measurement1166 Hz2866 Hz4451 Hz
Publisher’s Note: MDPI stays neutral with regard to jurisdictional claims in published maps and institutional affiliations.

