
Exergetic Analysis of DME Synthesis from CO2 and Renewable Hydrogen

 ,
,  , and
, and
Abstract
:1. Introduction
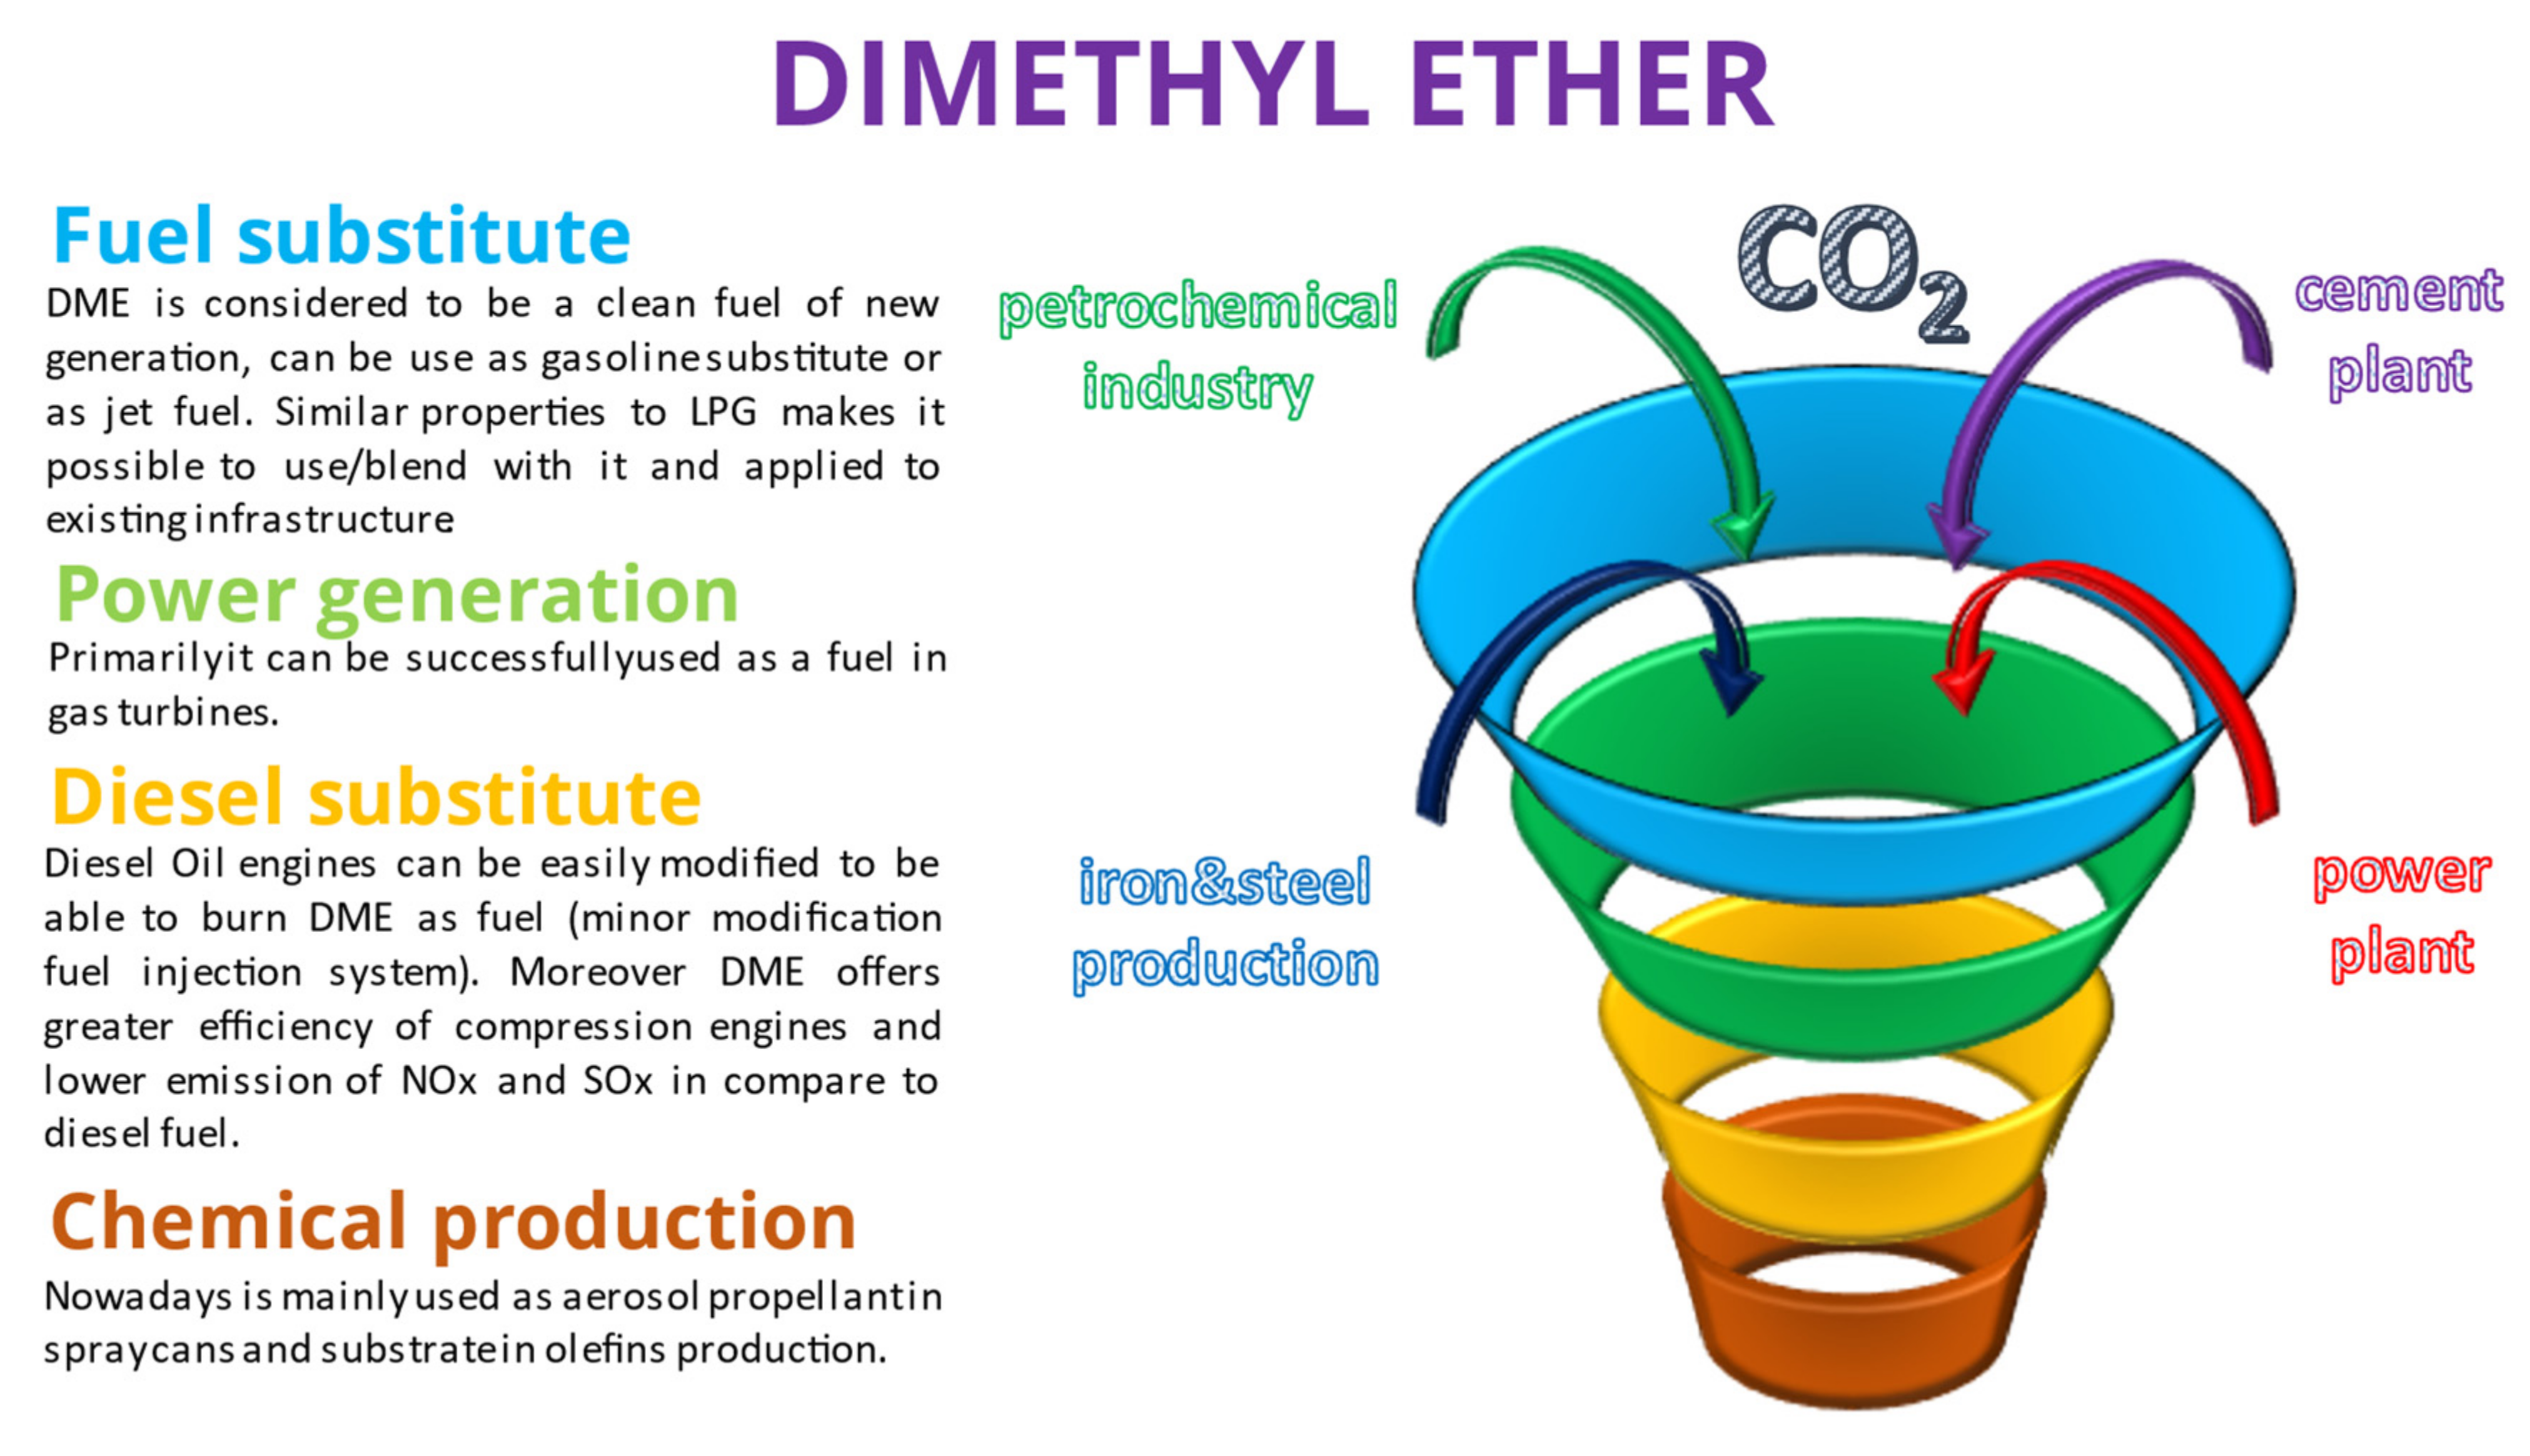
State-of-the-Art Production of DME/Methanol from Green Hydrogen and CO2
2. Systems Description
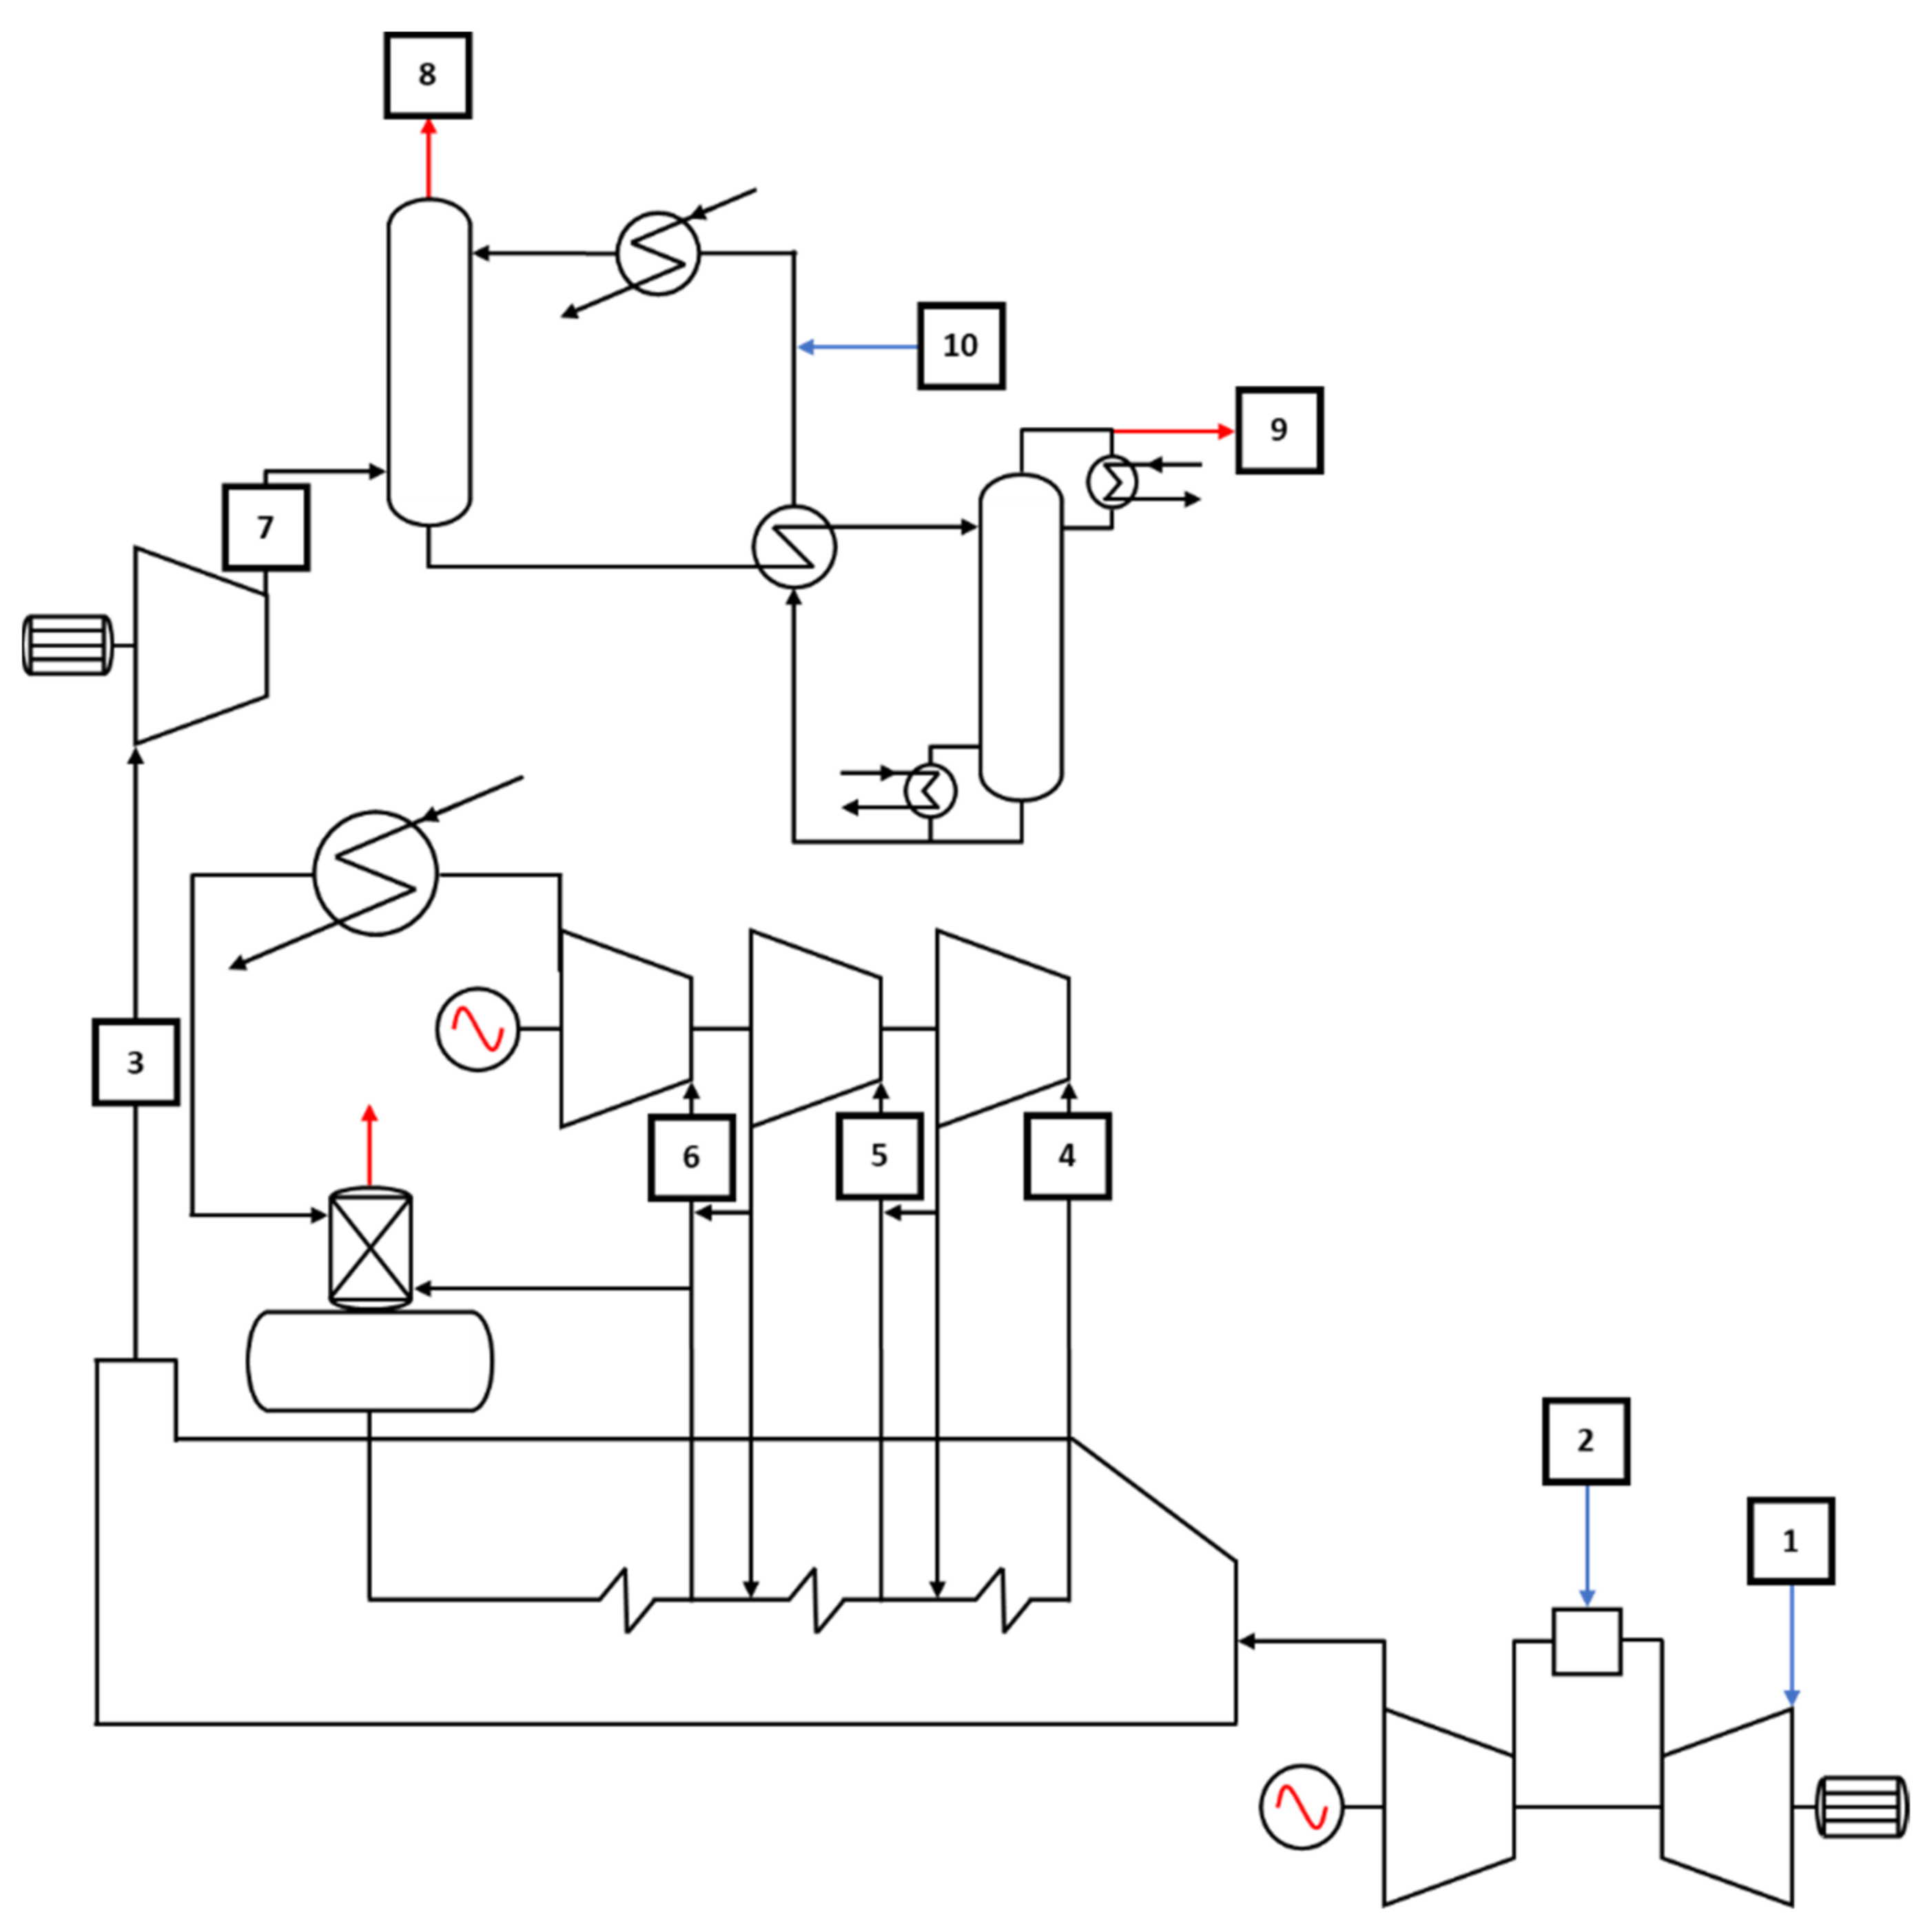
2.1. Power Plant and Post Combustion Carbon Capture
- 4.6 bar, low pressure (LP);
- 40 bar, intermediate pressure (IP);
- 150 bar, high pressure (HP).
2.2. Underground Storage
2.3. DME Production Plant
3. Assumptions and Methodology
4. Results and Discussion
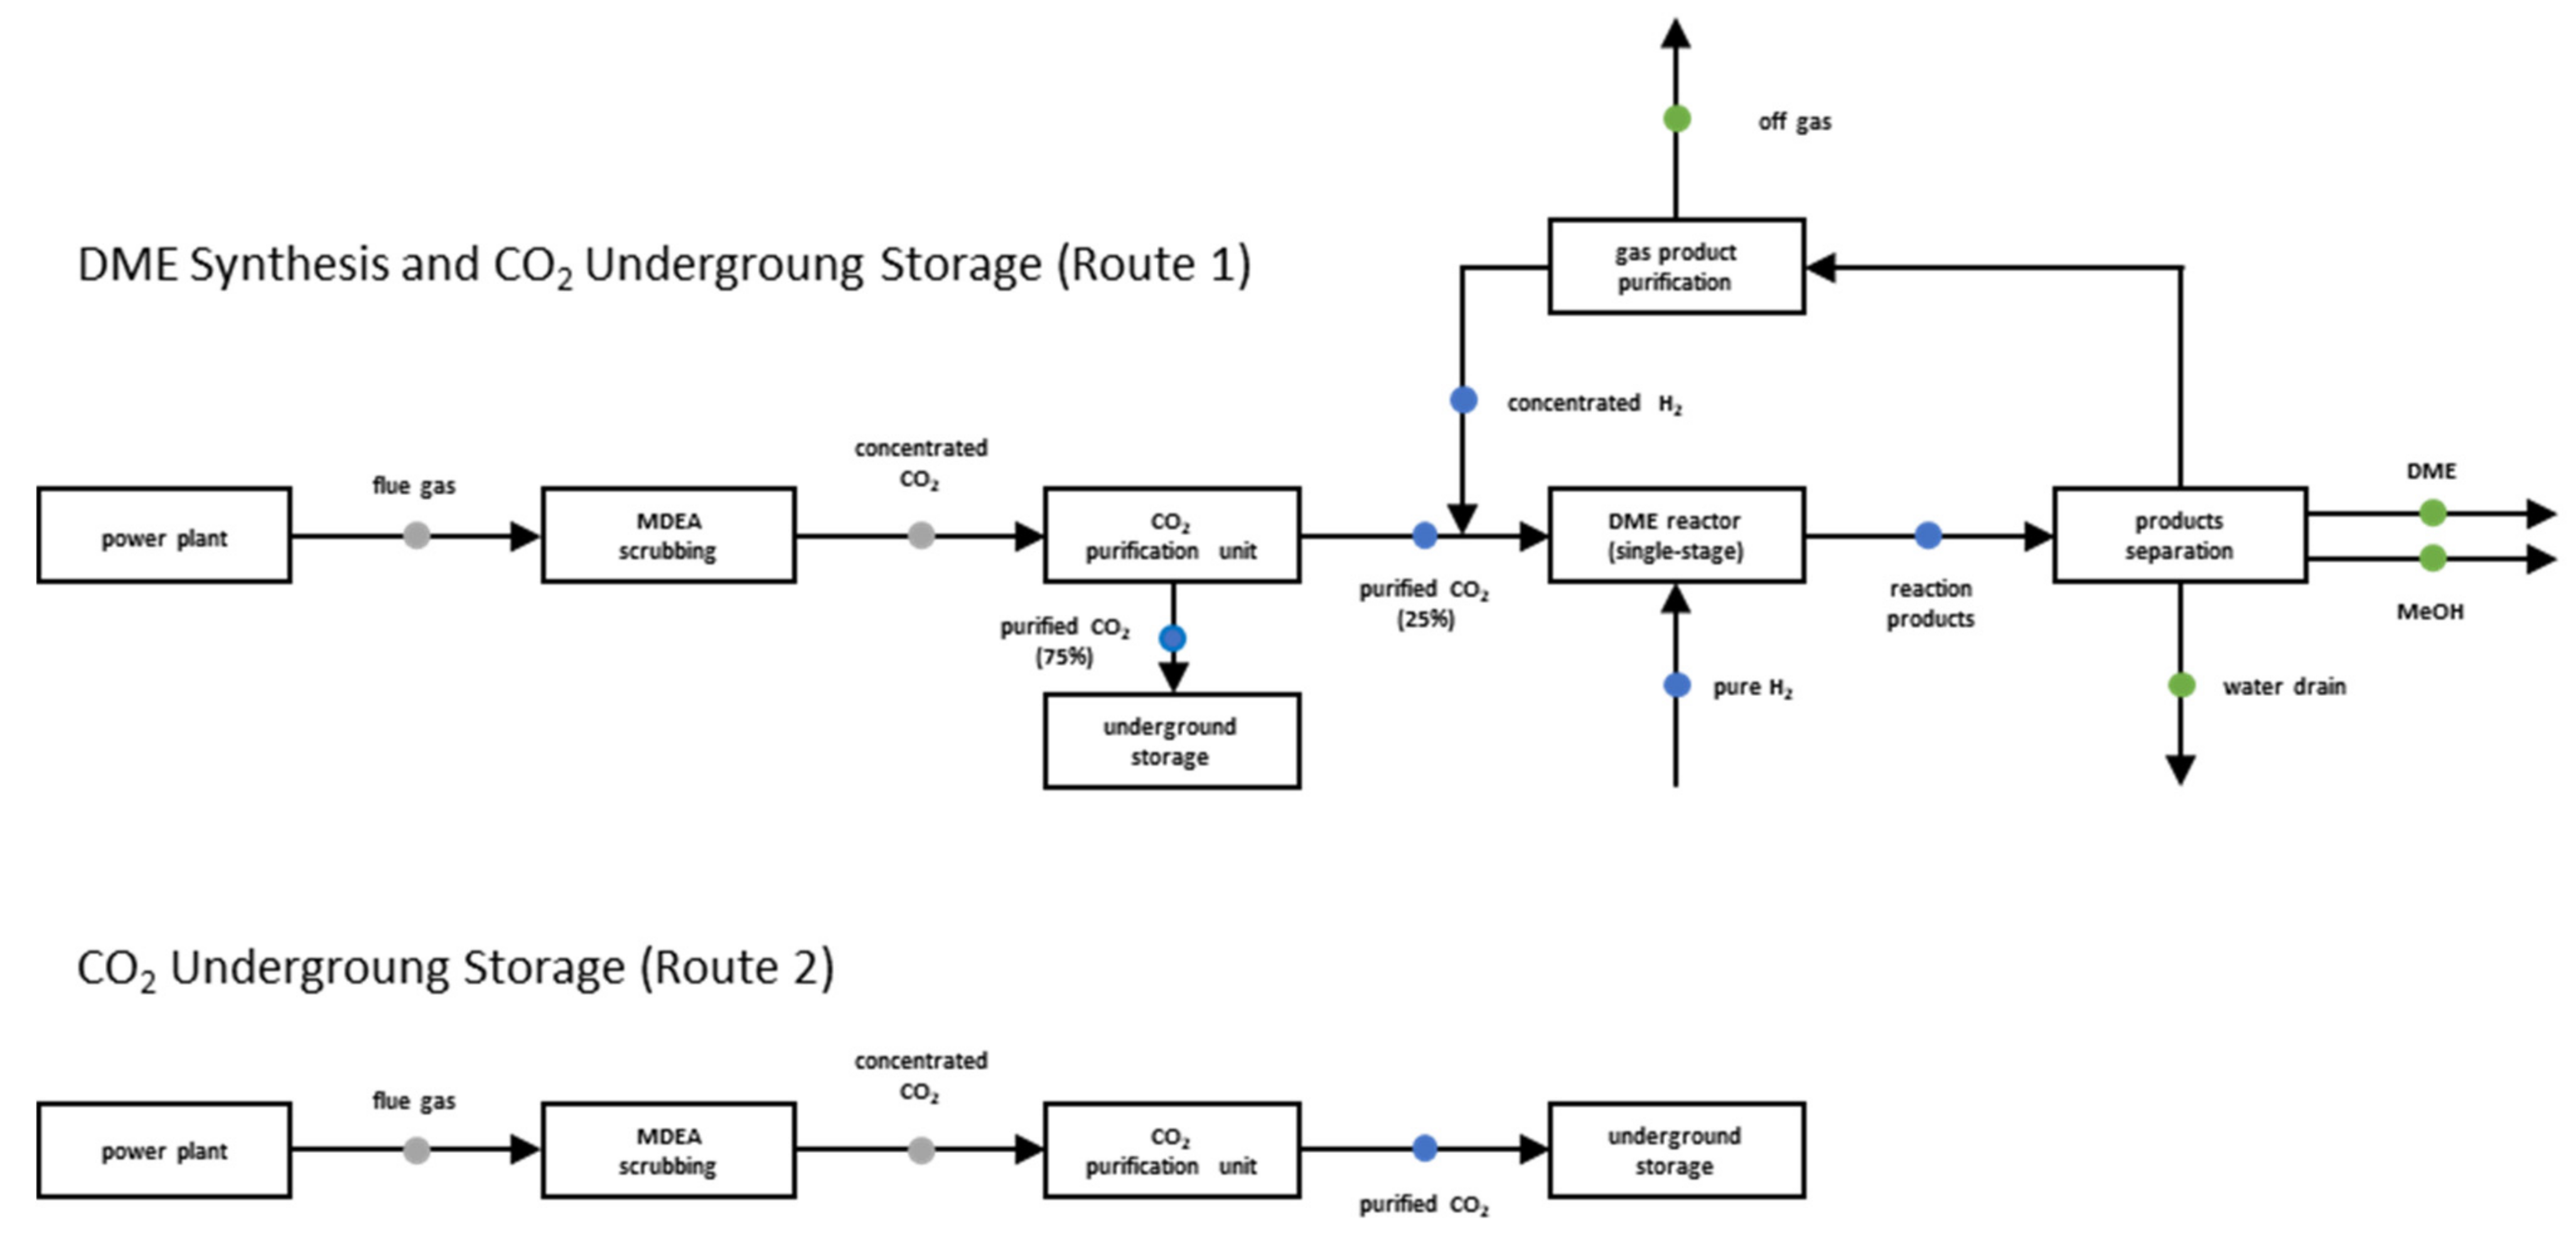
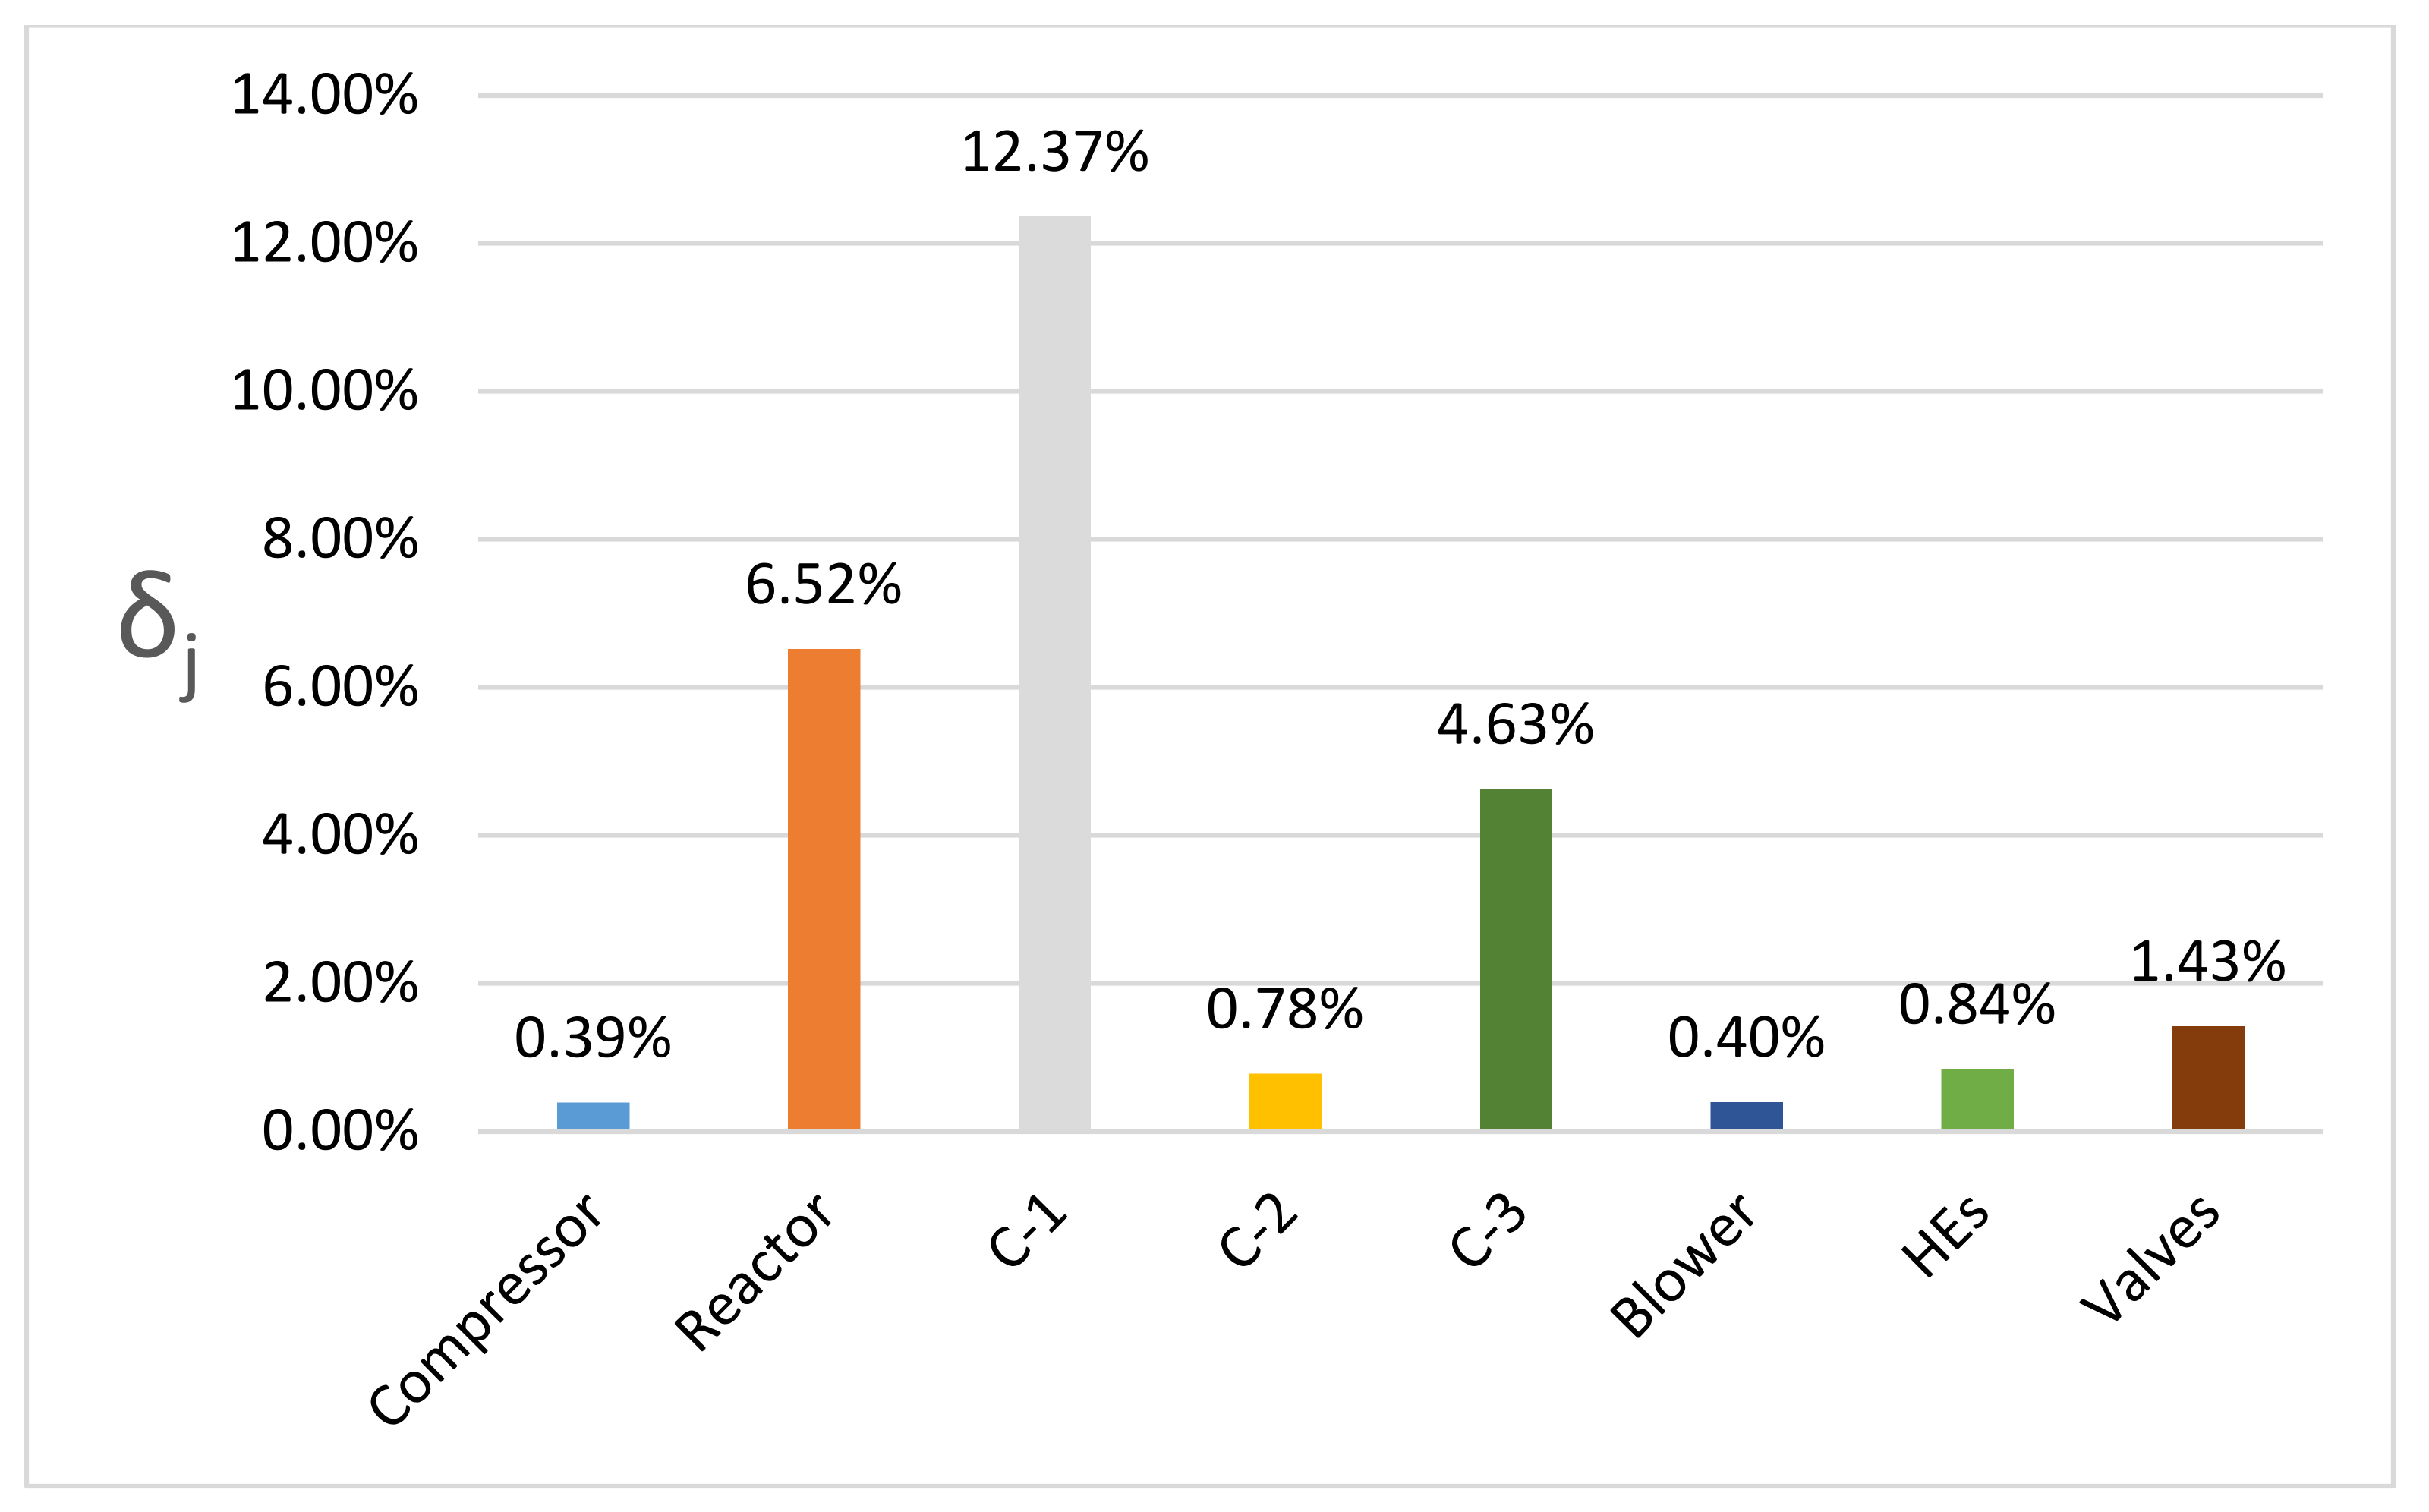
4.1. DME Synthesis and CO2 Underground Storage Configuration (Route 1)
4.2. Comparison with CO2 Underground Storage (Route 2)
5. Conclusions
Author Contributions
Funding
Conflicts of Interest
Nomenclature
| DME | Dimethyl Ethanol |
| MeOH | Methanol |
| NGCC | Natural Gas Combined Cycle |
| PCCC | Post-Combustion Carbon Capture |
| HRSG | Heat Recovery Steam Generator |
| HP | High-Pressure Level |
| IP | Intermediate-Pressure Level |
| LP | Low-Pressure Level |
| GT | Gas Turbine |
| HT | High-Pressure Turbine |
| IT | Intermediate-Pressure Turbine |
| LT | Low-Pressure Turbine |
| C-x | Distillation Column number x |
| HEx | Heat Exchanger number x |
| H/C | Hydrogen to Carbon ratio |
| COP | Coefficient of Performance |
| EG | Energy Gain |
| Exergy flow rate of i-th material stream | |
| Physical Exergy flow rate of i-th material stream | |
| Chemical Exergy flow rate of i-th material stream | |
| Desytroyed Exergy flow rate in the j-th component | |
| Fuel Exergy flow rate to the j-th component | |
| Product Exergy flow rate of the j-th component | |
| Specific Mass Exergy | |
| Mass flow rate | |
| Mass flow rate of avoided CO2 | |
| Destroyed Exergy to Fuel Exergy ratio for the j-th component | |
| Specific Destroyed Exergy in the j-th component | |
| Destroyed exergy per avoided carbon emissions | |
| Exergetic Efficiency | |
| T | Temperature |
| P | Pressure |
References
- Majchrzak-Kucęba, I.; Szymanek, P. CCU Technologies in the Green Economy. Eng. Prot. Environ. 2018, 21, 261–271. [Google Scholar] [CrossRef]
- Catizzone, E.; Bonura, G.; Migliori, M.; Frusteri, F.; Giordano, G. CO2 recycling to dimethyl ether: State-of-the-art and perspectives. Molecules 2018, 23, 31. [Google Scholar] [CrossRef] [PubMed] [Green Version]
- Masson-Delmotte, V.P.; Zhai, A.; Pirani, S.L.; Connors, C.; Péan, S.; Berger, N.; Caud, Y.; Chen, L.; Goldfarb, M.I.; Gomis, M.; et al. The Physical Science Basis. Contribution of Working Group I to the 552 Sixth Assessment Report of the Intergovernmental Panel on Climate Change; Cambridge University Press: Cambridge, UK; New York, NY, USA, 2021. [Google Scholar]
- Hasan, M.M.F.; First, E.L.; Boukouvala, F.; Floudas, C.A. A multi-scale framework for CO2 capture, utilization, and sequestration: CCUS and CCU. Comput. Chem. Eng. 2015, 81, 2–21. [Google Scholar] [CrossRef] [Green Version]
- Koytsoumpa, E.I.; Bergins, C.; Kakaras, E. The CO2 economy: Review of CO2 capture and reuse technologies. J. Supercrit. Fluids 2018, 132, 3–16. [Google Scholar] [CrossRef]
- Leung, D.Y.C.; Caramanna, G.; Maroto-Valer, M.M. An overview of current status of carbon dioxide capture and storage technologies. Renew. Sustain. Energy Rev. 2014, 39, 426–443. [Google Scholar] [CrossRef] [Green Version]
- Chauvy, R.; De Weireld, G. CO2 Utilization Technologies in Europe: A Short Review. Energy Technol. 2020, 8, 2000627. [Google Scholar] [CrossRef]
- Dieterich, V.; Buttler, A.; Hanel, A.; Spliethoff, H.; Fendt, S. Power-to-liquid via synthesis of methanol, DME or Fischer–Tropsch-fuels: A review. Energy Environ. Sci. 2020, 13, 3207–3252. [Google Scholar] [CrossRef]
- Lee, D.; Lee, J.S.; Kim, H.Y.; Chun, C.K.; James, S.C.; Yoon, S.S. Experimental study on the combustion and no x emission characteristics of DME/LPG blended fuel using counterflow burner. Combust. Sci. Technol. 2012, 184, 97–113. [Google Scholar] [CrossRef]
- Kim, H.J.; Suh, H.K.; Park, S.H.; Lee, C.S. An experimental and numerical investigation of atomization characteristics of biodiesel, dimethyl ether, and biodiesel-ethanol blended fuel. Energy Fuels 2008, 22, 2091–2098. [Google Scholar] [CrossRef]
- Wang, S.; Fu, Z. Thermodynamic and economic analysis of solar assisted CCHP-ORC system with DME as fuel. Energy Convers. Manag. 2019, 186, 535–545. [Google Scholar] [CrossRef]
- Cheng, C.; Zhang, H.; Ying, W.; Fang, D. Intrinsic kinetics of one-step dimethyl ether synthesis from hydrogen-rich synthesis gas over bi-functional catalyst. Korean J. Chem. Eng. 2011, 28, 1511–1517. [Google Scholar] [CrossRef]
- Zhang, Y.; Zhang, S.; Benson, T. A conceptual design by integrating dimethyl ether (DME) production with tri-reforming process for CO2 emission reduction. Fuel Process. Technol. 2015, 131, 7–13. [Google Scholar] [CrossRef]
- Catizzone, E.; Freda, C.; Braccio, G.; Frusteri, F.; Bonura, G. Dimethyl ether as circular hydrogen carrier: Catalytic aspects of hydrogenation/dehydrogenation steps. J. Energy Chem. 2021, 58, 55–77. [Google Scholar] [CrossRef]
- Bonura, G.; Todaro, S.; Frusteri, L.; Majchrzak-Kucęba, I.; Wawrzyńczak, D.; Pászti, Z.; Tálas, E.; Tompos, A.; Ferenc, L.; Solt, H.; et al. Inside the reaction mechanism of direct CO2 conversion to DME over zeolite-based hybrid catalysts. Appl. Catal. B Environ. 2021, 294, 120255. [Google Scholar] [CrossRef]
- Baena-Moreno, F.M.; Gonzalez-Castaño, M.; Arellano-García, H.; Reina, T.R. Exploring profitability of bioeconomy paths: Dimethyl ether from biogas as case study. Energy 2021, 225, 120230. [Google Scholar] [CrossRef]
- Im-orb, K.; Arpornwichanop, A. Comparative techno-economic assessment of bio-methanol and bio-DME production from oil palm residue. Energy Convers. Manag. 2022, 258, 115511. [Google Scholar] [CrossRef]
- Ott, J.; Gronemann, V.; Pontzen, F.; Fiedler, E.; Grossmann, G.; Kersebohm, B.; Weiss, G.; Witte, C. Methanol. In Ullmann’s Encyclopedia of Industrial Chemistry; Wiley-VCH Verlag GmbH & Co.: Berlin, Germany, 2012. [Google Scholar]
- Kang, S.; Boshell, F.; Goeppert, A.; Prakash, S.G.; Landälv, I. Innovation Outlook: Renewable Methanol; IRENA: Abu Dhabi, United Arab Emirates, 2021. [Google Scholar]
- Müller, M.; Hübsch, U. Dimethyl Ether. In Ullmann’s Encyclopedia of Industrial Chemistry; Wiley-VCH Verlag GmbH & Co.: Berlin, Germany, 2000. [Google Scholar]
- PubChem. Available online: https://pubchem.ncbi.nlm.nih.gov/compound/Methane (accessed on 17 February 2022).
- Trafigura. Available online: https://www.trafigura.com/media/1687/en_sds_fuel-diesel-vgo_cas-68334-30-5.pdf (accessed on 17 February 2021).
- Speight, J.G. Handbook of Petroleum Product Analysis; Wiley: Hoboken, NJ, USA, 2015; Volume 53. [Google Scholar]
- Barbato, L.; Iaquaniello, G.; Mangiapane, A. Reuse of CO2 to Make Methanol Using Renewable Hydrogen. In CO2: A Valuable Source of Carbon; De Falco, M., Iaquaniello, G., Centi, G., Eds.; Green Energy and Technology; Springer: London, UK, 2013. [Google Scholar] [CrossRef]
- Hobson, C.; Marquez, C. Renewable Methanol Report; Methanol Institute: Brussels, Belgium, 2018. [Google Scholar]
- Huang, C.H.; Tan, C.S. A Review: CO2 Utilization. Aerosol Air Qual. Res. 2014, 14, 480–499. [Google Scholar] [CrossRef] [Green Version]
- de Falco, M.; Iaquaniello, G.; Centi, G. CO2: A Valuable Source of Carbon; Green Energy and Technology; Springer: London, UK, 2013; Volume 137. [Google Scholar] [CrossRef]
- Scott, K. Sustainable and Green Electrochemical Science and Technology; John Wiley and Sons Ltd.: Hoboken, NJ, USA, 2016. [Google Scholar]
- Pérez-Fortes, M.; Schöneberger, J.C.; Boulamanti, A.; Tzimas, E. Methanol synthesis using captured CO2 as raw material: Techno-economic and environmental assessment. Appl. Energy 2016, 161, 718–732. [Google Scholar] [CrossRef]
- RWE. Available online: https://www.rwe.com/en/press/rwe-power/2019-05-28-niederaussem-becomes-the-setting-for-important-technological-progress (accessed on 22 February 2022).
- MefCO2. Available online: http://www.mefCO2.eu/ (accessed on 21 February 2022).
- Freyr, Ó.; Magistri, L.; Licozar, B.; Diaz, A.S. Green Methanol for a Green Future. MefCO2. 2020. Available online: http://www.mefco2.eu/news/green-methanol-for-a-green-future.php (accessed on 23 February 2022).
- Fernández-González, J.; Rumayor, M.; Domínguez-Ramos, A.; Irabien, A. Hydrogen Utilization in the Sustainable Manufacture of CO2-Based Methanol. Ind. Eng. Chem. Res. 2022. [Google Scholar] [CrossRef]
- European Commission. Available online: https://cordis.europa.eu/article/id/257671-energyintensive-sectors-can-be-part-of-low-carbon-transition (accessed on 21 February 2022).
- Ayala, P. Methanol Fuel from CO2. Synthesis of Methanol from Captured Carbon Dioxide Using Surplus Electricity. MefCO2. 13 September 2018. Available online: https://etipwind.eu/wp-content/uploads/MefCO2-slides.pdf (accessed on 23 February 2022).
- Danish Energy Agency Technology Data for Renewable Fuels. 2017. Available online: https://ens.dk/en/our-services/projections-and-models/technology-data/technology-data-renewable-fuels (accessed on 24 February 2022).
- Harp, G.; Tran, K.C.; Bergins, C.; Buddenberg, T.; Drach, I.; Sigurbjornsson, O. Application of Power to Methanol Technology to Integrated Steelworks for Profitability, Conversion Efficiency, and CO2 Reduction. In Proceedings of the METEC 2nd ESTAD, Düsseldorf, Germany, 15–19 June 2016. [Google Scholar]
- Andrei, B.D.; del Mar, P.F.M.; Evangelos, T.; Thea, S. Carbon Capture and Utilisation Workshop: Background and Proceedings; Publications Office of the European Union: Luxembourg, 2013. [Google Scholar]
- Carbon Recycling International Ltd. Available online: https://www.carbonrecycling.is/ (accessed on 22 February 2022).
- Mann, I. Deep Decarbonisation is Within Reach of Europe’s Industrial Regions. March 2021. Available online: https://www.alignccus.eu/news/align-ccus-findings-unveiled-deep-decarbonisation-within-reach-europe%E2%80%99s-industrial-regions (accessed on 24 February 2022).
- van Os, P. Accelerating low carbon industrial growth through carbon capture, utilization and storage (CCUS). Greenh. Gases Sci. Technol. 2018, 8, 994–997. [Google Scholar] [CrossRef]
- Moran, M.J.; Sciubba, E. Exergy Analysis: Principles and Practice. J. Eng. Gas Turbines Power 1994, 116, 285–290. [Google Scholar] [CrossRef]
- Mistry, K.H.; Lienhard, J.H. Generalized least energy of separation for desalination and other chemical separation processes. Entropy 2013, 15, 2046. [Google Scholar] [CrossRef] [Green Version]
- Bejan, A. Advanced Engineering Thermodynamics; John Wiley & Sons: Hoboken, NJ, USA, 2016. [Google Scholar]
- Olaleye, A.K.; Wang, M.; Kelsall, G. Steady state simulation and exergy analysis of supercritical coal-fired power plant with CO2 capture. Fuel 2015, 151, 57–72. [Google Scholar] [CrossRef]
- Olaleye, A.K.; Wang, M. Conventional and advanced exergy analysis of post-combustion CO2 capture based on chemical absorption integrated with supercritical coal-fired power plant. Int. J. Greenh. Gas Control 2017, 64, 246–256. [Google Scholar] [CrossRef]
- Blumberg, T.; Morosuk, T.; Tsatsaronis, G. Exergy-based evaluation of methanol production from natural gas with CO2 utilization. Energy 2017, 141, 2528–2539. [Google Scholar] [CrossRef]
- Nakyai, T.; Saebea, D. Energy and exergy analyses of dimethyl ether production using CO and CO2 hydrogenation. Int. J. Smart Grid Clean Energy 2019, 8, 544–549. [Google Scholar] [CrossRef]
- Farooqui, A.; Di Tomaso, F.; Bose, A.; Ferrero, D.; Llorca, J.; Santarelli, M. Techno-economic and exergy analysis of polygeneration plant for power and DME production with the integration of chemical looping CO2/H2O splitting. Energy Convers. Manag. 2019, 186, 200–219. [Google Scholar] [CrossRef]
- Fout, T.; Zoelle, A.; Keairns, D.; Turner, M.; Woods, M.; Kuehn, N.; Shah, V.; Chou, V.; Pinkerton, L. Cost and Performance Baseline for Fossil Energy Plants Volume 1a: Bituminous Coal (PC) and Natural Gas to Electricity Revision 3; National Energy Technology Laboratory (NETL): Pittsburgh, PA, USA; Morgantown, WV, USA, 2015; Volume 1a. [Google Scholar]
- De Falco, M.; Capocelli, M.; Giannattasio, A. Membrane Reactor for one-step DME synthesis process: Industrial plant simulation and optimization. J. CO2 Util. 2017, 22, 33–43. [Google Scholar] [CrossRef]
- Dincer, I.; Rosen, M.A.; Khalid, F. Ocean (Marine) Energy Production. In Comprehensive Energy Systems; Elsevier: Amsterdam, The Netherlands, 2018; Volumes 3–5. [Google Scholar]
- Perry, R.H.; Green, D.W. Perry’s Chemical Engineers’ Handbook, 8th ed.; McGraw-Hill: New York, NY, USA, 2013; Volume 53. [Google Scholar]
- Demirel, Y.; Sieniutycz, S. Nonequilibrium Thermodynamics: Transport and Rate Processes in Physical and Biological Systems. Appl. Mech. Rev. 2003, 56, 275–540. [Google Scholar] [CrossRef]
- Ertesvåg, I.S.; Kvamsdal, H.M.; Bolland, O. Exergy analysis of a gas-turbine combined-cycle power plant with precombustion CO2 capture. Energy 2005, 30, 5–39. [Google Scholar] [CrossRef]


| Properties | DME [20] | Methanol [18] | Methane * [21] | Diesel Fuel [22,23] |
|---|---|---|---|---|
| Molecular formula | C2H6O | CH3OH | CH4 | --- |
| CAS Number | 115-10-6 | 67-58-1 | 74-82-8 | 68334-30-5 |
| Molar mass (g/mol) | 46.07 | 32.04 | 16.04 | --- |
| Cetane number ** | 55 to 60 | ~5 | 0 | 40 to 55 |
| Melting point (°C) | −141 | −97.88 | −182.47 | −40 |
| Boiling point (°C) at 1 atm | −24.8 | 64.65 | −161.5 | 141 |
| Density at 25 °C and 1 atm (kg/m3) | 668.3 | 786.68 | 0.657 | 800–910 |
| Autoignition temperature (°C) | 235 | 440 | 537 | 250 |
| Miscible with water? | Yes | Yes | Yes | No |
| Miscible with organic solvents? *** | Yes | Yes | Yes | Yes |
| Operating Parameter | Value |
|---|---|
| Natural Gas Flow Rate (kg/h) | 50,000 |
| Air Flow Rate (kg/h) | 2,572,034 |
| Compressed Air Pressure (bar) | 18.2 |
| Gas Turbine Outlet Temperature (K) | 898 |
| Compressors Polytropic Coefficients | 0.9215–0.9315 |
| Compressors Mechanical Efficiency | 0.9 |
| Turbines Mechanical Efficiency | 0.9 |
| TG Isentropic Efficiency | 0.75 |
| Water Flow Rate (kg/h) | 169,197 |
| High Pressure (bar) | 150 |
| Intermediate Pressure (bar) | 40 |
| Low Pressure (bar) | 4.6 |
| HT Isentropic Efficiency | 0.92 |
| IP Isentropic Efficiency | 0.94 |
| LP Isentropic Efficiency | 0.88 |
| Condensing Temperature (K) | 311.5 |
| Net Power from Power Plant (MW) | 188.5 |
| Solvent | 40% MDEA (mass basis) |
| Absorber Pressure (bar) | 3.8 |
| Absorber Number of Stages | 10 |
| Stripper Pressure (bar) | 1.1 |
| Stripper Number of Stages | 5 |
| Stripper Reboiler | Kettle |
| Operating Parameter | Value |
|---|---|
| Interstage Temperature (K) | 303.15 |
| Stored CO2 Temperature (K) | 303.15 |
| Stored CO2 Pressure (bar) | 153 |
| Pressure Drop at the inter coolers (bar) | 0.2 |
| Operating Parameter | Value |
|---|---|
| Reactor Pressure (bar) | 30 |
| Reaction Temperature (K) | 473.15 |
| C-1 Pressure (bar) | 20.5 |
| C-1 Number of Stages | 15 |
| C-1 Condenser | Partial vapour |
| C-1 Reboiler | Kettle |
| C-2 Pressure (bar) | 19 |
| C-2 Number of Stages | 15 |
| C-2 Condenser | Partial vapour |
| C-2 Reboiler | Kettle |
| C-3 Pressure (bar) | 1.8 |
| C-3 Number of Stages | 15 |
| C-3 Condenser | Total |
| C-3 Reboiler | Kettle |
| COP | 3.14 |
| Component | EF | EP | |
|---|---|---|---|
| Distillation Column | 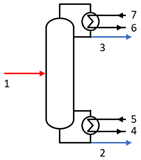 | E5 − E4 | E2 + E3 − E1 + E6 − E7 |
| Heat Exchanger | 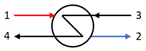 | E3 − E4 | E3 − E1 |
| Compressor | 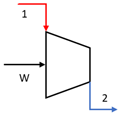 | E1 + W | E2 |
| Turbine |  | E1 | E2 + W |
| Reactor | 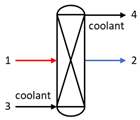 | E1 | E2 − E3 + E4 |
| Valve | 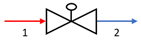 | E1 | E2 |
| No. | Fluid | Unit | ξ (kJ/kg) | m (kg/h) | T (K) | P (bar) |
|---|---|---|---|---|---|---|
| 1 | Natural Gas | Power Plant | 47,206 | 50,000 | 288.15 | 18.2 |
| 2 | Air | 0 | 2,572,034 | 298.15 | 1.013 | |
| 3 | Off Gas | 1.877 | 2,622,034 | 303.15 | 1.03 | |
| 4 | H-Steam | 1491 | 323,828 | 813.15 | 149.4 | |
| 5 | I-Steam | 1390 | 378,823 | 813.50 | 39.2 | |
| 6 | L-Steam | 719 | 168,047 | 489.37 | 3.4 | |
| 7 | Flue Gas | PCCC | 122 | 2,532,475 | 303.15 | 3.8 |
| 8 | Clean Gas | 114 | 2,410,825 | 303.15 | 3.8 | |
| 9 | Captured CO2 | 5.13 | 125,015 | 294.11 | 1.1 | |
| 10 | Make up | 1.36 | 3415 | 311.15 | 3.8 | |
| 11 | CO2 | Underground Storage | 4.75 | 89,288 | 294.11 | 1.1 |
| 12 | Liquefied CO2 | 223 | 89,288 | 303.15 | 153 | |
| 13 | CO2 | DME Production Plant | 4.62 | 29,780 | 294.11 | 1.1 |
| 14 | H2 | 120,000 | 3751.35 | 473.15 | 30 | |
| 15 | Reactants | 15,991 | 108,554 | 473.15 | 30 | |
| 16 | C-1 Feed | 15,586 | 108,554 | 440.63 | 21.3 | |
| 17 | C-2 Feed | 17,858 | 89,061 | 262.48 | 19.5 | |
| 18 | C-3 Feed | 4523.9 | 19,493 | 382.38 | 2.0 | |
| 19 | Off Gas | 6580.8 | 3931 | 251.58 | 1.3 | |
| 20 | DME | 26,662 | 10,444 | 343.10 | 19 | |
| 21 | MeOH | 19,497 | 3293.3 | 349.60 | 1.8 | |
| 22 | Dirty Water | 49.71 | 16,200 | 384.00 | 1.8 |
| Unit | (%) | (MJ/kg) | |
|---|---|---|---|
| Brayton–Joule Cycle | 277.90 | 45.57 | |
| Rankine Cycle | 108.96 | 50.05 | |
| PCCC | 150.23 | 36.96 | 40.80 |
| Underground Storage | 3.25 | 62.96 | 0.13 |
| DME Production Plant | 41.09 | 75.74 | 4.97 |
| No. | Fluid | Unit | ξ (kJ/kg) | m (kg/h) | T (K) | P (bar) |
|---|---|---|---|---|---|---|
| 11 | CO2 | Underground Storage | 4.75 | 119,068 | 294.11 | 1.1 |
| 12 | Liquefied CO2 | 223 | 119,068 | 303.15 | 153 |
| (%) | (MJ/kg) | Avoided CO2 | |
|---|---|---|---|
| Route 1 | 75.03 | 1.34 | 97.50% |
| Route 2 | 62.96 | 0.13 | 100% |
Publisher’s Note: MDPI stays neutral with regard to jurisdictional claims in published maps and institutional affiliations. |
© 2022 by the authors. Licensee MDPI, Basel, Switzerland. This article is an open access article distributed under the terms and conditions of the Creative Commons Attribution (CC BY) license (https://creativecommons.org/licenses/by/4.0/).
Share and Cite
De Falco, M.; Natrella, G.; Capocelli, M.; Popielak, P.; Sołtysik, M.; Wawrzyńczak, D.; Majchrzak-Kucęba, I. Exergetic Analysis of DME Synthesis from CO2 and Renewable Hydrogen. Energies 2022, 15, 3516. https://doi.org/10.3390/en15103516
De Falco M, Natrella G, Capocelli M, Popielak P, Sołtysik M, Wawrzyńczak D, Majchrzak-Kucęba I. Exergetic Analysis of DME Synthesis from CO2 and Renewable Hydrogen. Energies. 2022; 15(10):3516. https://doi.org/10.3390/en15103516
Chicago/Turabian StyleDe Falco, Marcello, Gianluca Natrella, Mauro Capocelli, Paulina Popielak, Marcelina Sołtysik, Dariusz Wawrzyńczak, and Izabela Majchrzak-Kucęba. 2022. "Exergetic Analysis of DME Synthesis from CO2 and Renewable Hydrogen" Energies 15, no. 10: 3516. https://doi.org/10.3390/en15103516
APA StyleDe Falco, M., Natrella, G., Capocelli, M., Popielak, P., Sołtysik, M., Wawrzyńczak, D., & Majchrzak-Kucęba, I. (2022). Exergetic Analysis of DME Synthesis from CO2 and Renewable Hydrogen. Energies, 15(10), 3516. https://doi.org/10.3390/en15103516