Abstract
The article presents experimental and numerical studies of bird models during impacts with rigid and deformable targets. The main aim of the studies is the validation of bird models in order to prepare them for the numerical simulation of bird impact against aircraft windshields and other parts of aircraft, thus improving the air transportation safety by providing cost-effective solutions for designing bird strike-resistant aircraft. The experimental investigations were conducted with a special set-up of a gas gun equipped with high-speed cameras, tensiometers and force sensors. The simulations were developed on the basis of LS-DYNA software by means of the SPH method for the bird model shape of the cylinder with hemispherical endings at the speed of 116 m/s. The results of studies into such things as the impact force, pressure and bird model deformation were compared. Moreover, the authors’ and other researchers’ results were assessed. It can be noted that the curves of the impact force obtained as a result of the numerical analysis correlated well with the experimental ones.
1. Introduction
Flight safety is a vital issue in the air transportation system. An aircraft is a base element of this system. One of the factors which significantly exerts a negative influence on the air transportation safety is the possibility of a collision of an aircraft with birds, in particular, at an airfield or in its vicinity. Various parts of an aircraft are subjected to damage. It goes without saying that damage to an engine, as well as the penetration of the windshield, is extremely dangerous. The consequence of a bird being sucked into an engine can be the engine shutting down, whereas the penetration of the canopy can cause a serious injury to the pilot, rendering them unable to continue piloting the aircraft [1,2,3,4,5,6,7,8].
In order to comply with certification requirements regarding the resistance of various parts of an aircraft to bird impacts, compulsory experimental tests have to be conducted [9,10].
Generally, experimental tests can be divided into two groups, the first concerns the validation of bird models based on impacting them into a rigid plate and the second group concerns impacting the substitute bird into various parts of an aircraft in order to meet EASA or FAA safety requirements [11,12,13,14,15,16,17,18].
Barber and Wilbeck were some of the first researchers to conduct a series of experimental studies dedicated to the analyses of different parameters, such as Hugoniot pressure, steady flow pressure, mass, density and the porosity of bird models whilst firing substitute birds into rigid flat targets [17,18].
In those studies, artificial bird models were built with various materials, including beef, neoprene, rubber, gelatin and porous gelatin [17]. They all had the shape of a cylinder, but they differed in mass and density. The researchers had chosen a cylindrical rightened geometry for the projectile due to the possibility of comparing their results with the results of previous studies.
One of the goals of the experiments was to determine the material properties that best reflect the behavior of the bird’s actual body during impact. For this purpose, the pressure distribution was expressed as a function of pressure value and time, depending on the material. It was found that a projectile made of gelatin with a porosity of 10% reflects the properties of a real bird the most accurately. Moreover, it was determined that at a high velocity of impact, the gelatin projectile behaves like water in high stress. Therefore, during the numerical modeling of birds, the material properties of water were assumed [19].
Since tests conducted on the subject often constitute a manufacture’s trade secret, the number of available papers regarding experimental tests of bird strikes is very limited. An example can be the tests of the Group for Aeronautical Research and Technology in Europe, whose results have not been published [19]. Nonetheless, the studies of other investigators, such as Lavoie et al. [20], who studied the impact of gelatin bird models into a rigid target, both experimentally and numerically, are available. Moreover, experimental tests are very expensive and time consuming. Therefore, the majority of researchers conducting numerical simulations of bird strikes exploit the data of published experiments, especially Wilbeck’s and Barber’s, in order to validate numerical bird models [21,22,23,24].
The classic Lagrangian method, ALE coupling (Arbitrary Lagrangian–Eulerian) and the SPH method (Smoothed Particle Hydrodynamics) are used for bird modelling [19,25]. Several studies, in which the authors compare the results obtained by the above methods, are available [26,27,28,29,30,31,32,33]. Taking into account that due to the bird strike, large deformations to the bird occur, the mesh-less SPH method is the most suitable [34,35,36]. The SPH technique was used in numerical methods to avoid the constraints related to the distortion of the finite element mesh when solving problems with strong deformations. The SPH method is a mesh-less Lagrangian technique in which the solid FE mesh is replaced by a set of discrete interacting particles.
The SPH method uses the Lagrangian formulation for the equations of motion, but instead of a grid, it uses an interpolation formula, called kernel functions, to calculate an estimation of the field variables at any point. The kernel function is active only over a given area for each node, called the support domain. Each node has a given mass and constitutes an element in the sense that the state variables are evaluated at each node location [37,38,39]. The method is said to be mesh-less because there is no predefined grid of nodes restricting which nodes can interact together. It also reflects the properties of the bird much more accurately than previous methods, especially in the case of a secondary bird strike. Moreover, in practice, the SPH method has a shorter solution time [29,39].
Apart from the results of research aimed at the validation of bird models, several experimental and numerical studies were conducted in order to analyze the impact resistance of various parts of an aircraft, including windshields, the leading edge of wings or flaps, fan blades, etc. [40,41,42,43,44,45,46,47,48,49]. However, there is no use of particular set-up studies in the context of the validation of numerical bird models.
An example of a comparison between the experimental and numerical investigations regarding windshields (a polycarbonate plate of 8 mm in thickness) has been presented in studies [40]. A dead chicken was used as a bird model impacting with a windshield. The impact velocity was 128 m/s. The values of the contact force and the deflection were recorded and compared to numerical analyses. A deep deflection of the polycarbonate plate and an its elastic behavior were observed. It could be stated that the polycarbonate plate is a flexible material [7,40].
Apart from that, in the last two decades, some tests dedicated to studying the impact resistance of composite materials have been carried out. Heimbs [50] presented both experimental and numerical analysis of a bird model impact into a composite laminate plate. Vijayakumar et al. [51] conducted numerical analyses of the composite cowling of the helicopter. Hedayati et al. [52] investigated a helicopter windshield with different lay-ups. Orlando et al. [53] presented the experimental test of a composite flap in order to meet EASA and FAA bird strike requirements. Guida et al. [54] carried out experimental and numerical studies of the composite material for leading edge design. Recently, Liu et al. [55] has investigated the dynamic response of aircraft nose in bird strike events, both numerically and experimentally.
The main goal of the authors of this paper is to provide efficient numerical tools for designing bird strike-resistant aircraft. The first step of the project was to elaborate and subsequently validate bird models, thus enabling numerical simulations of bird impact against various part of aircraft. Taking into account the above mentioned studies, the authors adopted the dominant methodology in the field, relying on a comparison of the results of experimental tests and numerical simulations [19,40]. In the authors’ opinion, the goal of the studies was achieved. The paper presents the specific experimental and numerical methods used and observation made in the course of the conducted experimental tests and numerical analyses.
2. Bird Strike Theory
2.1. Theoretical Foundation of Bird Impact Process
The way a bird’s body behaves during the impact process depends on its velocity. If the velocity is relatively low, the internal stresses in the body does not exceed the material strength, and the body bounces off. This behavior is called ‘elastic’. At some point, the increasing velocity of the impact generates stresses exceeding the material strength and the bird’s body behaves like fluid, and thus the behavior is called ‘hydrodynamic’ [25]. The hydrodynamic theory, developed by Wilbeck, presented below, can therefore be used to analyze the bird strike process [17].
The impact process consists of four main phases presented in Figure 1: (a) initial shock at contact, (b) impact shock decay (c) steady flow and (d) pressure decay. After the impact, a shock wave is created. This wave is parallel to the surface and runs perpendicularly from the surface in line with the direction of the bird’s body. The pressure exerted by the running shock wave on the inner side of the bird body’s surface combined with a negligible pressure outside creates a high pressure gradient. The particles in the area subjected to pressure gradient are spread radially outward. This creates release waves proceeding radially in the direction of the central axis of the model. The intersection of the release waves results in the rapid decrease in pressure in the center of the impact. The combination of the convergence of the release waves and their interaction with the shock wave shortens the Hugoniot pressure peak time by not even a microsecond. The mutual interaction of the waves causes their gradual weakening, which leads to the steady flow pressure in the bird’s body. Next, when all of the bird body’s particles have hit the target, the pressure drops to zero and the impact is terminated. The length of the bird’s body has a significant effect on the time of the impact process, especially in the aspect of the duration of the steady flow existence. The results of the experimental tests found that the ratio of the length to diameter equaling about 2, for the bird models in a shape of a cylinder, is advised for both numerical and experimental studies [17,19,25]. A typical pressure curve for a bird model impact on a rigid plate is depicted in Figure 2.
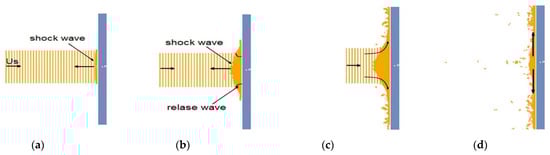
Figure 1.
Phases of bird impact process. Adapted from Ref. [25].
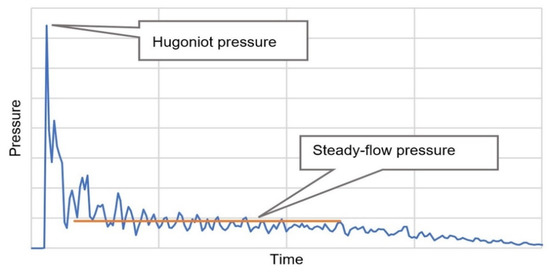
Figure 2.
Hugoniot and steady flow pressure profile. Adapted from Ref. [25].
According to Wilbeck [17], the theoretical shock pressure in a bird strike can be found by applying the conservation laws of mass and momentum across a standing one-dimensional shock. For this case, the equations concerning the conservation of mass (continuity) and momentum may be written as follows:
where the following are defined: initial density; particle velocity.
Combining these two equations, the pressure behind the shock is found to be:
For the impact of a cylinder on a rigid plate, it can be noted that up = u0. Thus, for this case, Equation (4) becomes:
For impact velocities, up to about 150 m/s, the shock velocity, us, can be adopted as the speed of sound in the material, c0. Thus, Equation (5) can be expressed as follows:
Figure 3 presents the differences in pressures found using these two relationships for water [17,19].
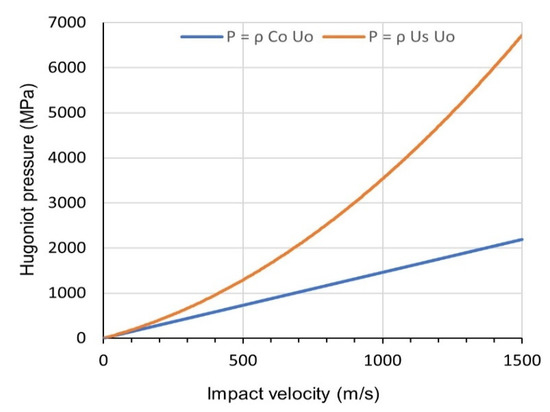
Figure 3.
Effect of compressibility on the Hugoniot pressure for water. Adapted from Ref. [17].
Taking into consideration Wilbeck’s suggestions, bird models can be approximated by a cylinder of material that is both homogeneous and isotropic. Thus, bird models may be expressed by a cylinder of porous water. In this case, the shear strength of the bird has been discounted. For the impact of a soft body on a rigid plate, the particle velocity 𝑢𝑝 is equal to the impact velocity, 𝑢0. For water, the constant 𝑘 in Equation (6) is 2, while the speed of sound 𝑐0 in water is defined as 1483 m/s [17].
The steady flow pressure PS can be calculated using the Bernoulli relationship as written in Equation (7). This assumption is applicable for incompressible flow. Furthermore, the bird material is able to reach steady flow conditions, due to the very high stresses observed during impact compared to the bird’s material strength [29].
Wilbeck’s experimental results have proved that the porosity of a bird model substitute has a significant effect on the impact parameters, including Hugoniot and stagnation pressure. The porosity of a material is defined by the volume fraction of pores in it and is expressed as z. If the mass density of the material (material with no porosity) is represented by , the average density of the mixture of material and pores is given in [17] as:
The relationships between shock velocity and shock pressure in different impact velocities are depicted in Figure 4 for non-porous and l0% porous water. It can be seen that when the impact velocity is low, the effect of the porosity has a significant influence on the shock velocity and shock pressure. For example, at the impact velocity of 116 m/s, which is considered in this paper, the Hugoniot pressure of porous water is about half of that for non-porous water [17,19]. Airoldi [56] applied Equation (9) in order to calculate the stagnation pressure with the porosity:
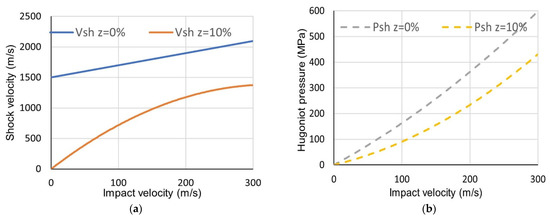
Figure 4.
Theoretical results for shock velocity (a) and shock pressure (b) with different porosity. Adapted from Ref. [19].
Equation (9) gives the stagnation pressure for an incompressible fluid. However, if the fluid is compressible, its value will increase with respect to its porosity, z.
The total time, 𝑡d, needed for the impact to reach the pressure termination stage can be calculated using the following equation, where 𝐿 represents the material’s length before impact and u0 [19].
2.2. Equations of State (EOS)
An additional relevant element, which should be considered during bird modeling, is the equation of state (EOS). The equation of state is an equation related to state variables such as density and pressure [19,57]. Applying the appropriate EOS during bird model designing is crucial for the numerical analyses of bird strike. One of the EOS derived specifically for solids is the Mie–Grüneisen EOS. Nonetheless, according to the subject literature, the Mie–Grüneisen equation [21,22,33,57] can be applied to model the hydrodynamic behavior of birds. The availability of individual EOS depends on the software used. In the research two EOS have been studied: Mie–Grüneisen and polynomial.
2.2.1. Mie–Grüneisen EOS
The equation defines the pressure in the shock-compressed material as [19,57]:
whereas for the expanded material it is defined as:
where the following are defined: C—bulk speed of sound; γ0—Grüneisen gamma; S1—linear coefficient; S2—quadratic coefficient; S3—cubic coefficient; a—first order volume correction to γ0; μ—volume parameter, expressed as μ = (ρ/ρ0) − 1; ρ—actual density; ρ0—initial density; E—internal energy per unit of mass.
The EOS does not allow porosity to be accounted for in the material of the bird model. Therefore, researchers often use a material density of 950 or 938 kg/m3 to simulate a porosity of 10% or 15%.
2.2.2. Polynomial EOS
Moreover, a useful equation of state used to describe the pressure–density relationship in the bird model is the polynomial of degree 3. In this EOS, a form of polynomial is used [19,57].
where C0, C1, C2, and C3 are constants connected to a material and μ is a coefficient based on the relation of current density, , to initial density, , expressed as μ = (ρ/ρ0) − 1.
This polynomial equation of state for the bird model refers to a hydrodynamic, isotropic, and non-viscous constitutive law. The coefficients are expressions based on the initial density, the speed of sound in the material and an experimental constant k. With a known and negligible initial equilibrium pressure, the values of the coefficients in Equation (13) are given as follows [58]:
Apart from the EOS considered above, there is a tabulated EOS or Murnaghan EOS, but in this paper, it is not taken into account.
3. Materials and Methods
In this section, the experimental setup and materials used for bird modelling and numerical methods adapted for the studies are presented.
3.1. Experimental Setup
The experimental tests of bird model impact with the steel plate and plexiglass plate were carried out at the Institute of Aviation. The dedicated test stand consisted of the following elements:
- -
- Air pressure gun;
- -
- Multi-channel recorder (LMS SCADAS Mobile SCR09);
- -
- Force sensors (M204C PCB)—4 pcs;
- -
- Strain gauges;
- -
- Portable computer equipped with LMS Test. XPress software—measurement control, data recording and archiving;
- -
- A desktop computer to control the gas gun equipped with Gun Control software;
- -
- High-speed camera (Phantom VEO 412L + TAMRON 28–75 mm);
- -
- Left high-speed camera (Phantom V1612 + NIKON 70–300 mm);
- -
- Right high-speed camera (Phantom V1612 + NIKON 105 mm);
- -
- Computer with PCC 3.1 camera software;
- -
- Samples for testing: steel rigid plate and plexiglass plate (0.5 × 0.5 × 0.1 m).
The scope of the measurements included:
- -
- Measurement of projectile speed;
- -
- Measurement of impact force with four sensors;
- -
- Measurement of strains;
- -
- Pressure during impact;
- -
- Radial distribution of pressure.
The rear montage plate is made of a 0.1 m-thick square rigid plate (0.5 × 0.5 m) mounted with four bolts supported by 4 load sensors (Figure 5a). Four distance elements are fixed to the rear montage plate. Material samples for testing are fixed to distance elements with 40 screws (10 for each side of the sample). The screws were tightened with a force of 30 Nm. Figure 5b presents the tested polycarbonate plate mounted on the frame of the test stand with visible strain gauges. Before each shot, stickers on a white background with black circles with a scale of 20 mm were affixed to the sample material, in order to measure the change in diameter of the impacting projectile using a high-speed camera (Figure 5c). The force sensors and strain gauges were connected to the data recorder. The cameras and data recorder were connected to a trigger, which was switched on by a technician, in order to initiate a shot from the DPZ-250 gas gun (Figure 6). Additionally, the trigger ensured time synchronization for all devices.
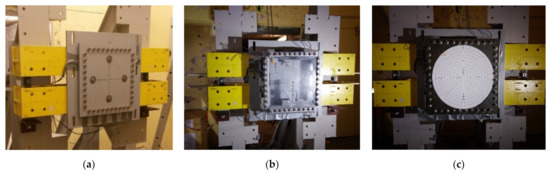
Figure 5.
Parts of experimental setup: (a) load sensors; (b) plexiglass plate with mounted tensiometers; (c) steel rigid plate.
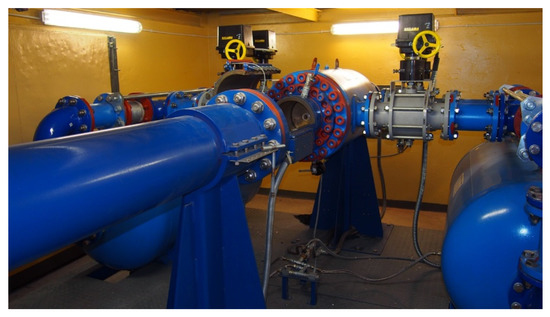
Figure 6.
Gas gun DPZ-250.
The projectile, placed in the sabot, is loaded in the rear of the barrel. The task of the muzzle device is to remove the sabot in such a way as not to disturb the trajectory of the projectile. On the opposite side of the barrel of the gas gun, a test bench is clamped to the floor to which the test samples are fixed.
Ten shots were fired during the experimental tests. Shots no. 4 and 9 have been chosen for the presented analyses. The projectiles were made on the basis of NASA regulation TN-2015-218340. Depending on the weight, the projectiles had the following dimensions: diameter—106 mm, length—212 mm; weight 1.81 kg (Figure 7a). For each shot, a sabot made from styrodur xps with an external diameter of 250 mm was prepared. Before each shot, the sabot and the gelatin projectile (Figure 7b) were weighed. In this study, the projectile velocity was 116 m/s (±5 m/s).
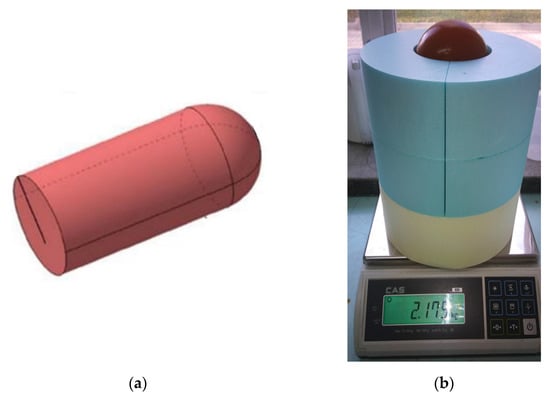
Figure 7.
Gelatin projectile: (a) shape; (b) inside sabot.
Figure 8 shows the experimental setup elements exploited during tests. Camera no. 1 was used to determine the projectile velocity. Camera no. 2 recorded the target displacement. Camera no. 3 was used to observe the impact process.
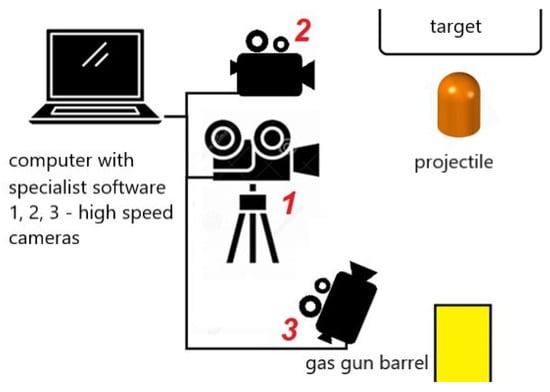
Figure 8.
Experimental setup elements.
Figure 9 presents a projectile shot toward the target plate. The projectiles’ velocities were calculated based on the video analysis exploiting the calibration mark visible in the background.
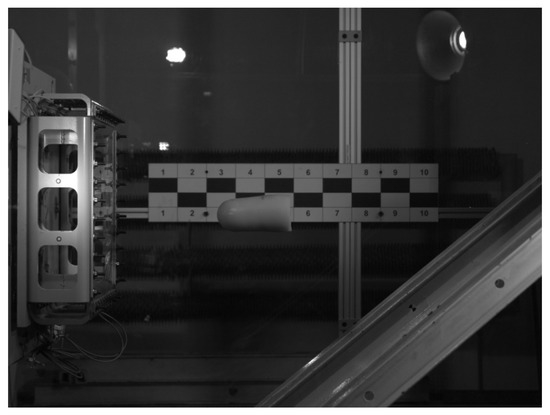
Figure 9.
Snap-shot from the high-speed camera measuring of a projectile velocities.
For each shot, the values of forces measured by 4 load sensors (F1, F2, F3, F4) and the values of strains measured by strain gauges (SG1, SG2, SG3) were recorded. In addition, the speed of the projectile, the view of individual sequences of the projectile’s strains and the diameter of the deformed projectile were recorded with a set of cameras, on the basis of a grid of circles placed on the rigid plate. The diameter was measured for each subsequent frame of the film recorded by the cameras. The registration of the above data allowed the developing of graphs of the total force, strain values and pressure. In order to achieve a temporary synchronization of the indications of the force sensors with the measurement of the projectile diameter, the analysis was started when the sum of the measured forces increased significantly above the zero value. Based on the data presented in Figure 10, the equation of the relationship of the mid-diameter change (linear) was determined.
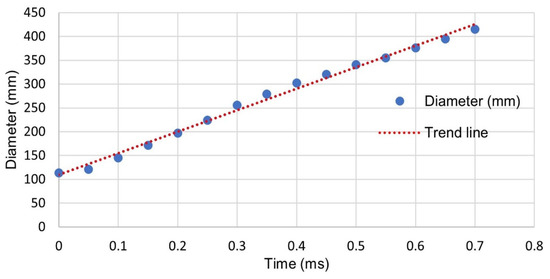
Figure 10.
Changes over time in the diameter of deformed projectile during impact.
This equation was used to calculate the “theoretic diameter”, on the basis of which the pressure of the projectile acting on the plate was calculated at subsequent time moments corresponding to the sampling of the force measurement. The pressure was calculated based on Equation (15):
where the following are defined: p—pressure; F—resultant force measured by 4 force sensors, S—projectile area during the impact process, calculated from changes in diameter.
3.2. Numerical Methods
In order to conduct a numerical analysis of a bird impact into a rigid and deformable target, the LS_DYNA software package was used [59]. This is a computational code designed to analyze fast-changing phenomena by means of the finite-element method. A quick explicit formulation has been chosen for the research. Additionally, in order to elaborate bird and target models LS-PrePost software was exploited.
3.2.1. Bird Models
Within this article, a bird, 1.8 kg in mass and in a cylindrical shape with hemispherical ends (D = 0.106 m; L = 2D = 0.212 m), was modelled (Figure 11). The dimensions of the bird models have been determined on the basis of the adopted bird mass and material density [7]. For comparison, two bird models were elaborated. They had the same mass and dimensions, but different pitch values (inter-distance between SPH particles), number of SPH particles and mass of one particle. Model number 1 consists of 70.372 elements (pitch value 3 mm) and model number 2 consists of 15.216 elements (pitch value 5 mm) (Figure 12).
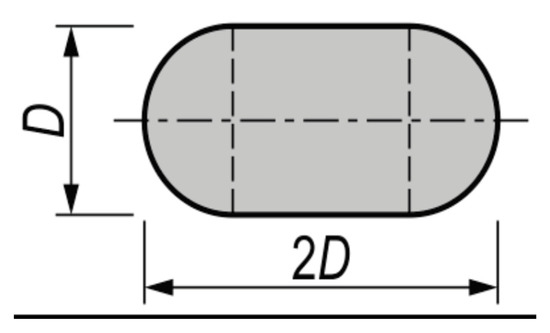
Figure 11.
Shape and dimensions of SPH bird model.
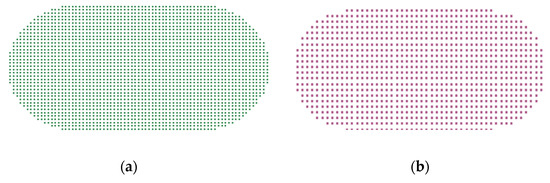
Figure 12.
SPH bird models with different pitch value: (a) 3 mm; (b) 5 mm.
After the numerical analyses were conducted, model number 1 was chosen for the simulation presented in this paper since this model reflected the behavior of a gelatin projectile more accurately during experimental tests.
Table 1 presents material and EOS parameters adopted in bird models.

Table 1.
Material and EOS data used in bird models [7].
3.2.2. Parameters of Simulations
A steel plate with dimensions of 0.5 × 0.5 × 0.1 m was used as a rigid target. Additionally, a preliminary test was carried out with a plexiglass plate (flexible target) in order to check the behavior of both the gelatin bird model and the deformation of the flexible plate. Material data for the targets mentioned are listed in Table 2.
Table 2.
Material data used in targets.
Figure 13 presents types of mesh used for the rigid and the plexiglass plate: the fine mesh (a) and the coarse mesh (b). The fine mesh was composed of 2500 elements (1 × 1 cm), whereas the coarse mesh consisted of 324 elements (2 × 2 cm) located in the central part of the plate, surrounded additionally by 1658 elements of an irregular shape of a smaller size. The coarse mesh structure was designed during the numerical analyses to reflect most accurately the behavior of a gelatin projectile observed during experimental tests. Moreover, the calculating time in LS-Dyna was reduced by approximately 40%.
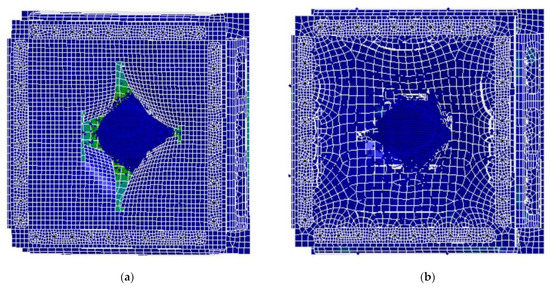
Figure 13.
Meshes used for plexiglass plate: fine mesh (a) and coarse (b).
The model of the test stand presented in Figure 14a, was developed in a CAD environment and then imported into the LS-PrePost software, after which it was discretized in order to use it in numerical analyses.
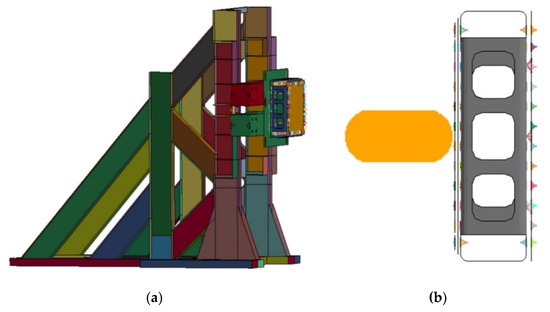
Figure 14.
FE model of the stand test (a) and the position of the bird model in the initial moment of analysis (b).
Similar to the stand, four bolts, supported by 4 load sensors, connect the target with other elements of the stand. The bolts were grouped in the single point constraints (SPC) set and all the translational degrees of freedom in x, y, z directions were constrained. In this case, an SPC boundary condition card was chosen. This setup provided the same boundary conditions for the experimental tests and numerical simulations. Furthermore, it allowed the researchers to measure the SPC force, such as in the experimental tests. The contact “automatic nodes-to-surface” was adapted. The function of the master segment was taken by the target, whereas the slave segment was a bird model. CThe contact “automatic single-surface” was used as the contact between the target and other parts of the stand. The contact “force transducer” was used to obtain the resultant force between the bird model and the area of the transducer.
In similarity to most of the studied papers concerning bird strikes, the target was not loaded with initial air pressure, and the flight speed of the bird was not included in the calculations. The velocity of the bird model equalled 116 m/s. This velocity was the speed of the bird model impacting into a rigid plate. The analysis time was set at up to 2.5 ms. Other parameters are listed in Table 3. Data concerning the initial moment of the analysis, for the bird models, is illustrated in Figure 14b.
Table 3.
Initial simulation parameters.
In order to avoid instability, a time step of 6 × 10⁻⁶ s was applied. The time step was obtained by the use of Equation (16), based on the Courant–Friedrichs–Lewy (CFL) condition for SPH method:
where 0.1 is constant factor, h particle spacing in SPH, and u is the maximum velocity in the computation [7,43].
4. Results
In this section, both the experimental and numerical results are presented.
4.1. Experimental Results
Figure 15 presents raw data of the impact load obtained from the four load sensors during the experiment. It can be seen that they have different maximum values (F1 = 94 kN, F2 = 117 kN, F3 = 76 kN, F4 = 131 kN). The reason for that is probably the fact that the impact of the projectile into the target is not entirely perpendicular.
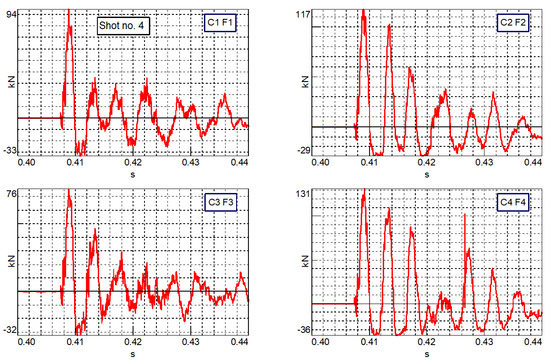
Figure 15.
Forces recorded by 4 load sensors (shot no. 4).
Figure 16 depicts dynamic strains recorded during the experiment. These strains have a maximum value of about 7.95 × 10⁻⁴ mm. It means that the plate can be considered as a rigid body.
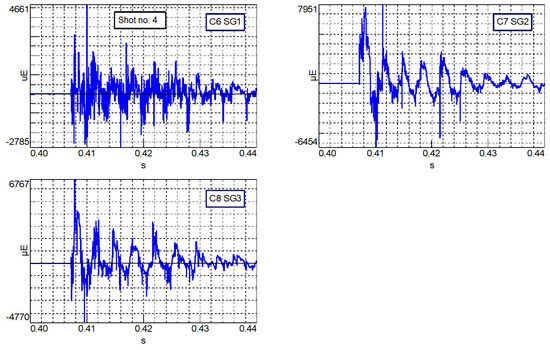
Figure 16.
Strains recorded by 3 tensiometers (shot no. 4).
The resultant force was calculated by summing the force values recorded from the four load sensors (Figure 17a). Figure 17b shows the pressure plot obtained using the technique described in Section 3.1, pages 10, 11. The pressure regimes are easy to distinguish. The values of Hugoniot and the stagnation pressure are equal to 40 MPa and 4 MPa, respectively. The visualization of the projectile deformation presented in Figure 18 reflects its hydrodynamic behavior well.
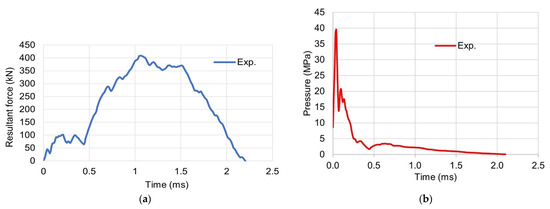
Figure 17.
Resultant force (a), and pressure (b) recorded during shot no. 4.
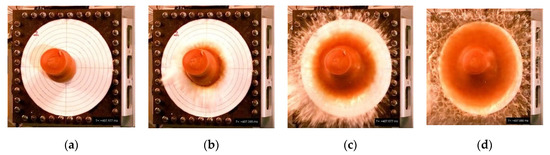
Figure 18.
Visualization of the projectile deformation for the impact at 116 m/s: (a) 0 ms; (b) 0.3 ms; (c) 0.8 ms (d) 1.2 ms.
Figure 19 presents raw data of the impact load obtained from the four load sensors during a gelatin bird model impact into an acrylic glass plate used as a deformable target. It can be noted that they have different maximum values (F1 = 160 kN, F2 = 185 kN, F3 = 128 kN, F4 = 184 kN). The forces are higher than the forces recorded during the impact into the rigid plate, despite using the same impact parameters.
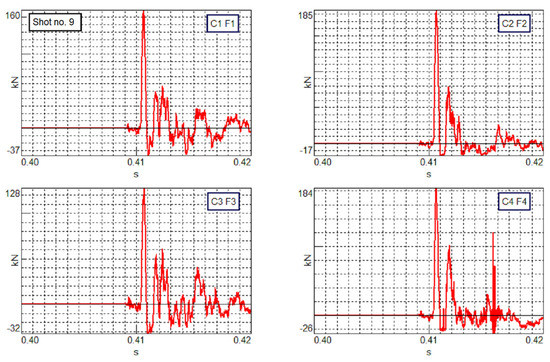
Figure 19.
Forces recorded by 4 load sensors (shot no. 9).
Figure 20 depicts the dynamic strains recorded during the experiment. These strains have a maximum value of about 0.0946 mm and show the moment of turning up of the plate.
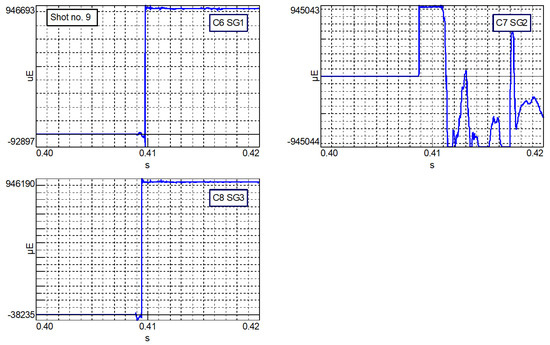
Figure 20.
Strains recorded by 3 tensiometers (shot no. 9).
Figure 21a presents the forces calculated by summing the values of forces recorded from the sensors, obtained during a bird model impact into an acrylic glass plate, whereas Figure 21b shows a sharp decrease in the pressure corresponding to the moment of the glass being punctured.
Figure 21.
Resultant force (a) and pressure (b) recorded during shot no. 9.
4.2. Numerical Results
In order to compare the results of the experimental and numerical tests, a series of numerical analyses were performed by means of the LS-PrePost software previously mentioned. The calculations were made in the LS-Dyna 970 program [59].
The most commonly employed method for the validation of the numerical bird model in bird strike analyses is to compare the pressure profile determined in the numerical analyses with the experimental and theoretical results. The numerical values obtained by different researchers differ considerably. It is worth noticing that the largest discrepancies can be noticed in Hugoniot and steady pressures observed in the corresponding experimental and theoretical analyses, particularly at velocities below 150 m/s.
Both in experimental and numerical analyses, various techniques are adopted to obtain the pressure profiles. The main numerical techniques are characterized below.
In the work [19], Hedayati presents four techniques of obtaining a pressure plot at the center of impact:
- The pressure plot of the center of impact can be obtained from the pressure variation of the most frontal elements of the bird model, which usually remains in its position from the initial instant of contact between the bird and the target until the final stages of the impact.
- The contact force plot is obtained and then divided by the initial contact area between the bird and the target.
- In a more accurate method of pressure reading, the contact force diagram is divided by the contact area between the bird and the target at any instance.
- The most accurate technique is to create a shell element as a sensor over the center of impact, the nodes of which are tied to the exterior face of the target plate. The contact force diagram between the bird and the shell sensor can be obtained and then divided by the area of the sensor.
Apart from that, Ansari [43] used another technique to read pressure. The technique consists of initiating the contact area capture at each time step through the LSDYNA command window using a DATABASE_BINARY_INTFOR card.
Moreover, the authors have developed a technique similar to Hedayti’s method, mentioned above in point 4, relying on using a CONTACT_FORCE_TRANSDUCER card to obtain the resultant force between the bird model and the area of the transducer (sensor); next, the force is divided by the area of the sensor in order to calculate the pressure (RF technique). Apart from that, a method of determining the profile of pressure based on a DATABASE_BINARY_INTFOR and on obtaining the pressure plot from the history of the central segment of the target (INTFOR technique) was investigated.
In summary, three numerical techniques for reading the pressure profile were compared, the RF, the technique of determining the pressure diagram directly from the SPH particles in direct contact with the target (SPH technique), and the INTFOR technique mentioned above. Then, the results were compared with the results of the experimental studies of the authors and other researchers. The comparison is presented in the next section. The numerical analyses were carried out taking into consideration two porosity values (0%, 10%), declared in the Mie–Grüneisen (EOS G) and polynomial equations of state (LP_10). Moreover, in order to check the response of the target during the impact process, two different materials were adopted, one as an elastic (MAT_3), and the other, as a rigid (MAT_20).
Figure 22 presents the comparison of the pressure profiles obtained from the numerical simulations using the RF, SPH and INTFOR techniques by means of various EOS. It can be seen that the value of Hugoniot pressure for RF is 70 MPa, SPH is 80 MPa and for INTFOR it is 52 MPa. It is significant that the presented maximum values are the same for both EOS. It seems that the parameters of the equations of state were determined correctly. However, their maximum values differ by approximately 15%. On the other hand, the theoretical values of Hugoniot pressure obtained from Equation (4) equals 88 MPa. It means that in this case the Hugoniot pressure value measured by the SPH method is close to the theoretical value. Taking into consideration stagnation pressure, it can be seen that the profiles of all the curves are similar in terms of time with about 0.5 ms from the beginning of the impact. Next, the stagnation pressure for SPH decays rapidly, while for RF and INTFOR the time is comparable with 1.25 ms for RF and 1.5 ms for INTFOR. This may result from the fact that SPH bird elements, at the center of impact, do not remain in their initial stagnation location. Moreover, the average values of stagnation pressure differ slightly from each other. RF equals about 6 MPa and is close to the theoretical value, whereas the curves for INTFOR and SPH have lower values, smaller than 5 MPa.
Figure 22.
Pressure at center of impact for RF, SPH, and INTFOR, using various EOS: (a) EOS G; (b) EOS LP_00.
Figure 23 depicts the pressure profiles obtained by the three techniques studied with 10% porosity. It can be noted that the Hugoniot pressure equals 37 MPa, 32 MPa and 35 MPa, respectively. The difference between them is very small and does not exceed 15%. However, the differences can be spotted in the shape and values of the stagnation pressures. The stagnation pressure profiles obtained from RF and SPH were in good agreement with each other. Nonetheless, the average values for RF is close to the analytical values, which is about 7 MPa for 10% porosity. Considering Equation (9), the stagnation pressure for 10% porosity is higher than its values with 0% porosity.
Figure 23.
Pressure at center of impact for RF, SPH, INTFOR with EOS of LP_10.
Figure 24 shows a comparison of the pressure profiles obtained from the numerical simulations by using the RF, SPH and INTFOR techniques. An elastic material was used as a target. It can be seen that the value of Hugoniot pressure for SPH is 82 MPa and for both RF and INTFOR it is 91 MPa. It means that these values differ by approximately 10% from SPH only. On the other hand, the theoretical value of Hugoniot pressure obtained from Equation (2) equals 88 MPa. It means that in this case, the Hugoniot pressure value measured by the INTFOR and RF methods is close to the theoretical value. Taking into consideration the stagnation pressure, it can be seen that the profiles of both curves (SPH and INTFOR) coincide and are equal at around 6 MPa. It means that this value is the same as the theoretical value. On the other hand, the stagnation pressure obtained by the RF technique is higher compared to SPH and INTFOR and its average value equals about 13 MPa. However, all the curves have a similar shape. The pitch value of 3 mm was adopted in the SPH bird model.
Figure 24.
Pressure at center of impact for RF, SPH, INTFOR technique (MAT_3).
5. Discussion
During discussion, the results of the experimental tests were compared against the results of the numerical analyses. Additionally, the authors’ and other researchers’ results were analyzed.
Figure 25 presents the comparison of the pressure profiles obtained from the numerical simulations by using the RF, SPH and INTFOR techniques with a pitch value of 5 mm. It can be seen that the value of the Hugoniot pressure for RF is 90 MPa, SPH is 100 MPa and for INTFOR it is 110 MPa. It means that their maximum values differ by about 10%. On the other hand, the theoretical values of Hugoniot pressure obtained from Equation (4) equals 88 MPa. Therefore, in this case, the Hugoniot pressure value read by the RF method is close to the theoretical value. Taking into consideration the stagnation pressure, it can be seen that the profiles of all curves are comparable with a time of 1.50 ms; next, their values slowly decay. Moreover, the average values of stagnation pressure show slight differences from each other. For SPH and INTFOR, the values equal about 6.5 MPa and 5.5 MPa, respectively, and are close to the theoretical value, whereas for RF it is about 9 MPa. This means that this value is 50% above the theoretical value.
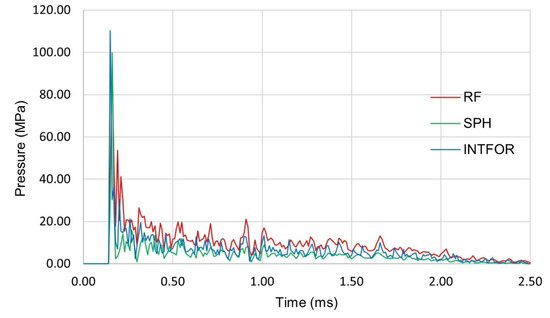
Figure 25.
Pressure at center of impact for RF, SPH, INTFOR with pitch value 5 mm.
Furthermore, the comparison of the pressure peaks for two different pitch values (3 and 5 mm) were presented in Figure 24 and Figure 25. It can be seen that generally, the pressure peaks for pitch values of 5 mm are higher than for 3 mm. However, the stagnation pressure profiles are similar for all techniques. Comparing those results with those provided by other investigators, it is worth emphasizing that these results are different, especially for the Hugoniot pressure, whereas the profiles of the stagnation pressure are similar.
For example, we can look at Ansari, who conducted an interesting analysis [43]. He studied the influence of various pitch values (mesh size) on Hugoniot and stagnation pressures. For a bird model speed of 116 m/s, the values of peak pressure ranged from 90 to 149.5 MPa depending on the pitch values (2.7, 2.8, 3.0, 3.2, 3.4. 4.0), while the average value of the stagnation pressures was about 6 MPa. It means that there is good accordance between them and the authors’ results in this case. Moreover, in their work, Hedayati et al. [19] drew a similar conclusion that the size of mesh does not affect the profile of stagnation pressure.
Figure 26 depicts the pressure profiles of the experimental test against the profiles obtained by the three studied techniques with 10% porosity. It can be noted that the Hugoniot pressure equaled 39.51 MPa, 37.01 MPa, 32.11 MPa, 35.53 MPa, respectively. The difference between them is very slight and does not exceed 10%. In this case, the experimental peak pressure is a bit higher than for the presented techniques. However, taking into consideration the stagnation pressures, their average values and shapes are slightly different. The stagnation pressure obtained in the experiment has a smaller value in comparison to the numerical results. Moreover, the average value for INTFOR is close to the analytical value, which is about 7 MPa for 10% porosity, while the variable value of pressure determined in the experiment is about 30% lower.
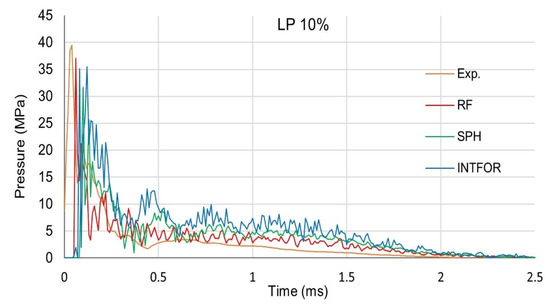
Figure 26.
Pressure at center of impact for experimental test and numerical simulations (RF, SPH, INTFOR).
In order to find the influence of various variables on the values of the peak and stagnation pressure, additional simulations were conducted. It turned out that good agreement can be seen between the profile of stagnation pressure for the experimental test and the data obtained by using the SPH technique with a decelerated Grunaisena EOS (Figure 27). Additionally, the values of CSLH (constant applied to the smoothing length of the particles) and H min (scale factor for the minimum smoothing length) were higher by 1.3 and 0.5, respectively. It effected the peak pressure reduction by about 40%. The stagnation pressure was decreasing faster than presented in Figure 22a.
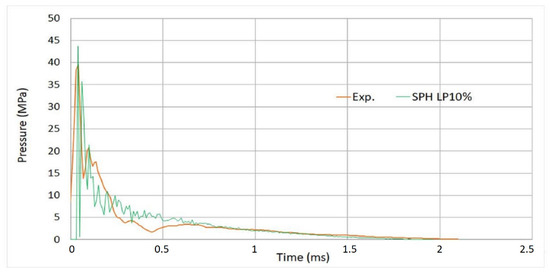
Figure 27.
Pressure at center of impact for experimental test and SPH technique.
Based on the data presented in Figure 26, the profiles of normalized pressure were calculated. Figure 28 shows the normalized pressure profile from the experimental test compared with the profiles obtained by three studied techniques. It can be noted that the normalized peak pressure equals 5.78, 5.81, 4.98, and 5.57, respectively. The difference between them is very small and does not exceed 10%. In this case, the peak pressure for the SPH technique is a bit lower than for other techniques. However, taking into consideration the stagnation pressures, their average values and shapes are marginally different. The stagnation pressure for the experiment has a value similar to RF. Moreover, the average value for INTFOR is close to the analytical value, which is about 1, while the other variables of pressure have values lower than 1, including the experimental test results. This means that the INTFOR technique is more suitable than others, especially taking into consideration the stagnation pressure.
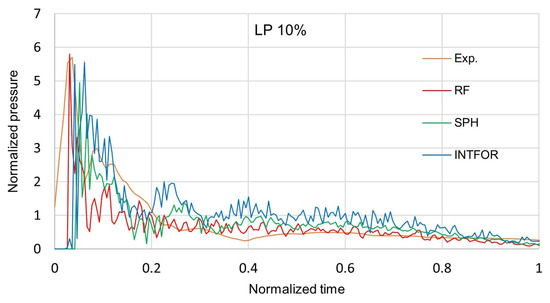
Figure 28.
Profiles of normalized pressure for experimental and numerical analyses.
Before comparing the authors’ results with data obtained by other researchers, it is important to underline that these results exhibited considerable differences in Hugoniot and stagnation pressure. They were dependent on many factors, including the method of bird modelling, the technique of measurement, the pitch value used in SPH bird modeling and others.
Table 4 presents the values of normalized Hugoniot’s and steady-flow pressure at a speed of 116 m/s, as obtained by other researchers. It can be seen that they differ from each other. The differences range from 3.6 to 14.1 for Hugoniot pressure and from 0.5 to 1.58 for a stagnation one. The researchers did not provide information on the recording techniques exploited.
Table 4.
Values of normalized Hugoniot’s and steady-flow pressure at a speed of 116 m/s.
Additionally, in this table, the authors’ results of the investigated techniques were listed as well. It is important to emphasize that the authors’ results are marginally lower than the others. However, the results obtained by the INFOR technique, especially regarding the stagnation pressure seem to agree with the theory. Moreover, in Table 3, the results of the numerical simulation are presented, in which a polynomial EOS with 10% porosity was adopted. Taking into consideration the authors’ and Wilbeck’s experimental result (Table 4), it can be seen that the normalized Hugoniot pressures are different by about 40%, but the stagnation pressures correlated well with each other.
Generally, the authors’ results confirmed the other researchers’ conclusions that the value of Hugoniot pressure recorded during experiments is sometimes lower than theoretical ones. It could be caused by the insufficient sensitivity of the sensors. Since the peak of pressure lasts only a few microseconds, the pressure sensors may be unable to capture a very short-term pressure.
One of the parameters recorded during the experimental tests was the impact force (Figure 29). The impact force diagram obtained in the experiment was compared with the force obtained from the simulation. When analyzing the course of the curves, it can be concluded that their shapes are comparable, and their maximum values correlate well with each other. The first peaks of the force during both the experiment and simulation have similar values, which reflect Hugoniot peaks. However, the differences occur in the time from 0.1 to 0.4 ms from the beginning of the impact. In the experimental test, the values of the impact force in this period of time is, on average, 100 kN, while in the simulation it is about 50% lower. It may be caused by the slight flattening of the projectiles’ hemispherical end, caused by air drag action. It is found that a straight cylinder adopted for simulation gives a similar effect. Furthermore, in both cases the maximum values of the resultant forces were the same.
Figure 29.
Comparison of the resultant forces obtained from experimental and numerical analyses (shot no. 4).
Figure 30 depicts a comparison of projectile deformation during impact with the target plate, as recorded by a high-speed camera, with the corresponding numerical simulation results. It can be noted that the simulation reflects satisfyingly the deformation of the gelatin bird model during the bird impact process. Moreover, for both cases, the deformation effect of the bird models during impacts confirms their hydrodynamic behavior.
Figure 30.
Comparison of the projectile deformation for experimental and numerical studies: (a) 0 ms; (b) 0.3 ms; (c) 0.8 ms (d) 1.2 ms.
Two of the shots, which were conducted during the experiment tests, concerned a gelatin projectile’s impact with a flexible target: a plexiglass plate. The main aim of that was to assess both the behavior of the gelatin bird model and the flexible target during an impact process. It was a preliminary investigation prior to farther experimental and numerical studies regarding aircraft windshields.
Figure 31 depicts a comparison of the resultant force obtained from the experiment and numerical simulations during bird model impact with a plexiglass plate. It can be noted that these profiles correlate well with each other during the impact process, in a time up to about 0.6 ms. After a time of about 0.3 ms, the target is punctured by the projectile, after which the forces rapidly decrease. Next, the parts of the curves do not coincide, due to the huge deformation of the target plate.
Figure 31.
Comparison of the resultant forces obtained from experimental and numerical analyses (shot no. 9).
It seems to be interesting to show the distributions of Von Mises stresses before (a) and after (b) the puncture of the plexiglass plate, as is shown in Figure 32. It can be seen that the value of the stress is the maximum in the center of the plate and is about 60 MPa. It occurs shortly before the plate is torn up, whereas the stress around the center is lower and equals about 50 MPa. Next, the stress in the center rapidly decreases to zero after the puncture of the plate. Afterwards, the stresses in the area around the center reaches a mean stress value of 45 MPa. The increase is caused by the bird model particles spreading radially.
Figure 32.
Distributions of Von Mises stresses before (a) and after (b) the puncture of the plate.
Figure 33 depicts the plot presenting the distributions of the Von Mises stresses of two elements, one is located in the center of the plate and the other is located 0.1 m from the center. The location of element no. 1 was chosen to show the course of the stress in the moment of the puncture. It can be observed that the maximum value of the stress (60 MPa) in element no. 1 occurs at the moment of the puncture, and it coincides with the value shown in Figure 32a. After the puncture the stress rapidly decreases to zero, the same situation is shown in Figure 32b. Taking into account element no. 2, which is 0.1 m far from the center, the course of the stress curve is different. The maximum value of the stress is an average 45 MPa and lasts about 0.5 ms, and next oscillates from 10 to 25 MPa. In this time, elements are damaged, and the process of the deformation is continued to the end of the impact.
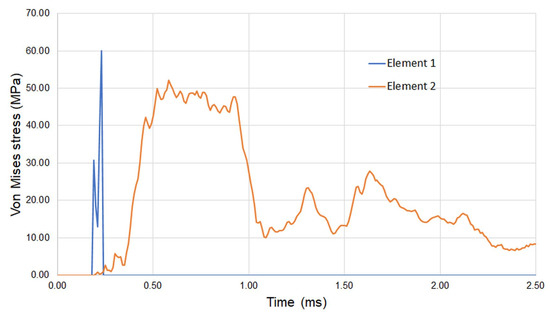
Figure 33.
Distributions of Von Mises stresses of two elements: 1—the central element; 2—element located 0.1 m from the center.
Figure 34 depicts a comparison of the projectiles’ deformation during the impact into the target plate, recorded by a high-speed camera, with the corresponding numerical simulation results. It can be noted that the simulation reflects satisfyingly the deformation of the gelatin bird model during the bird impact process. However, taking into consideration the behavior of the plexiglass plate, it can be seen that in the numerical simulation, the plexiglass plate is more elastic in comparison to the experiment, in which the plexiglass plate seems to be more brittle. Zochowski et al. obtained a good brittleness effect of the ceramic plate during numerical simulations [60].
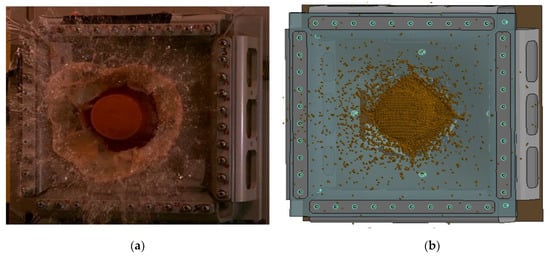
Figure 34.
Comparison of the projectile and the plexiglass plate deformations for experimental (a) and numerical (b) studies.
6. Conclusions
In this paper, the results of the experimental and numerical studies of bird model impacts with rigid and flexible plates were presented. The experimental research was conducted with a special set-up of a gas gun equipped with high-speed cameras, tensiometers and force sensors. The simulations were developed on the basis of LS-DYNA software by means of the SPH method for the bird model shape of the cylinder, with hemispherical endings at the speed of 116 m/s. The results of the studies, such as the impact force, pressure and bird model deformation were compared. The pressure profiles were recorded by three different techniques and compared against the experimental tests. Moreover, the authors’ and other researchers’ results were confronted.
In summary, it is significant to emphasize the following:
- -
- The deformation effect of the gelatin projectiles during impacts confirms their hydrodynamic behavior;
- -
- The exploited experimental setup allows for the recording of experimental parameters, such as impact force, projectile speed, effect of deformation, and changes in projectile diameter;
- -
- Values of Hugoniot and stagnation pressure depend on the technique of measurement during numerical simulations;
- -
- Values of Hugoniot and stagnation pressure for experimental tests depend on sensitivity pressure or load sensors (sample frequency);
- -
- The INTFOR technique seems to be the most accurate, providing results of pressures closest to the theoretical ones;
- -
- Many investigators do not provide their techniques of pressure recording, and thus it makes assessing their results’ accuracy difficult;
- -
- Applying 10% porosity, coupled with linear polynomial EOS, gives results close to the experimental test;
- -
- The resultant force values obtained during the numerical studies reflects well the experimental ones, regardless of the parameters of simulation used, such as pitch value and EOS.
During the experiments, some limitations of the experimental setup were observed; thus, in following research, the authors decided to equip the test stand with additional tools allowing the recording of acceleration and displacement by DIC (Digital Imagine Correlation) method.
In conclusion, it should be noted that the assumptions adopted for the numerical studies provided a good accordance of the results with the experimental tests. However, it required taking into account various factors, including EOS, porosity, as well as techniques of recording and calculating various variables.
Therefore, based on the conducted analysis, the authors decided to adopt for further studies the following assumptions:
- -
- SPH method for bird modelling with pitch value of 3 mm;
- -
- INTFOR technique for pressure measurement;
- -
- 10% porosity, coupled with linear polynomial EOS.
The presented research was the first part of the studies aimed at elaborating a bird strike-resistant windshield and other vulnerable parts of aircraft. The results of these studies may have a positive impact on the air transportation safety.
Author Contributions
Conceptualization, J.Ć.; methodology, J.Ć. and E.K.; software, J.Ć.; validation, E.K., A.G. and J.Ć.; formal analysis, A.G.; investigation, J.Ć. and A.G.; resources, E.K; data curation, J.Ć. and A.G.; writing—original draft preparation, J.Ć.; writing—review and editing, J.Ć, E.K. and A.G.; visualization, A.G.; supervision, J.Ć. and E.K.; project administration, J.Ć.; funding acquisition, J.Ć. All authors have read and agreed to the published version of the manuscript.
Funding
This research was funded by Polish Air Force University.
Institutional Review Board Statement
Not applicable.
Informed Consent Statement
Not applicable.
Data Availability Statement
The data presented in this study are available on request from the corresponding author.
Acknowledgments
Assistance provided by Michal Szmidt and Miroslaw Kozera from Institute of Aviation in conducting of the experimental tests was greatly appreciated.
Conflicts of Interest
The authors declare no conflict of interest.
References
- Dhillon, B.S. Transportation Systems Reliability and Safety; Taylor and Francis Group: Boca Raton, FL, USA, 2011. [Google Scholar]
- Mclntyre, G.R. Patterns in Safety Thinking: A Literature Guide to Air Transportation Safety; Taylor and Francis Group: London, UK, 2017. [Google Scholar]
- Metz, I.; Mühlhausen, T.; Ellerbroek, J.; Kügler, D.; Gasteren, H.; Kraemer, J.; Hoekstra, J. Simulation Model to Calculate Bird-Aircraft Collisions and Near Misses in the Airport Vicinity. Aerospace 2018, 5, 112. [Google Scholar] [CrossRef]
- Metz, I.; Ellerbroek, J.; Mühlhausen, T.; Kügler, D.; Kern, S.; Hoekstra, J. The Efficacy of Operational Bird Strike Prevention. Aerospace 2021, 8, 17. [Google Scholar] [CrossRef]
- Dennis, L.; Lyle, D. Bird Strike Damage & Windshield Bird Strike Final Report; EASA.2008.C49; Report European Aviation Safety Agency: Cologne, Germany, 2009. [Google Scholar]
- Dolbeer, R.A.; Begier, M.J.; Miller, P.R.; Weller, J.R.; Anderson, A.L. Wildlife Strikes to Civil Aircraft in the United States, 1990–2020; Federal Aviation Administration: Washington, DC, USA, 2021. [Google Scholar]
- Ćwiklak, J. The Influence of a Bird Model Shape on Bird Impact Parameters. Facta Univ. Ser. Mech. Eng. 2020, 18, 639–651. [Google Scholar] [CrossRef]
- El-Sayed, A.F. Bird Strike in Aviation: Statistics, Analysis and Management; John Wiley & Sons: Hoboken, NJ, USA, 2019. [Google Scholar]
- EASA. CS-25, Certification Specifications for Large Aeroplanes, Amdt 11, EASA. 2011. Available online: https://www.easa.europa.eu/document-library/certification-specifications/cs-25-amendment-11 (accessed on 10 January 2022).
- EASA. CS-29, Certification Specifications, Acceptable Means of Compliance and Guidance Material for Large Rotorcraft, Amdt 9, EASA. 2021. Available online: https://www.easa.europa.eu/downloads/134339/en (accessed on 10 January 2022).
- Kalam, A.; Kumar, R.; Ranga; Janardhana, G. SPH High Velocity Impact Analysis-Influence of Bird Shape on Rigid Flat Plate. Mater. Today Proc. 2017, 4, 2564–2572. [Google Scholar] [CrossRef]
- Delsart, D.; Boyer, F.; Vagnot, A. Assessment of a substitute bird model for the prediction of bird-strike of helicopters structures. In Proceedings of the 7th International Conference on Mechanics and Materials in Design, Albufeira, Portugal, 11–15 June 2017; pp. 997–1010. [Google Scholar]
- Liu, J.; Li, Y.; Gao, X. Bird strike on a flat plate: Experiments and numerical simulations. Int. J. Impact Eng. 2014, 70, 21–37. [Google Scholar] [CrossRef]
- Guida, M.; Marulo, F.; Meo, M.; Russo, S. Certification by birdstrike analysis on C27J full scale ribless composite leading edge. Int. J. Impact Eng. 2013, 54, 105–113. [Google Scholar] [CrossRef]
- Pernas-Sánchez, J.; Artero-Guerrero, J.; Varas, D.; López-Puente, J. Artificial bird strike on Hopkinson tube device: Experi-mental and numerical analysis. Int. J. Impact Eng. 2020, 138, 103477. [Google Scholar] [CrossRef]
- Allaeys, F.; Luyckx, G.; Van Paepegem, W.; Degrieck, J. Numerical and experimental investigation of the shock and steady state pressures in the bird material during bird strike. Int. J. Impact Eng. 2017, 107, 12–22. [Google Scholar] [CrossRef]
- Wilbeck, J.S. Impact Behavior of Low Strength Projectiles; Technical Report AFML-TR-77-134; Air Force Materials Laboratory: Dayton, OH, USA, 1977. [Google Scholar]
- Barber, J.P. Bird Impact Forces and Pressures on Rigid and Compliant Targets; Technical Report AFFDL-TR-77-60; Air Force Flight Dynamics Laboratory: Wright-Patterson AFB, OH, USA, 1978. [Google Scholar]
- Hedayati, R.; Sadighi, M. Bird Strike: An Experimental, Theoretical and Numerical Investigation; Woodhead Publishing: Cambridge, UK, 2015. [Google Scholar]
- Lavoie, M.A.; Gakwaya, A.; Nejad Ensan, M.; Zimcik, D.G.; Nandlall, D. Bird’s substitute tests results and evaluation of available numerical methods. Int. J. Impact Eng. 2009, 36, 1276–1287. [Google Scholar] [CrossRef]
- Hedayati, R.; Ziaei-Rad, S. A new bird model and Effect of bird geometry and orientation on bird-target impact analysis using SPH method. Int. J. Crashworthiness 2012, 17, 445–459. [Google Scholar] [CrossRef]
- Hedayati, R.; Sadighi, M.; Mohammadi-Aghdam, M. On the difference of pressure readings from the numerical, experimental and theoretical results in different bird strike studies. Aerosp. Sci. Technol. 2014, 32, 260–266. [Google Scholar] [CrossRef]
- Zhang, D.; Fei, Q. Effect of bird geometry and impact orientation in bird striking on a rotary jet-engine fan analysis using SPH method. Aerosp. Sci. Technol. 2016, 54, 320–329. [Google Scholar] [CrossRef]
- Chuan, K.C. Finite Element Analysis of Bird Strikes on Composite and Glass Panels. Ph.D. Thesis, Department of Mechanical Engineering, National University of Singapore, Singapore, 2006. [Google Scholar]
- Heimbs, S. Computational methods for bird strike simulations: A review. Comput. Struct. 2011, 89, 2093–2112. [Google Scholar] [CrossRef]
- Dar, U.A.; Zhang, W.; Xu, Y. FE Analysis of Dynamic Response of Aircraft Windshield against Bird Impact. Int. J. Aerosp. Eng. 2013, 2013, 171768. [Google Scholar] [CrossRef]
- Yang, J.; Cai, X.; Wu, C. Experimental and FEM study of windshield subjected to high speed bird impact. Acta Mech. Sin. 2003, 19, 543–550. [Google Scholar]
- Wang, F.; Yue, Z. Numerical simulation of damage and failure in aircraft windshield structure against bird strike. Mater. Des. 2010, 31, 687–695. [Google Scholar] [CrossRef]
- Lavoie, M.A.; Gakwaya, A.; Nejad Ensan, M.; Zimcik, D.G. Validation of available approaches for numerical bird strike mod-eling tools. Int. Rev. Mech. Eng. 2007, 1, 380–389. [Google Scholar]
- Hedayati, R.; Ziaei-Rad, S. A new bird model and the effect of bird geometry in impacts from various orientations. Aerosp. Sci. Technol. 2013, 28, 9–20. [Google Scholar] [CrossRef]
- Soni, C.; Katukam, R. Bird Strike Analysis of an Airframe, Comparison of Methods and Validation. In Proceedings of the Simulia India Regional User Meeting ’13, Hyderabad, India, 2013. 2013, pp. 1–14. Available online: https://www.academia.edu/38652365/Bird_Strike_Analysis_of_an_Airframe_Comparison_of_Methods_and_Validation (accessed on 10 January 2022).
- Husainie, S.N. Bird Strike and Novel Design of Fan Blades. In Proceedings of the Science in the Age of Experience, Chicago, IL, USA, 15–18 May 2017. [Google Scholar]
- Ivančević, D.; Smojver, I. Hybrid approach in bird strike damage prediction on aeronautical composite structures. Compos. Struct. 2011, 94, 15–23. [Google Scholar] [CrossRef][Green Version]
- Lacome, J.L. Smoothed particle hydrodynamics method in LS-DYNA. In Proceedings of the 3rd German LS-DYNA Forum, Bamberg, Germany, 2004; pp. 7–33. [Google Scholar]
- Fragassa, C.; Topalovic, M.; Pavlovic, A.; Vulovic, S. Dealing with the Effect of Air in Fluid Structure Interaction by Coupled SPH-FEM Methods. Materials 2019, 12, 1162. [Google Scholar] [CrossRef]
- Zhu, S.; Wu, C.; Yin, H. Virtual Experiments of Particle Mixing Process with the SPH-DEM Model. Materials 2021, 14, 2199. [Google Scholar] [CrossRef] [PubMed]
- Lyu, H.-G.; Sun, P.-N.; Huang, X.-T.; Zhong, S.-Y.; Peng, Y.-X.; Jiang, T.; Ji, C.-N. A Review of SPH Techniques for Hydrodynamic Simulations of Ocean Energy Devices. Energies 2022, 15, 502. [Google Scholar] [CrossRef]
- Ropero-Giralda, P.; Crespo, A.J.C.; Coe, R.G.; Tagliafierro, B.; Domínguez, J.M.; Bacelli, G.; Gómez-Gesteira, M. Modelling a Heaving Point-Absorber with a Closed-Loop Control System Using the DualSPHysics Code. Energies 2021, 14, 760. [Google Scholar] [CrossRef]
- Mccarthy, M.A.; Xiao, J.R.; Mccarthy, C.T.; Kamoulakos, A.; Ramos, J.; Gallard, J.P.; Melito, V. Modelling Bird Impacts on an Aircraft Wing—Part 2: Modelling the Impact with an SPH Bird Model. Int. J. Crashworthiness 2005, 10, 51–59. [Google Scholar] [CrossRef]
- Plassarda, F.; Hereil, P.; Pierric, J.; Mespoulet, J. Experimental and numerical study of a bird strike against a windshield. Eu-Ropean Phys. J. Web Conf. 2015, 94, 01051. [Google Scholar] [CrossRef]
- Ćwiklak, J. Numerical simulations of a bird strike against a helicopter windshield. J. KONES Powertrain Transp. 2018, 25, 81–88. [Google Scholar]
- Arachchige, B.; Ghasemnejad, H.; Yasaee, M. Effect of bird-strike on sandwich composite aircraft wing leading edge. Adv. Eng. Softw. 2020, 148, 102839. [Google Scholar] [CrossRef]
- Ansari, H. Bird Strike Damage Analysis on a Model of a Business Jet Composite Wing Leading Edge. Unpublished MSC by. Master’s Thesis, Coventry: Coventry University, Coventry, UK, 2016. [Google Scholar]
- Di Caprio, F.; Sellitto, A.; Saputo, S.; Guida, M.; Riccio, A. A Sensitivity Analysis of the Damage Behavior of a Leading-Edge Subject to Bird Strike. Appl. Sci. 2020, 10, 8187. [Google Scholar] [CrossRef]
- Zhou, Y.; Sun, Y.; Huang, T. SPH-FEM Design of Laminated Plies under Bird-Strike Impact. Aerospace 2019, 6, 112. [Google Scholar] [CrossRef]
- Zhou, Y.; Sun, Y.; Huang, T. Bird-Strike Resistance of Composite Laminates with Different Materials. Materials 2019, 13, 129. [Google Scholar] [CrossRef]
- Jin, Y. A review of research on bird impacting on jet engines. In Proceedings of the IOP Conference Series, Materials Science and Engineering, Kuala Lumpur, Malaysia, 13 August 2018; p. 012014. [Google Scholar]
- Wu, B.; Lin, J.; Hedayati, R.; Zhang, G.; Zhang, J.; Zhang, L. Dynamic Responses of the Aero-Engine Rotor System to Bird Strike on Fan Blades at Different Rotational Speeds. Appl. Sci. 2021, 11, 8883. [Google Scholar] [CrossRef]
- Zhang, Z.; Li, L.; Zhang, D. Effect of arbitrary yaw/pitch angle in bird strike numerical simulation using SPH method. Aerosp. Sci. Technol. 2018, 81, 284–293. [Google Scholar] [CrossRef]
- Heimbs, S. Bird Strike Simulations on Composite Aircraft Structures. In Proceedings of the Simulia Customer Conference, Barcelona, Spain, 17–19 May 2011; pp. 1–13. [Google Scholar]
- Vijayakumar, R.; Gulbarga, K.; Ravindranath, R. Bird strike simulation on composite structures. In Proceedings of the 41st European Rotorcraft Forum, Munich, Germany, 19–20 May 2015. [Google Scholar]
- Hedayati, R.; Ziaei-Rad, S.; Eyvazian, A.; Hamouda, A.M. Bird strike analysis on a typical helicopter windshield with different lay-ups. J. Mech. Sci. Technol. 2014, 28, 1381–1392. [Google Scholar] [CrossRef]
- Orlando, S.; Marulo, F.; Guida, M.; Timbrato, F. Bird strike assessment for a composite wing flap. Int. J. Crashworthiness 2017, 23, 219–235. [Google Scholar] [CrossRef]
- Guida, M.; Marulo, F.; Meo, M.; Grimaldi, A.; Olivares, G. SPH—Lagrangian study of bird impact on leading edge wing. Compos. Struct. 2011, 93, 1060–1071. [Google Scholar] [CrossRef]
- Liu, J.; Yulonga, L.; Xiaoshengb, G.; Xiancheng, Y. A numerical model for bird strike on side wall structure of an aircraft nose. Chin. J. Aeronaut. 2014, 27, 542–549. [Google Scholar] [CrossRef]
- Airoldi, B.; Cacchione. Modeling of Impact Forces and Pressures in Lagrangian Bird Strike Analyses. Int. J. Impact Eng. 2006, 32, 1651–1677. [Google Scholar] [CrossRef]
- Ćwiklak, J. Numerical simulations of bird strikes with the use of various equations of state. J. KONBiN 2020, 50, 333–345. [Google Scholar] [CrossRef]
- Ugrčić, M. Application of the Hydrodynamic Theory and the Finite Element Method in the Analysis of Bird Strike in a Flat Barrier. Sci. Techn. Rev. 2012, 62, 28–37. [Google Scholar]
- Livermore Software Technology Corporation. LS-DYNA Keyword User’s Manual; Livermore Software Technology Corporation: Livermore, CA, USA, 2007. [Google Scholar]
- Zochowski, P.; Bajkowski, M.; Grygoruk, R.; Magier, M.; Burian, W.; Pyka, D.; Bocian, M.; Jamroziak, K. Comparison of Numerical Simulation Techniques of Ballistic Ceramics under Projectile Impact Conditions. Materials 2022, 15, 18. [Google Scholar] [CrossRef]


Publisher’s Note: MDPI stays neutral with regard to jurisdictional claims in published maps and institutional affiliations. |
© 2022 by the authors. Licensee MDPI, Basel, Switzerland. This article is an open access article distributed under the terms and conditions of the Creative Commons Attribution (CC BY) license (https://creativecommons.org/licenses/by/4.0/).