Abstract
This paper proposes an approach for the accurate and efficient parameter identification of lithium-ion battery packs using only drive cycle data obtained from hybrid or electric vehicles. The approach was experimentally validated using data collected from a BMW i8 hybrid vehicle. The dual polarization model was used, and a new open circuit voltage equation was proposed based on a simplification of the combined model, with the aim of reducing the number of parameters to be identified. The parameter identification was performed using NEDC data collected on a rolling road dynamometer; the results showed that the proposed model improved the accuracy of terminal voltage estimation, reducing the peak voltage error from 2.16% using the Nernst model to 1.28%. Furthermore, the robustness of these models in maintaining accuracy when new drive cycles were used was evaluated by comparing WLTC simulations with experimental measurements. The proposed model showed improved robustness, with a reduction in RMS error of more than 50% compared to the Nernst model. These findings are significant because they will improve the accuracy of model-based battery management systems used in electric vehicles, allowing for improved performance prediction without the requirement of recharacterization for different drive cycles or individual cell characterization.
1. Introduction
With the increasing electrification of vehicles in combination with more rigorous and variable test procedures, it is becoming crucially important to fully understand and be able to predict the behavior of each component of the powertrain for a real driving scenario. This is particularly important when considering the battery pack (whether for hybrid or fully electric vehicles) in order to predict performance, range and reliability. The ability to simulate battery performance is important both in the development stage and once the battery is in service. This ensures that a robust and efficient powertrain can be developed and operated through its serviceable lifetime.
Powertrain models, especially the battery pack, need a rigorous validation approach so that they can be used in the development process with a high degree of confidence [1,2,3]. Models for full electric and hybrid powertrains are required for running reliable simulations involving energy storage, e.g., for sizing powertrain components or developing energy management algorithms [4]. Battery modeling also plays a crucial role in improving the performance of battery powered systems, especially in electric vehicle (EV) applications.
A significant challenge is the identification of an appropriate level of battery model to achieve accurate drive cycle predictions without excessive computational complexity [5]. This trade-off requires the battery model to use a behavioral cell-based approach, where the parameters can be identified from higher-order system-level data. The electrical behavior of lithium-ion batteries is hard to predict and highly dependent on the materials used for the electrolyte and the electrodes. Moreover, having reliable information on quantities that are not directly measurable is a requirement for operating battery-based hybrid and electric vehicles in a safe and efficient manner [1,2,3]. One of the difficulties in the development of such models is defining an optimal tradeoff between their generic nature and their accuracy for specific batteries [2,6].
With respect to the use of online models in the battery management system (BMS), a further challenge currently faced in the industry is to track battery parameters as they change over the lifetime of the battery so that the model used by the BMS for the calculation of operation limits does not develop significant errors. The field of online parameter identification is of growing importance, especially the ability to determine battery model parameters directly from in-service data rather than requiring a standardized test procedure. This is also of interest in cases where it is not possible or practical to conduct controlled testing of individual battery cells.
To date, many state-of-the-art battery models have been proposed by researchers to improve the performance of EVs. In this study, a methodology to characterize an equivalent electric circuit-based approach was used to develop an EV battery model capable of accurately and efficiently tracking the voltage, current and state of charge.
The aim of this work was to investigate model accuracy, which can be achieved by using only model parameter identification based on real world driving for a complete battery pack, and to evaluate the robustness of the resulting model. In this paper, a comparison is drawn between three different models, examining the balance between complexity and accuracy. Furthermore, we propose an improved OCV-SOC model, which is sufficiently adequate for terminal battery voltage estimation but carries the advantage of being composed from fewer terms [7,8]. Another advantage of this approach is that it is easier to characterize and requires fewer parameters to obtain a good fit with empirical data. This will be demonstrated in the next sections of the paper.
In Section 2, this paper presents the common battery models and identifies those used in this study, including a variation on the open circuit voltage function compromising accuracy and complexity. Section 3 details the experimental data collection from a BMW i8 HEV on a chassis dynamometer. Section 4 details the parameter identification methodology from drive cycle data, and Section 5 shows the corresponding results. A discussion and conclusions are given in Section 6 and Section 7, respectively.
2. Proposed Battery Electrical Model
There are many methods of modeling battery operation, and each model has its own benefits and drawbacks [9,10]. A wide variety of battery models with varying degrees of complexity have been developed; in this work, the primary criterion for the choice of the model was the error of the fitting with the provided experimental data [11]. This was also balanced with a pragmatic trade-off to achieve this accuracy while being able to run efficiently enough to achieve complete drive cycle predictions in a reasonable time. In this section of the paper, we will review the current state of the art in battery models for this type of analysis and suggest an improvement to the current optimum model for this level of simulation to reduce model complexity and maintain accuracy.
2.1. Overview of Equivalent Circuit Battery Models
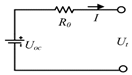
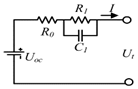
Many mathematical battery models exist and are based on stochastic approaches or empirical equations. The electric circuit-based or equivalent circuit models (ECMs) are the most intuitive for use in circuit simulations. These models are usually based on Thevenin equivalents and impedances. These models are simple and therefore are computationally less intensive. However, their simplicity and their ability to predict I-V characteristics make them suitable for the dynamic modeling of electric vehicles. An ECM comprises a combination of resistances and capacitors [12,13,14,15,16,17]. Our work provides a comprehensive study of an increment in the simulation results’ accuracy that is obtainable with the adoption of a non-linear Thevenin model (also called the electrochemical polarization model or classical first-order RC battery model) with some modifications, which provides a more sophisticated extraction of model parameters from the results of experimental characterization. In the following investigation, a description of the baseline model is reported [11,14]. This model is shown in Figure 1. The model parameters were identified using several optimization methods based on the experimental data from a Li-ion battery pack [14].
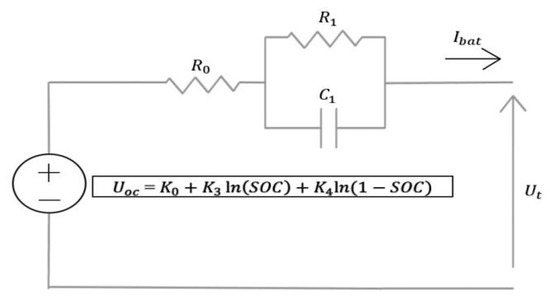
Figure 1.
Thevenin equivalent circuit model with Nernst OCV–SOC relation used as the baseline model for comparison against Model I.
To predict the performance of batteries, many different mathematical models exist [16,17,18]. All these models aim to model the battery’s behavior with great reliability and present some phenomena inside the battery cell. Equivalent circuit models are widely used, including the Rint model, the Thevenin model and the dual polarization (DP) model. These are shown and compared in Table 1. A taxonomy of available battery models and modelling techniques is provided in [19,20,21]. In our study, we opted for equivalent circuit models (ECMs) consisting of a voltage source connected to SOC, an internal resistor and parallel resistance-capacitance (RC) networks, which can describe the electrical relationship between the input current and the terminal voltage [22]. Generally, in ECMs, the resistor corresponds to the self-discharge and high-valued capacitor, and the voltage source represents the battery open circuit voltage (OCV). The RC pairs with different time constants to represent the diffusion process in electrolyte and porous electrodes and the charge transfer and double layer effect in the electrode.

Table 1.
Common equivalent circuit battery models.
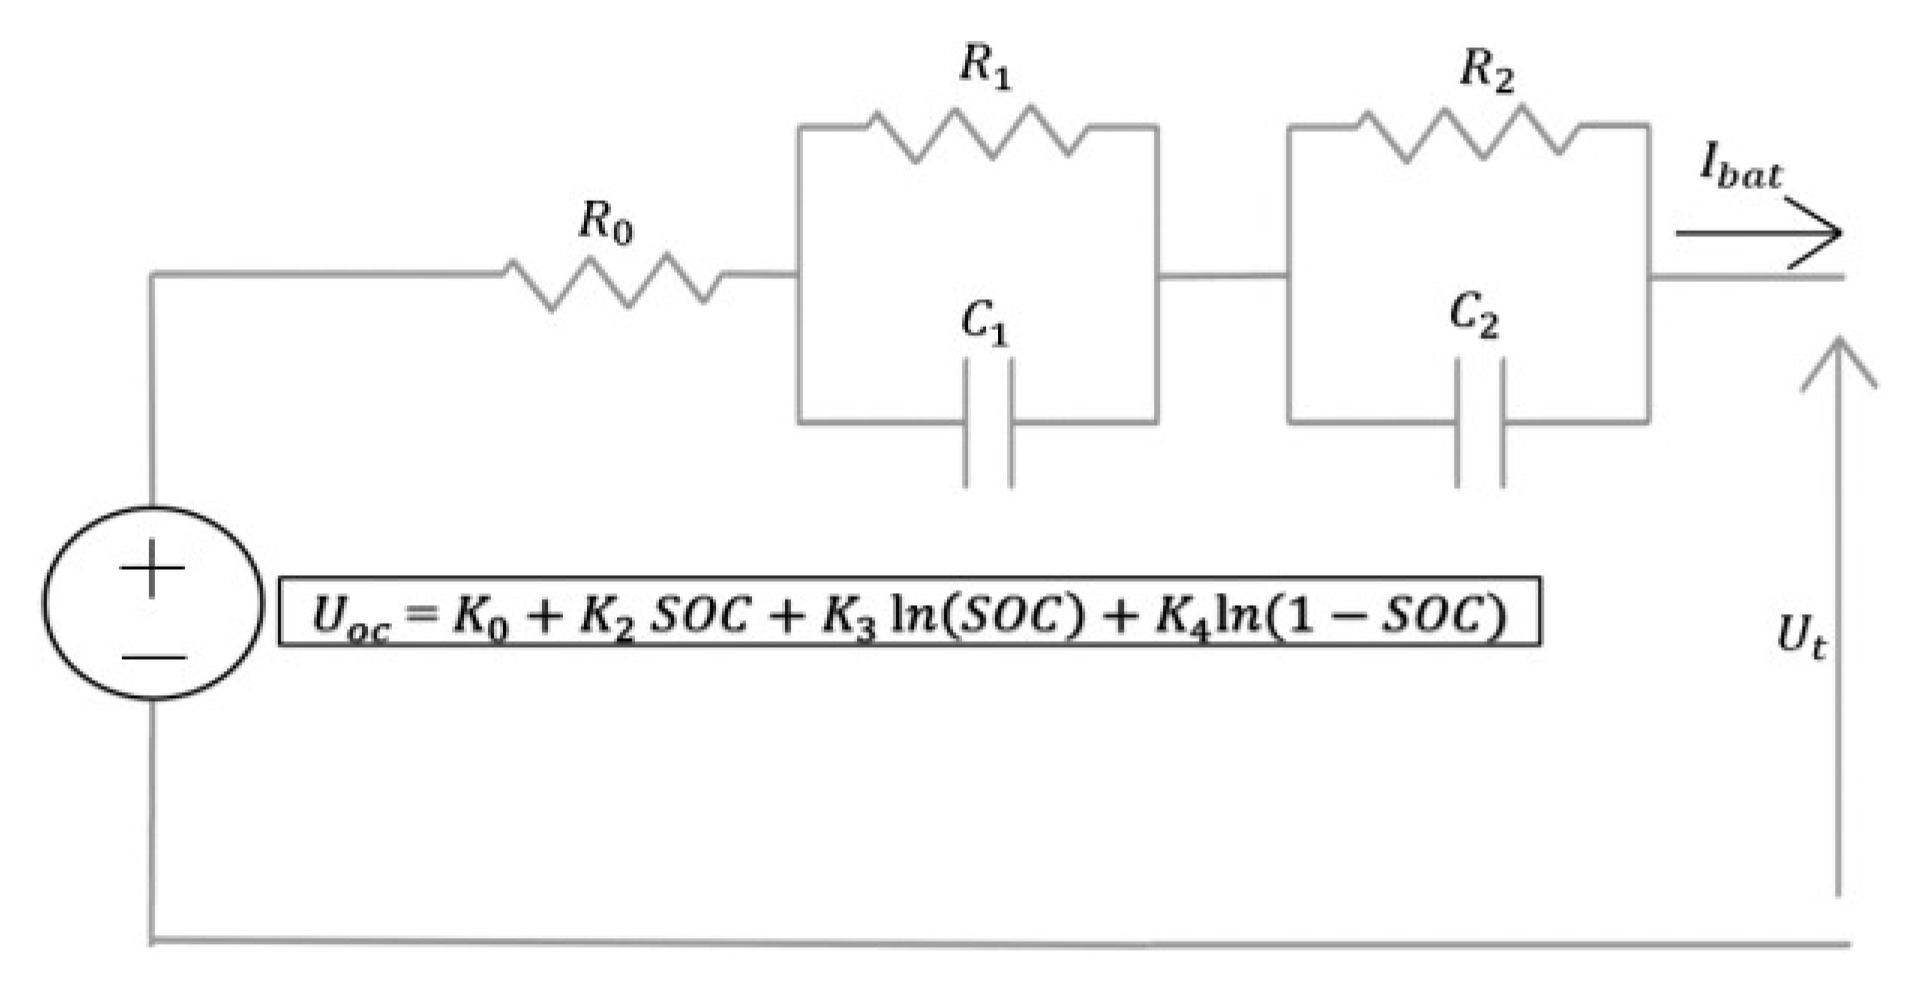
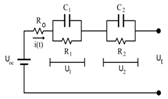
The model used in this work, presented in Figure 2, offers simplicity in parameter identification [18]. The governing equations for the model are given by:
where Ut is the battery terminal voltage; UOC is the open circuit voltage of the battery, as described in Section 2.2; U0 is the voltage across the Ohmic resistance R0; U1 and U2 are the voltages across the slow R1C1-branch and fast R2C2-branch, respectively, which are used to model the transient response of the terminal voltage; and Ibat is the terminal current. R1 and R2 are the polarization resistances and C1 and C2 are the polarization capacitances, which are used to describe the transient response during charging and discharging.
Ut = UOC − U0 − U1 − U2
UOC = K0 + K2SOC + K2ln(SOC) + K4ln(1 − SOC)
U0 = R0·Ibat

Figure 2.
Dual polarization equivalent circuit model with two RC branches.
2.2. Open Circuit Voltage Model
The OCV depends on the SOC, and its modeling is imperative since it is part of the com- plex physical behavior of the battery and has the largest influence on Ut. The adjustment of the OCV model can make a significant contribution to increasing the accuracy of battery voltage estimation; thus, it must be designed carefully [25].
The OCV is represented in the equivalent circuit model as a DC voltage source, whose voltage (UOC) is some function of the SOC. A literature review summarizing the most common OCV–SOC relations is presented in Table 2. The coefficients K0 to K4 are constants chosen to make the model fit the data well. Here, the Nernst model was assumed as the baseline model, and we evaluated the benefit of adding the K2SOC term (from the combined model) without adding the K1·SOC−1 term.
Table 2.
Overview of OCV functions.
2.3. State of Charge (SOC) Calculation Method
The state of charge (SOC) is the available charge in the battery expressed as a per- centage of its nominal charge capacity. The SOC is calculated using the standard Coulomb counting method described by Equation (12):
where SOC0 represents the initial SOC, Cbat is the nominal battery capacity in Ah and Ibat is battery terminal current in Amperes (positive in discharge, negative in charge). The SOC ranges from 0% (fully discharged) to 100% (fully charged).
2.4. Summary of Proposed Models
In order to properly evaluate the effect of adding a second RC pair, as well as the effect of the additional term in the UOC model, three models will be compared as follows.
- Model I uses a Thevenin equivalent circuit model combined with the Nernst form for the UOC;
- Model II introduces a second RC pair in the equivalent circuit model (the dual polarization (DP) model) combined with the Nernst form for the UOC;
- Model III further builds on Model II by introducing a new model for UOC, proposed as a compromise between the Nernst and the combined models, in which we add the term K2SOC but do not add a term inversely proportional to the SOC. This definition of UOC is shown in Table 2.
The models of the battery cell and pack were developed in MATLAB. A mathematical and physical model was combined to calculate state of charge, battery voltage and battery current. The assumption was made that every cell in the pack was identical and balanced in both series and parallel directions (i.e., that a perfect BMS was incorporated in the battery pack at the system level).
3. Data Collection Methodology
Data Collection for Model Evaluation
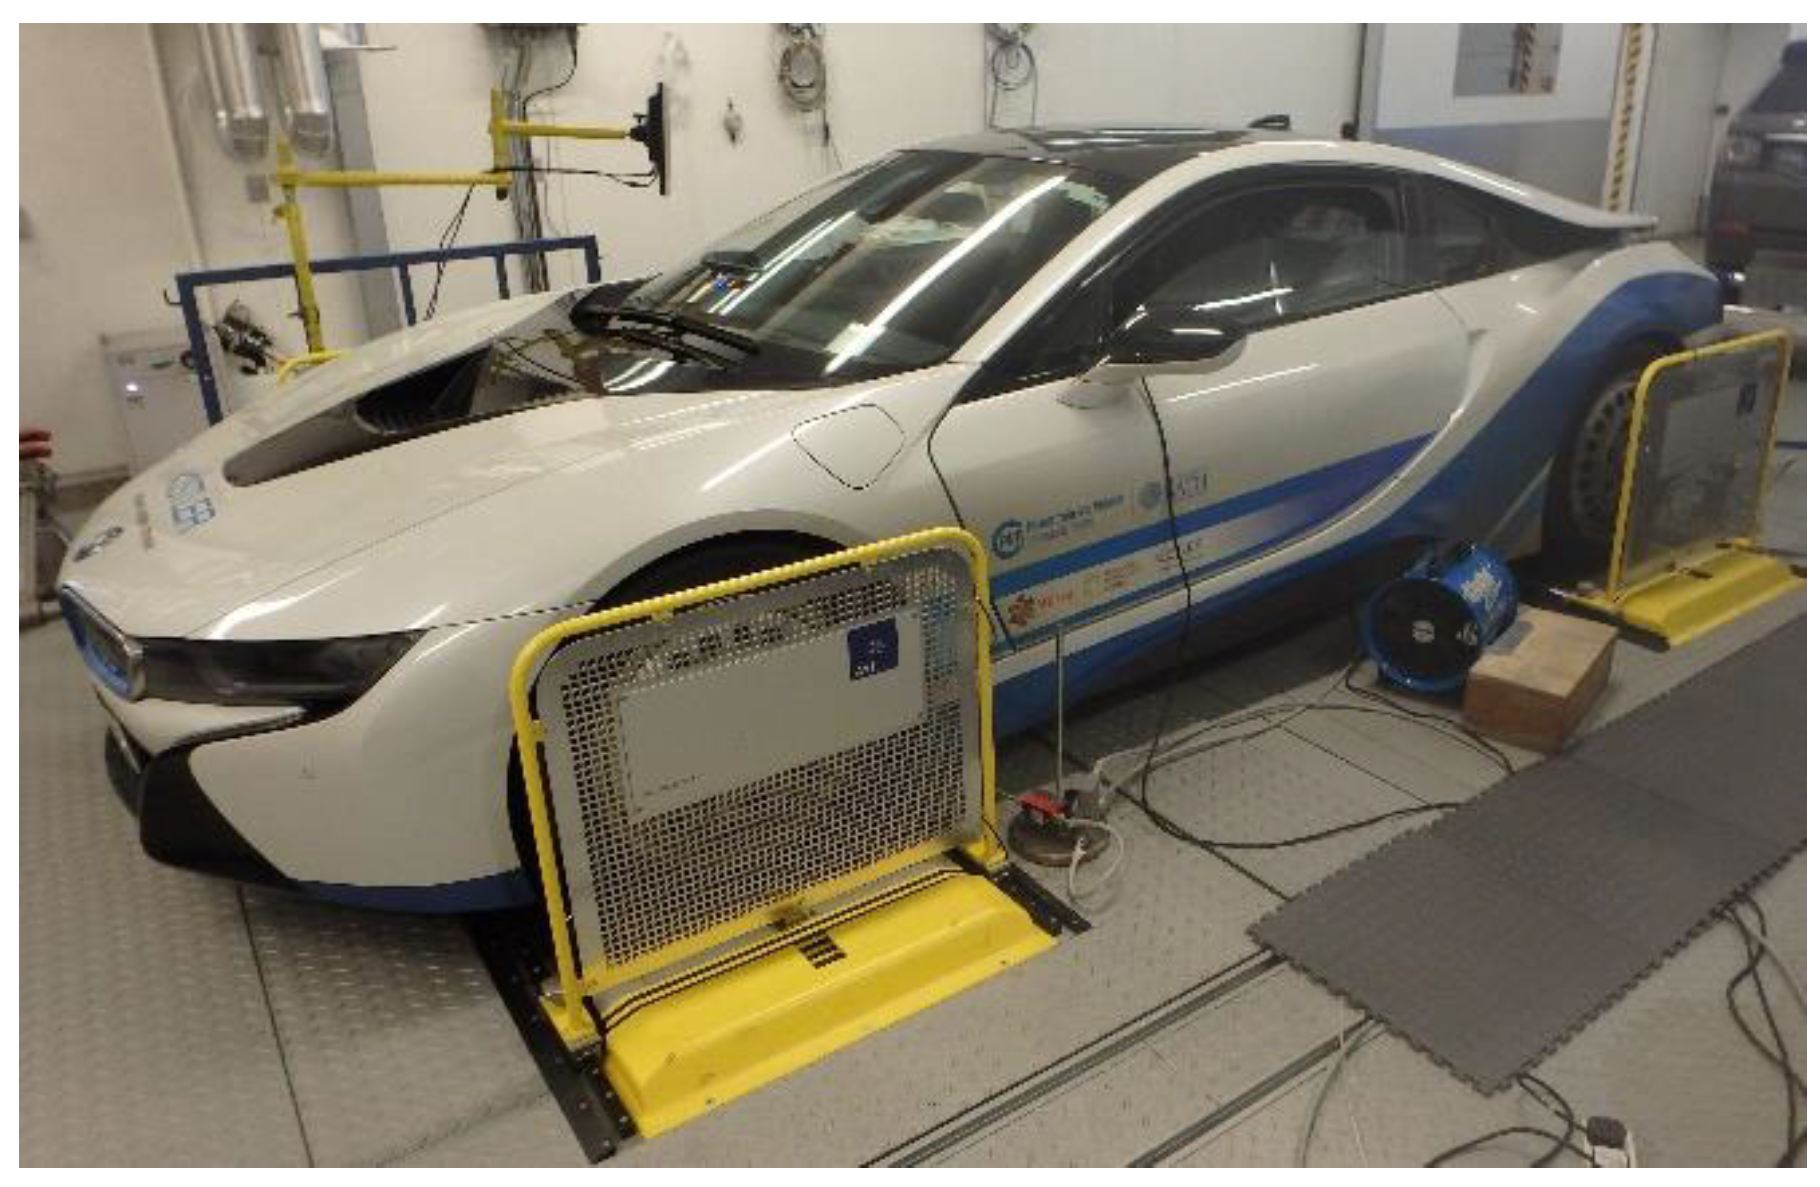
Experimental data for this study were collected with a state-of-the-art four-wheel drive chassis dynamometer facility at the Institute for Advanced Automotive Propulsion Systems, University of Bath, UK. The facility is climatically controlled and features a road speed fan to replicate on-road cooling conditions for the vehicle (Figure 3).
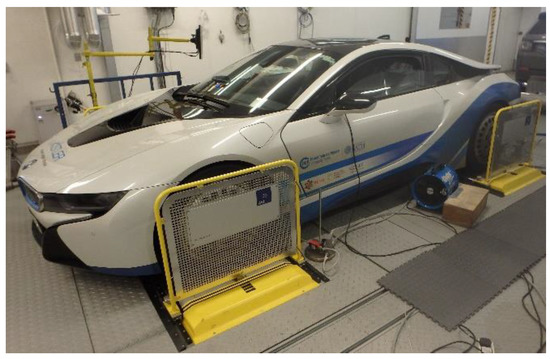
Figure 3.
The BMW i8 test vehicle installed on the chassis dynamometer facility at IAAPS, University of Bath [26].
The test vehicle used in this study was a BMW i8 plug-in hybrid vehicle (model year 2016) [26]. An overview of the powertrain is given in Figure 4. The powertrain consists of a 1.5 L gasoline-fueled internal combustion engine (ICE) driving the rear axle via a 6-speed automatic transmission. This is combined with a 96 kW electric motor, which drives the front axle via a 2-speed transmission. The mechanical link between the front axle electric drive and the rear axle combustion engine is achieved through the road, allowing the powertrain to operate as a parallel hybrid.
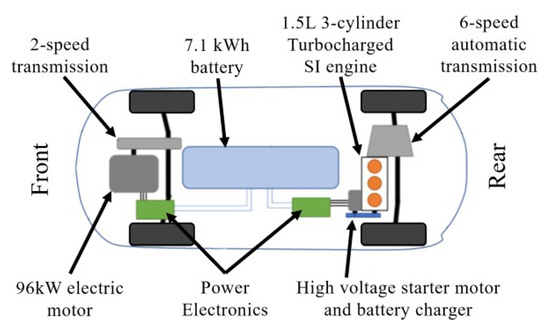
Figure 4.
Schematic layout of the hybrid powertrain of the BMW i8 test vehicle.
The high-voltage battery pack has a capacity of 21 Ah (7.1 kWh). It contains a total of 96 cells, arranged in one string (1P 96S), and subdivided into 6 series-connected modules of 16 series-connected cells. The nominal voltage of the battery pack is 355 V. The cooling is achieved by refrigerant (air conditioning), which also doubles to deliver the cabin climatic control. Further details can be found in [26]. The vehicle is equipped with a driver- controlled mode, which allows one of the following three driving modes [26]:
- Electric-only mode, which limits power delivery to the front axle, only if sufficient battery charge is available;
- Standard “comfort” mode, which automatically uses both the front and rear axles, switching between electric only and bi-power modes according to an energy management strategy;
- Sport mode, which makes extensive use of the combustion engine to avoid engine start-up delays during pull-away maneuvers. When this mode is engaged during on- road driving, the battery is generally being charged by the ICE.
In this case, the vehicle was run in electric-only mode, to make maximum use of the high-voltage battery.
The road load for the vehicle was obtained from on-road coast-down testing of the vehicle (in the absence of manufacturer coast down data). The vehicle was tested on a relatively flat road, and multiple coast-down tests were conducted in both directions to negate the effect of small road gradients or wind conditions. The data were extrapolated to cover the region upwards from 60 mph (the speed limit on the test road) up to the maximum speed on the WLTC cycle.
The data were then input to the chassis dynamometer control system, and an auto- mated fitting algorithm was used to refine the dynamometer coefficients over several runs until a coast-down match was obtained [26].
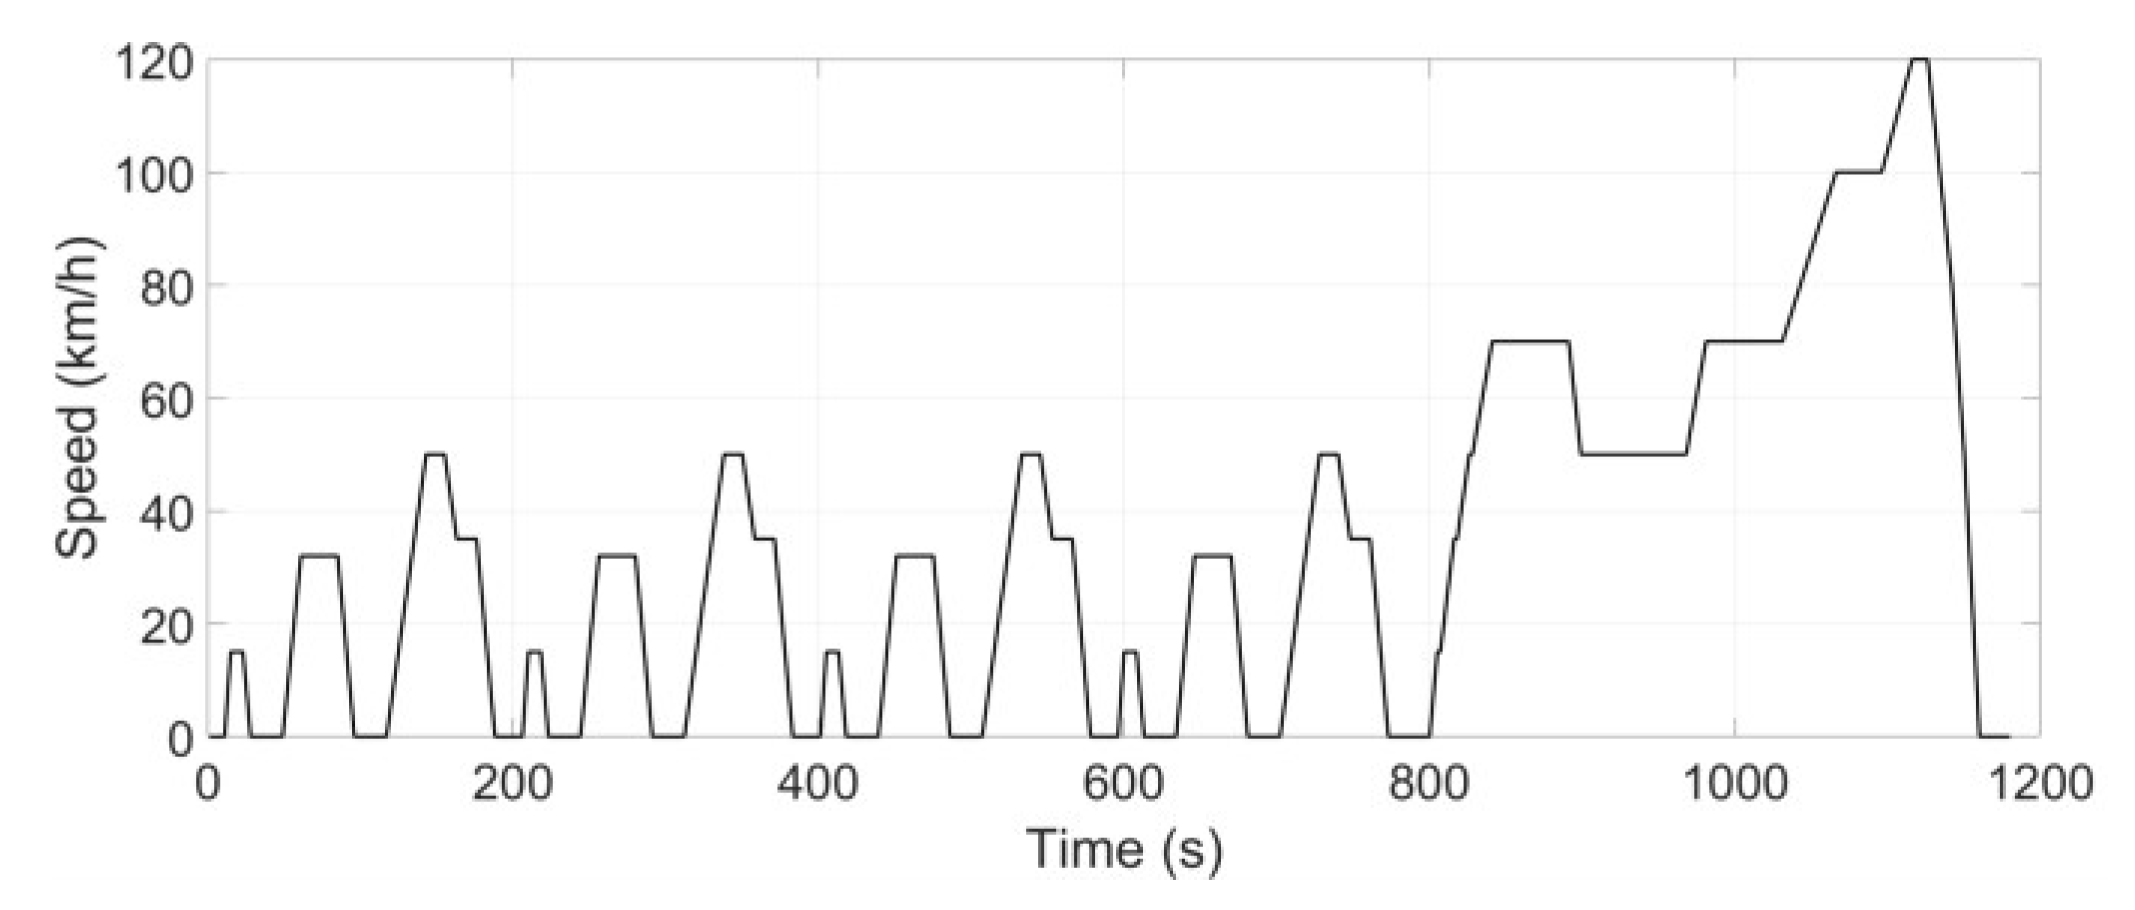
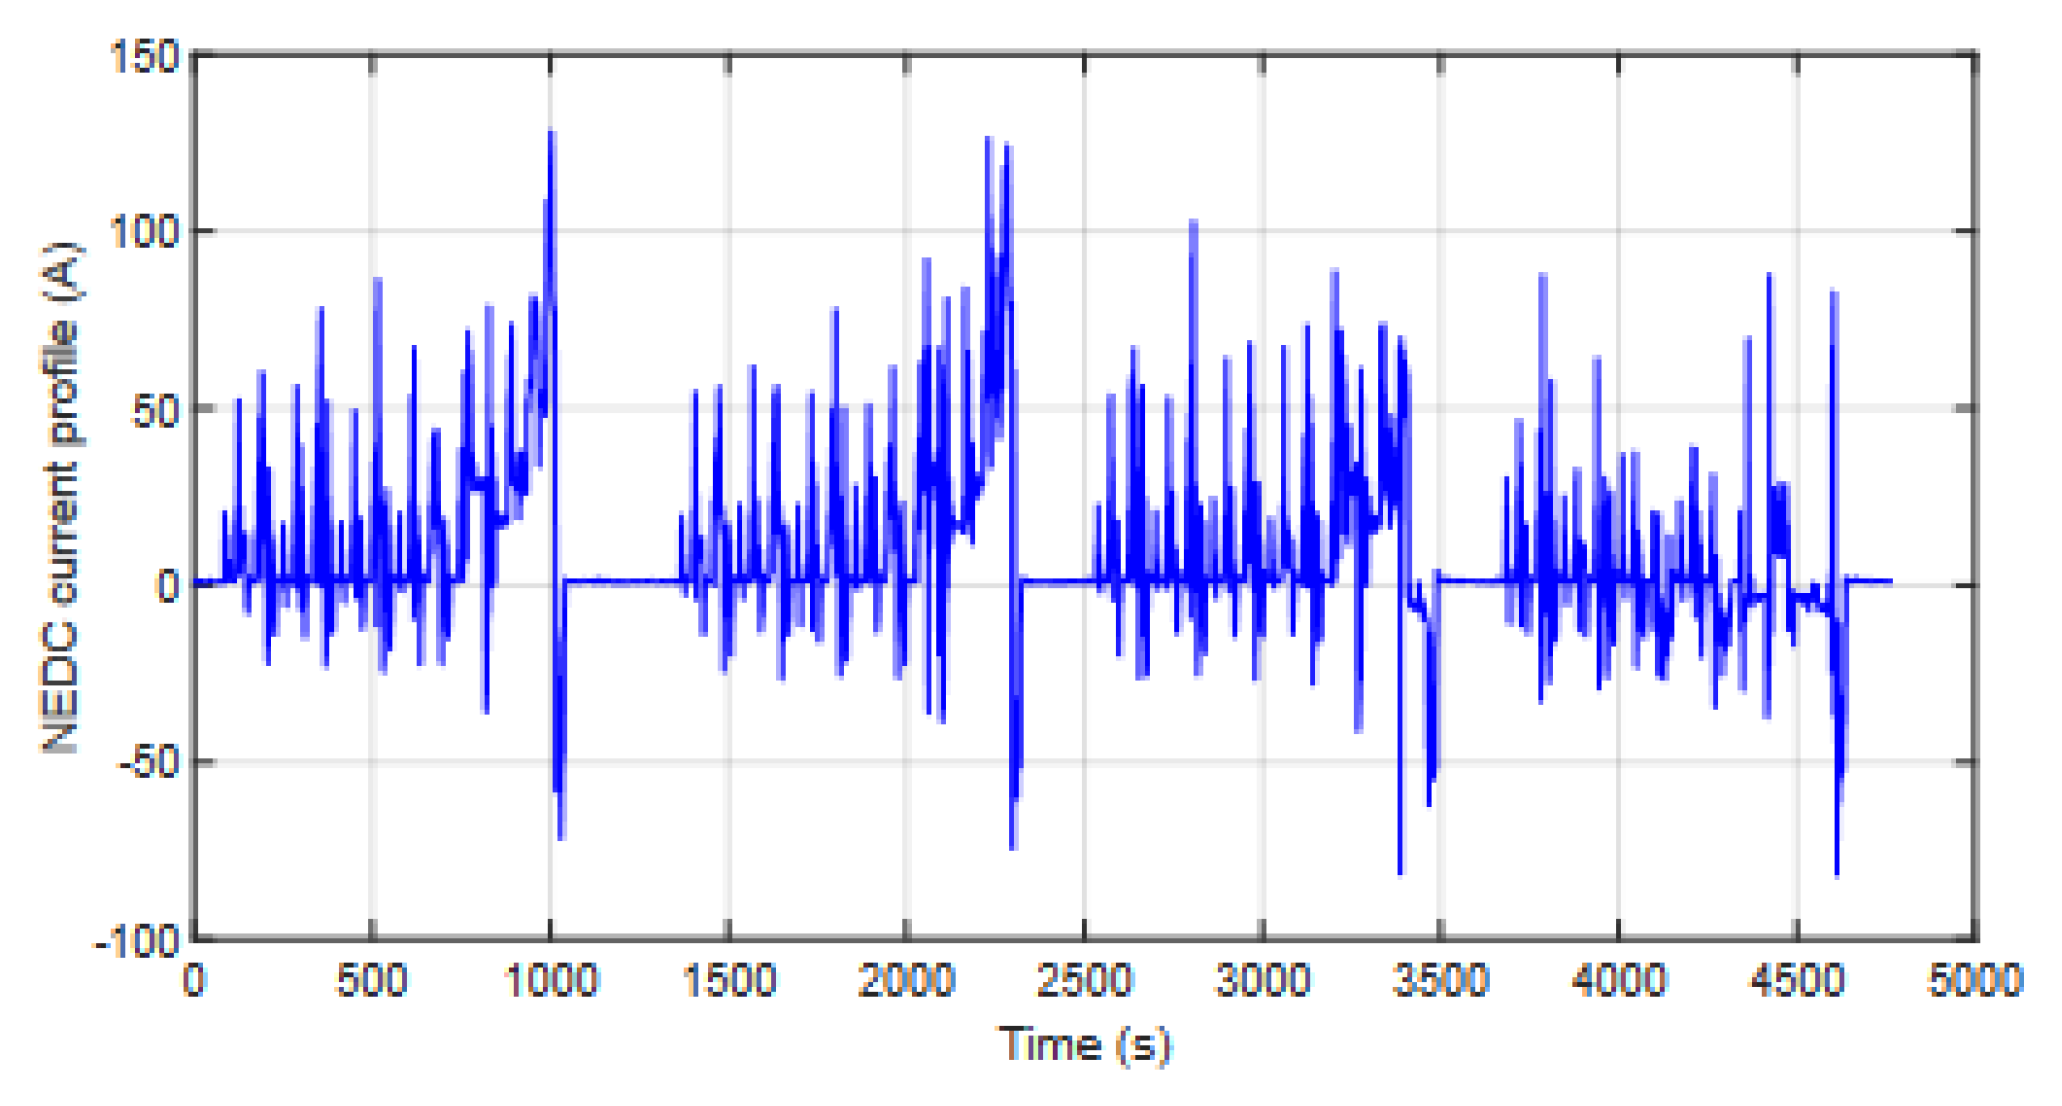
The driving cycles used in this study were the two most recent legislative driving cycles in Europe, namely the World-Harmonized Light-Duty Vehicles Test Cycle (WLTC), used for all new car registration in Europe since 2018, and the New European Driving Cycle (NEDC), used prior to 2018 [27]. The NEDC (Figure 5) is a modal-based driving cycle consisting of steady accelerations and cruise periods that are quite unrepresentative of real-world driving. In contrast, the WLTC (Figure 6) was developed with the aim of being used as a global test cycle across the world, taking into account temperature, environment and driver behavior. It is made up of segments of real driving, is highly transient and is more representative of real driving. The differences between these two cycles make it interesting to compare the performance of the models on these two datasets. Table 3 summarizes important data from each driving cycle. Since neither cycle was long enough to fully drain the battery, each cycle was run repeatedly until the vehicle automatically started the ICE to avoid over-depleting the battery; thus, we obtained data over the full operating SOC range of the battery.

Figure 5.
NEDC test cycle.
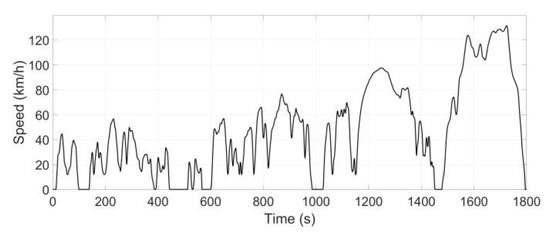
Figure 6.
WLTP/WLTC test cycle including low, medium, high and extra-high phases.
Table 3.
Comparison of driving cycles.
4. Parameter Identification Methodology
4.1. Overview of the Model Characterization Process
The principle of this optimization method is to minimize the objective subject to the constraints; the Optimization Toolbox in MATLAB provides tools designed for this purpose. We begin by defining our optimization problem using an objective function and then use standard toolbox solvers to find optimal solutions [14,15]. The parameter estimation procedure requires data in the form of mixed discharge/charge curves.
The model-based estimation takes an iterative approach to battery model parameter estimation, as shown in Figure 7 and Figure 8 [28]. The observed battery parameters are assumed to be exactly equivalent to the real battery parameters (no measurement error); therefore, the battery voltage predicted by the model is expected to be the same as the measured terminal voltage [29].
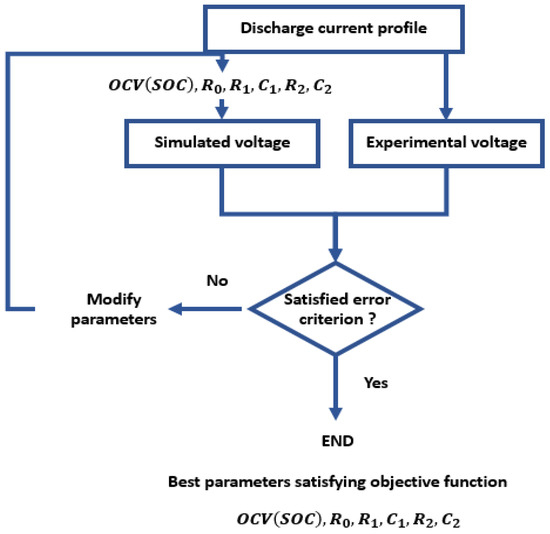
Figure 7.
Flow diagram of the estimation procedure [30].
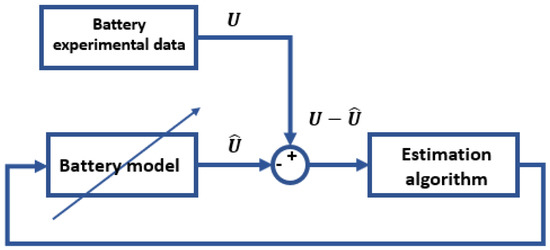
Figure 8.
Iterative approach to battery model parameter estimation.
The parameter identification problem may be formulated as follows (Figure 7): Find the unknown parameters of the model (K0, K2, K3, K4, R0, R1, C1, R2, C2) so as to minimize the error between the model predictions and the experimental data. The optimization adjusts parameters to minimize error between the experimental battery dataset and the corresponding simulated results, given identical input signals [19,20,21]. This may be formulated as a multivariable optimization problem with a single objective (cost) function [16].
In our case study, the cost function J to be minimized is the mean squared error (MSE) between the experimental battery voltage and the simulated voltage (U and , respectively, in Figure 8) given by Equation (13).
4.2. Optimization Algorithm
There are a large number of potential optimization algorithms that can be employed to characterize model parameters with a trade-off between the convergence speed and the accuracy achieved [25,31].
To select the algorithms used for the optimization in this work, the convergence curves of the various potential algorithms were compared. The choice of algorithm was based on a compromise between the convergence speed (which must be fast), number of iterations and the final value of the cost function to be minimized. Previous work has demonstrated that good fitting results have been obtained achieved using a variety of algorithms, including “Genetic Algorithm”, “Fmincon”, “Fminsearch” or “Pattern Search” [30,32].
Of the various optimization algorithms available in the MATLAB Optimization Toolbox, the most suitable depends on the problem at hand. To minimize a function with one variable in a domain, Fminbnd is used, and for the cases where the function has several variables, Fminsearch is used. For constrained problems, Linprog and Quadrprog are used for linear and quadratic cases, respectively. The Fmincon function is used to find the minimum of a problem with nonlinear and multi-variable constraints. In this work, a sequence of algorithms was used to optimize the cost function. Initially, the Fminsearch algorithm was used to find a local optimum that minimized the cost function defined in Equation (13); then, the parameters found were used as initial parameters for the second algorithm, Fmin- con, and finally for the Genetic Algorithm. The results were compared in order to take the algorithms that gave a minimal cost function. The Genetic Algorithm provided the best set of parameters, and using the initial conditions provided from initial search algorithms resulted in an efficient and accurate solution in the shortest time.
5. Results
The parameter identification was performed using experimental NEDC data to fit the models. The performance of each of the three models was compared with respect to the NEDC data. Furthermore, the accuracy and robustness of the models to new data was evaluated by simulating the WLTC and comparing the simulated results against the experimental results. The two current profiles applied are shown in Figure 9 (NEDC) and Figure 10 (WLTC).

Figure 9.
NEDC battery current profile from data recorded on chassis dynamometer.
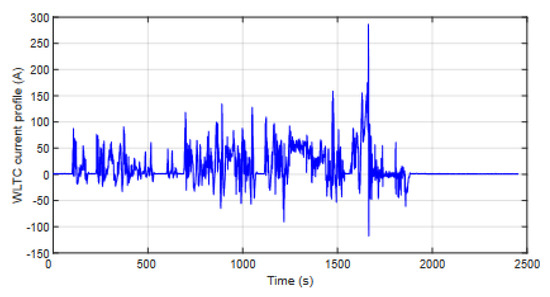
Figure 10.
WLTC battery current profile from data recorded on chassis dynamometer.
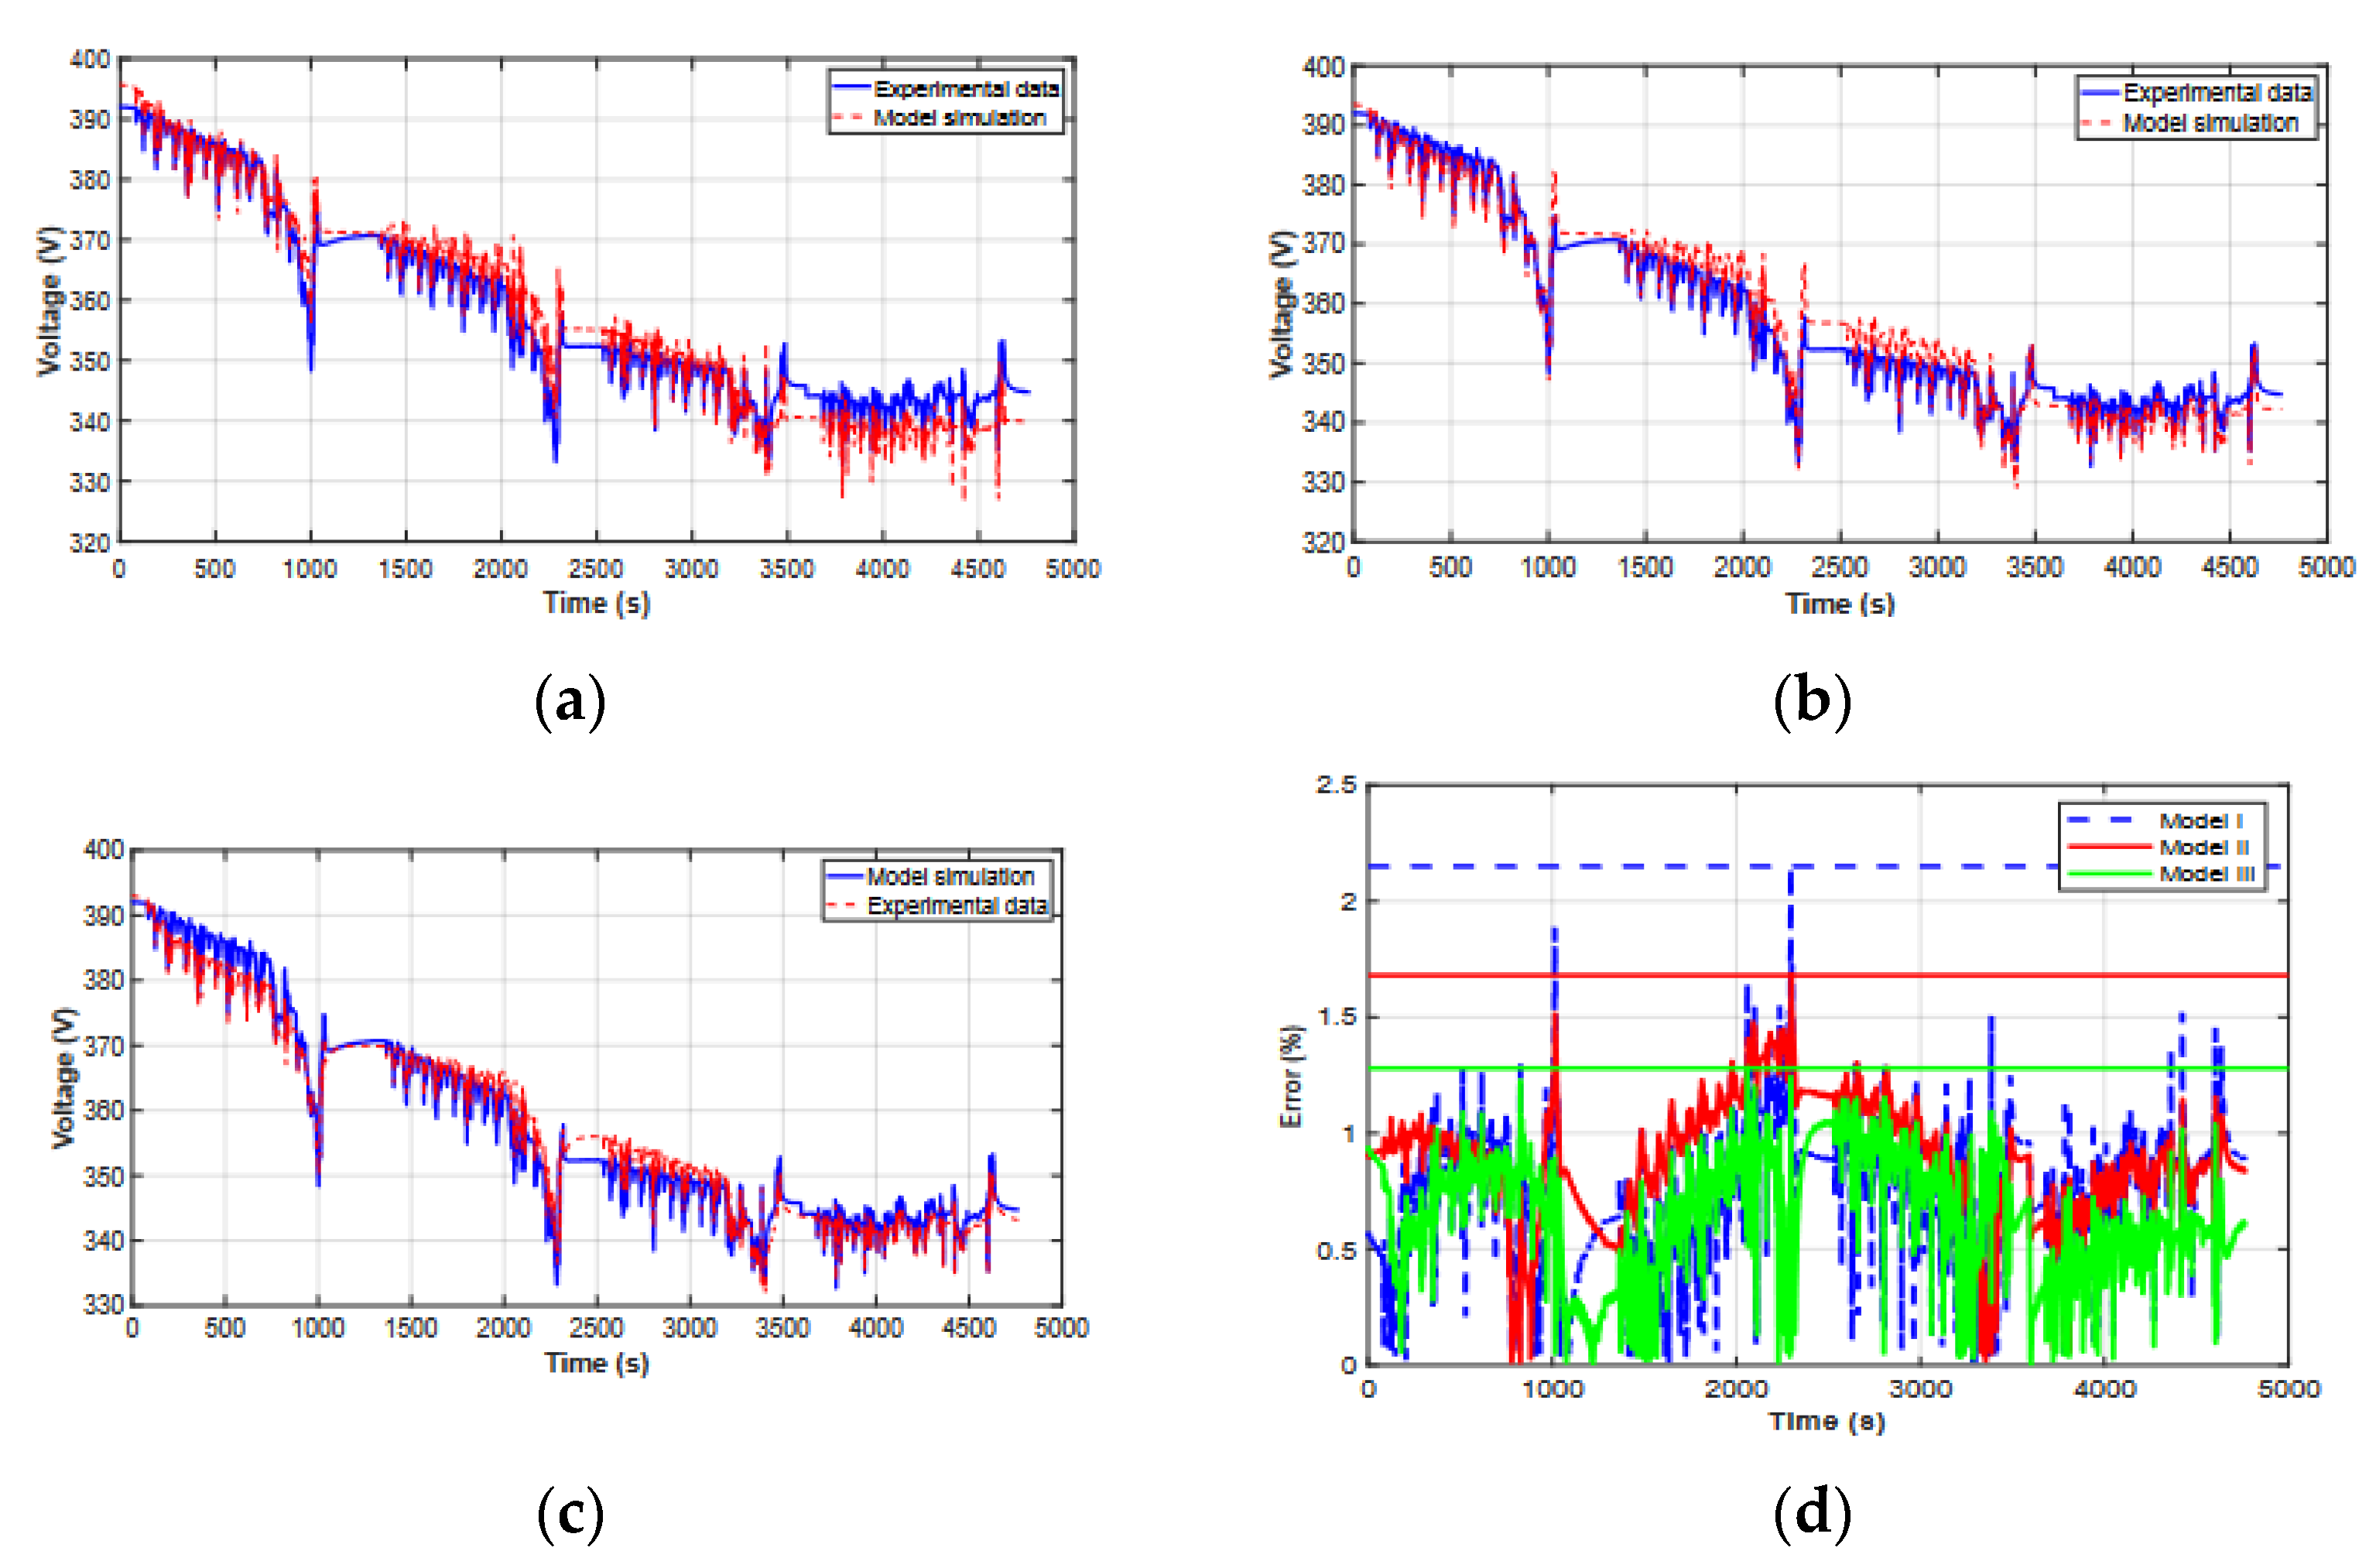
Using the proposed parameter identification approach, the model parameters were identified, as shown in Table 4. These parameters were obtained using the NEDC dataset for identification. The results of the model fitting (for the three models studied) are presented in Figure 11, while the fit achieved for the WLTC is shown in Figure 12. Figure 11d and Figure 12d show the relative error between the simulated and empirical voltage for the NEDC and WLTC, respectively. Table 5 summarizes the peak errors and root mean square error (RMSE) achieved for each driving cycle for each of the three models studied—the Thevenin– Nernst (Model I), DP-Nernst (Model II) and the DP model with the OCV–SOC relation presented in this paper (Model III).
Table 4.
Results of parameter identification.
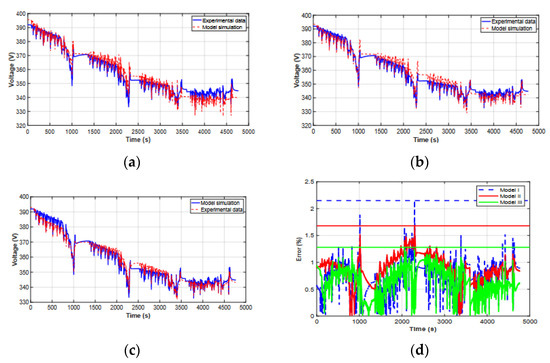
Figure 11.
Simulation results following parameter identification using experimental NEDC data: (a) experimental and simulated voltage during NEDC identification, Model I; (b) experimental and simulated voltage during NEDC identification, Model II; (c) experimental and simulated voltage during NEDC identification, Model III; (d) Relative absolute error between simulated and experimental voltage for NEDC driving cycle. The horizontal lines are a guide indicating the peak error for each model.
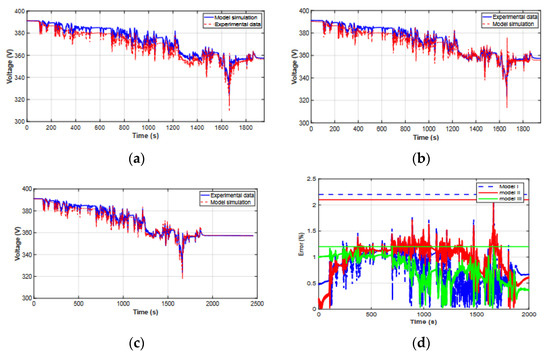
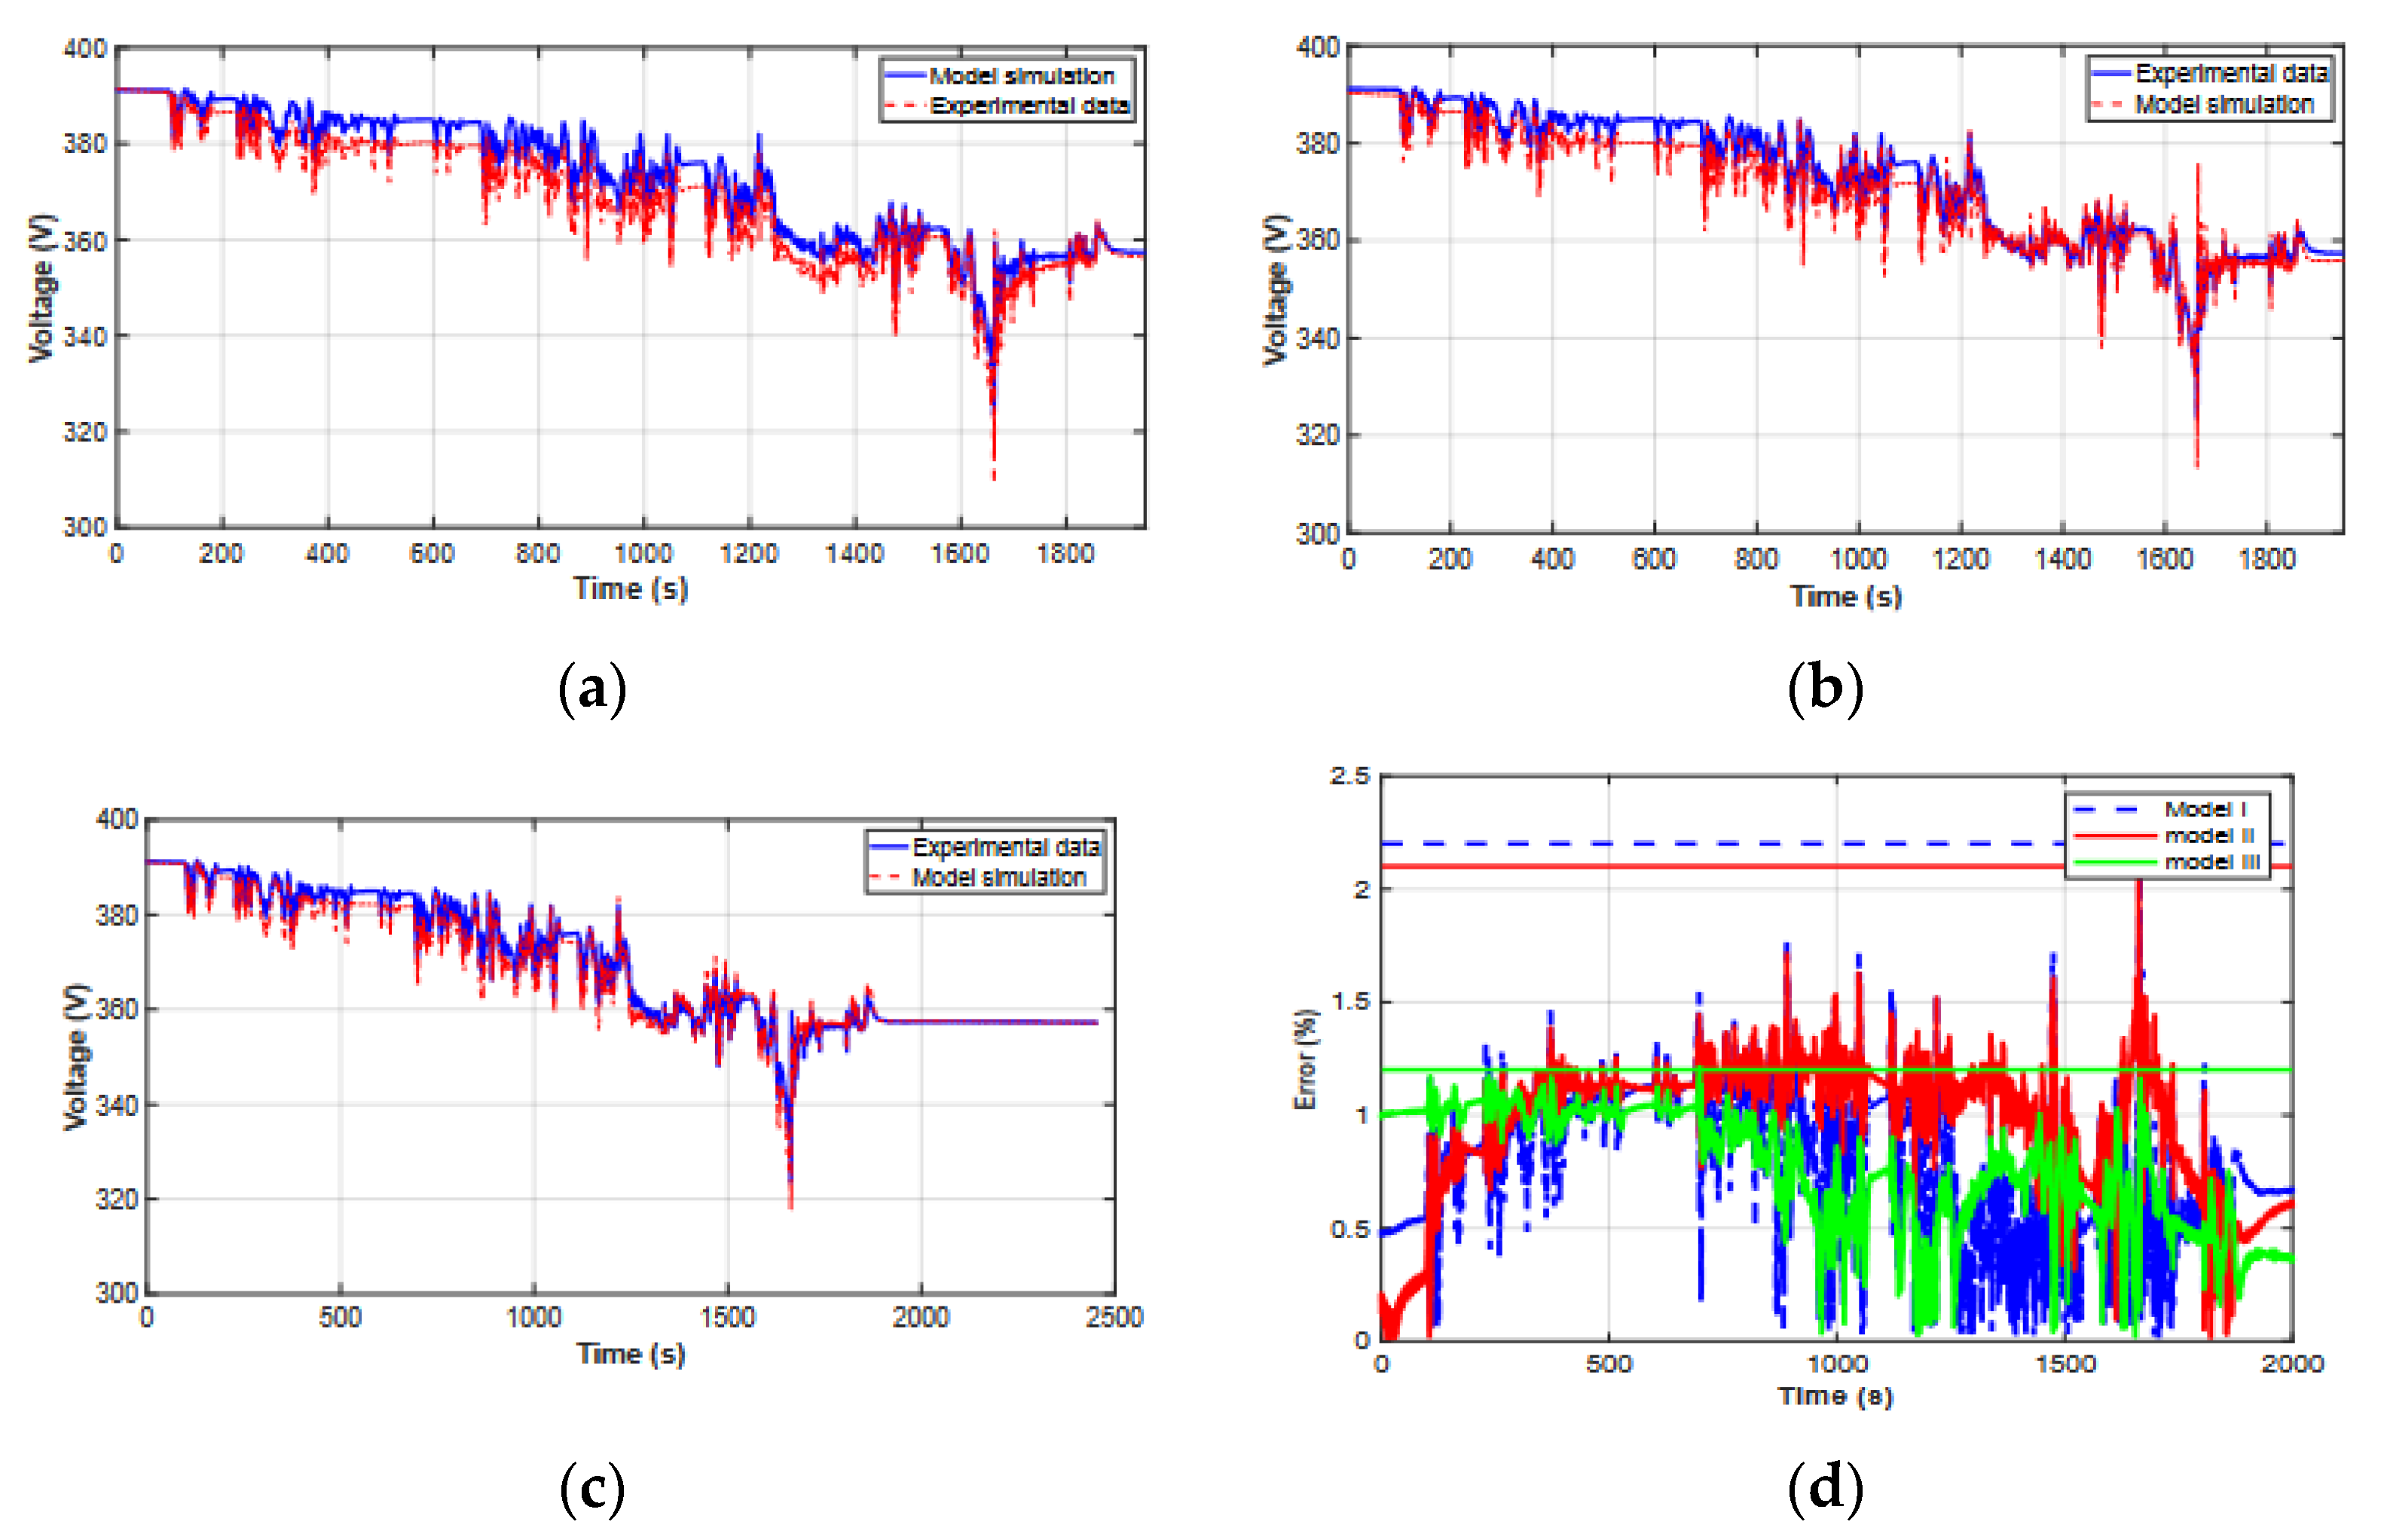
Figure 12.
Model validation using WLTC data. Comparison of simulated battery behavior with experimental data over the WLTC using the parameter identification set obtained from the NEDC: (a) experimental and simulated voltage during WLTC validation, Model I; (b) experimental and simulated voltage during WLTC validation, Model II; (c) experimental and simulated voltage during WLTC validation, Model III; (d) Experimental and simulated voltage during WLTC validation, Model IV.
Table 5.
(A) Error comparison—NEDC driving cycle. (B) Error comparison—WLTC driving cycle.
5.1. Effect of the DP Model
We can observe in Figure 11d and Figure 12d that there are many peaks in the model error curve, for example, up to 2.16% for Model I on the NEDC cycle at around 2300 s. In the NEDC data, this occurred primarily towards the end of each cycle repetition during the high-power regenerative braking phase. As shown in Figure 11d and Table 5, Model II with its second RC pair was able to better represent the slow and fast dynamics, resulting in smaller peak errors, the highest of which was reduced to 1.68%. The average error through-out the NEDC test measured using the RMSE was also improved, decreasing by about 5% from 0.444% to 0.421%. When the WLTC drive cycle was used, the improvement was even more pronounced, with a reduction of about 37% in RMSE from 0.443% to 0.281%. This demonstrates the interest in using the DP model over the Thevenin model when simulating drive cycles.
5.2. Effect of the Proposed UOC Model
From Table 5, it can be seen that the introduction of the K2SOC term resulted in a better ability of the model to reproduce the battery terminal voltage, as the extra term for representing the SOC allowed the equivalent circuit parameters to be more targeted towards reproducing dynamic behavior. This results in lower peak errors, which were decreased from Model II to Model III in the NEDC drive cycle from 1.68% to 1.28% (24% reduction) and in the WLTC drive cycle from 2.1% to 1.2% (43% reduction), with the RMSE also decreasing in the NEDC drive cycle from 0.424% to 0.421% (reduction of ~1%) and in the WLTC drive cycle from 0.281% to 0.141% (reduction of 50%).
The reduction in both the peak and RMSE errors demonstrates the improvement in accuracy resulting from using the DP approach in conjunction with the modified equation for the battery terminal voltage.
5.3. Model Robustness
There are two aspects of model robustness that are important. The first is the accuracy of the model. In this work, we compared not only the RMS error between the simulated and empirical datasets but also the worst-case instantaneous errors, to ensure that the steady state and transient behavior were both accurate. The second important aspect is whether a characterized model based on one drive cycle will apply to other drive cycles. In order to demonstrate the efficacy of the model in this work, it was characterized using NEDC data and also tested using WLTC drive cycle data without recharacterization.
The robustness of the proposed models was evaluated using the WLTC driving cycle data shown in Figure 10 by comparing the results with experimental battery voltage data from the chassis dynamometer testing, keeping the same model parameters obtained from the parameter identification based on the NEDC dataset. The results from this evaluation are shown in Figure 12 and Table 5.
Interestingly, comparing the models on this new dataset seemed to amplify the differences between the models; we can clearly observe each successive improvement in model accuracy in Figure 12a–c. Similarly, from Table 5, we note that the proposed SOC–OCV relation results in a more than four-fold reduction in peak error (between Model II and Model III) and two-fold reduction in RMSE.
The proposed model and drive cycle-based characterization approach showed im- proved robustness, with a reduction in RMS error of more than 68% compared to the Thevenin–Nernst model in the WLTC drive cycle. The proposed model was also able to better represent the dynamic performance, reducing peak error in terminal voltage estimation from 2.16% using the Thevenin–Nernst model to 1.28% in the NEDC drive cycle, and perhaps more importantly reducing the peak voltage error of 2.2% to 1.2% during the WLTC drive cycle, using the parameters optimized using the NEDC data. These results indicate that the approach of characterization using drive cycle data offers a robust and accurate model that can be used for a wide range of drive cycle scenarios without the need for the further recharacterization of the model, or for the need to undertake detailed individual (and time-consuming) cell-based characterization to achieve an efficient and accurate prediction of the overall electric vehicle battery performance.
6. Discussion
Since the approach used in this paper was based only on drive cycle data, the model captured the dynamics which are normally those of most interest at the powertrain system level. Therefore, as the battery characterization process does not use synthetic test profiles, such as high-power pulse characterization (HPPC), there may be inaccuracies in the high frequency range or the long relaxation dynamics [33].
The model parameters are defined as scalars and are not functions of any other effects, such as temperature, SOC or current, which is often the case. This is a simplification that is likely to incur some error; however, it is necessary given the limitations of the information available from the vehicle interface during a drive cycle test (for example, dynamic temperature information is generally of low granularity and precision).
The experiments used to fit the parameters of the model were carried out at an ambient temperature of 23 °C. If the final system is designed to work in other conditions, the model can be used but may incur higher error since the influence of temperature is neglected in the analysis. The internal resistance of the battery (R0) normally increases when the temperature decreases because high temperature favors the electrochemical reactions and ion mobility. Therefore, the model may not be as accurate in predicting the performance of the battery at non-ambient temperatures, unless it has these temperature-dependent parameters characterized across these temperature ranges using a similar approach to that outlined in this work.
7. Conclusions
The performance of three equivalent circuit models were evaluated, including a Thevenin–Nernst model, a DP-Nernst model and a DP model incorporating a novel SOC–OCV relation, which uses fewer terms than the combined SOC-OCV model. Param eter identification was used to find the model parameters directly from drive cycle (NEDC) data, and the robustness of the models was validated using a different driving cycle (WLTC).
The experimental and simulation results indicated that the additional RC circuit used by the DP model to simulate the electrochemical characteristics and polarization effects resulted in an improved dynamic performance and provided a more accurate terminal voltage estimation, reducing the peak terminal voltage error from 2.16% to 1.68% for NEDC data and from 2.2% to 2.1% for WLTC data, justifying the increased model complexity. The introduction of the novel SOC–OCV relation (Model III) further reduced the maximum voltage error to 1.28% and 1.2% for the NEDC and WLTC drive cycles, respectively, further improving the RMSE between the simulated and empirical datasets in both cases. Parameter identification for the models was performed using only NEDC drive cycle data, demonstrating the feasibility of deriving or refining accurate models without the need for additional standard synthetic test profiles, such as HPPC (especially if this is not possible or realistic, for example, if access to the internals of the battery pack is impossible). The robustness of the three models was evaluated using a new driving cycle (WLTC), which was not used in the parameter identification. Whilst all three models showed a similar average RMSE for the NEDC cycles, the performance on the WLTC varied greatly. The DP-Nernst model showed a lower RMSE during the WLTC validation test than the Thevenin–Nernst model (0.281% vs. 0.443%), and the proposed SOC–OCV relation further improved this to 0.141%, showing improved robustness to unknown driving cycles.
We conclude that the proposed model shows improved accuracy and robustness compared to the two most commonly used models (Thevenin–Nernst and DP-Nernst), demonstrating that it is a good candidate for the characterization and analysis of electric vehicle batteries and battery management systems using drive cycle data.
Author Contributions
Data curation, A.L.; Supervision, T.M., P.W., S.D., C.L. and C.V.; Writing—original draft, Y.G. All authors have read and agreed to the published version of the manuscript.
Funding
This research received no external funding.
Conflicts of Interest
The authors declare no conflict of interest.
References
- Ehsani, M.; Gao, Y.; Gay, S.E.; Emadi, A. Modern Electric, Hybrid Electric, and Fuel Cell Vehicles: Fundamentals, Theory, and Design; CRC Press: Boca Raton, FL, USA, 2018. [Google Scholar]
- Watrin, N.; Roche, R.; Ostermann, H.; Blunier, B.; Miraoui, A. Multiphysical lithium-based battery model for use in state-of-charge determination. IEEE Trans. Veh. Technol. 2012, 61, 3420–3429. [Google Scholar] [CrossRef]
- Mesbahi, T. Influence des Stratégies de Gestion d’une Source Hybride de Véhicule Électrique sur Son Dimensionnement et Sa Durée De Vie Par Intégration d’un Modèle Multi-Physique. Ph.D. Thesis, University Centrale Lille, Villeneuve-d’Ascq, France, 2017. [Google Scholar]
- MHannan, A.; Hoque, M.M.; Hussain, A.; Yusof, Y.; Ker, P.J. State-of-the-Art and Energy Management System of Lithium- Ion Batteries in Electric Vehicle Applications Issues and Recommendations. IEEE Access 2018, 6, 19362–19378. [Google Scholar]
- Dubray, A. Adaptation des Lois de gestion D’énergie des Véhicules Hybrides Suivant le Profil de Mission Suivi. Ph.D. Thesis, Institut National Polytechnique de Grenoble—INPG, Grenoble, France, 2002. [Google Scholar]
- Watrin, N.; Bouquain, D.; Blunier, B.; Miraoui, A. Multiphysical lithium-based battery pack modeling for simulation purposes. In Proceedings of the 2011 IEEE Vehicle Power and Propulsion Conference, Chicago, IL, USA, 6–9 September 2011; pp. 1–5. [Google Scholar]
- Nikolian, A.; Firouz, Y.; Gopalakrishnan, R.; Timmermans, J.-M.; Omar, N.; Van den Bossche, P.; Van Mierlo, J. Lithium Ion Batteries—Development of Advanced Electrical Equivalent Circuit Models for Nickel Manganese Cobalt Lithium-Ion. Energies 2016, 9, 360. [Google Scholar] [CrossRef]
- Smekens, J.; Omar, N.; Hubin, A.; van Mierlo, J.; van den Bossche, P. Optimization of Li-ion batteries through modelling techniques. World Electr. Veh. J. 2015, 7, 52–58. [Google Scholar] [CrossRef] [Green Version]
- Tatsumi, K. Aspects of Technology Developments of Lithium and Lithium-ion Batteries for Vehicle Applications in National R&D Projects of Japan. J. Asian Electr. Veh. 2010, 8, 1415–1418. [Google Scholar]
- Yasser, G.; Theophile, P.; Tedjani, M.; Sylvain, D. Modeling, Identification and Simulation of Hybrid Battery/Supercapacitor Storage System Used in Vehicular Applications. In Proceedings of the 2019 6th International Conference on Electric Vehicular Technology (ICEVT), Bali, Indonesia, 18–21 November 2019; pp. 156–162. [Google Scholar]
- Raszmann, E.; Baker, K.; Shi, Y.; Christensen, D. Modeling stationary lithium-ion batteries for optimization and predictive control. In Proceedings of the 2017 IEEE Power and Energy Conference at Illinois (PECI), Champaign, IL, USA, 23–24 February 2017. [Google Scholar]
- Raël, S.; Urbain, M.; Renaudineau, H. A mathematical lithium-ion battery model implemented in an electrical engineering simulation software. In Proceedings of the 2014 IEEE 23rd International Symposium on Industrial Electronics (ISIE), Istanbul, Turkey, 1–4 June 2014; Volume 6, pp. 1760–1765. [Google Scholar]
- Bester, J.E.; el Hajjaji, A.; Mabwe, A.M. Modelling of Lithium-ion battery and SOC estimation using simple and extended discrete Kalman Filters for Aircraft energy management. In Proceedings of the IECON 2015—41st Annual Conference of the IEEE Industrial Electronics Society, Yokohama, Japan, 9–12 November 2015; pp. 2433–2438. [Google Scholar]
- He, H.; Xiong, R.; Fan, J. Evaluation of lithium-ion battery equivalent circuit models for state of charge estimation by an experimental approach. Energies 2011, 4, 582–598. [Google Scholar] [CrossRef]
- Xiong, R.; He, H.; Guo, H.; Ding, Y. Modeling for lithium-ion battery used in electric vehicles. Procedia Eng. 2011, 15, 2869–2874. [Google Scholar] [CrossRef] [Green Version]
- Meng, J.; Luo, G.; Ricco, M.; Swierczynski, M.; Stroe, D.I.; Teodorescu, R. Overview of Lithium-Ion battery modeling methods for state-of-charge estimation in electrical vehicles. Appl. Sci. 2018, 8, 659. [Google Scholar] [CrossRef] [Green Version]
- Zheng, M.; Qi, B.; Du, X. Dynamic model for characteristics of Li-ion battery on electric vehicle. In Proceedings of the 2009 4th IEEE Conference on Industrial Electronics and Applications, Xi’an, China, 25–27 May 2009; pp. 2867–2871. [Google Scholar]
- Rahimi-Eichi, H.; Baronti, F.; Chow, M.Y. Online adaptive parameter identification and state-of-charge coestimation for lithium-polymer battery cells. IEEE Trans. Ind. Electron. 2014, 61, 2053–2061. [Google Scholar] [CrossRef]
- Shaheen, A.M.; Hamida, M.A.; El-Sehiemy, R.A.; Elattar, E.E. Optimal parameter identification of linear and non-linear models for li-ion battery cells. Energy Rep. 2021, 7, 7170–7185. [Google Scholar] [CrossRef]
- Dai, H.; Xu, T.; Zhu, L.; Wei, X.; Sun, Z. Adaptive model parameter identification for large capacity li-ion batteries on separated time scales. Appl. Energy 2016, 184, 119–131. [Google Scholar] [CrossRef]
- Wang, C.; Xu, M.; Zhang, Q.; Feng, J.; Jiang, R.; Wei, Y.; Liu, Y. Parameters identification of thevenin model for lithium-ion batteries using self-adaptive particle swarm optmization differential evolution algorithm to estimate state of charge. J. Energy Storage 2021, 44, 103244. [Google Scholar] [CrossRef]
- He, H.; Xiong, R.; Guo, H.; Li, S. Comparison study on the battery models used for the energy management of batteries in electric vehicles. Energy Convers. Manag. 2012, 64, 113–121. [Google Scholar] [CrossRef]
- Wu, B.; Chen, B. Study the performance of battery models for hybrid electric vehicles. In Proceedings of the 2014 IEEE/ASME 10th International Conference on Mechatronic and Embedded Systems and Applications (MESA), Senigallia, Italy, 10–12 September 2014. [Google Scholar]
- Wieczorek, M.; Lewandowski, M. A mathematical representation of an energy management strategy for hybrid energy storage system in electric vehicle and real time optimization using a genetic algorithm. Appl. Energy 2017, 192, 222–233. [Google Scholar] [CrossRef]
- Mesbahi, T.; Khenfri, F.; Rizoug, N.; Chaaban, K.; Bartholomeüs, P.; le Moigne, P. Dynamical modeling of Li-ion batteries for electric vehicle applications based on hybrid Particle Swarm-Nelder-Mead (PSO-NM) optimization algorithm. Electr. Power Syst. Res. 2016, 131, 195–204. [Google Scholar] [CrossRef]
- Lewis, A.; Chappell, E.; Akehurst, S. Real-world to Lab–Robust measurement requirements for future vehicle powertrains. In Proceedings of the 13th International AVL Symposium on Propulsion Diagnostics, Baden-Baden, Germany, 26–27 June 2018. [Google Scholar]
- Emission Test Cycles Data: Worldwide Harmonized Light Vehicles Test Cycle (WLTC) and New European Driving Cycle (NEDC). Available online: https://dieselnet.com/standards/cycles/ (accessed on 13 August 2021).
- Jackey, R. Battery Model Parameter Estimation Using a Layered Technique. SAE Tech. Pap. 2013, 2, 1–14. [Google Scholar]
- Vichard, L.; Morando, S.; Ravey, A.; Harel, F.; Venet, P.; Pelissier, S.; Hissel, D. Battery Modeling using Real Driving Cycle and Big-Bang Big-Crunch algorithm. In Proceedings of the 2018 IEEE Transportation Electrification Conference and Expo (ITEC), Long Beach, CA, USA, 13–15 June 2018; pp. 309–314. [Google Scholar]
- Huria, T.; Ceraolo, M.; Gazzarri, J.; Jackey, R. High fidelity electrical model with thermal dependence for characterization and simulation of high power lithium battery cells. In Proceedings of the 2012 IEEE International Electric Vehicle Conference, Greenville, SC, USA, 4–8 March 2012. [Google Scholar]
- Mesbahi, T.; Rizoug, N.; Bartholomëus, P.; Sadoun, R.; Khenfri, F.; le Moigne, P. Dynamic model of li-ion batteries incorpo- rating electrothermal and ageing aspects for electric vehicle applications. IEEE Trans. Ind. Electron. 2018, 65, 1298–1305. [Google Scholar] [CrossRef]
- Nabab, M. Particle Swarm Optimization: Algorithm and its Codes in MATLAB. ResearchGate 2016, 8, 8–12. [Google Scholar]
- Pattipati, B.; Balasingam, B.; Avvari, G.V.; Pattipati, K.R.; Bar-Shalom, Y. Open circuit voltage characterization of lithium-ion batteries. J. Power Sources 2014, 269, 317–333. [Google Scholar] [CrossRef]


Publisher’s Note: MDPI stays neutral with regard to jurisdictional claims in published maps and institutional affiliations. |
© 2022 by the authors. Licensee MDPI, Basel, Switzerland. This article is an open access article distributed under the terms and conditions of the Creative Commons Attribution (CC BY) license (https://creativecommons.org/licenses/by/4.0/).