Article

Quantitative Evaluation of CO2 Storage Potential in the Offshore Atlantic Lower Cretaceous Strata, Southeastern United States

1
Boone Pickens School of Geology, Oklahoma State University, Stillwater, OK 74075, USA
2
Marine Geology Department, Marine Science Centre, University of Basrah, Basrah 61004, Iraq
*
Author to whom correspondence should be addressed.
Energies 2022, 15(13), 4890; https://doi.org/10.3390/en15134890
Submission received: 2 June 2022 / Revised: 20 June 2022 / Accepted: 30 June 2022 / Published: 4 July 2022
(This article belongs to the Special Issue Carbon Dioxide Capture, Utilization and Storage (CCUS))

Abstract

:
The geological storage of CO2 in the Earth’s subsurface has the potential to significantly offset greenhouse gas emissions for safe, economical, and acceptable public use. Due to legal advantages and vast resource capacity, offshore CO2 storage provides an attractive alternative to onshore options. Although offshore Lower Cretaceous reservoirs have a vast expected storage capacity, there is a limited quantitative assessment of the offshore storage resource in the southeastern United States. This work is part of the Southeast Offshore Storage Resource Assessment (SOSRA) project, which presents a high-quality potential geological repository for CO2 in the Mid- and South Atlantic Planning Areas. This is the first comprehensive investigation and quantitative assessment of CO2 storage potential for the Lower Cretaceous section of the outer continental shelf that includes the Southeast Georgia Embayment and most of the Blake Plateau. An interpretation of 200,000 km of legacy industrial 2D seismic reflection profiles and geophysical well logs (i.e., TRANSCO 1005-1-1, COST GE-1, and EXXON 564-1) were utilized to create structure and thickness maps for the potential reservoirs and seals. We identified and assessed three target reservoirs isolated by seals based on their effective porosity values. The CO2 storage capacity of these reservoirs was theoretically calculated using the DOE-NETL equation for saline formations. The prospective storage resources are estimated between 450 and 4700 Mt of CO2, with an offshore geological efficiency factor of dolomite between 2% and 3.6% at the formation scale.

1. Introduction

Offshore geologic storage of carbon dioxide (CO2) as a form of carbon capture and storage (CCS) technology has recently attracted considerable scientific attention. CCS technology is a potentially vital tool to reduce the levels of CO2 emissions in the atmosphere and to prevent the most dangerous consequences of climate change [1,2,3,4,5,6,7,8]. The term offshore CO2 storage refers to the injection of CO2 into the geological strata beneath the seabed for safe and permanent storage [9,10,11,12]. Due to legal considerations and the vast resource storage capacity, offshore storage offers an attractive alternative to the onshore options. After many failed attempts, the Sleipner project in the North Sea was an early successful opportunity for commercial deployment of CO2 storage. Although offshore Lower Cretaceous reservoirs have an extensive expected storage capacity, there has been no comprehensive assessment of the offshore storage resource estimate in the southeastern United States. An analysis of a 25,900 km2 area of offshore Alabama and the western Florida Panhandle suggested that approximately 170 Gt of CO2 could be stored in Miocene sandstone, whereas at least 30 Gt could be stored in the deeper Cretaceous formations [13]. Around 32 Gt of CO2 could be stored within 190,000 km2 of the Upper Cretaceous strata in the offshore southeastern United States [14]. A study offshore of the northeastern United States has recently concluded that the Cretaceous and Jurassic sandstone is able to store approximately 37–403 Mt of CO2, with geological storage efficiency of 1–13% [15]. Realizing that the US Environmental Protection Agency estimates that about 40% of anthropogenic CO2 emissions in the US are produced in the southeast, the lack of an offshore CO2 assessment constitutes a significant gap in understanding of this prospective regional storage resource [16,17,18,19].
The research area is located offshore of the southeastern United States, covering the southern part of the Mid-Atlantic Planning Area (including the Carolina Trough) and the South Atlantic Planning Area (including the Southeast Georgia Embayment and Blake Plateau), as defined by the Bureau of Ocean Energy Management (BOEM) (Figure 1). Within the Mid-Atlantic Planning Area and South Atlantic Planning Area, there is a thick sequence of post-rift stratigraphy, which is considered to be a semi-closed saline aquifer, with sediments ranging in age from Jurassic to Pleistocene [20,21]. In these areas, the significant sedimentary deposits from north to south include the Carolina Trough, the Southeast Georgia Embayment, and the Blake Plateau Basin, with a range in sediment column thicknesses from 3048 to 7010 m [22,23,24,25]. A regional unconformity under the post-rift sediments known as the post-rift unconformity (PRU) cuts the entire region after rifting between Africa and North America ceases. This unconformity marks the transition to a widespread sediment deposition zone during the drifting stage.
This research evaluates the potential offshore CO2 storage capacity within the Lower Cretaceous strata in the Mid- and South Atlantic Planning areas.

2. Geological Framework

The evolution of the Atlantic continental margin, including the study area, is broadly characterized by the terminal collision of the Laurentian and Gondwanan continents in the Late Paleozoic Era, followed by continental rifting beginning in the Early Triassic [9,20,23,25,26]. Mesozoic rifting involved local tectonic subsidence in early restricted extensional basins, followed by regional thermal subsidence along the eastern North American margin [21,24,26,27,28]. Stratigraphic sequences on this passive margin show extensive lateral continuity and relatively minor structural disturbance [25,26,27]. There is a thick sequence of post-rift stratigraphy ranging from Jurassic- to Pleistocene-aged sediments in the Mid-Atlantic and South Atlantic Planning Areas. The significant depositional centers in these areas from north to south include the Baltimore Canyon Trough, the Carolina Trough, the Southeast Georgia Embayment, and the Blake Plateau Basin. The oldest post-rift sediments are of Jurassic age, and are the product of rapid clastic sedimentation from erosion, followed by a period of evaporate deposition and then initiation of broad, shallow-water, carbonate deposition with some terrigenous intrusions [28,29]. The Jurassic section thickens seaward, and estimates from geophysical and stratigraphic studies suggest thicknesses of at least 7–8 km in the basins [20,21]. Typically, the Cretaceous section is characterized by more clastic sedimentation in the north and more carbonate deposition in the south, forming an extensive carbonate platform over the Blake Plateau and offshore Florida. From the Late Cretaceous to the Cenozoic, strong paleocurrents controlled the deposition of the clastic offshore sediments. The Late Cretaceous in the Blake Plateau exhibited a distinct facies change to the neighboring offshore Florida and Bahamas carbonate platforms [23,24,25]. The Suwannee Strait eventually evolved into the current Gulf Stream, providing strong erosive power that eroded most of the Paleogene sediments on the Blake Plateau and prevented deposition off the Florida–Hatteras slope, where it continues to the north along the shelf edge [25,28].

3. Materials and Methods

This study involves the integration of geological and geophysical data, combining regional 2D seismic reflection surveys, published sidewall core analyses, and well logs from commercial exploration wells. Seismic reflection data provide fundamental structural control over the subsurface geology, confirmed by accessible exploration wells. A total of 36 separate 2D seismic surveys was integrated and analyzed (Figure 1B), and a seismic mistie analysis was conducted to merge the individual surveys for this study. The well logs were then calibrated with the seismic reflection profiles. The seismic surveys were interpreted regionally for key stratigraphic horizons, and then porosities and permeabilities were derived from the log data and core reports. Subsequently, the porosity and permeability estimates were compared between the published sidewall core data and the derived values.

3.1. Well Sections

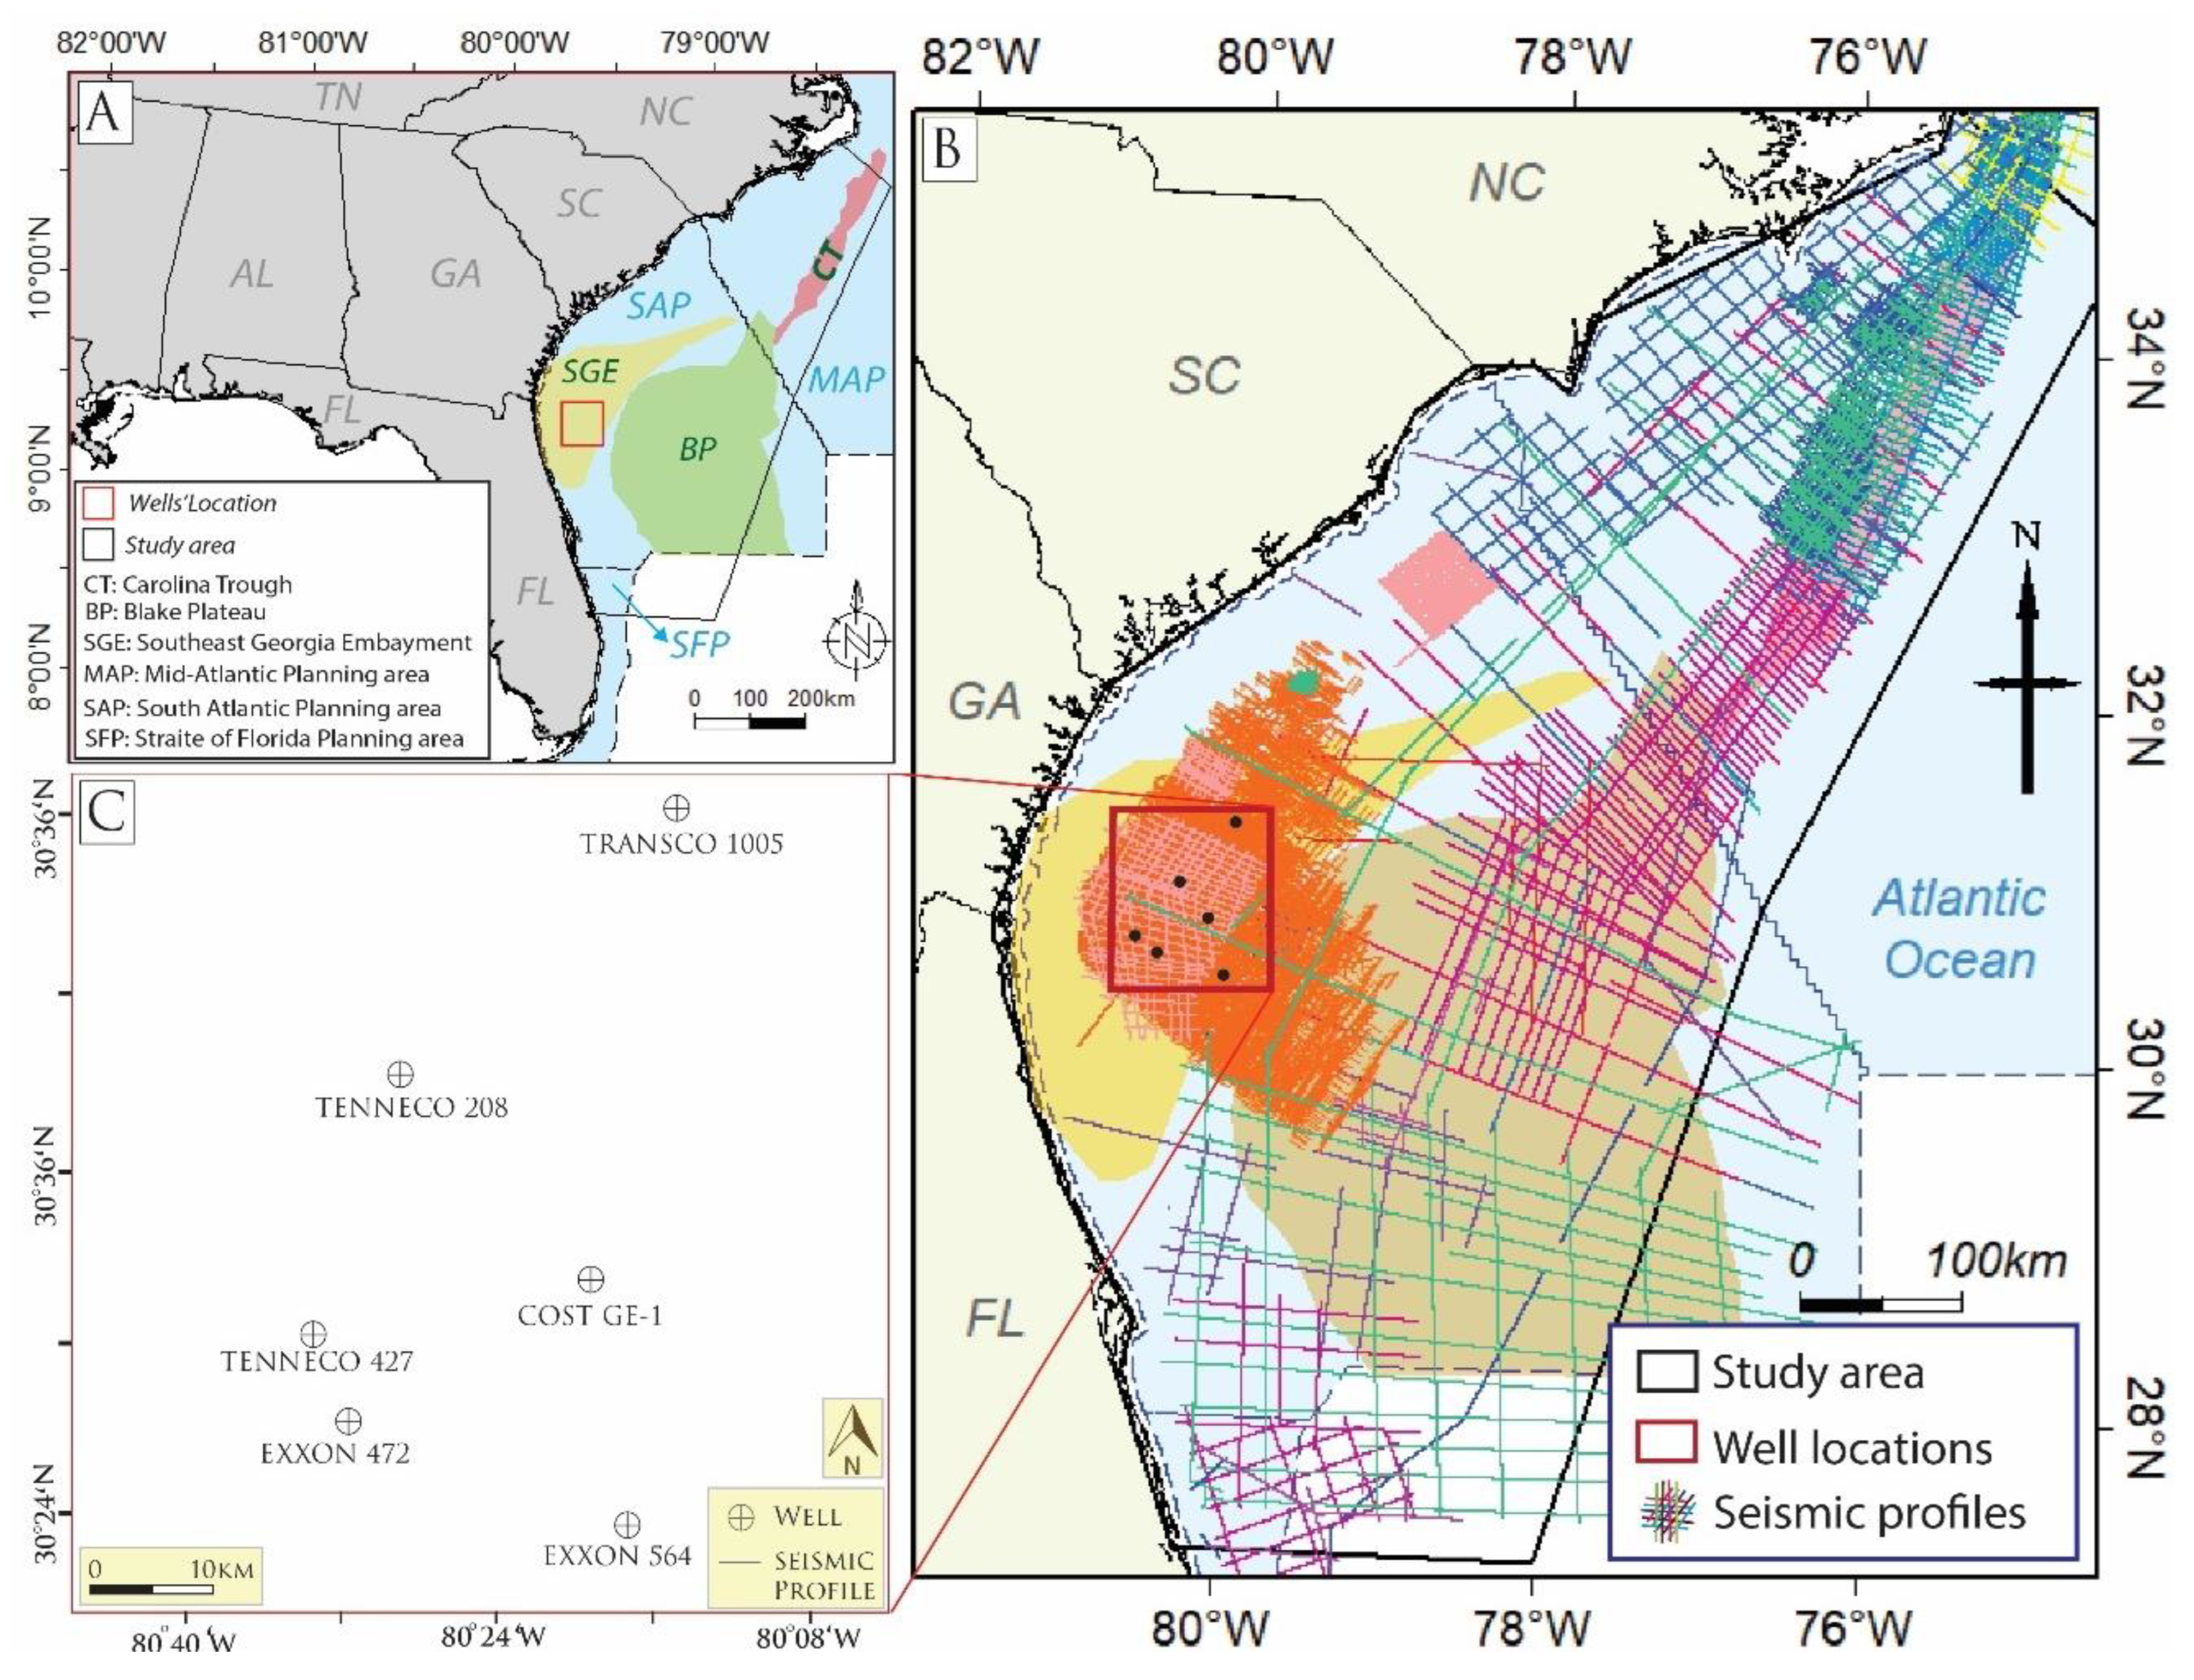
Seven commercial exploratory offshore wells (GETTY 913, TRANSCO 1005-1-1, TENNECO 208, COST GE-1, TENNECO 427, EXXON 472, and EXXON 564-1) (Figure 1C) were drilled in the Southeast Georgia Embayment from 1979 to 1980. These wells were stratigraphically correlated by Poppe et al. [25], and have also been seismic-stratigraphically interpreted and correlated with similar Mesozoic sedimentary sequences [30]. TRANSCO 1005-1, COST GE-1, and EXXON 564-1—the deepest three wells in the Southeast Georgia Embayment—were used in the present study. TRANSCO 1005-1 and COST GE-1 are the only two wells that penetrate the pre-rift sedimentary sequences from the Paleozoic Era. The EXXON 564-1 well penetrates only the post-rift sedimentary sequence from the Mesozoic Era.
The TRANSCO 1005-1-1 well encounters the pre-rift unconformity at a depth of ~2743 m, and bottoms in Paleozoic sedimentary rocks at a total depth (TD) of 3546 m [25]. The Paleozoic section in the TRANSCO 1005-1 well is a weakly metamorphosed shale and sandstone with meta-igneous intrusions (Figure 2). The log suite for this well includes mud logs, electric logs, drill cuttings, and biostratigraphic data. The Paleozoic rocks in the TRANSCO 1005-1 well have been correlated with Devonian strata in the COST GE-1 well [25].
The COST GE-1 well penetrates the pre-rift unconformity at 3200 m, drilling approximately 686 m of the Paleozoic sedimentary sequences and reaching 4040 m [9]. The COST GE-1 well showed a thick sequence from Paleozoic to Cenozoic (Figure 2). The Paleozoic section generally consists of non-fossiliferous quartzite, shale, and salt, underlain by metamorphic and meta-volcanic rocks [9].
Scholle [9] provided an analysis of the COST GE-1 well data, and described the stratigraphic units, porosity, and permeability measurements by both a conventional core and a sidewall core with respect to depth. The thickness of fossiliferous chalky limestone below the drill platform reaches 1006 m, corresponding to strata of Tertiary age. The Upper Cretaceous section is marked at a depth ranging from 1006 m to 1798 m, and is composed of calcareous shale, dolomite, and limestone. The section from 1798 to 2195 m is the Lower Cretaceous. Rocks encountered below 3353 m depth consist of highly indurated to weakly metamorphosed Paleozoic strata [9].
The EXXON 564-1 well encounters the pre-rift unconformity at a depth of 3737 m [30]. The last 183 m, under the post-rift unconformity in the EXXON 564-1 well, is a weakly metamorphosed shale and sandstone with meta-igneous intrusion of Triassic rocks. The EXXON 564-1 well has been correlated with the Devonian rocks in the COST GE-1 well (Figure 2).

3.2. Seismic Interpretation

The primary dataset consists of legacy 2D seismic reflection profiles offshore of the southeastern United States in the Atlantic Ocean. The dataset has been released by the Bureau of Ocean and Energy Management (Figure 1B). We interpreted and correlated a continuous surface stratigraphy of the storage elements (sinks and reservoir seals) along 200,000 km of the seismic profiles, covering approximately 200,000 km2. Seismic interpretation started with picking high-frequency stratigraphy sequences targeted at creating three-dimensional maps of the reservoirs and seals. The TRANSCO 1005-1 well, COST GE-1 well, and EXXON 564-1 well were tied with the seismic profiles (Figure 3). The Schlumberger Petrel software can generate advanced velocity models using check-shot data. The velocity model uses input parameters such as tops and surfaces and the time–depth link [32]. The velocity model is created based on the time–depth relationship from the well data. The time–depth conversion uses linear velocity related to the depth functions (V = V0 + K × Z) and (V = V0 + K × (Z − Z0)) for evaluating a velocity model [33]. Both K and the linear velocity slope indicate that the velocity increases with depth and reflects layer compaction. The compaction factor K is estimated with the fewest mistakes feasible and used to generate a V0 surface; any modifications incorporated into the velocity model are reflected on the V0 surface. The check-shot data of the three wells (COST GE-1, Exxon 564-1, and Transco 1005-1) were used to identify the depth of the upper and bottom surfaces of the Lower Cretaceous section.

3.3. Calculation of CO2 Storage Capacity

We developed an estimate of the regional CO2 storage capacity offshore of the Lower Cretaceous section in the Mid–South Atlantic Ocean using the US Department of Energy (DOE) National Energy Technology Laboratory (NETL) method [16,34,35].
The US-DOE approach estimates CO2 storage volume based on geological parameters such as formation area, thickness, and porosity [16,17,36]. Some articles such as the work of Teletzke et al. [37] criticize the DOE method or the Goodman method. However, the DOE method is the most comprehensive and well-documented storage method available at this time. The DOE method estimates carbon storage resources at the prospective scale in subsurface saline formations. This information plays an important role in establishing the scale of carbon capture and storage activities for governmental policy and commercial project decision making. When calculating the storage efficiency terms, the DOE method accounts for several parameters, as presented in Gorecki et al. [35]: reservoir width, reservoir length, thickness, domain discretization, rock properties, porosity, permeability (lateral), permeability anisotropy, relative permeability, capillary pressure, reservoir properties, initial pressure, pressure gradient, initial temperature, temperature gradient, brine concentration, pore compressibility, operation properties, injection rate, injection period, and perforation. Goodman et al. [16] used the static volumetric methodology and the CO2 storage prospective resource estimation Excel analysis (CO2-SCREEN) tool developed by the US Department of Energy National Energy Technology Laboratory (DOE-NETL) (Equation (1)). Equation (1) is mathematically expressed as follows:
𝐺CO2 = A × ℎ𝑔 × φ × ρ × E
where 𝐺CO2 is the total mass of CO2 in gigatons (Gt), A is the target area (in square meters), ℎ𝑔 is the gross strata thickness (in meters), φ is the effective porosity, ρ is the CO2 density in kilograms per cubic meter (kg/m3), and 𝜌CO2 is the average CO2 density evaluated at pressure and temperature, representing storage conditions anticipated for a specific deep saline aquifer. Ennis-King and Paterson [38] pointed out that the CO2 density rises with a decrease in volume in the reservoir at depths ranging from 600 to 1000 m, depending on the specific geothermal conditions and pressure. Due to heat transfer, the average temperature in several geological formations increases by approximately 25–30.8 °C/km below the sea bed [39]. However, geothermal gradients vary significantly between local and global basins [40]. Nevertheless, the subsurface units suitable for geological carbon sequestration are 800 m or deeper below the seafloor, and seem to have higher pressure and temperature at depths greater than the CO2 critical point [12]. The critical point indicates that CO2 is injected at supercritical temperatures and pressures. CO2 and certain other supercritical gases possess gas viscosity, which reduces resistance to flow compared to liquid and semi-liquid density, significantly reducing the volume required to store a given mass of fluid. Carbon dioxide behaves as a supercritical fluid at temperatures and pressures above the critical points of 30.85 °C and 7.38 MPa, respectively [39]. The 800 m depth requirement is a reasonable guess that varies based on the geothermal gradient and formation pressure at a given location [41]. The pressure in the pore spaces of sedimentary rocks is identical to hydrostatic pressure. This pressure is generated by a water column at a corresponding elevation to the depth of the pore space, since the pore space is frequently filled with water and, although in a convoluted manner, is connected to the ground surface. When the pore space is not connected with the surface at equilibrium, the hydrostatic pressure can be exceeded, and overpressure occurs [38].
Scholle [9] pointed out that pressure and temperature data for the COST GE-1 well were identified based on three temperature logs. The Lower Cretaceous temperature was estimated as 72.3 °C at the top and 81.4 °C at the bottom, with a geothermal gradient of 16 °C/km, based on a geothermal gradient that was only available at the COST GE-1 well. The parameters (A, ℎ, and φ) are the yield of the total pore volume of the studied section. The 𝜌 parameter is the volume conversion to the mass of CO2, and the efficiency factor (E) reduces the total CO2 mass for storage to an accurate, realistic value [41,42]. The CO2 storage efficiency factor is the portion of rock suitable for CO2 storage, and is defined as the fraction of pore space where injected CO2 can permanently displace formation fluids [43]. Table 1 shows efficiency factors for different lithologies and estimated with different methods, including numerical and Monte Carlo simulations [11,16,35,44]. According to the US DOE approach, storage efficiency is a function of aquifer characteristics such as area, thickness, and porosity—the product of which represents the aquifer pore volume—as well as displacement efficiency components such as areal, vertical, and microscopic components, and is expressed as the product of these individual efficiencies [16,35,45].
Goodman et al. [16] used Monte Carlo sampling to calculate local- and regional-scale storage efficiency values based on statistical properties (i.e., mean values, standard deviation, ranges, and distributions) that describe geological and displacement parameters for three lithologies: clastics, dolomite, and limestone. They obtained slightly lower values for storage efficiency (E) than Gorecki et al. [35]. Efficiency in saline formations can be calculated using Equation (2):
E = EAn/At × EHn/Hg × EØe/Øt × EA × Ev × Ed
where EAn/At is the percentage-to-total-area ratio ideal for CO2 storage; EHn/Hg is the fraction-to-gross-thickness ratio that meets the porosity and permeability standards for CO2 storage; EØe/Øt represents the ratio of linked porosity to total porosity; EA is the effective aquifer area; Ev is the volumetric displacement; and Ed is the microscopic displacement. The net-to-total-area ratio EAn/At is the proportion of the aquifer area suitable for CO2 storage, expressed as a net-to-gross-thickness ratio. EHn/Hg is the fraction of the geological formation in the vertical dimension that meets the porosity and permeability requirements for CO2 injection and storage, and EØe/Øt is the effective (interconnected)-porosity-to-total-porosity ratio. The storage efficiency factor reflects the total pore volume filled with CO2. There is no comparison established between the CO2 stored by different processes. For a 15–85% certainty value, Monte Carlo simulations generate an E range between 1 and 4% of the bulk volume of a deep saline aquifer, with an average of 2.4% for 50% confidence. The Monte Carlo simulated by USDOE-NETL [47] that established the proposed range for E varied several calculation factors, i.e., from 0.20 to 0.80 of the saline aquifer appropriate for CO2 storage; 0.25 to 0.75 of the geological unit has the porosity and permeability required for CO2 injection; the interconnected porosity fraction ranges from 0.6 to 0.95; the areal displacement efficiency ranges between 0.5 and 0.8, while the vertical displacement efficiency ranges between 0.6 and 0.9. Due to CO2 buoyancy, CO2 occupies between 0.2 and 0.6 percent of the net aquifer thickness. The effectiveness of pore-scale displacement ranges from 0.5 to 0.8. The maximum and minimum values for each parameter were calculated to reflect varied lithologies and geological depositional systems in North America, with the maximum and minimum values representing reasonably high and low values, respectively.
Several analogies are found in the US DOE method [48]; the effect of total water saturation is included in the efficiency factor E through the pore-scale displacement efficiency. The salty aquifers with TDS more than 10,000 ppm and deeper than 800 m should be considered, as this is the minimum depth required to assure that CO2 is in a dense liquid or supercritical phase confined by aquitards or aquicludes (caprock), which include shale, anhydrite, and evaporite. The considerations of the US DOE method introduce storage efficiency coefficient calculations through Monte Carlo simulations of CO2 storage within deep saline aquifers in North America. The US DOE obtained a range of values for these storage efficiency coefficients for the 0.15 and 0.85 confidence intervals, ranging between 0.1 and 0.4 for deep saline aquifers. Based on the IPCC [1] report, the US DOE screening requirements were assumed, and these coefficients have a value of unity in local-scale assessments or, more broadly, when the effective aquifer area, thickness, and porosity are known. In this study, we used the value of the efficiency factor suggested by the US DOE [35] (Table 1).
Goodman et al. [16] demonstrated that geological uncertainty has a greater impact on storage estimation than the approach used. Thus, it is critical to determine the geological estimates and ranges of storage efficiency factors for certain geological parameters to improve or refine storage estimates. In addition, due to the legacy of seismic data and the relatively limited well data available over the 200,000 km2 study area, uncertainty associated with the subsurface data gap must be assumed in the storage resource assessment. The potential capacity of the several reservoirs of the Lower Cretaceous section was calculated using all parameters in Equation (1).

4. Results and Discussions

4.1. Well Data Analysis

The well log interpretation is the most fundamental geophysical approach for geological and geophysical reservoir characterizations. The density log (RHOB) provides lithology interpretation, porosity calculation, and petrophysical properties. The gamma ray (GR) log is used to interpret lithology, porosity, and permeability. The spontaneous potential (SP) log is useful for lithology identification and permeability calculation. Both GR and SP have a similar response to porous layers, and can determine lithology and correlate stratigraphy. Density logs (RHOB) provide a continuous record of the bulk density, determined by the porosity of the formation and the fluid content of the pore spaces. GR and ROHB logs for the TRANSCO 1005-1 well, COST GE-1 well, and EXXON 564-1 well were stratigraphically interpreted and correlated in this study to obtain similar equivalents in the sedimentary sequences (Figure 2). Related to the sidewall core analysis on the COST GE-1 well, the porosity was valued between 0.12 and 0.35, and the permeability was estimated between 9.87 × 10⁻¹⁸ and 5.4 × 10⁻¹³ m2, within the Lower Cretaceous strata [9].
The Lower Cretaceous strata, between depths of 1798 m and 2195 m, have 14 lithological intervals, which are mainly composed of varying proportions of calcite, clay, shale, sandstone, limestone, and dolomite with carbonite materials [9] (Table 2).
For the COST GE-1 well, the net porosity was geophysically derived by the ratio of the density log (RHOB) and the gamma ray log (GR). The values calculated from the log data were then compared with the measured values from the conventional and sidewall cores for the Lower Cretaceous lithological units to identify potential reservoirs and seals (Figure 4). Significant CO2 storage was predicted where high primary and secondary porosity values ranged from 0.20 to 0.33, accounting for the greatest permeability range of 1.97 × 10⁻¹³–5.43 × 10⁻¹³ m2 recorded in the Lower Cretaceous section.

4.2. Geological CO2 Storage

In a practical CO2 storage evaluation, Chadwick et al. [42] concluded that a generic case may be associated with injecting large quantities—reaching 400 Mt—of CO2 into a single anticlinal aquifer structure. The effective size of the reservoir is a critical parameter to determine water displacement, with high pressure leading to increased porosity of 20% or higher, which is a requirement for safe injection into porous strata. While the CO2 injection pressure significantly increases from 5 to 10 MPa in the injection zone, the effective storage capacity in the caprocks increases when the pressure of the injected CO2 exceeds the initial formation pressure [49]. Table 3 demonstrates atypical geological criteria of the static and dynamic storage capacities for the reservoir depth of 1000–2500 m with a thickness of 21–50 m, where the porosity is greater than 0.20 and the permeability is greater than 1.978 × 10⁻¹³ m2. The ideal seal thickness is 100 m with lateral continuity, and non-faulted strata or capillary entry pressure is present.
The Lower Cretaceous section from the COST GE-1 well was described in terms of lithology and rock properties through 14 core samples [9]. Dolomite rocks are the most dominant rocks in this section. The porosity and permeability of the different stratigraphic intervals were the primary basis for identifying the main storage units. The reservoirs and seals were classified and evaluated with the observance of the positive indicators of the CO2 storage criteria described by Chadwick et al. [42] (Figure 5). Three reservoirs separated by three seals were identified within the Lower Cretaceous section. Figure 3 illustrates the 14 intervals that appear most suitable for permanent offshore CO2 storage. Figure 6 reveals structural maps for the top and bottom topographic surfaces and the thickness of the Lower Cretaceous strata. The Lower Cretaceous section ranges in depth between 1798 m and 2539 m, and consists of dolomite interbedded with sandstones and calcareous silty shales. Based on the rock composition and physical rock properties, this section (Table 2) records the lithological description and porosity values with depth for the COST GE-1 well, based on core analyses and geophysical logs. Figure 5 shows the potential CO2 storage reservoirs and seals based on the rock properties compared with the favorable conditions for CO2 storage [42]. Scholle [9] noted impermeable shale with calcareous shale layers interbedded with highly permeable dolomite in the COST GE-1 well. However, a few samples of sandstone were marked between 1768 m and 2530 m, with high primary and secondary porosity and high permeability, suitable as reservoir rock for CO2 storage. This section is dominated by dolomite with porosities that vary widely and unsystematically, with depth from 0.17 to 0.32 and permeability between 2.096 × 10⁻¹³ and 5.43 × 10⁻¹³ m2. The porosity log was derived and calculated from well logs to fill in the gaps between the core intervals (Figure 4).

4.3. CO2 Storage Capacity Calculations

The capacity for CO2 storage potential of the Lower Cretaceous section was calculated based on the rock compositions and petrophysical properties at the COST GE-1 well. Three potential reservoirs were associated with four potential seals characterized and assessed in the Lower Cretaceous section. The three reservoirs are sealed by thick caprocks mainly composed of shale, siltstone, anhydrite, and limestone. These reservoirs are marked as R1, R2, and R3, and their seals are marked as S1, S2, S3, and S4 (Figure 5). According to Scholle [9], the trapping mechanism, characterized as an overlying seal, involves stratigraphic trapping through lateral facies variations. Figure 5 shows that reservoir R1 ranges in depth from 1855 to 1989 m, reservoir R2 ranges in depth from 2119 to 2210 m, and reservoir R3 ranges in depth from 2349 to 2442 m. The three reservoirs are composed as follows: (1) R1 is composed of calcareous shale, anhydrite, and gypsum; (2) R2 is composed of limestone and shale; and (3) R3 is composed of calcareous shale, anhydrite, fossil fragments, and gypsum. The average porosities of the reservoirs (R1, R2, and R3) are 0.23–0.28, 0.28–0.32, and 0.25–0.32, respectively. We used Equation (1), which was developed earlier by Goodman et al. [16], for applying the dolomite efficiency factor (Equation (2)) at the formation scale to give 2.58%, 3.26%, and 5.54% for probabilities of 0.10, 0.50, and 0.90, respectively. This work considers the probabilities for the area (A) parameter with a wide range of thickness values over the area (Table 4) to apply Equation (1). The uncertainty of CO2 density with depth and thickness in the Lower Cretaceous section can be reduced by calculating the density of CO2 based on the depth of each reservoir (Figure 6). For accuracy of CO2 density values, the Lower Cretaceous section is divided into three depth zones: (1) the shallow depth (SLK) is in the 300–1000 m range, (2) the depth of the COST GE-1 well (GLK) is in the 1600–2450 m range, and (3) the deep reservoir (DLK) ranges from 3000 to 3500 m. To identify the temperature of the reservoirs in the three depth zones, we assumed that the geothermal gradient at COST GE-1 well (16 °C) is constant across the study area (Figure 7A; Table 5). Based on the temperature–pressure–density graph [41] (Figure 7B), the density values of supercritical CO2 were estimated based on the depth and temperature considered in the NETL CO2 calculation method [47].
We estimated the potential storage resources of the three reservoirs for local and regional areas. The local area was detected where seismic profiles and well data were densely concentrated in the Southeast Georgia Embayment, which covers approximately 10,000 km2. The regional storage resource covers approximately 200,000 km2, which we detected based on the abundance and density of the data. We considered three probabilities (P10, P50, and P90) for each reservoir to determine the geological storage efficiency factor in both areas. For the integrity and safety of CO2 storage, we interpreted and evaluated impermeable rock units that were denoted as seals. Although the seismic interpretation indicated no significant faults in the Lower Cretaceous section, the uniform lateral stratigraphy was a considerable concern due to the lack of wells in the study area. Table 4 demonstrates the required parameters that were applied in Equation (1) to identify the probabilistic estimate of the efficiency factor from P10 to P90 in Equation (2), as shown in Table 6.
Table 7 shows the results of the quantitative estimates of CO2 storage capacity in the local and regional potential storage resources for the Lower Cretaceous potential reservoirs. The total capacity of the three storage resources with a geological storage efficiency (E) of dolomite between 0.65 and 5.40% ranges between 48.98 and 376.70 Mt of CO2 at P10 to P90 for the local area (Figure 8), and the E ranges between 450.85 and 4705.46 Mt of CO2 for the regional area (Figure 9).
At P50, the average CO2 storage in the Lower Cretaceous section is approximately 1.65 Gt. Reservoir R1 has a maximum storage capacity value of 0.63 Gt of CO2. R2 is greater than 0.42 Gt of CO2, and R3 is greater than 0.59 Gt of CO2 at P50.

5. Summary and Conclusions

This work presents the first comprehensive study to identify and evaluate the CO2 storage potential of the Lower Cretaceous section of the Mid–South Atlantic offshore southeastern United States. Based on the analysis of three wells in the Southeast Georgia Embayment, the CO2 geological storage capacity estimate provides evidence of three significant permeable storage strata that are isolated by impermeable seals in the depth interval of 1767.84–2529.84 m. Based on an analysis of the COST GE-1 well, we identified wide and unsystematic porosity ranges from 0.17 to 0.32, and permeabilities between 2.1 × 10⁻¹³ and 5.43 × 10⁻¹³ m2 (low percentage of sandstone and high percentage of dolomite). These layers are suitable reservoir rocks qualified for permanent CO2 storage.
The US DOE methodology was used for calculating pore volume spaces to estimate the geological CO2 storage potential capacity in megatons (Mt). The CO2 storage potential of the Lower Cretaceous section was calculated based on the rock compositions and petrophysical properties at the COST GE-1 well. Three potential reservoirs were associated with four potential seals that were characterized and assessed. According to Scholle [9], the trapping mechanism indicated by an overlying seal involves stratigraphic variations. The prospective storage resources of the three reservoirs were calculated locally, where seismic profiles and well data were densely concentrated in the Southeast Georgia Embayment (10,000 km2), and regionally, where we suggested a regional storage resource of 200,000 km2. We considered three probability values (P10, P50, and P90) of each reservoir for determining the geological storage efficiency factor in both areas. This study suggests that the CO2 storage capacity ranges approximately from 48.98 to 376.70 Mt locally, and from 450.85 to 4705.46 Mt regionally, in the three Lower Cretaceous reservoirs, with geological storage efficiencies from 0.65% to 5.4%.
The average storage potential is approximately 82 tons of CO2, which could be safely stored per 1 km2 offshore of the Lower Cretaceous section, at a probability of 0.5. The largest CO2 storage capacity value for reservoir R1 was >3.2 tons/km2. The intermediate and lowest values at P50 in reservoirs R3 and R2 were less than or equal to 2.7 tons/km2. Since the reservoir heterogeneity impacts the pressure distribution, and the CO2 plume migration is significantly affected by the permeability, we suggest that reservoir R2 and seals S2 and S3 can provide additional protection for safe injection and storage in case unpredictable leakage occurs due to unexpected natural hazards.
The uncertainty associated with subsurface data gaps was incorporated into the storage resource evaluation due to the legacy of seismic data and the relatively limited well data available over the study area.

Author Contributions

Formal analysis, D.S.A.; Investigation, D.S.A.; Supervision, J.H.K.; Writing—original draft, D.S.A.; Writing—review & editing, J.H.K. and C.K. All authors have read and agreed to the published version of the manuscript.

Funding

This research received no external funding.

Institutional Review Board Statement

This study did not require ethical.

Informed Consent Statement

Not applicable.

Data Availability Statement

https://walrus.wr.usgs.gov/namss/search/ (accessed on 1 June 2022).

Acknowledgments

We thank the Iraqi Ministry of Higher Education and Scientific Research (MOHESR), the Marine Science Center (MSC)–Basrah University, and the Iraqi Cultural office in Washington DC for funding and supporting the first author. This material is based upon work supported by the US Department of Energy National Energy Technology Laboratory, through a Cooperative Agreement DE-FE0026086 with the Southern States Energy Board. Cost sharing and research support were provided by the Project Partners and an Advisory Committee. The SOSRA team also includes the Virginia Polytechnic Institute and State University/Virginia Center for Coal and Energy Research; the Virginia Department of Mines, Minerals, and Energy; the South Carolina Geological Survey; Oklahoma State University; the Geological Survey of Alabama; the State Oil and Gas Board of Alabama; and Advanced Resources International, Inc. In addition, we would like to thank Schlumberger for providing access to Petrel software, and we are grateful to the Schlumberger technical team for their support. We would like to thank the US Department of Energy National Energy Technology Laboratory and Angela Goodman for providing further information about the DOE approach and CO2-SCREEN techniques. We also thank the University of South Carolina and Susannah Boote for assistance in downloading and organizing the database at the University of South Carolina.

Conflicts of Interest

The authors declare no conflict of interest.

References

  1. Metz, B.; Davidson, O.; De Coninck, H.; Loos, M.; Meyer, L. IPCC Special Report on Carbon Dioxide Capture and Storage; Intergovernmental Panel on Climate Change: Geneva, Switzerland, 2005.
  2. Thomas, D.C.; Benson, S.M. Carbon Dioxide Capture for Storage in Deep Geologic Formations-Results from the CO2 Capture Project: Vol 1-Capture and Separation of Carbon Dioxide from Combustion, Vol 2-Geologic Storage of Carbon Dioxide with Monitoring and Verification; Elsevier: Amsterdam, The Netherlands, 2005. [Google Scholar]
  3. Hart, P.E. Namss—A National Archive of Marine Seismic Surveys. In Proceedings of the 2007 GSA Denver Annual Meeting, Denver, CO, USA, 28–31 October 2007. [Google Scholar]
  4. Solomon, S.; Carpenter, M.; Flach, T.A. Intermediate storage of carbon dioxide in geological formations: A technical perspective. Int. J. Greenh. Gas Control. 2008, 2, 502–510. [Google Scholar] [CrossRef]
  5. Hertel, T.W.; Golub, A.A.; Jones, A.D.; O’Hare, M.; Plevin, R.J.; Kammen, D.M. Effects of US maize ethanol on global land use and greenhouse gas emissions: Estimating market-mediated responses. BioScience 2010, 60, 223–231. [Google Scholar] [CrossRef] [Green Version]
  6. Hortle, A.; Michael, K.; Azizi, E. Assessment of CO2 storage capacity and injectivity in saline aquifers–comparison of results from numerical flow simulations, analytical and generic models. Energy Procedia 2014, 63, 3553–3562. [Google Scholar] [CrossRef] [Green Version]
  7. Cumming, L.; Gupta, N.; Miller, K.; Lombardi, C.; Goldberg, D.; ten Brink, U.; Schrag, D.; Andreasen, D.; Carter, K. Mid-Atlantic US Offshore Carbon Storage Resource Assessment. Energy Procedia 2017, 114, 4629–4636. [Google Scholar] [CrossRef]
  8. Okwen, R.; Yang, F.; Frailey, S. Effect of geologic depositional environment on CO2 storage efficiency. Energy Procedia 2014, 63, 5247–5257. [Google Scholar] [CrossRef] [Green Version]
  9. Scholle, P.A. Geological Studies of the COST GE-1 Well, United States South Atlantic outer Continental Shelf Area; USGS: Denver, CO, USA, 1979.
  10. Smyth, R.C.a.H.; Susan, D.; Meckel, T.; Breton, C.; Paine, J.G.; Hill, G.R.; Andrews, J.R.; Lakshminarasimhan, S.; Herzog, H.; Zhang, H.H.; et al. Potential Sinks for Geologic Storage of Carbon Dioxide Generated in the Carolinas. US Bureau of Econ Geol, South Carolina, United States Summary Report 2007. Available online: http://citeseerx.ist.psu.edu/viewdoc/download?doi=10.1.1.470.1152&rep=rep1&type=pdf (accessed on 15 May 2016).
  11. Zhou, Q.; Birkholzer, J.T.; Tsang, C.-F.; Rutqvist, J. A method for quick assessment of CO2 storage capacity in closed and semi-closed saline formations. Int. J. Greenh. Gas Control 2008, 2, 626–639. [Google Scholar] [CrossRef] [Green Version]
  12. Schrag, D.P. Storage of carbon dioxide in offshore sediments. Science 2009, 325, 1658–1659. [Google Scholar] [CrossRef] [Green Version]
  13. Esposito, R.A.; Pashin, J.C.; Hills, D.J.; Walsh, P.M. Geologic assessment and injection design for a pilot CO2-enhanced oil recovery and sequestration demonstration in a heterogeneous oil reservoir: Citronelle Field, Alabama, USA. Environ. Earth Sci. 2010, 60, 431–444. [Google Scholar] [CrossRef]
  14. Almutairi, K.F. Assessment of upper cretaceous strata for Offshore CO2 storage: Southeastern United States. Ph.D. Thesis, University of South Carolina, Columbia, SC, USA, 2018. Available from ProQuest Dissertations and Theses Full Text. Available online: https://scholarcommons.sc.edu/etd/4811 (accessed on 14 January 2019).
  15. Fukai, I.; Keister, L.; Ganesh, P.R.; Cumming, L.; Fortin, W.; Gupta, N. Carbon dioxide storage resource assessment of Cretaceous-and Jurassic-age sandstones in the Atlantic offshore region of the northeastern United States. Environ. Geosci. 2020, 27, 25–47. [Google Scholar] [CrossRef]
  16. Goodman, A.; Hakala, A.; Bromhal, G.; Deel, D.; Rodosta, T.; Frailey, S.; Small, M.; Allen, D.; Romanov, V.; Fazio, J. US DOE methodology for the development of geologic storage potential for carbon dioxide at the national and regional scale. Int. J. Greenh. Gas Control 2011, 5, 952–965. [Google Scholar] [CrossRef]
  17. Gray, K. Carbon Utilization and Storage Atlas; Southern States Energy Board: Peachtree Corners, GA, USA, 2012.
  18. Warwick, P.D.; Blondes, M.S.; Brennan, S.T.; Corum, M.D.; Merrill, M.D. US Geological survey geologic carbon dioxide storage resource assessment of the United States. Energy Procedia 2013, 37, 5275–5279. [Google Scholar] [CrossRef] [Green Version]
  19. Levine, J.S.; Fukai, I.; Soeder, D.J.; Bromhal, G.; Dilmore, R.M.; Guthrie, G.D.; Rodosta, T.; Sanguinito, S.; Frailey, S.; Gorecki, C. US DOE NETL methodology for estimating the prospective CO2 storage resource of shales at the national and regional scale. Int. J. Greenh. Gas Control 2016, 51, 81–94. [Google Scholar] [CrossRef] [Green Version]
  20. Dillon, W.P.; Paull, C.K.; Buffler, R.T.; Fail, J.-P. Rifted Margins. In Structure and Development of the Southeast Georgia Embayment and Northern Blake Plateau: Preliminary Analysis; USGS: Denver, CO, USA, 1979. [Google Scholar]
  21. Dillon, W.P.; Klitgord, K.D.; Paull, C.K. Mesozoic Development and Structure of the Continental Margin off South Carolina; USGS: Denver, CO, USA, 1983; Volume 1313.
  22. Maher, J.C.; Applin, E.R. Geologic Framework and Petroleum Potential of the Atlantic Coastal Plain and Continental Shelf; 2330-7102; United States Government Publishing Office: Washington, DC, USA, 1971; p. 98.
  23. Poag, C.W. Stratigraphy of the Atlantic continental shelf and slope of the United States. Annu. Rev. Earth Planet. Sci. 1978, 6, 251–280. [Google Scholar] [CrossRef]
  24. Pinet, P.R.; Popenoe, P. A scenario of Mesozoic-Cenozoic ocean circulation over the Blake Plateau and its environs. Geol. Soc. Am. Bull. 1985, 96, 618–626. [Google Scholar] [CrossRef]
  25. Poppe, L.J.; Popenoe, P.; Poag, C.W.; Swift, B.A. Stratigraphic and palaeoenvironmental summary of the south-east Georgia Embayment: A correlation of exploratory wells. Mar. Pet. Geol. 1995, 12, 677–690. [Google Scholar] [CrossRef]
  26. Dalziel, I.W.; Dalla Salda, L.H.; Gahagan, L.M. Paleozoic Laurentia-Gondwana interaction and the origin of the Appalachian-Andean mountain system. Geol. Soc. Am. Bull. 1994, 106, 243–252. [Google Scholar] [CrossRef]
  27. Badley, M.; Price, J.; Dahl, C.R.; Agdestein, T. The structural evolution of the northern Viking Graben and its bearing upon extensional modes of basin formation. J. Geol. Soc. 1988, 145, 455–472. [Google Scholar] [CrossRef]
  28. Dillon, W.P.; Popenoe, P. The Blake Plateau Basin and Carolina Trough. Geol. N. Am. 1988, 2, 291–328. [Google Scholar]
  29. Dillon, W.P.; Popenoe, P.; Grow, J.A.; Klitgord, K.D.; Swift, B.A.; Paull, C.K.; Cashman, K.V. Rifted Margins: Field Investigations of Margin Structure and Stratigraphy. In Growth Faulting and Salt Diapirism: Their Relationship and Control in the Carolina Trough, Eastern North America; American Association of Petroleum Geologists: Tulsa, OK, USA, 1982. [Google Scholar]
  30. Lizarralde, D.; Holbrook, W.S.; Oh, J. Crustal structure across the Brunswick magnetic anomaly, offshore Georgia, from coincident ocean bottom and multi-channel seismic data. J. Geophys. Res. B 1994, 99, 21741–21757. [Google Scholar] [CrossRef]
  31. Boote, S.K.; Knapp, J.H. Offshore extent of Gondwanan Paleozoic strata in the southeastern United States: The Suwannee suture zone revisited. Gondwana Res. 2016, 40, 199–210. [Google Scholar] [CrossRef]
  32. Roth, W.M. Problem-centered learning for the integration of mathematics and science in a constructivist laboratory: A case study. Sch. Sci. Math. 1993, 93, 113–122. [Google Scholar] [CrossRef]
  33. Schlumberger. Schlumberger Petrel Manual 2014. 2016. Available online: http://isegunque.ddns.net/236.html2016 (accessed on 11 April 2016).
  34. Gorecki, C.D.; Holubnyak, Y.; Ayash, S.; Bremer, J.M.; Sorensen, J.A.; Steadman, E.N.; Harju, J.A. A new classification system for evaluating CO2 storage resource/capacity estimates. In Proceedings of the SPE International Conference on CO2 Capture, Storage, and Utilization, San Diego, CA, USA, 2–4 November 2009. [Google Scholar]
  35. Gorecki, C.D.; Sorensen, J.A.; Bremer, J.M.; Knudsen, D.; Smith, S.A.; Steadman, E.N.; Harju, J.A. Development of storage coefficients for determining the effective CO2 storage resource in deep saline formations. In Proceedings of the SPE International Conference on CO2 Capture, Storage, and Utilization, San Diego, CA, USA, 2–4 November 2009. [Google Scholar]
  36. Brennan, S.T.; Burruss, R.C.; Merrill, M.D.; Freeman, P.A.; Ruppert, L.F. A probabilistic assessment methodology for the evaluation of geologic carbon dioxide storage. US Geol. Surv. Open-File Rep. 2010, 1127, 31. [Google Scholar] [CrossRef] [Green Version]
  37. Teletzke, G.; Palmer, J.; Drueppel, E.; Sullivan, M.B.; Hood, K.; Dasari, G.; Shipman, G. Evaluation of practicable subsurface CO2 storage capacity and potential CO2 transportation networks, onshore North America. In Proceedings of the 14th Greenhouse Gas Control Technologies Conference Melbourne, Melbourne, Australia, 21–26 October 2018; pp. 21–26. [Google Scholar]
  38. Ennis-King, J.; Paterson, L. Reservoir engineering issues in the geological disposal of carbon dioxide. In Proceedings of the Fifth International Conference on Greenhouse Gas Control Technologies, Cairns, Australia, 13–16 August 2000; pp. 290–295. [Google Scholar]
  39. Holloway, S. Carbon dioxide capture and geological storage. Philos. Trans. R. Soc. A 2007, 365, 1095–1107. [Google Scholar] [CrossRef] [PubMed]
  40. Tissot, B.P.; Welte, D.H. An Introduction to Migration and Accumulation of Oil and Gas. In Petroleum Formation and Occurrence; Springer: Berlin/Heidelberg, Germany, 1978; pp. 257–259. [Google Scholar]
  41. Bachu, S. Screening and ranking of sedimentary basins for sequestration of CO2 in geological media in response to climate change. Environ. Geol. 2003, 44, 277–289. [Google Scholar] [CrossRef]
  42. Chadwick, A.; Arts, R.; Bernstone, C.; May, F.; Thibeau, S.; Zweigel, P. Best Practice for the Storage of CO2 in Saline Aquifers-Observations and Guidelines from the SACS and CO2 STORE Projects; British Geological Survey: Nottingham, UK, 2008; Volume 14.
  43. DOE-NETL. Best Practices for Risk Analysis and Simulation for Geologic Storage of CO2; DOE/NETL-2011/1459; March 2011. National Energy Technology Laboratory. Available online: https://www.academia.edu/13753393/Best_Practices_for_Risk_Analysis_and_Simulation_for_Geologic_Storage_of_CO2 (accessed on 14 January 2019).
  44. van der Meer, L.B.; Yavuz, F. CO2 storage capacity calculations for the Dutch subsurface. Energy Procedia 2009, 1, 2615–2622. [Google Scholar] [CrossRef] [Green Version]
  45. Gray, K. Carbon Sequestration Atlas of the United States and Canada; Southern States Energy Board: Peachtree Corners, GA, USA, 2010.
  46. Preston, C.; Whittaker, S.; Rostron, B.; Chalaturnyk, R.; White, D.; Hawkes, C.; Johnson, J.; Wilkinson, A.; Sacuta, N. IEA GHG Weyburn-Midale CO2 monitoring and storage project–moving forward with the Final Phase. Energy Procedia 2009, 1, 1743–1750. [Google Scholar] [CrossRef] [Green Version]
  47. Sanguinito, S.M.; Goodman, A.; Levine, J. NETL CO2 Storage ProspeCtive Resource Estimation Excel aNalysis (CO2-SCREEN) User’s Manual; National Energy Technology Lab.: Pittsburgh, PA, USA, 2017.
  48. Sanguinito, S.; Goodman, A.L.; Sams, J.I., III. CO2-SCREEN tool: Application to the oriskany sandstone to estimate prospective CO2 storage resource. Int. J. Greenh. Gas Control. 2018, 75, 180–188. [Google Scholar] [CrossRef]
  49. Liu, E.; Li, X.Y.; Chadwick, A. Multicomponent Seismic Monitoring of CO2 Gas Cloud in the Utsira Sand: A feasibility Study: Saline Aquifer CO2 Storage Phase 2 (SACS2): Work Area 5 (Geophysics): Feasibility of Multicomponent Seismic Acquisition. 2001; Unpublished. [Google Scholar]
  50. Chadwick, R.; Williams, G.; Noy, D. CO2 storage: Setting a simple bound on potential leakage through the overburden in the North Sea Basin. Energy Procedia 2017, 114, 4411–4423. [Google Scholar] [CrossRef]
Figure 1. Location map of the study area. Panel (A) is the location of the study area in the regional map, panel (B) is the study area map, and panel (C) is the well locations.
Energies 15 04890 g001
Figure 2. TRANSCO 1005-1-1, COST GE-1, and EXXON 564-1, stratigraphically and geophysically correlated by logs and lithology, modified and adapted with permission from Ref. [25]. Copyright 1995, copyright Poppe et al., and Ref. [31]. Copyright 2016, copyright Boote and Knapp.
Energies 15 04890 g002
Figure 3. Seismic-well tie analysis for three wells: (A) The location map of the commercial wells in the Southeast Georgia Embayment. (A1) The seismic profile Number GE-75-112A intersecting the TRANSCO 1005-1-1 well. (A2) The seismic profile Number MME-101 intersecting the COST GE-1 well. (A3) The seismic profile Number E8-78-7065 intersecting the EXXON 564-1 well.
Energies 15 04890 g003
Figure 4. Analysis of density logs and gamma ray logs to generate porosity logs, compared with estimated porosity from analysis of core samples from the COST GE-1 well.
Energies 15 04890 g004
Figure 5. Characterizations of the storage elements, seals, and reservoirs identified based on the geological and geophysical data at the COST GE-1 well.
Energies 15 04890 g005
Figure 6. Structural maps of the study area: (A) the location map of the study area, (B) the depth map for the top topographic surface of the Lower Cretaceous section, (C) the depth map for the bottom topographic surface of the Lower Cretaceous section, (D) the thickness map of the Lower Cretaceous section, and (E) is the cross-section AB shown in panels (B,C) in this figure. The cross-section AB demonstrates the lateral extension and thickness of the reservoirs and seals across the Lower Cretaceous strata in the study area.
Energies 15 04890 g006
Figure 7. (A) The three reservoirs in three depth zones plotted in the geothermal gradient at the COST GE-1 well. (B) The time–depth–pressure graph to identify the density of supercritical CO2 for three reservoirs in the three depth zones of the Lower Cretaceous section.
Energies 15 04890 g007
Figure 8. The total CO2 storage capacity (in gigatons) for the Lower Cretaceous section: (A) the total capacity at P10, (B) P50, and (C) P90 in the local area.
Energies 15 04890 g008
Figure 9. The total CO2 storage capacity (in gigatons) for the Lower Cretaceous section: (A) the total capacity at P10, (B) P50, and (C) P90 in the regional area.
Energies 15 04890 g009
Table 1. Numerical and Monte Carlo estimates for saline formation efficiency factors at the formation scale. Adapted with permission from Ref. [16]. Copyright 2011, Copyright Goodman et al., Ref. [35]. Copyright 2009, copyright Goreckie et al., and Ref. [46]. Copyright 2009, copyright Preston et al.
LithologyMonte Carlo Method (E%)Numerical Method (E%)
P10P50P90P10P50P90
Clastic1.862.761.22.44.1
Dolomite2.583.265.5422.73.6
Limestone1.412.043.271.322.8
Table 2. The 14 lithological intervals of the Lower Cretaceous strata, between depths of 1798 and 2195 m in the COST GE-1 well, based on [9]. Adapted with permission from Ref. [9]. Copyright 1979, copyright Scholle.
UnitDepth LithologyPorosity
ftm
159001798Shale, gray, silty, calcareous, micaceous, and sandstone.Low
259901826Shale, silty, calcareous, micaceous, non-calcareous sandstone.Very low
360801853More shale, slightly calcareous, carbonaceous, fossiliferous.Low to moderate
463201926Coarse-to-medium crystals, dense, and fossil fragments.Low to high
565001981Partly sandy, dense silty, hard, calcareous to non-calcareous.Low
668002073Sandstone, shell, sandstone, anhydrite, and gypsum.Low to high
768902100Limestone, shale, very fine-grained calcareously cemented sandstone, and anhydrite with dense dolomite.Moderate
870202140Dolomite, finely crystalline to dolomite, limestone increasing with depth, shale, and sandstone.Low to high
970702155Limestone, fossiliferous, dolomite, and non-calcareous.Low to high
1071602182Shale and sandstone, much calcareous cement.Moderate to low
1172002195Shale, sandstone, and silty shale with calcareous cement. Limestone, some dolomite, and fossiliferous to non-fossiliferous.High
1274002256Shale, some gravel trace, dolomite, and fossiliferous to non-fossiliferous.High
1374902283Lithology like unit 12 with decreasing shale, increasing dolomite.High
1479102411Shale to fine sandstone, gravel, faintly calcareous and non-calcareous shale, dolomite with some clayey coatings, non-fossiliferous, much coal, anhydrite, and sandy dolomite.Moderate
Table 3. Ideal geological CO2 storage criteria for reservoir properties and caprocks. Reprinted with permission from Ref. [42]. Copyright 2008, copyright Chadwick et al., and Ref. [50]. Copyright 2017, copyright Chadwick et al.
MediaPropertiesPositive IndicatorsCautionary Indicators
ReservoirStatic storage capacityEvaluated effective CO2 storage capacity greater than total injected CO2Evaluated effective CO2 storage capacity equal to total injected CO2
Dynamic storage capacityPredicted injection-induced pressures below the rate of inducing geomechanical damage to the reservoir or caprock.Geomechanical instability limits reaching the predicted injection-induced pressures.
Depth (m)Greater than 800Less than 800
Thickness (m)Greater than 50Less than 20
PorosityGreater than 0.20Less than 0.10
Permeability (m2)Greater than 4.93 × 10⁻¹²Less than 1.97 × 10⁻¹³
StratigraphyCapacity much larger than total injected CO2Capacity ≤ total injected CO2
CaprocksLateral stratigraphyUniform and small or no faultLateral variations and medium-to-large fault
Thickness (m)Greater than 20Less than 20
Capillary entry pressureGreater than the maximum predicted injection-induced pressure increase Equal to the maximum predicted injection-induced pressure increase
Table 4. The physical parameters for the three reservoirs applied in the NETL method (Equation (1)) in the local and regional zones.
ZoneReservoirArea (km²)Gross Thickness (m)Total Porosity (%)Pressure (MPa)Temperature (°C)
MeanStd DevMeanStd DevMeanStd DevMeanStd Dev
Local110,0001340.00930.280.0012260.000472.80.06
210,0009100.323.2 × 10−18290.019375.40.006
310,0009300.320320.038576.20.06
Regional1200,000830.1930.2450.01226.30.1925701.6
2200,000600.00010.33.2 × 10−1729.30.192573.41.6
3200,000630.00010.285032.60.384975.50.06
Table 5. CO2 density values estimated based on depth, temperature, and overburden pressure for the reservoirs in the three depth zones.
ZoneReservoirDepth (m)Temp. (°C)PressureDensity
(MPa)(kg/m3)
SLKR1110056.218700
R2130058.620708
R3155060.222712
GLKR1185572.826722
R2212076.229732
R3235075.432740
DLKR1255081.135760
R2268085.439768
R3286090.944778
Table 6. The probabilities from P10 to P90 of the ratio parameters that were considered in Equation (2) to identify the efficiency factor (E) at the formation scale for dolomite reservoirs of the Lower Cretaceous section.
LithologyNet-to-Total Area (EAn/At)Net-to-Gross Thickness (EHn/Hg)Effective-to-Total Porosity (EØe/Øt)Volumetric Displacement (Ev)Microscopic Displacement (Ed)
P₁₀P₉₀P₁₀P₉₀P₁₀P₉₀P₁₀P₉₀P₁₀P₉₀
Dolomite0.20.80.170.680.530.710.260.430.570.64
Table 7. Volumetric CO2 storage capacity (GCO2) in Mt with the storage efficiency factor (E%) at P10, P50, and P90 for the three Lower Cretaceous reservoirs within local and regional zones in the Mid–South Atlantic Ocean.
ZoneReservoirStorage Resource (Mt)Storage Efficiency (%)
P₁₀P₅₀P₉₀P₁₀P₅₀P₉₀
Local119.1260.45146.570.692.195.31
214.8547.77117.570.672.175.34
315.0151.08122.560.652.25.28
Regional1182.63635.831628.720.652.185.25
288.54414.751574.370.672.225.4
3179.67597.971502.370.672.175.3
Publisher’s Note: MDPI stays neutral with regard to jurisdictional claims in published maps and institutional affiliations.

