Article

Dual Extended Kalman Filter for State of Charge Estimation of Lithium–Sulfur Batteries

1
Power Systems Research Group, Catalonia Institute for Energy Research (IREC), 08930 Barcelona, Spain
2
Energy Systems and Energy Harvesting Group, IREC, 08930 Barcelona, Spain
3
Department of Engineering Projects and Construction, Universitat Politècnica de Catalunya (UPC), 08034 Barcelona, Spain
*
Author to whom correspondence should be addressed.
Energies 2022, 15(19), 6989; https://doi.org/10.3390/en15196989
Submission received: 22 August 2022 / Revised: 12 September 2022 / Accepted: 20 September 2022 / Published: 23 September 2022
(This article belongs to the Special Issue Lithium–Sulfur Batteries: Progress and Prospects)

Abstract

:
Lithium-Sulfur is a promising technology for the next generation of batteries and research efforts for early-stage prototype implementation increased in recent years. For the development of a suitable Battery Management System, a state estimator is required; however, lithium-sulfur behavior presents a large non-observable region that may difficult the convergence of the state estimation algorithm leading to large errors or even instability. A dual Extended Kalman Filter is proposed to circumvent the non-observability region. This objective is achieved by combining a parameter estimation algorithm with a cell model that includes non-linear behavior such as self-discharge and cell degradation. The resulting dual Kalman filter is applied to lithium–sulfur batteries to estimate their State-of-Charge incorporating the effects of degradation, temperature, and self-discharge deviations.

1. Introduction

Lithium–Sulfur (LiS) is a promising system among post-Li-ion technologies to power up electrical vehicles in the near future [1,2,3]. In a LiS battery, sulfur is used as the cathode, which is cost-effective, abundant, and stores a larger capacity than oxide materials commonly used for Li-ion batteries, and the lithium metal anode ensures high energy density. Developments conducted over the last 10 years on each individual component led to complex cathode composites with improved kinetics [4] or more stable Li anodes [5] which, together with new electrolyte formulations and additives, have maximized the performance of the system. However, up-scaling to high-capacity cells remains a challenge [6] and more research efforts are indeed required before this technology can be commercially viable. Currently, discharge capacity, cycling stability, self-discharge characteristics, and performance at high temperatures are still issues to be addressed at the full cell level. Up to now, few demonstrators based on LiS have been presented with reported energy densities in the range of 500 Wh/kg [7].
Advances in LiS batteries lead to the necessity of having a suitable management system to supervise its operation and safety. To acquire relevant information, the Battery Management System (BMS) requires a cell model to identify non-measurable parameters. A Thevenin-based model obtained from current-voltage experiments in the time domain is the most suitable for run-time estimations and for BMS implementation. Resistances and capacitors of the Equivalent Circuit Model (ECM) are usually non-linear functions of the State-of-Charge (SoC) and current rate [8].
The State-of-Health (SoH) estimation computes the remaining useful capacity of the cell as a percentage of the nominal capacity, that is, the capacity measured during initial cycles. In general terms, the capacity of cells degrades over time (calendar aging) and use (cycling aging), and, in both cases, several factors contribute to accelerating or decelerating the aging phenomena [9,10]. The aging factors are not the same for all cell chemistries, for instance, LiS batteries seem to be not much affected by temperature or C-rate, which are two key aging factors for Li-ion batteries [11,12,13].
Typically, SoC estimation algorithms rely on current and voltage measurements to compute the estimated value; the resulting accuracy is considered appropriate, for instance, for lithium-ion batteries. However, given the high non-linearity observed in the LiS battery behavior and the low observability of its discharge profile, this method yields large estimation errors [14].
Research on LiS state estimation applying single Kalman filters in different variants (Sigma-point, Unscented, Extended). It is found that the high self-discharge within the high plateau hinders the determination of a precise initial SoC and that in the low plateau, the flat OCV curve and relative constant battery parameters hinder a precise estimation. The flat area is where current-related effects on usable capacity are prominent, which is the reason why the proposed estimation methods work best within a certain discharge current range, as described in [15,16]. These studies conjectured that improvements to the model to represent self-discharge are likely to benefit the robustness of the estimators. Furthermore, the introduction of elements to deal with current-related effects on parameter change is very likely to improve accuracy. These studies also highlighted that it would be positive to consider whether adaptive noise covariance values can be used to improve the model fit whilst accommodating regions of greater uncertainty. A limitation of the tests performed in those studies is the constant temperature scenario.
The application of data-based structures such as Artificial Neural Networks (ANN) and Fuzzy Logic strategies showed that LiS batteries have much more complexities compared to Li-ion and three main sources of error in LiS SoC estimation are as determined [17,18]: (1) Shift in the break-point between high-plateau and low plateau due to temperature change, high discharge rate, aging, etc., which leads to an error in SoC estimation, (2) Flat shape of OCV curve can cause a challenge in LiS cell SoC estimation due to poor observability of the system, (3) Uncertainty and deviations in cell model identification lead to an error in SoC estimation. Moreover, the SoC estimation performance under real driving conditions presented up to 20% error, which clearly needs to be improved.
To overcome these issues, this work proposes to enhance the state estimation algorithm by adding the temperature, the cycle number, and the time for calendar self-discharge computation. To provide an accurate estimation, a dual Extended Kalman Filter (EKF) is applied to estimate the parameters of the developed model in the low observability region. It is found that a low estimation error can be achieved compared to structures such as coulomb counting.
This article is organized as follows; in Section 2, the battery model and its behavior are described, in Section 3 the methodology used for state estimation is developed, and in Section 4 the resulting functions and surfaces are provided. Section 5 summarizes the conclusion of this work.

2. Methodology

The well-known ECM structure is proposed to capture the dynamics of LiS cells and feed the estimation algorithm that computes the internal states. However, as it will be shown, the dynamics of LiS technology yield a region of low observability where internal states cannot be accurately estimated. To circumvent this issue, a dual-state estimation structure is proposed where additional parameters are included to enhance State-of-Charge (SoC) estimation capabilities. Laboratory experiments are performed to analyze the influence of the C-rate, the temperature, the degradation, and the self-discharge on cell performance. The results obtained from the experimental setup generate a set of surfaces that are generated where the evolution of the internal parameters can be interpolated depending on their operating point, i.e., temperature, cycle number, and degradation level (SoH). The experimental procedure is described and the final dual estimation structure is then proposed.

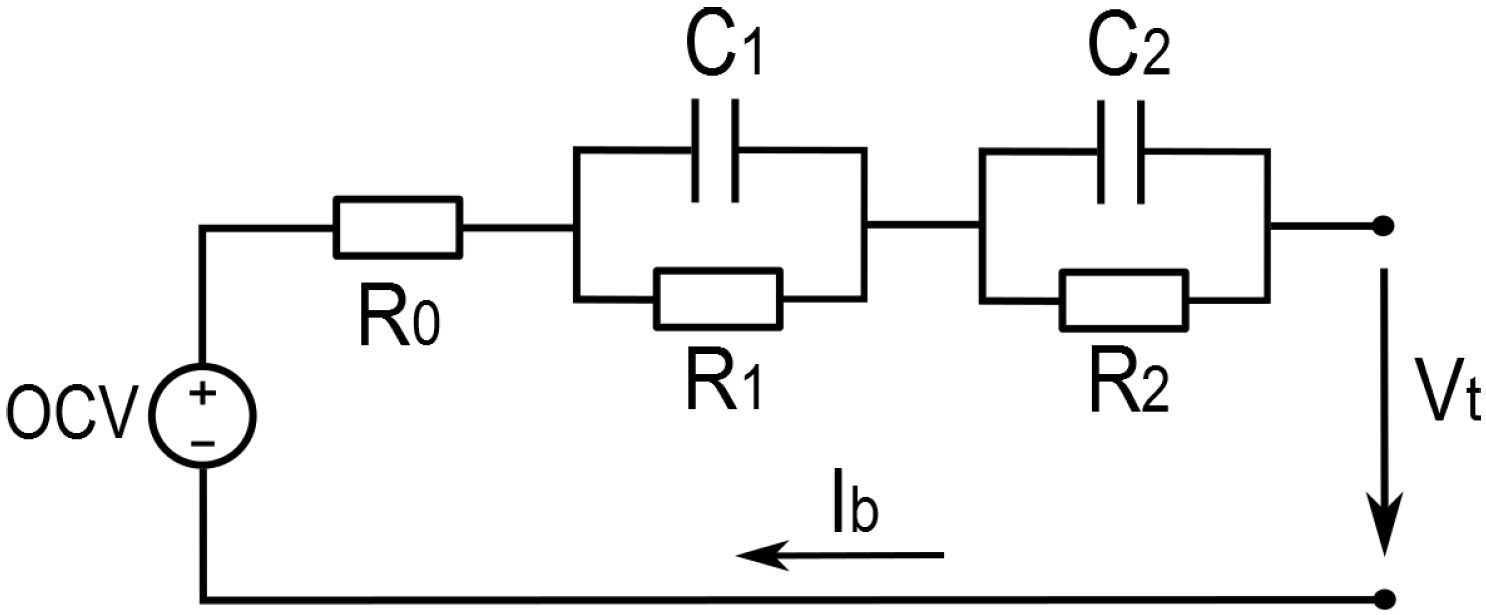
2.1. Cell Model Description

Since it is necessary to select the best trade-off between model accuracy and computational effort, the model complexity has to be taken into consideration. Additional RC branches, Constant Phase Elements (CPEs), or Warburg impedances can provide a better model accuracy; however, the computational effort will be greatly increased [19] to the detriment of time response or reactivity and an increase in implementation costs to compute them. For this reason, an ECM model with 2 RC branches (Figure 1) is chosen; it provides a trade-off solution between a good fitting and low/fast computational effort.
The representation of the cell model can be expressed as (1)–(4):
V O C V ( S o C ) = V t ( t ) G ( s ) I b ( t )
G ( s ) = R 0 + R 1 1 + s R 1 C 1 + R 2 1 + s R 2 C 2
V ˙ 1 = V 1 R 1 C 1 + 1 C 1 I b
V ˙ 2 = V 2 R 2 C 2 + 1 C 2 I b
To represent the nonlinear relationship between the OCV and SoC there are different approaches, the most common are the lookup table, the polynomial approximation, and the piecewise linear function. Piecewise linear functions have less computational requirements than high order polynomial approaches and less memory footprint than the lookup table method [20]. Considering a linearized piecewise structure, the O C V - S o C function can be expressed as V O C V = a i S o C i + b i where the subindex i refers to the i-th interval of SoC and OCV is the Open Circuit Voltage. Then the space-state representation becomes (5) and (6):
V ˙ 1 V ˙ 2 S o C ˙ = 1 R 1 C 1 0 0 0 1 R 2 C 2 0 0 0 0 V 1 V 2 S o C + 1 C 1 1 C 2 μ Q T I b
V t b i = 1 1 a i V 1 V 2 S o C R 0 I b
where μ is the battery coulombic efficiency and Q T is the total cell capacity.
The model parametrization is obtained using a current pulse-based method (Galvanostatic Intermittent Titration Technique (GITT)) where the SoC is shifted based on pulses of equal length followed by a relaxation time where the measurements are made. The method is applied to an ECM with two RC branches and five voltage points are identified during the voltage response under the applied current; they are the open-circuit voltage (OCV). The instantaneous voltage drop after applying the current represents the fast dynamics and the last step of voltage variation shows the slow dynamics. From the measured voltage values, the parameters are estimated using:
R i = Δ V i I , C i = R i Δ t i , τ i = R i C i
where V and I are the corresponding electrical measurements, Δ t i is the time span for each measurement, and τ i is the time constant related to the cell’s fast and slow dynamics. Then, the battery voltage can be simulated and compared with the measurements:
V ( t ) = O C V + I ( t ) R 0 + I ( t ) R 1 ( 1 e t τ 1 ) + I ( t ) R 2 ( 1 e t τ 2 )
where V(t) is the simulated voltage, I(t) is the applied current, t is the time and R i , C i , τ i are the model parameters.

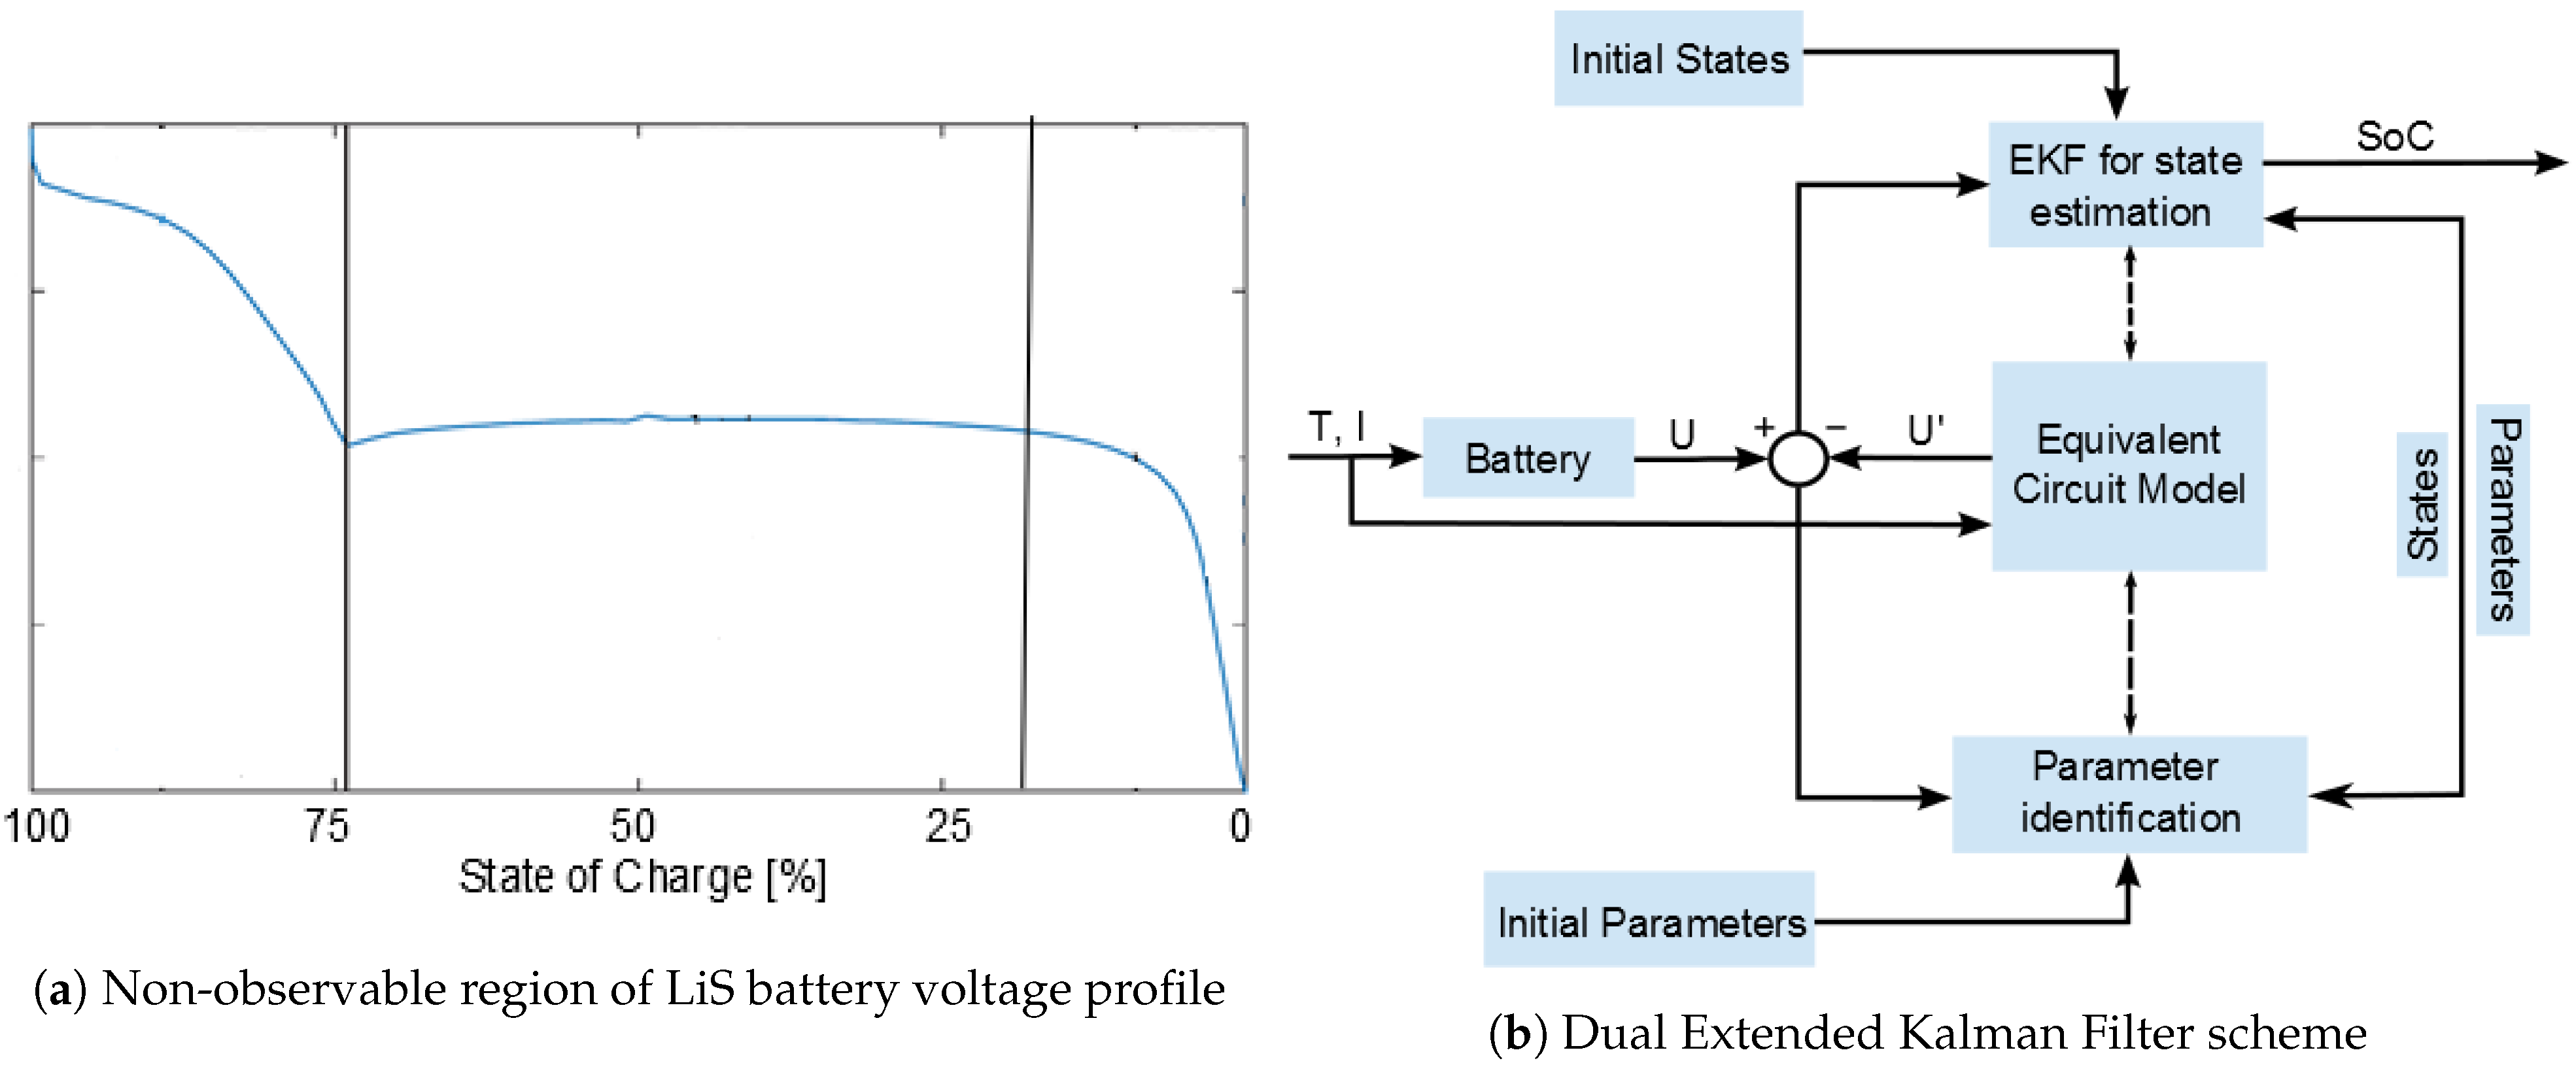
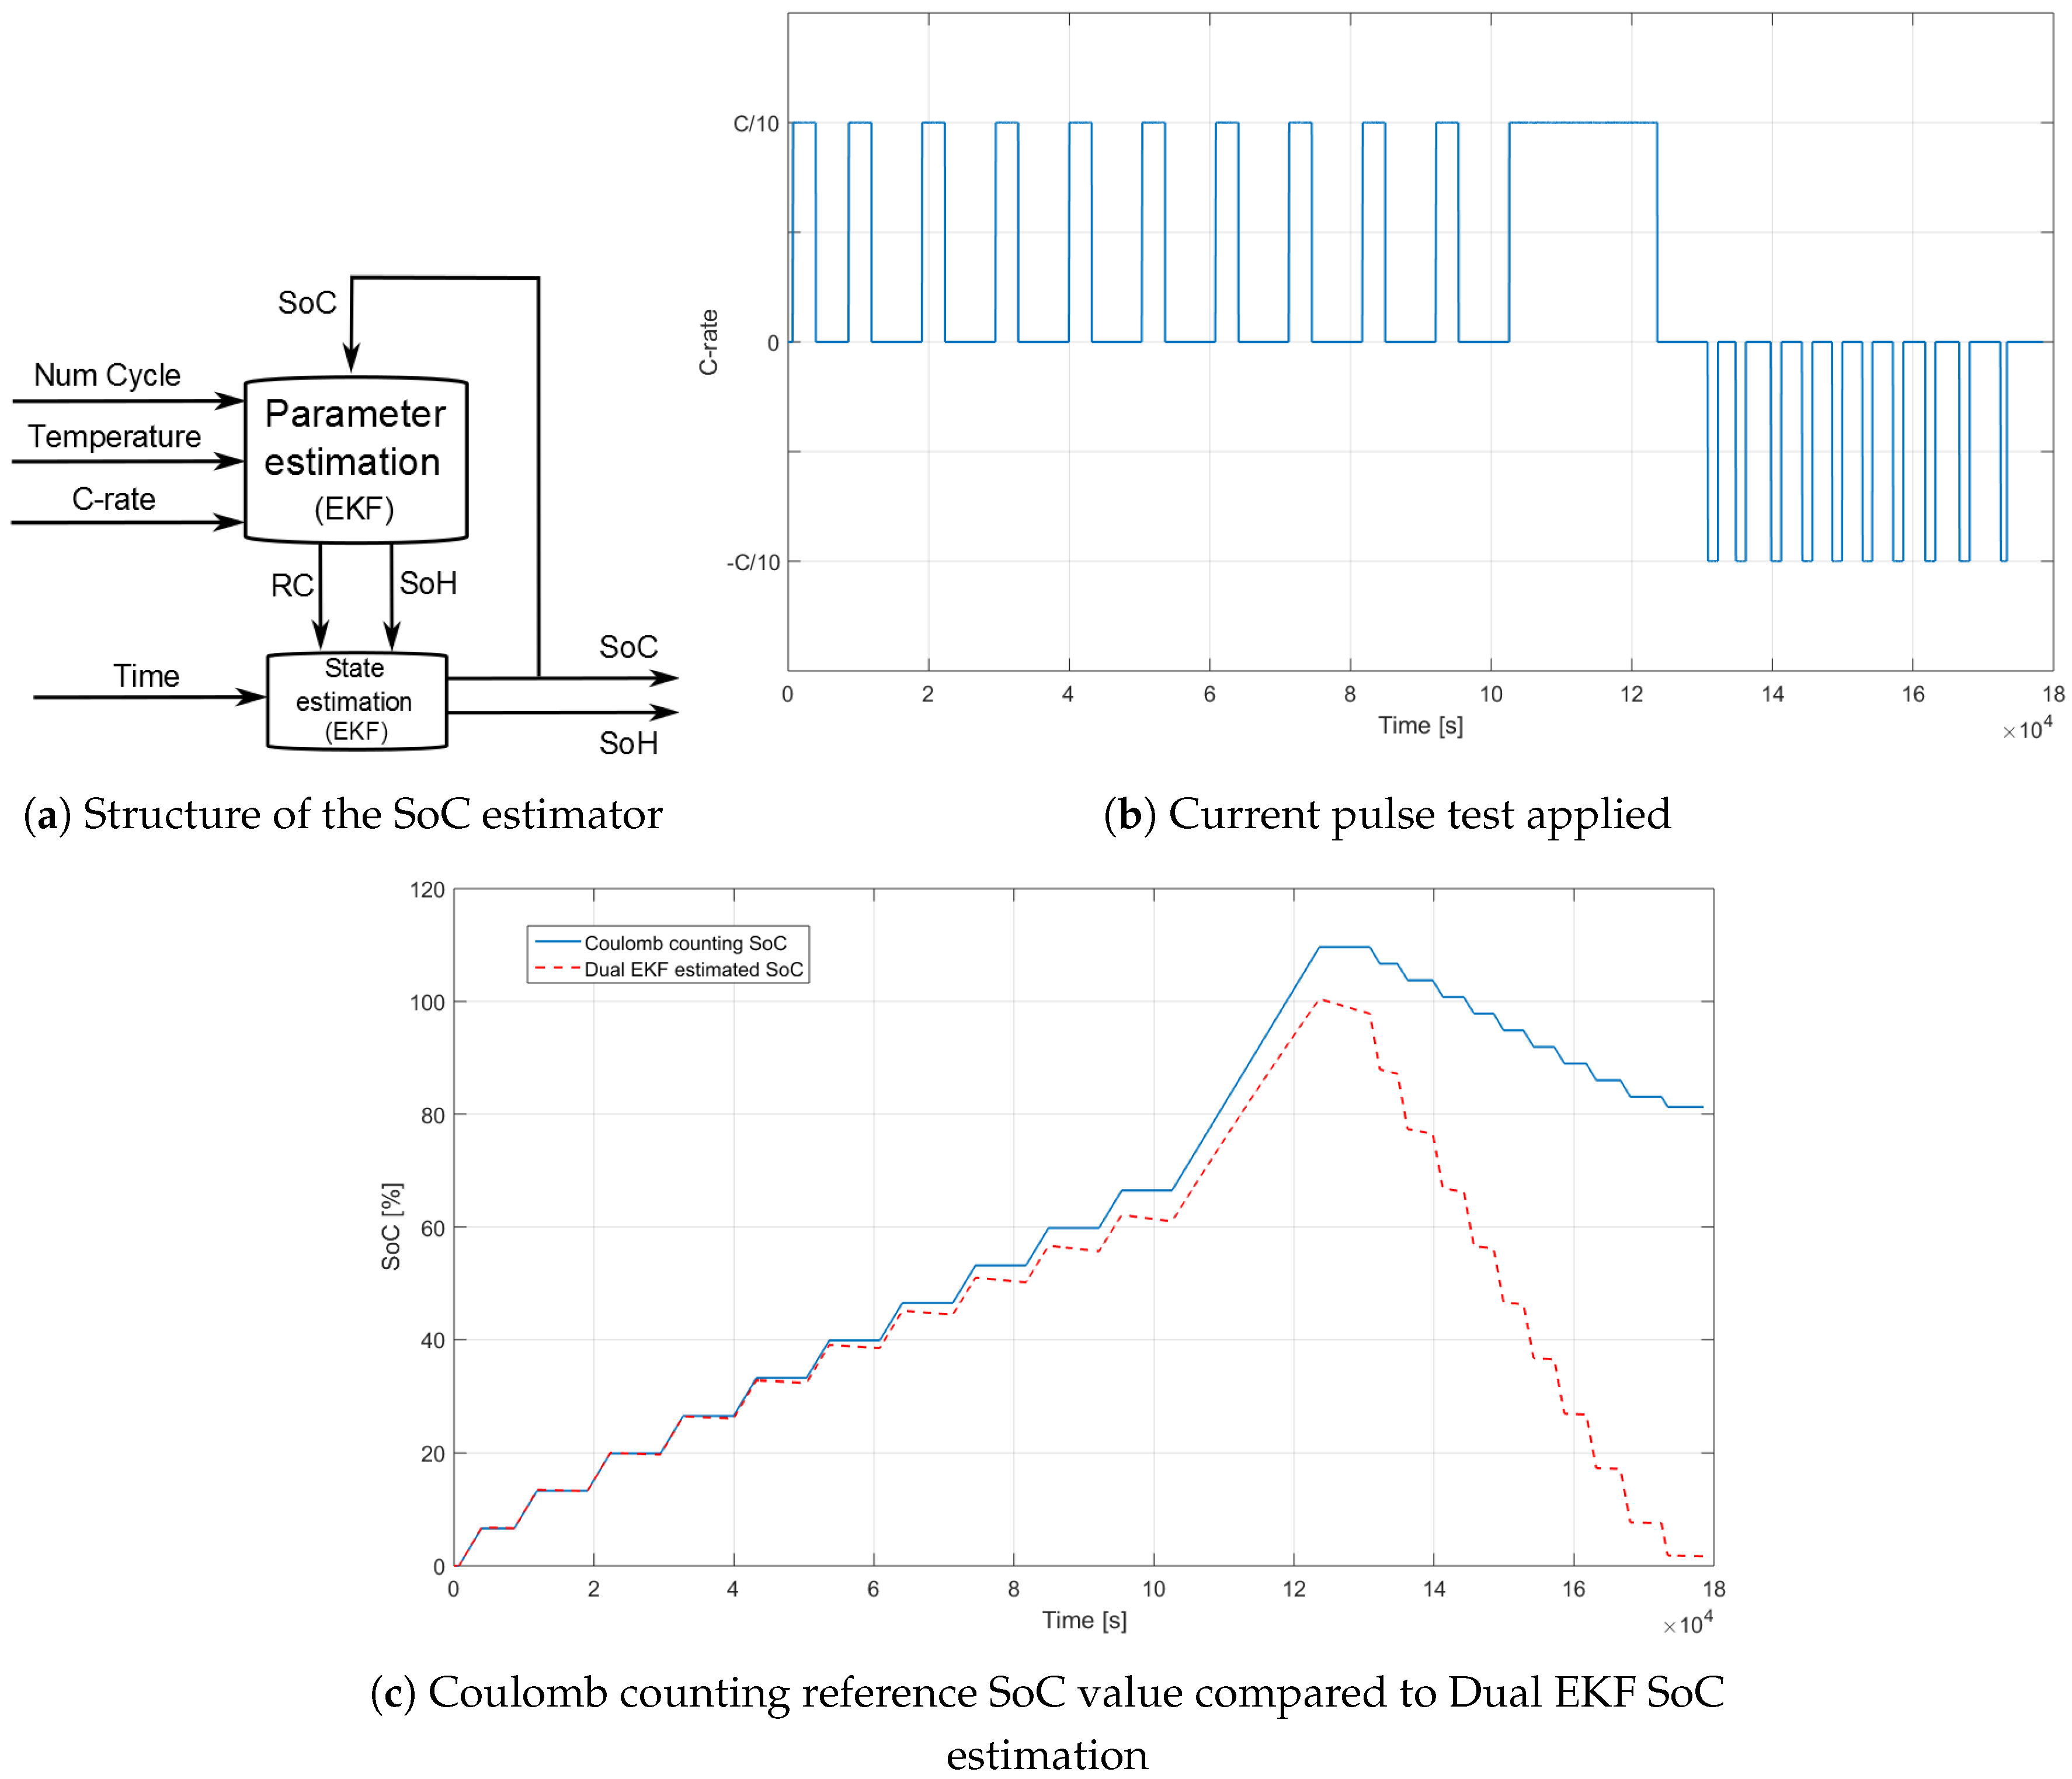
2.2. LiS Cell State Estimation

In the space-state form, the observability matrix [14] is computed as (9):
O = 1 1 a i 1 R 1 C 1 1 R 2 C 2 0 1 R 1 C 1 2 1 R 2 C 2 2 0
The observability matrix will not have full rank when a i is zero and this situation happens in a LiS-based cell approximately in the SoC range of 25–75% (Figure 2a). This issue leads to a system with low observability of the internal parameters meaning that the estimation process will have to be reinforced with a secondary estimation technique to overcome the problem and provide an accurate output.
Among the estimation methods available, EKF is recommended for BMS purposes [21,22,23] since it provides the best trade-off between an acceptable accuracy, fast convergence, robustness, and small computational efforts. A dual estimator structure (Figure 2b) is proposed to update the internal states and the model parameters while the battery is in operation [24,25].
To be able to calculate the State-of-Health (SoH), the previous procedure is repeated several times. The SoH estimation is computed separately based on the data obtained from intensive testing in controlled laboratory conditions. The online update of this information takes into consideration the age, cycling conditions, and the database containing the amount of energy and power managed by the battery during its lifetime.
The GITT procedure is repeated for a large number of cycles to capture the evolution of the RC parameters and their uncertainty level. The experimental results of the parameter evolution are displayed in Figure 4 for every 25 cycles. The parametric evolution is then used for the parameter identification function that will update the model for the estimation algorithm in run-time.
The GITT parametric analysis is repeated at three temperatures (low temperature (−10 °C), Room Temperature (RT), and high temperature (45 °C) and at three C-rates (low (C/10), medium (C/2), and high (2C)) to capture the variation of the parameter evolution in each situation. In total, nine tests have been performed (for 3 temperatures and 3 C-rates) to form a matrix where intermediate situations can be interpolated to obtain the parameter values and update the model. The model is not only updated with the temperature and C-rate of the battery in operation but also with the cycle number, which influences the battery behavior and is linked to the SoH. Therefore, it can be used to estimate the degradation level and modify the safe operation area, safety measures, and power control strategy. The experiments performed are summarized in Table 1.
Following the procedure described previously, a set of functions to compute the parameters for the cell model are obtained. The full model computes the RC parameters ( R 0 , R 1 , R 2 , C 1 , C 2 ) based on the cycle number (n), temperature (T°) and the C-rate, expressed as R C = f ( n , T , C r a t e ) . Given the high order of the resulting function, the complexity of the model is reduced by breaking the parameter estimation into smaller surfaces, which are sequentially interpolated to reach the desired parameters. The resulting functions are expressed as follows:
Step 1: The initial set of RC parameters is computed based on the cycle number and the enveloped temperatures and C-rates that bound the region where the system is in operation. Equation (10) expresses the polynomial function that approximates the parameters with a small Root Mean Square Error (RMSE) for all cases.
R C ( x , y ) = i , j = 0 k p i j x i y j
where x is the SoC (%), y is the cycle number, and the polynomial function is limited to the third order.
Step 2: The set of RC parameters are then interpolated between the bounding temperatures for each C-rate using (10) (with y being the temperature in °C), which expresses the estimation surface for all temperatures in the range from −10 °C up to 45 °C. An example of the resulting surface is shown in Figure 7b.
Step 3: The final step consists of the interpolation of the RC parameter over the C-rate surface to extract the cell model to be able to use the Extended Kalman Filter efficiently. The surface expressed by (10) (with y being the C-rate) is provided in Figure 7c as a visual representation.
After the previous sequence is applied, the internal parameter estimator is combined with two different state estimators that greatly influence the performance of the LiS cell. These are the SoH and the self-discharge ratio.
The evolution of the SoH is extracted from the experimental results and linearized to extract the functions that conform to the operational region. The SoH is updated periodically, it starts from 100% when the battery is fresh and a percentage of degradation (D) is computed based on the operational conditions (Temperature and C-rate) since the last update. The update expression is Equation (11):
S o H = S o H D
The degradation rate D is interpolated between the surfaces that follow the SoH (%) of cells cycled at different temperatures and C-rates as in Equation (12). An example of generated surfaces is shown in Figure 7d,e, and the expression is
S o H ( x , y ) = i , j = 0 k q i j x i y j
where x is the cycle number, y is the temperature (°C), and the polynomial function is limited to the third order.
Similarly, the self-discharge ratio is computed based on time, temperature, and SoC, for instance, the surface that relates temperature and cycle number to the SD ratio is expressed as (13):
S D ( x , y ) = i , j = 0 k r i j x i y j
where SD is the Self-Discharge ratio, x is the time in days, y is the temperature (°C), and the polynomial function is limited to the second order. The resulting surface is displayed in Figure 7f.

3. Experimental Results

Applying the GITT procedure, the ECM parameters are derived and the experimental results are displayed in Figure 3. In Figure 4, the evolution over the cycling of R 0 and C 2 are shown, these results show the trends that the battery parameters follow as the aging effects become predominant.
The ECM parameters show evolution as the battery degrades, it can be clearly seen how the internal resistance increases more than two times in 250 cycles. The parameter R 0 has a constant rate increase over cycling, not showing any sign of exponential increment, unlike lithium-ion batteries. For C 2 , the decrease also progresses at an almost constant pace; however, above 70% of SoC, a radical change in behavior is observed and its value seems to be quite stable during the first 250 cycles.
To determine the self-discharge ratio, the methodology consisted of charging in a low C-rate (C/10) cell and after a rest period of days at different temperatures, the same C-rate is used to discharge the cell. The available charge after the rest period is obtained and the evolution of the self-discharge capacity can be computed. This test is repeated charging the cell at 100% SoC and 50% SoC.

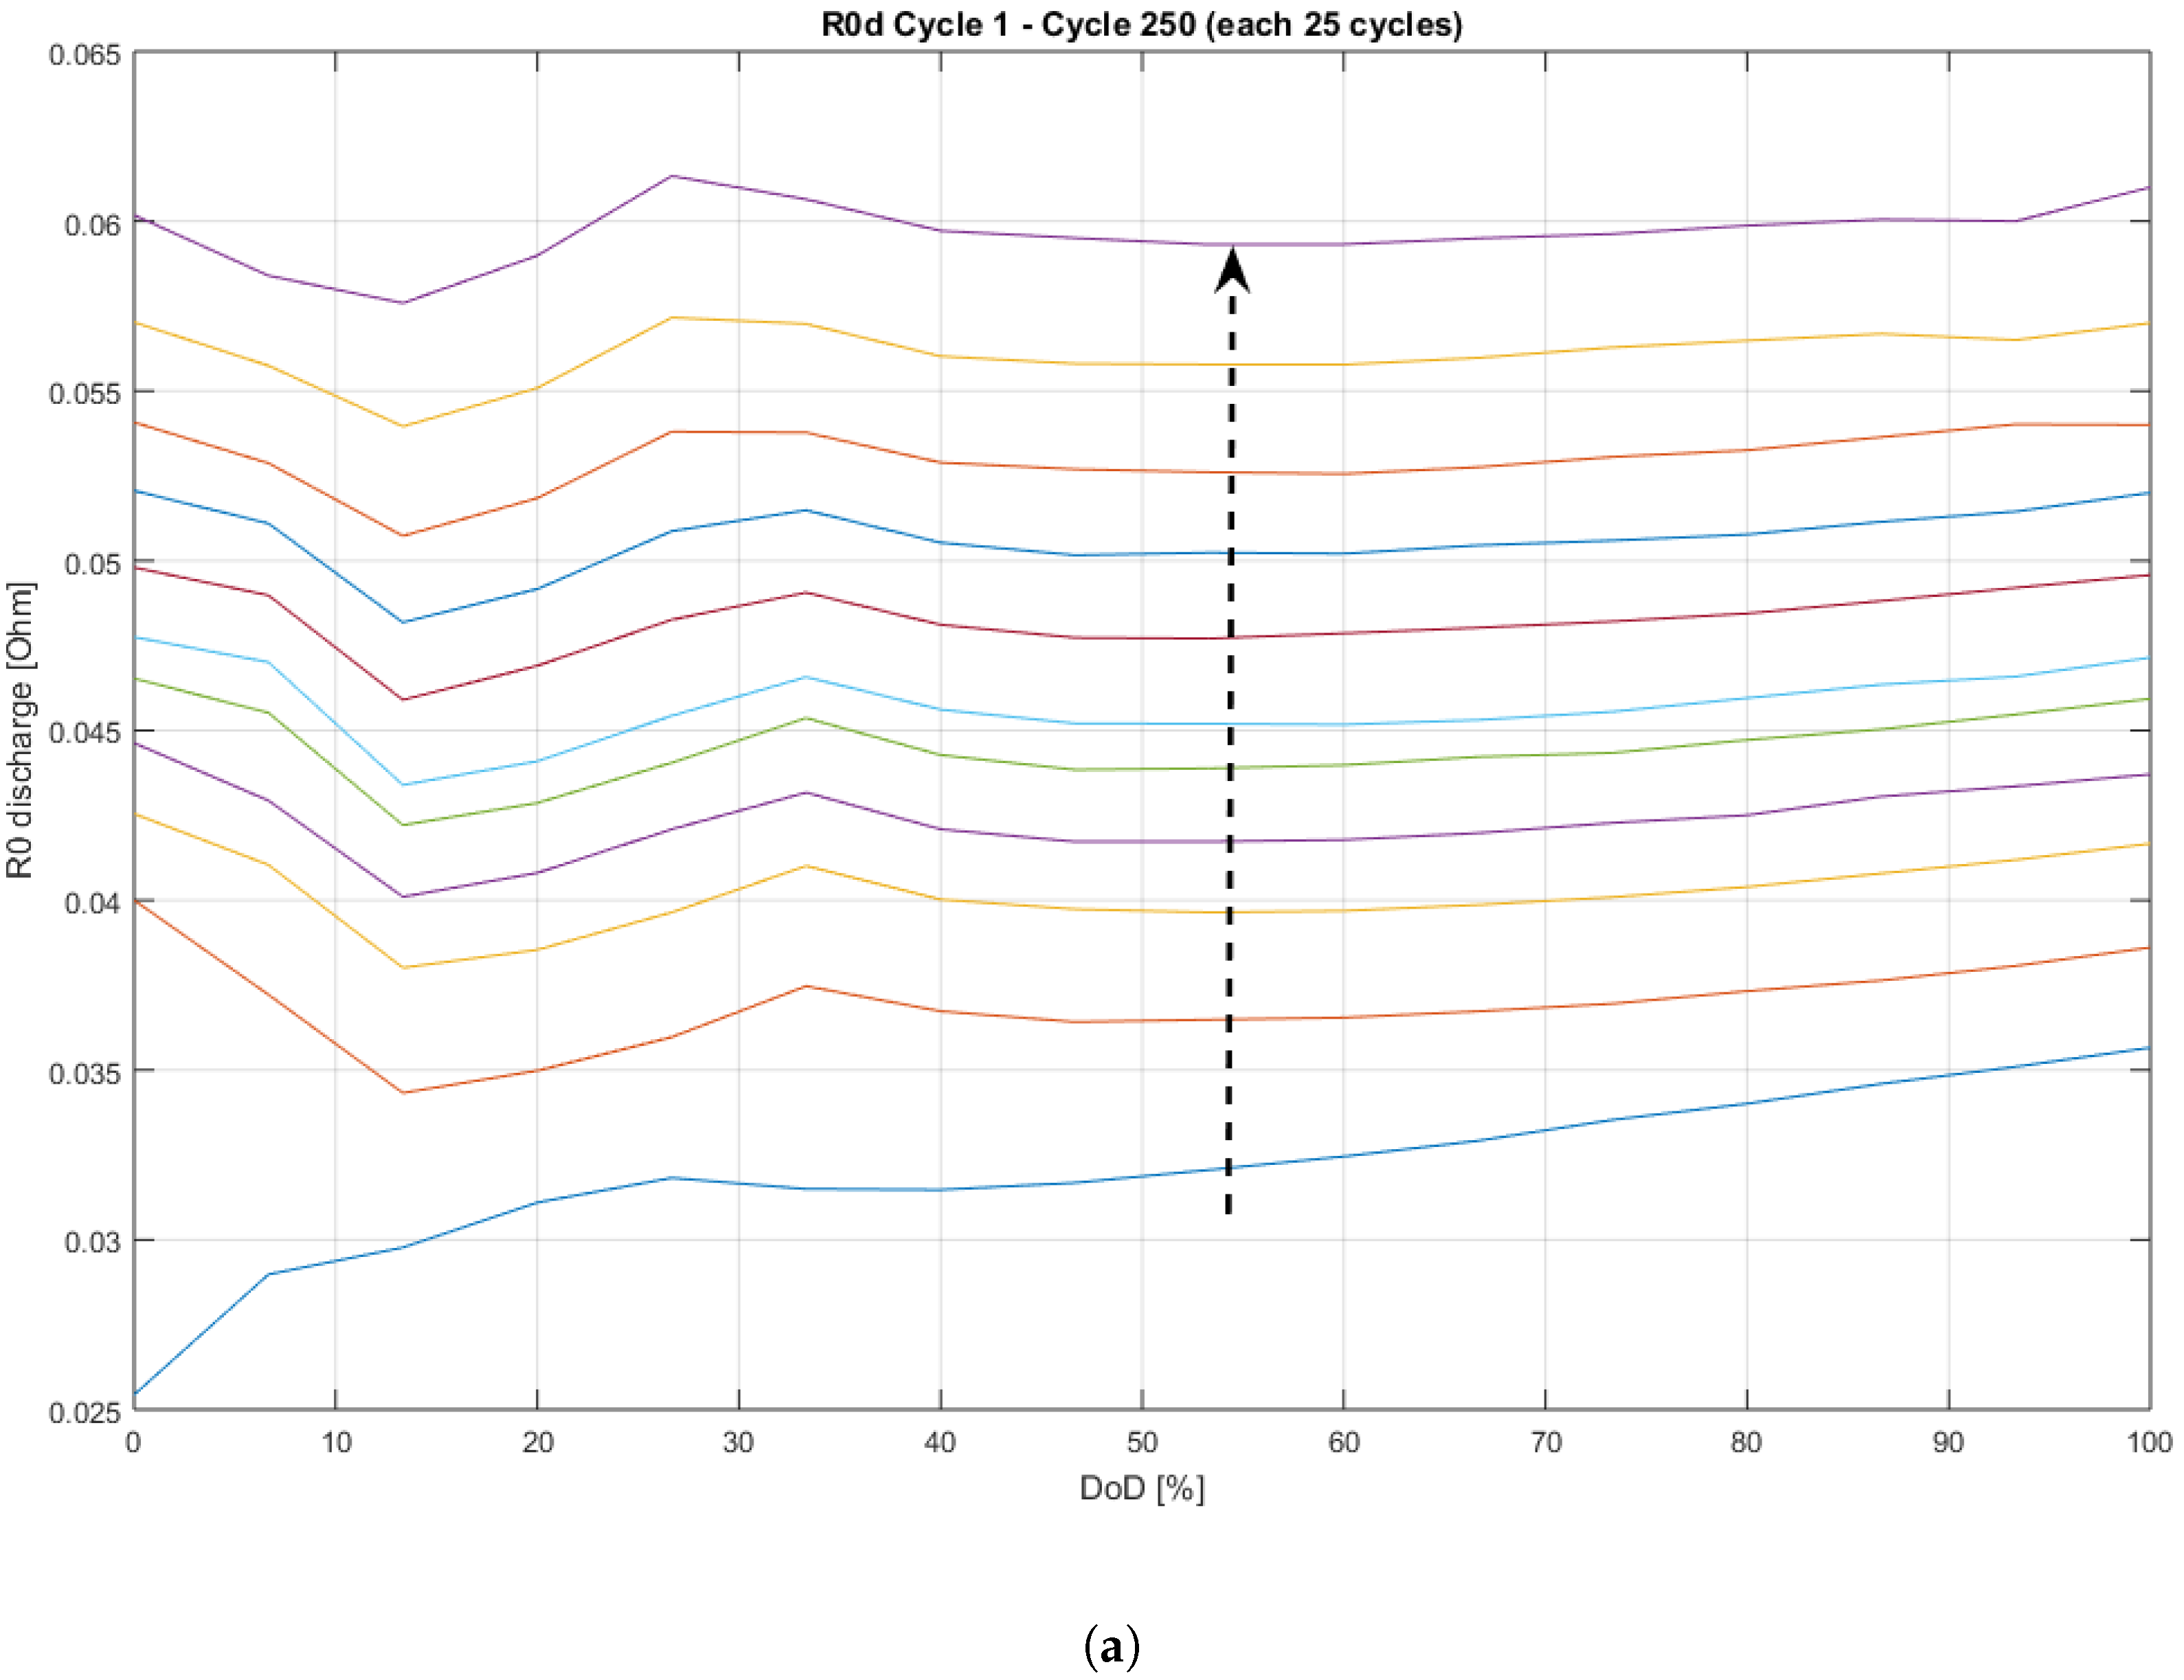
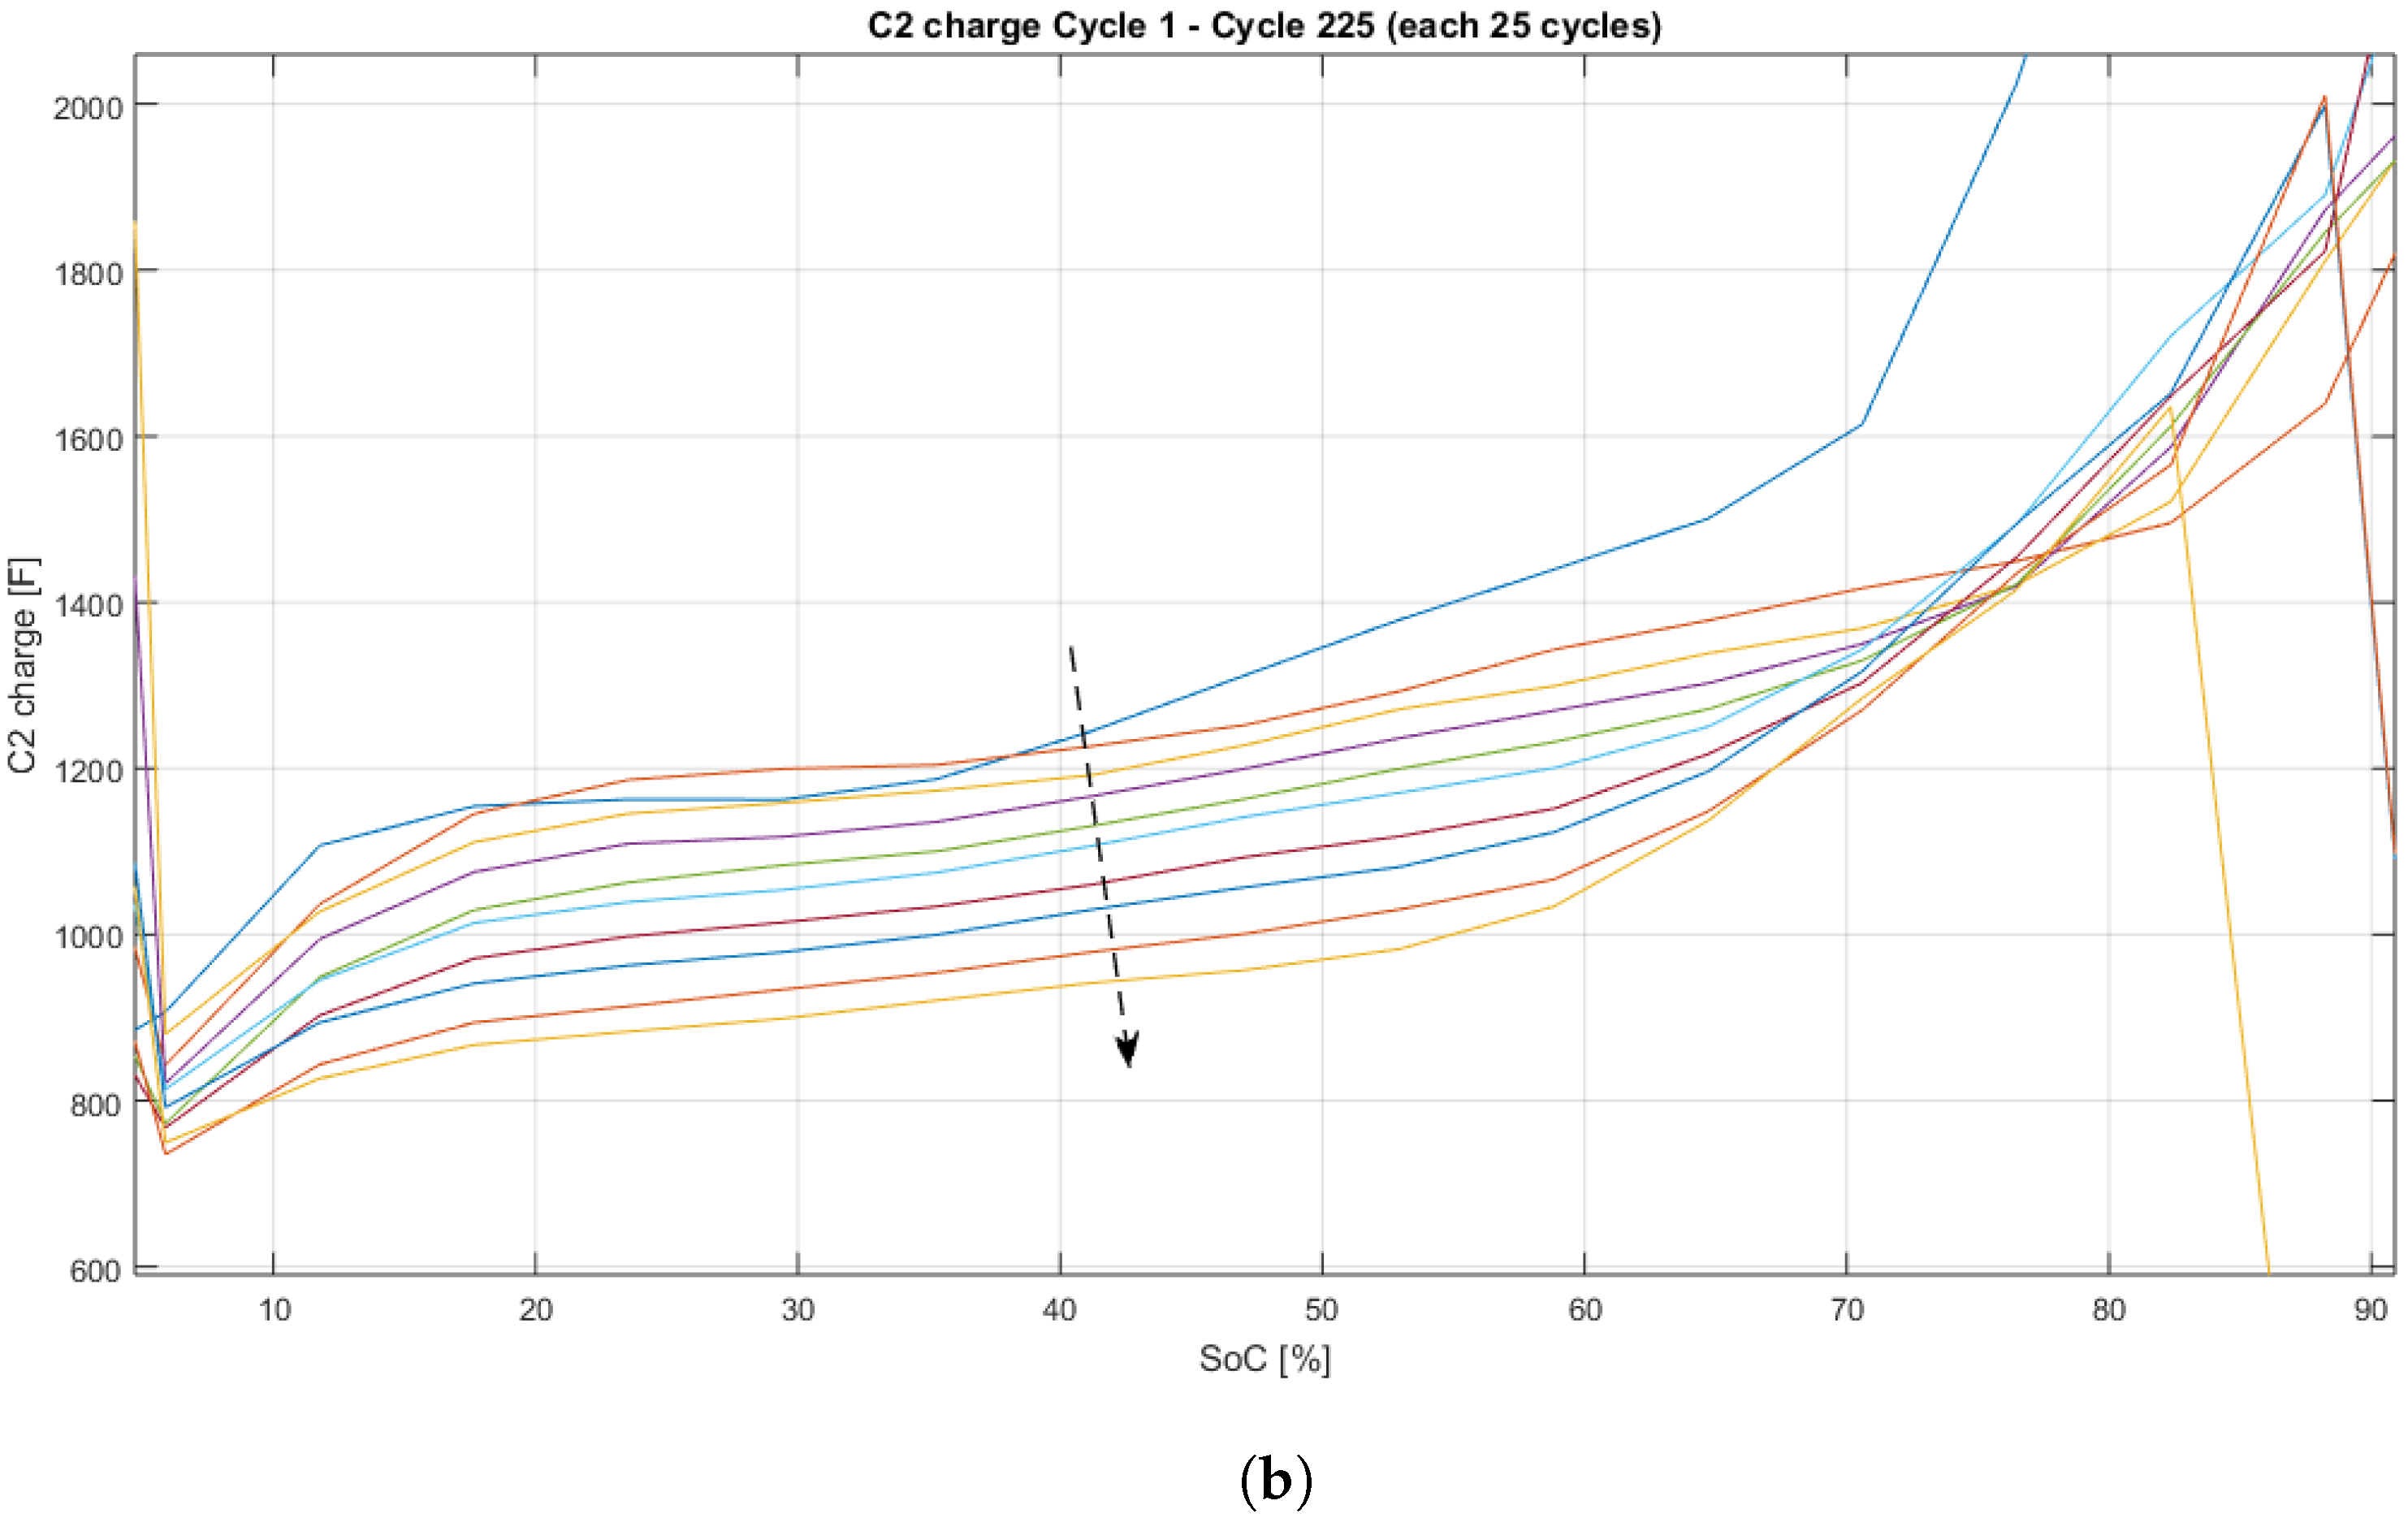
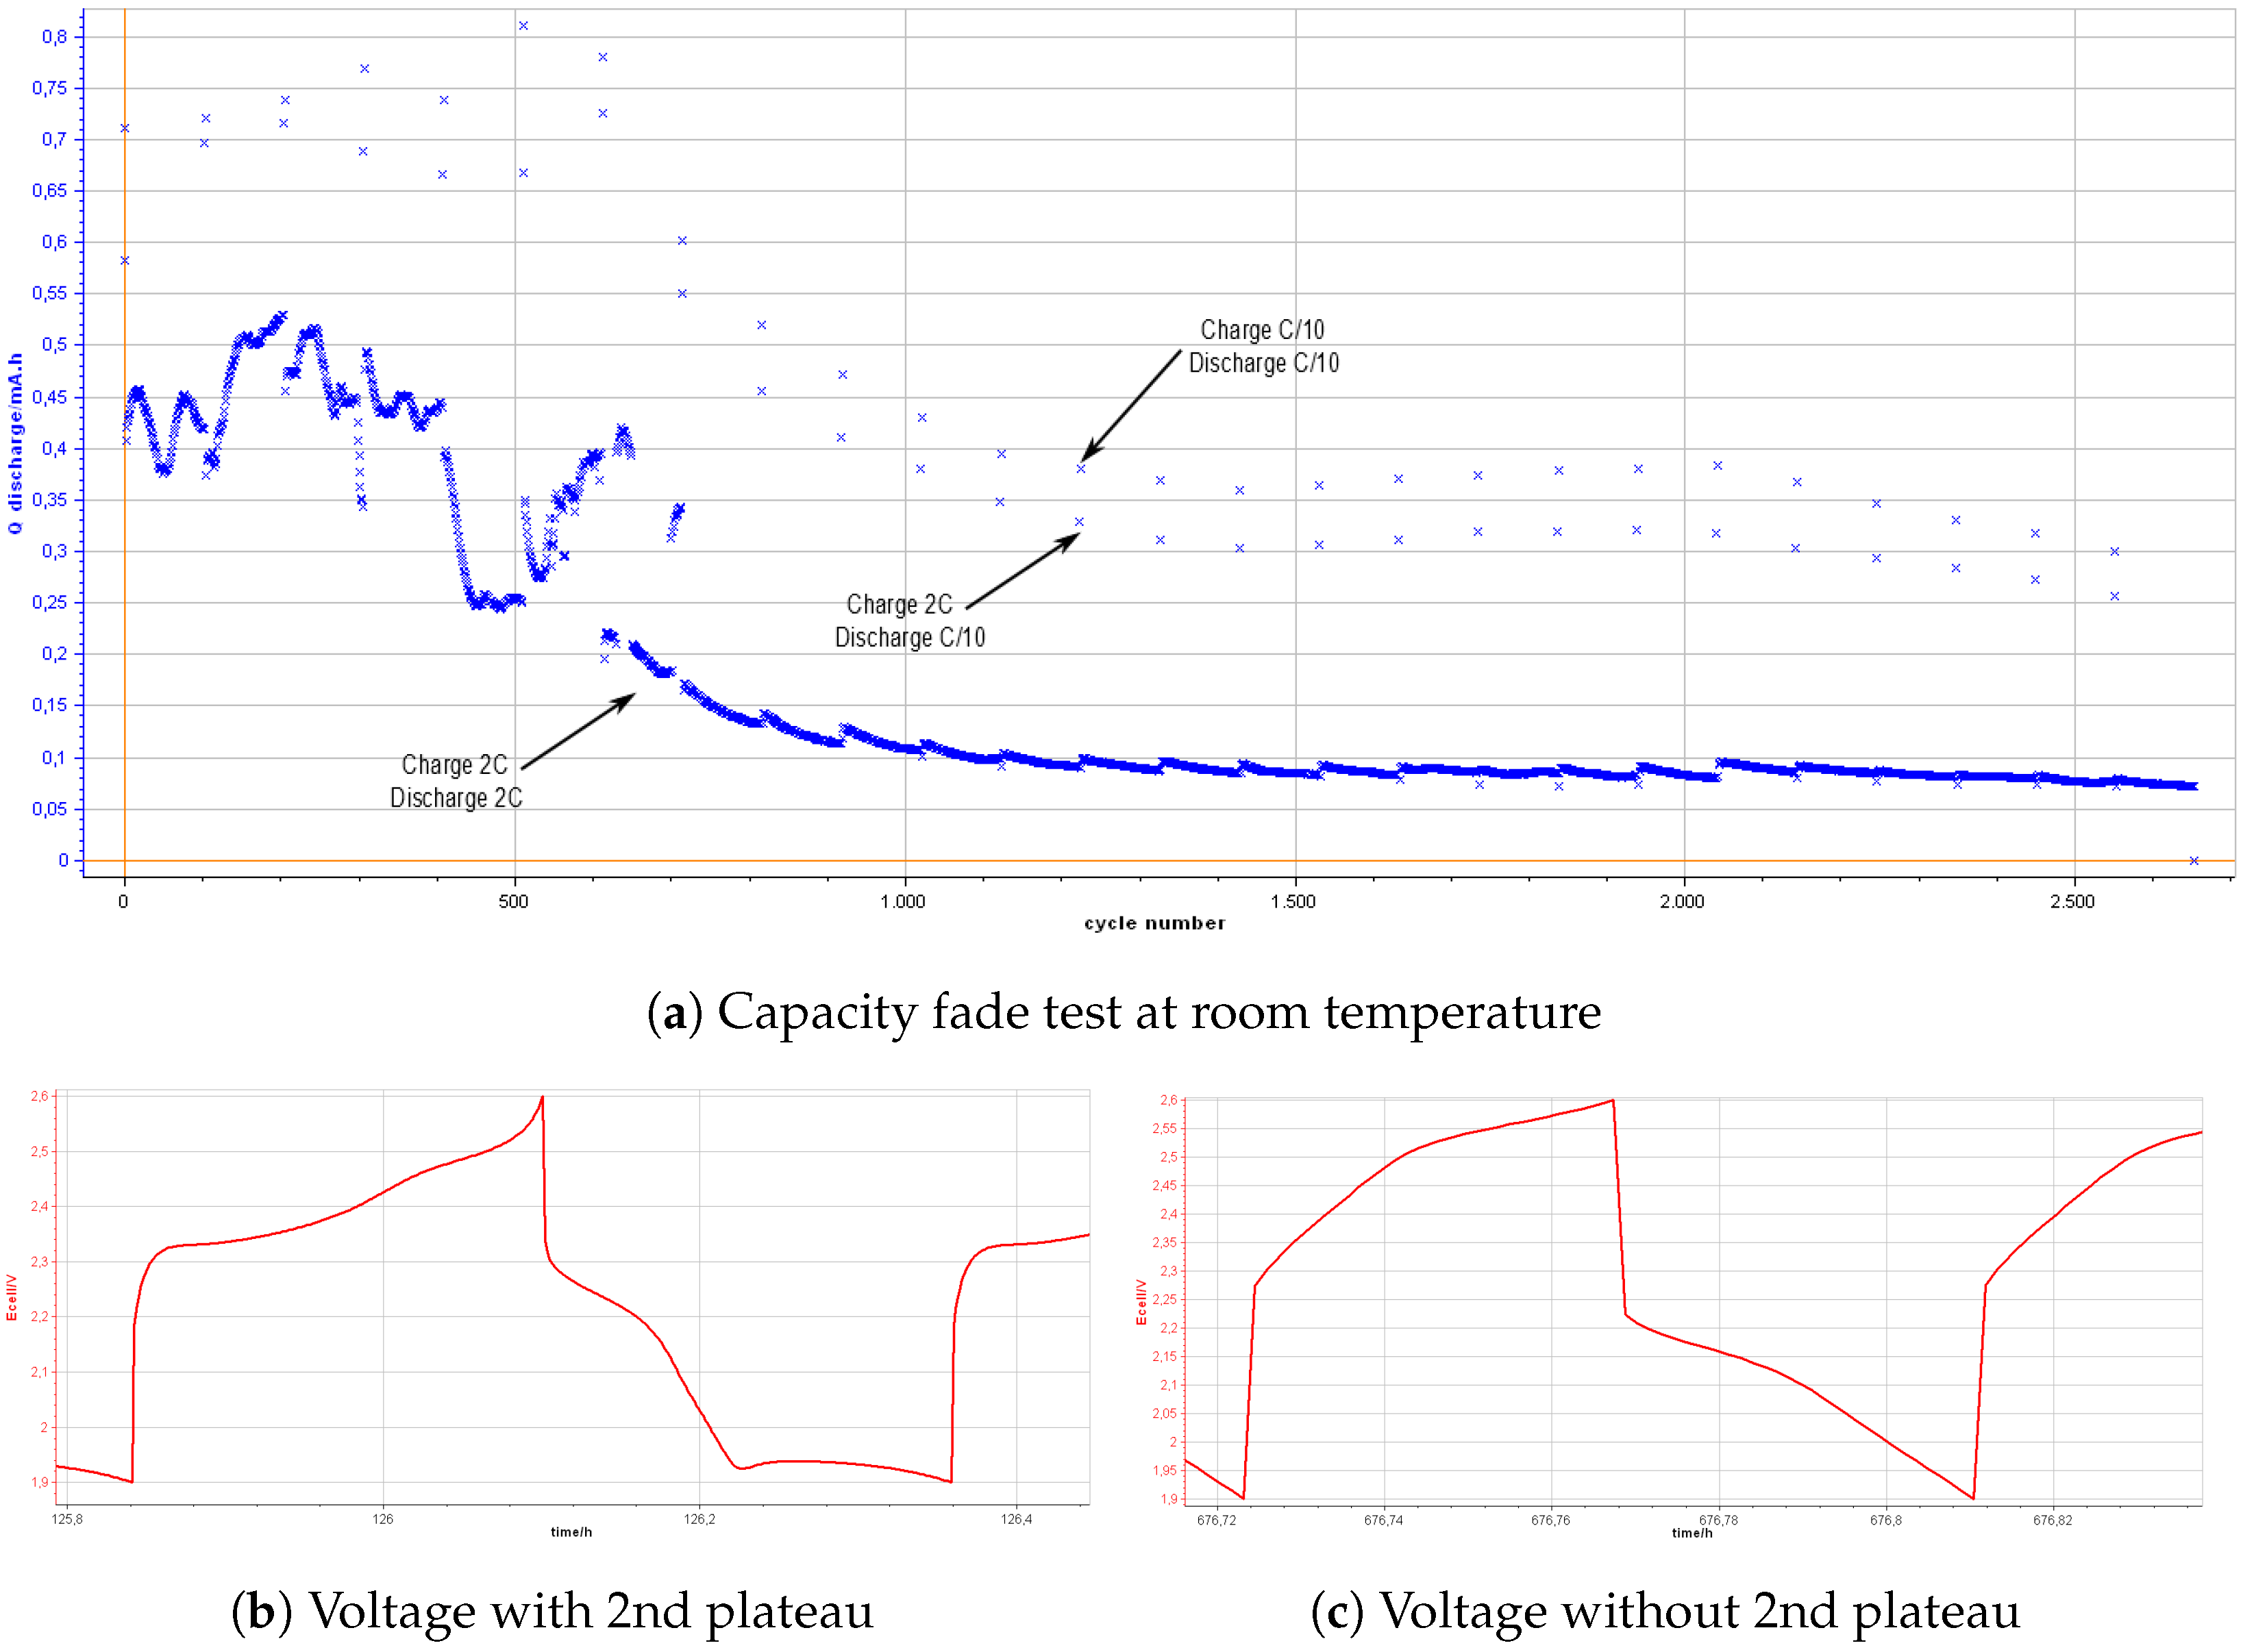
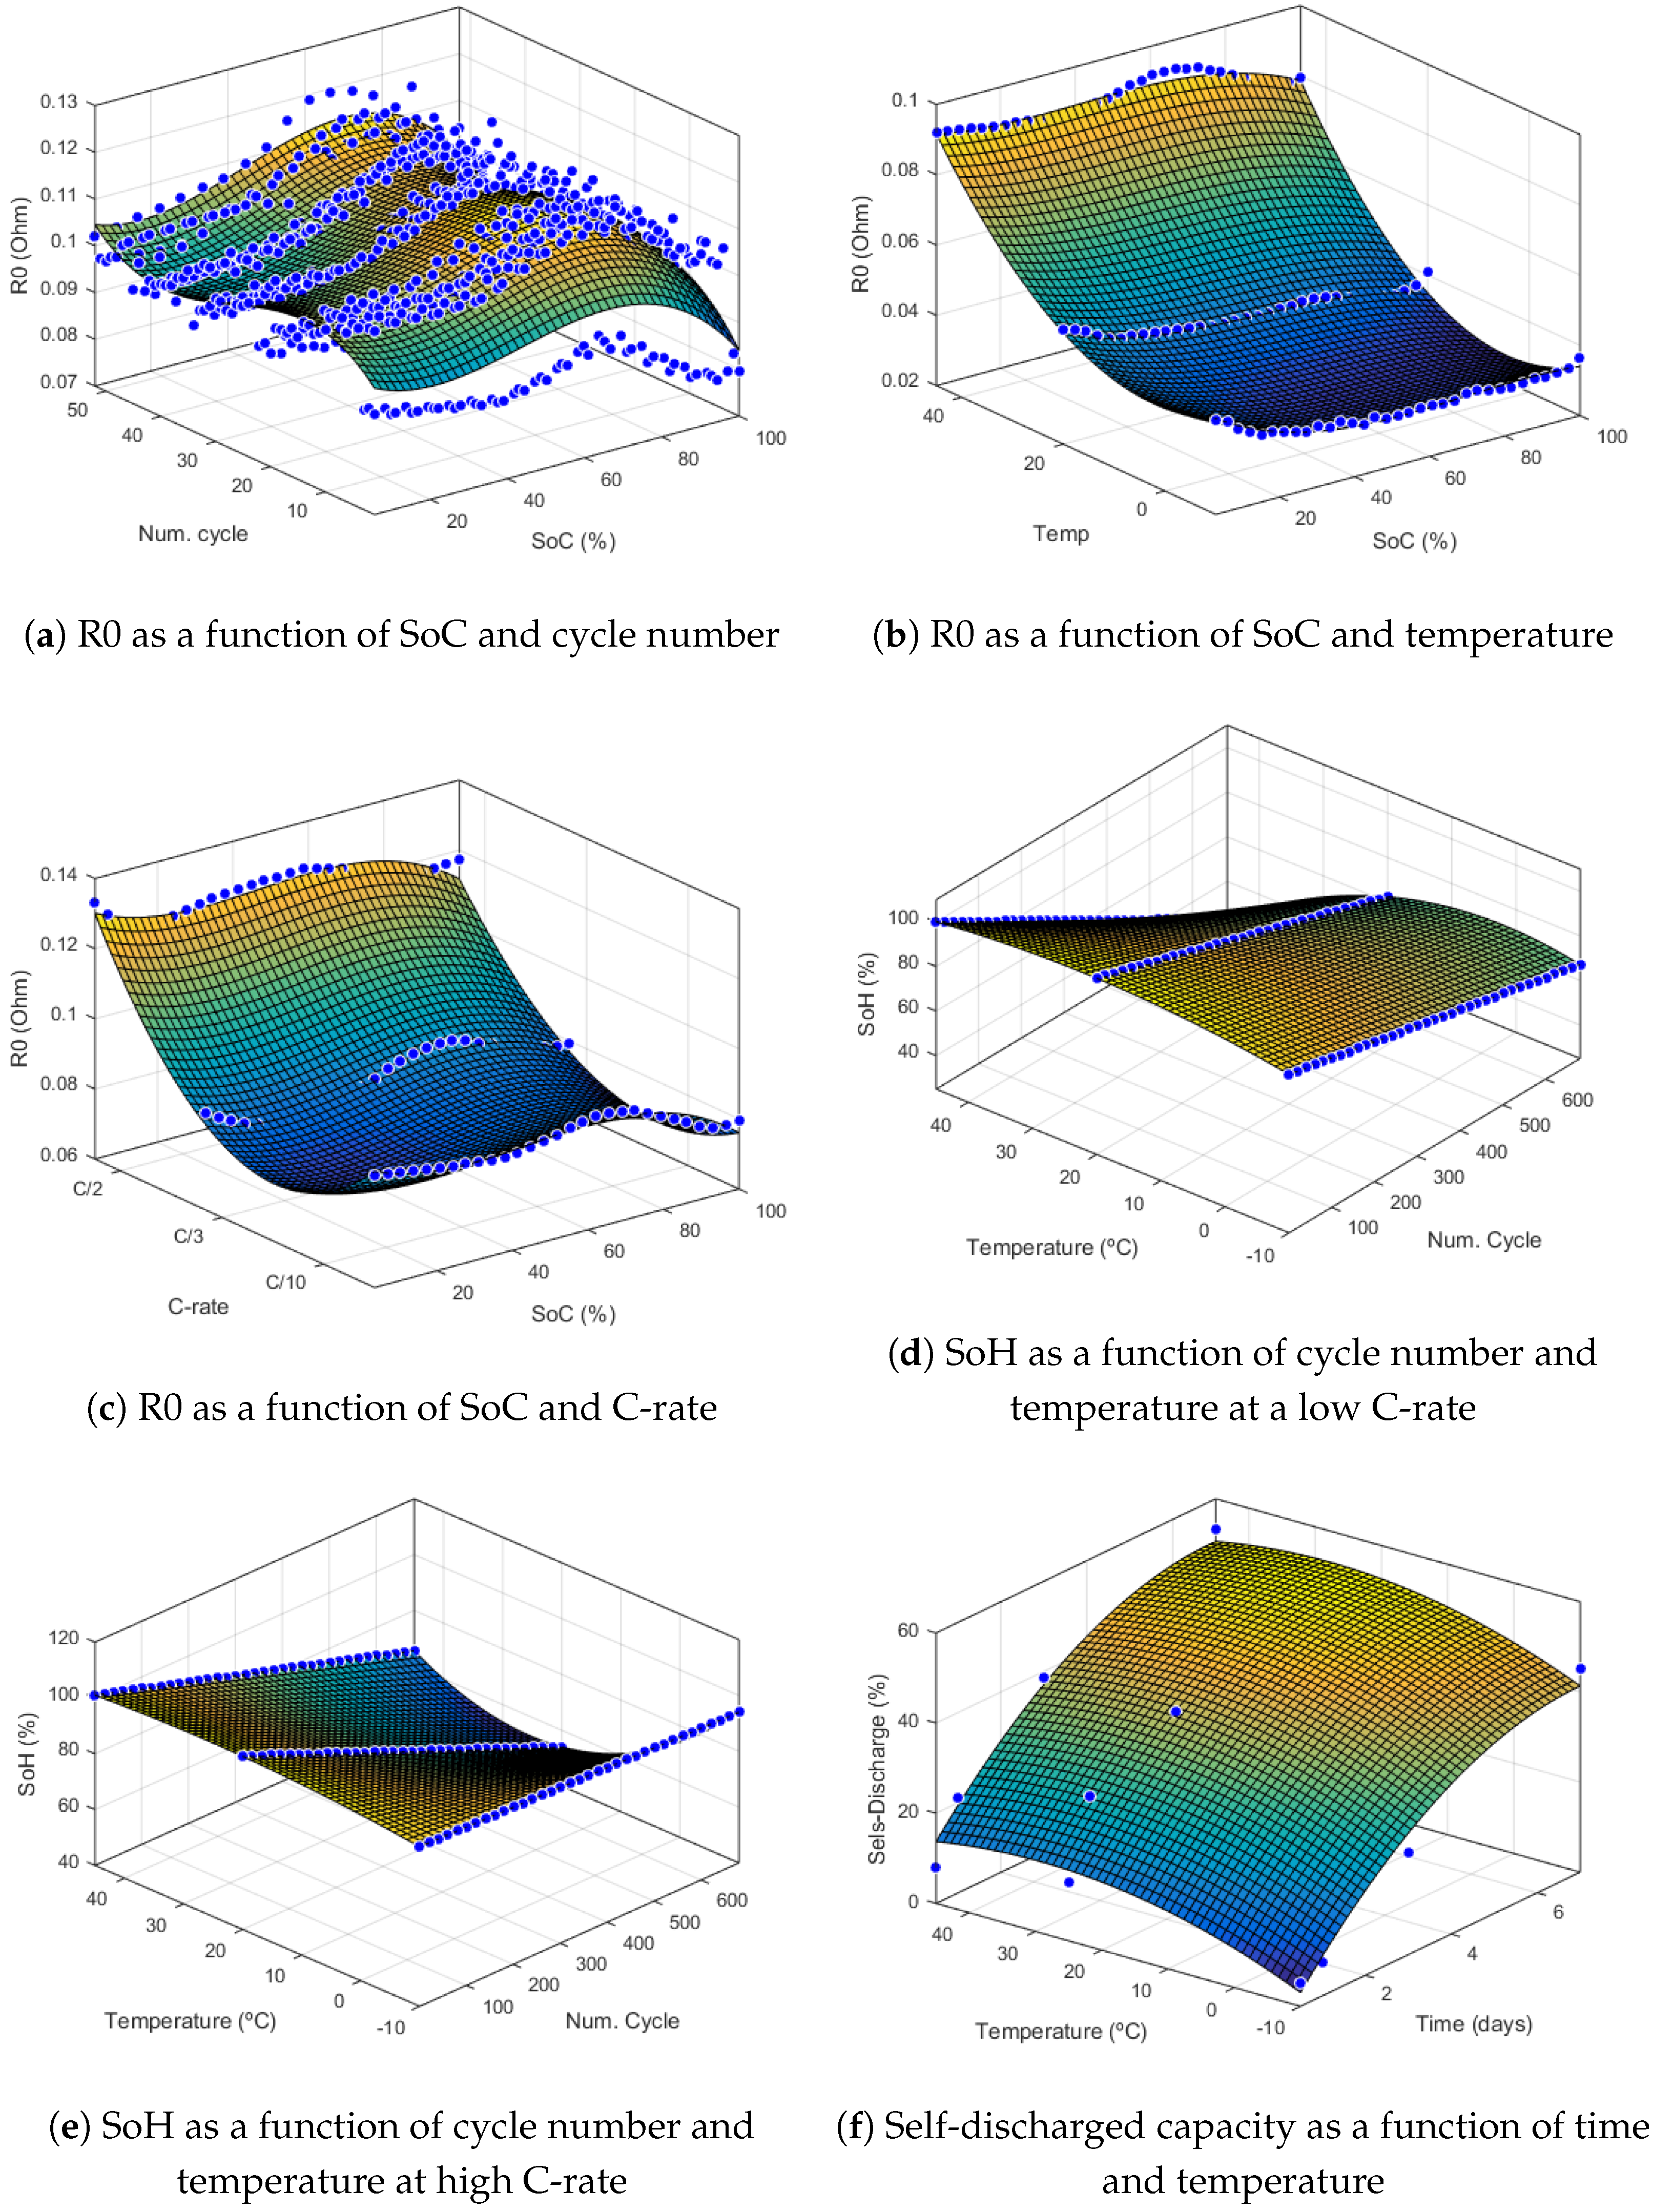
Capacity Fade and Self-Discharge

Low-maturity LiS technology suffers from two main issues that increase the difficulty of a correct SoC estimation, these are a fast capacity fade rate and the high (non-linear) self-discharge ratio. For this reason, two more parameters are necessary to develop a full model: in the first place, the SoH requires a degradation rate or capacity fade parameter and secondly, a self-discharge rate must be computed since self-degradation has a large impact on the efficiency of LiS cells.
The experimental result of the capacity fade is shown in Figure 5a, where the cell has been cycled at 2C for 2500 cycles at Room Temperature (RT). Every 100 cycles, an asymmetric cycle with fast charging (2C) and slow discharging (C/10) is performed. This cycle is followed by a symmetrical cycle at a low C-rate (C/10). Note how, after around 700 cycles of erratic behavior, the cell shows a rather slow degradation rate. This particularity is caused by the fact that the voltage limit is reached before entering the second plateau (as shown in Figure 5) in some cycles, which is mainly due to its internal resistance and the high C-rate forcing a large voltage drop. As the cell degrades, the internal resistance increases to the point where in every cycle, the cut-off voltage is reached before the cell enters the second plateau, and the capacity is reduced by almost half from then on. This phenomenon can be observed in Figure 5a beyond the 700th cycle. Note that this should not occur in all LiS cells and that it was a particularity of this configuration and voltage limits. Nonetheless, it is important to take it into account when preparing them, as this fact entails high inaccuracies and severely increases the difficulty of capacity and SoC estimations.
Self-discharge experiments were repeated at different temperatures and SoC to parametrize its influence. The experimental result of the temperature influence on self-discharge rate is shown in Figure 6. See how the self-discharge ratio at low temperature (−10 °C) is almost constant and presents a close to linear trend between the time passed and the amount of capacity lost. However, at higher temperatures (RT and 45 °C), the self-discharge behavior is non-linear, presenting a higher self-discharge for the first 3 days, but then it tends to soften, reducing its effect notably. It is also interesting to mention that this different behavior (linear/non-linear) occurs equally at SoC 50% and 100%; however, the self-discharge ratio is more intense at higher SoC and high temperatures, mainly due to diffusion effects.
Consequently, the changes in the self-discharge ratio represent a direct impact on the state estimator efficiency and have to be included in the cell model. To model the effect of the self-discharge rate, this effect is measured periodically during an aging experiment. The self-discharge is measured every 50 cycles (at C/2 C-rate) and up to 250 cycles are performed.

4. Resulting SoC Estimation

The application of the methodology described in Section 2 yields a set of surfaces that represent the evolution of each parameter under a set of conditions such as the cycle number, the temperature, and the C-rate (Figure 7). These surfaces can be combined and interpolated to compute intermediate states, and the ECM parameters obtained are then used by the state estimator to calculate the SoC.
The time-based Equation (13) is included in the EKF model as part of the initial estimation of the remaining SoC. The final schematics of the full parameter estimation and the Extended Kalman Filter that computes the SoC and SoH are shown in Figure 8a.
The proposed state estimation structure is validated using experimental data and comparing the resulting SoC estimation to the SoC computed with a coulomb counting algorithm. According to the SoC definition, the Ampere-hour integral method [26,27] integrates the battery charge and discharges current and adds it to the initial SoC value to obtain the SoC value. Typically, this method becomes less reliable over time since the current measured by the sensor may be inaccurate, and the initial SoC cannot be obtained accurately, so there is a cumulative error as the method is used. However, this algorithm does not need to establish a model of the battery, and it is simple and easy to implement. At the cut-off voltages (maximum and minimum), the SoC is known since it is established to be 0% and 100%, respectively, these values are used as a reference to set the coulomb counting approach as a baseline value to perform a comparison with the proposed approach.
The cell used for testing is at 85% SoH and is cycled using a set of current pulses at C/10 with different amplitudes and resting time between charge and discharge cycles, the experimental data is obtained at room temperature. The results obtained are shown in Figure 8 where it is shown that the estimation computed with coulomb counting drifts from the dual EKF estimation due to its simplicity. The experiment is performed fully charging the battery from 0% to 100% and then back to full discharge at 0%, the cut-off voltages are reached when the EKF algorithm is correctly estimating that the operational SoC limits are being approached. A pure coulomb counting strategy does not consider non-linear conditions such as the cell self-discharge ratio, the variability of the internal resistance (that affects the coulombic efficiency), the influence of the temperature, or the degradation level of the cell. Figure 8 shows the results of adding this non-linear behavior to the cell model in combination with the Kalman filter. The maximum error found is located at the phase-change regions between the two plateaux. In this transient region, the behavior of the model differs from the real one and up to 5% error is observed in the SoC estimation until the filter leads to convergence again.

5. Discussion

This study provides a functional state estimation for lithium–sulfur cells where a Dual-Extended Kalman Filter approach is used to compute the battery SoC. The proposed algorithm is able to overcome the highly non-linear behavior of the system and shows a good tracking of the SoC, estimating correctly when the cutoff voltages are reached. A direct model, which contains a function with all the elements that influence the battery behavior (Temperature, C-rate, age, and cycle number), would require a model with excessive complexity to be solved in a reasonable amount of time by the BMS processor. The method would require an excessive bit resolution and a large amount of memory which are undesirable features for a cost-driven industrial computer.
A practical solution is proposed in this study based on breaking the parameter estimation into a piecewise problem where a small part of the calculation is performed each time. This way, the order of the functions is reduced and the solutions are found in a reasonable amount of time. The proposed structure does not require a high performance processor to compute the SoX of the model; however, the computational burden is increased with respect to the basic estimators.
The application of the proposed approach requires an extensive study of the cell to generate all the necessary data to parametrize the effects of temperature, C-rate, aging, and self-discharge, which leads to an expensive and long procedure for BMS development. This is mainly due to the discharge reaction of LiS technology being divided into four stages where different polysulfide reactions are predominant [28]; moreover, the solid/liquid state is different, leading to a strong change in the behavior of the cell model [29]. That problem is especially stressed when the model tries to capture the parameter behavior for a large number of cycles (different degradation levels) and temperatures, as is the case in this study. Nevertheless, the EKF structure is shown to be valid for the LiS cells under study, which are research prototypes. It should be noted that LiS technology is under development and more research is required to reach higher levels of performance and overcome some of the main drawbacks identified and addressed in this work.

6. Conclusions

A complete model of a LiS battery model is proposed with special emphasis on the non-observability issue that affects a large region of the battery operational range. To circumvent this situation, a Dual EKF structure is proposed to compute the SoC estimation in combination with an estimation of the internal cell parameters. The proposed algorithm correctly tracks the SoC of an experimental aged LiS cell from minimum to maximum cutoff voltages, providing an estimation with less than 1% of the error to predict when 0% and 100% SoC are reached.
The methodology described in this work requires a large number of experiments and data to incorporate the effects of capacity fade and self-discharge, which are predominant in current LiS technology. However, the high complexity of the procedure necessary to derive the algorithms increases the cost and development time for BMS devices, which is a drawback for market applications. The addition of the degradation effects on cell performance, the self-discharge ratio, and the influence of C-rate and temperature in the overall dynamics are the main contributors to the model complexity. The resulting dual-EKF is able to predict the SoC without any drift and shows robust behavior during strong transients such as current pulses.

Author Contributions

Conceptualization, L.T.; methodology, L.T. and L.C.C.; software, L.T. and P.P.; validation, L.T. and P.P.; formal analysis, L.T. and L.C.C.; investigation, L.T., P.P. and L.C.C.; resources, L.T. and J.J.; data curation, L.T. and J.J.; writing—original draft preparation, L.T.; writing—review and editing, L.C.C. and J.J.; visualization, L.T. and L.C.C.; supervision, L.T.; project administration, L.T. and J.J.; funding acquisition, L.T. and J.J. All authors have read and agreed to the published version of the manuscript.

Funding

This research was funded by Horizon 2020 Framework Programme grant number 666221.

Conflicts of Interest

The authors declare no conflict of interest.

Abbreviations

The following abbreviations are used in this manuscript:
BMSBattery Management System
EVElectric Vehicle
ECMEquivalent Circuit Model
SoCState of Charge
SoHState of Health
SoXState of X
RULRemaining Useful Life
DoDDepth of Discharge
GITTGalvanostatic Intermittent Titration Technique
EKFExtended Kalman Filter
CPEConstant Phase Element
LiSLithium Sulfur
SDSelf Discharge
CPEConstant Phase Element
RMSERoot Mean Square Error
RTRoom Temperature
OCVOpen Circuit Voltage

References

  1. Benveniste, G.; Rallo, H.; Canals, L.; Merino, A.; Amante, B. Comparison of the state of lithium-sulphur and lithium-ion batteries applied to electromobility. J. Environ. Manag. 2018, 226, 1–12. [Google Scholar] [CrossRef] [PubMed]
  2. Peng, H.J.; Huang, J.Q.; Cheng, X.B.; Zhang, Q. Review on High-Loading and High-Energy Lithium–Sulfur Batteries. Adv. Energy Mater. 2017, 7, 1700260. [Google Scholar] [CrossRef]
  3. Kotak, Y.; Marchante Fernández, C.; Canals Casals, L.; Kotak, B.S.; Koch, D.; Geisbauer, C.; Trilla, L.; Gómez-Núñez, A.; Schweiger, H.-G. End of Electric Vehicle Batteries: Reuse vs. Recycle. Energies 2021, 14, 2217. [Google Scholar] [CrossRef]
  4. Zhang, C.; Biendicho, J.; Zhang, T.; Du, R.; Li, J.; Yang, X.; Arbiol, J.; Zhou, Y.; Morante, J.; Cabot, A. Combined High Catalytic Activity and Efficient Polar Tubular Nanostructure in Urchin-Like Metallic NiCo2Se4 for High-Performance Lithium-Sulfur Batteries. Adv. Funct. Mater. 2019, 29, 1903842. [Google Scholar] [CrossRef]
  5. Varzi, A.; Thanner, K.; Scipioni, R.; Di Lecce, D.; Hassoun, J.; Dörfler, S.; Altheus, H.; Kaskel, S.; Prehal, C.; Freunberger, S. Current status and future perspectives of lithium metal batteries. J. Power Sources 2020, 480, 228803. [Google Scholar] [CrossRef]
  6. Zhu, K.; Wang, C.; Chi, Z.; Ke, F.; Yang, Y.; Wang, A.; Wang, W.; Miao, L. How Far Away Are Lithium-Sulfur Batteries from Commercialization? Front. Energy Res. 2019, 7, 123. [Google Scholar] [CrossRef]
  7. Alise Project. Project Website. 2020. Available online: gvi.eu/project-highlight/alise-project/ (accessed on 1 September 2020).
  8. Narayanaswamy, S. Design, Modeling and Implementation of Distributed Architectures for Modular Battery Packs. Ph.D. Thesis, Technische Universität München, Munich, Germany, 2019. [Google Scholar]
  9. Woody, M.; Arbabzadeh, M.; Lewis, G.M.; Keoleian, G.A.; Stefanopoulou, A. Strategies to limit degradation and maximize Li-ion battery service lifetime—Critical review and guidance for stakeholders. J. Energy Storage 2020, 28, 101231. [Google Scholar] [CrossRef]
  10. Balagopal, B.; Huang, C.S.; Chow, M. Effect of calendar aging on li-ion battery degradation and SoH. In Proceedings of the IECON 2017—43rd Annual Conference of the IEEE Industrial Electronics Society, Beijing, China, 29 October–1 November 2017; pp. 7647–7652. [Google Scholar]
  11. Liu, K.; Ashwin, T.R.; Hu, X.; Lucu, M.; Widanage, W.D. An evaluation study of different modelling techniques for calendar ageing prediction of lithium-ion batteries. Renew. Sustain. Energy Rev. 2020, 131, 110017. [Google Scholar] [CrossRef]
  12. Wolff, D.; Canals Casals, L.; Benveniste, G.; Corchero, C.; Trilla, L. The Effects of Lithium Sulfur Battery Ageing on Second-Life Possibilities and Environmental Life Cycle Assessment Studies. Energies 2019, 12, 2440. [Google Scholar] [CrossRef]
  13. Casals, L.C.; González, A.M.S.; García, B.A.; Llorca, J. PHEV Battery Aging Study Using Voltage Recovery and Internal Resistance from Onboard Data. IEEE Trans. Veh. Technol. 2016, 65, 4209–4216. [Google Scholar] [CrossRef] [Green Version]
  14. Fotouhi, A.; Auger, D.J.; Propp, K.; Longo, S. Electric vehicle battery parameter identification and SOC observability analysis: NiMH and Li-S case studies. In Proceedings of the 8th IET International Conference on Power Electronics, Machines and Drives (PEMD), Glasgow, UK, 19–21 April 2016; pp. 1–6. [Google Scholar]
  15. Fotouhi, A.; Auger, D.J.; O’Neill, L.; Cleaver, T.; Walus, S. Lithium-Sulfur Battery Technology Readiness and Applications—A Review. Energies 2017, 10, 1937. [Google Scholar] [CrossRef]
  16. Propp, K.; Auger, D.J.; Fotouhi, A.; Longo, S.; Knap, V. Auger and Abbas Fotouhi and Stefano Longo and Vaclav Knap. Kalman-variant estimators for state of charge in lithium-sulfur batteries. J. Power Sources 2017, 343, 254–267. [Google Scholar] [CrossRef]
  17. Fotouhi, A.; Auger, D.J.; Propp, K.; Longo, S. Lithium–Sulfur Battery State-of-Charge Observability Analysis and Estimation. IEEE Trans. Power Electron. 2018, 33, 5847–5859. [Google Scholar] [CrossRef]
  18. Dörfler, S.; Walus, S.; Locke, J.; Fotouhi, A.; Auger, D.J.; Shateri, N.; Abendroth, T.; Härtel, P.; Althues, H.; Kaskel, S. Recent Progress and Emerging Application Areas for Lithium–Sulfur Battery Technology. Energy Technol. 2021, 9, 2000694. [Google Scholar] [CrossRef] [PubMed]
  19. Knap, V.; Stroe, D.; Teodorescu, R.; Swierczynski, M.; Stanciu, T. Electrical circuit models for performance modeling of Lithium-Sulfur batteries. In Proceedings of the IEEE Energy Conversion Congress and Exposition (ECCE), Montreal, QC, Canada, 20–24 September 2015; pp. 1375–1381. [Google Scholar]
  20. da Silva, C.T.; Dias, B.M.d.A.; Araújo, R.E.; Pellini, E.L.; Laganá, A.A.M. Battery Model Identification Approach for Electric Forklift Application. Energies 2021, 4, 6221. [Google Scholar] [CrossRef]
  21. Plett, G.L. Sigma-point Kalman filtering for battery management systems of LiPB-based HEV battery packs: Part 1: Introduction and state estimation. J. Power Sources 2006, 161, 1356–1368. [Google Scholar] [CrossRef]
  22. Rahimi-Eichi, H.; Baronti, F.; MChow, M. Online Adaptive Parameter Identification and State-of-Charge Coestimation for Lithium-Polymer Battery Cells. IEEE Trans. Ind. Electron. 2014, 61, 2053–2061. [Google Scholar] [CrossRef]
  23. Fridholm, B.; Nilsson, M.; Wik, T. Robustness Comparison of Battery State of Charge Observers for Automotive Applications. IFAC Proc. 2014, 47, 2138–2146. [Google Scholar] [CrossRef]
  24. Azis, N.A.; Joelianto, E.; Widyotriatmo, A. State of Charge (SoC) and State of Health (SoH) Estimation of Lithium-Ion Battery Using Dual Extended Kalman Filter Based on Polynomial Battery Model. In Proceedings of the 6th International Conference on Instrumentation, Control, and Automation (ICA), Bandung, Indonesia, 31 July–2 August 2019; pp. 88–93. [Google Scholar]
  25. Lee, S.J.; Kim, J.H.; Lee, J.M.; Cho, B.H. The State and Parameter Estimation of an Li-Ion Battery Using a New OCV-SOC Concept. In Proceedings of the IEEE Power Electronics Specialists Conference, Orlando, FL, USA, 17–21 June 2007; pp. 2799–2803. [Google Scholar]
  26. Yang, N.; Zhang, X.; Li, G. State of charge estimation for pulse discharge of a LiFePO4 battery by a revised Ah counting. Electrochim. Acta 2015, 151, 63–71. [Google Scholar] [CrossRef]
  27. Aylor, J.H.; Thieme, A.; Johnson, B.W. A battery state-of-charge indicator for electric wheelchairs. IEEE Trans. Ind. Electron. 1992, 39, 398–409. [Google Scholar] [CrossRef]
  28. Knap, V.; Stroe, D.; Teodorescu, R.; Swierczynski, M.; Stanciu, T. Comparison of parametrization techniques for an electrical circuit model of Lithium-Sulfur batteries. In Proceedings of the IEEE 13th International Conference on Industrial Informatics (INDIN), Cambridge, UK, 22–24 July 2015; pp. 1278–1283. [Google Scholar]
  29. Conder, J.; Bouchet, R.; Trabesinger, S.; Marino, C.; Gubler, L.; Villevieille, C. Direct observation of lithium polysulfides in lithium-sulfur batteries using operando X-ray diffraction. Nat. Energy 2017, 2, 17069. [Google Scholar] [CrossRef]
Figure 1. ECM with 2 RC branches.
Energies 15 06989 g001
Figure 2. (a) LiS battery discharge voltage profile and (b) structure of Dual EKF.
Energies 15 06989 g002
Figure 3. Pulse-based GITT methodology applied to the LiS battery for model parametrization during charge and discharge cycles. (a) GITT method applied to LiS battery. (b) GITT-based parametrization analysis. (c) GITT method applied during charge. (d) GITT method applied during discharge.
Energies 15 06989 g003aEnergies 15 06989 g003b
Figure 4. Parametric evolution of (a) R 0 during discharge and (b) C 2 during charge. Each colored line show results after every 25 cycles.
Energies 15 06989 g004aEnergies 15 06989 g004b
Figure 5. (a) Capacity fade. Detail of the voltage profile (b) with 2nd plateau and (c) without 2nd plateau.
Energies 15 06989 g005
Figure 6. Self-discharge evolution at (a) 50% SoC and (b) 100% SoC.
Energies 15 06989 g006
Figure 7. Surface representing the R0-parameter as a function of (a) SoC and cycle number, (b) SoC and temperature, (c) SoC and C-rate, the blue dots are the real values and the surface the estimation obtained. SoH as a function of cycle number and temperature at (d) low C-rate and (e) high C-rate, the blue dots correspond to the linearized values, (f) percentage of self discharged capacity as a function of time and temperature.
Energies 15 06989 g007
Figure 8. (a) Schematic of the SoC estimation structure. SoC estimation test with (b) current pulse profile applied (C/10) in a full cycle from minimum to maximum cell voltage (0% to 100% SoC) and (c) Coulomb counting reference SoC value compared to Dual EKF SoC estimation.
Energies 15 06989 g008
Table 1. GITT experimental conditions.
Cell No123456789
C-rateC/10C/10C/10C/2C/2C/22C2C2C
Temperature−10 °CRT45°C−10 °CRT45°C−10 °CRT45 °C
Publisher’s Note: MDPI stays neutral with regard to jurisdictional claims in published maps and institutional affiliations.

