Abstract
High-voltage fuses are found in most electrical installations, where they are used for overcurrent protection and are the pieces of equipment providing the highest degree of protection for the lowest initial cost. This article focuses on the behavior of high-voltage fuses containing a fuse element entirely made of aluminum. We made high-power linear electrical circuits for experiments on these fuses under the most severe operating conditions. The article presents the construction details of the fuse element and its features, as well as various arc extinguishing media. The heating behavior and time–current characteristics were studied in comparison with fuses made of copper. We obtained the maximum instantaneous value of the current reached during interruption for a 24 kV, 50 kA, 50 A fuse, as well as the value of the minimum breaking current.
1. Introduction
The fuse is the oldest overcurrent protection device and is used today in many applications due to its high reliability, mainly for voltages ranging from 12 kV to 66 kV. The standards for the applications in which they are used are constantly being improved but the basic parts have not been modified for more than 60 years. The major changes in electrical systems are related to higher power concentration, higher short-circuit power and the limitation of the space used. Thus, modern fuses operate close to the maximum technical limits for which they were designed. As fuse requirements increase, safety limits decrease, with consequences arising from the slightest error of choice on the part of the user, often with violent consequences.
As it is connected within the circuit in series with the protected equipment, the fuse detects and isolates the damaged equipment from the rest of the circuit. The fuse, in its simplest form, consists of a metal wire connected between two supports placed on a suitable bracket. Modern fuses are embedded in a ceramic envelope and the fuse wires are installed inside on an insulating support; the fuse is also fitted with a signaling assembly which also acts as an actuator for other electrical equipment, called a striker. The ceramic envelope is filled under controlled conditions with an exothermic material capable of extinguishing an electric arc, the most commonly used being quartz sand. Metal components, other than the fusible element, may be made of copper, iron or brass, may be silver-plated or nickel-plated and must be capable of operating under any thermal, mechanical or electrical conditions that may arise in operation [1].
A fuse can operate under normal operating conditions with the same electrical performance, withstanding load currents and surcharge, for up to 20 years [2]. The fuse must be capable of interrupting the circuit when subjected to overcurrent, and this process is achieved by melting the fuse wire. This process is followed by the electric arc phenomenon with a high energy release, which is directly proportional to the characteristics and parameters of the circuit. Successful interruption of the fault means that the arc develops and is extinguished inside the fuse, a term which is known as the breaking capacity of the fuse.
Previous work in the field presented a fuse element heating model and a numerical method, including the solid–liquid–vapor transition phase, in order to assess the pre-arcing time of high-breaking-capacity fuses [3]. The mathematic model is based on the formulation of the enthalpy of the heating equation, representing the Joule effect correlated with the Laplace equation.
The pre-arcing period is the first step to be studied in the fuse-breaking operation and affects the phenomena that follow it. Experiments were performed for short (<10 ms) and medium (>10 ms) arcing times by varying the making angle of the short-circuit current in the range 0°–160° and two values of the power factor (cos φ ~ 0.9 and cos φ ~ 0.1). Values of arcing and pre-arcing times were obtained experimentally for tprearc/tarc < 1 to 4.2 and disseminated in terms of energy, taking into account the source inductance. Arcing and pre-arcing influences were analyzed using Joule integral, including energy dissipation in the fuse [4].
An experimental study was performed on high-breaking-capacity fuses with an aluminum fuse element, with and without the eutectic point, for minimum-rated breaking current, preceded by an experiment for maximum-rated breaking current. It is thus shown that the fuse with the aluminum fuse element has no problems when breaking the maximum nominal breaking current, but real difficulties occur when breaking the minimum nominal breaking current. Experiments were performed on a homogeneous 6–20 A series with focus on the 36 kV, 25 kA, 16 A fuse, which underwent multiple changes in terms of construction and tests with and without the eutectic point. An acceptable construction solution was found and passed the tests, but the value obtained for the minimum-rated breaking current is not a commercially attractive value [5].
In another paper [6], are presented the results of a study of heating a low-voltage high-power fuse. The experimental tests were performed with a specially developed experimental setup. K-type thermocouples were used for temperature measurement. The numerical study was conducted using a computer model of the fuse based on COMSOL software. The model also takes into account the heat transfer from the surface of the fuse to the environment by radiation and convection and the heat flow propagated by the fuse current paths to the connecting conductors. A comparison was made between numerical and experimental results. Numerous 2D and 3D models were developed to study the thermal processes in these devices. In [7], is presented a 2D model used to study the influence of harmonics on losses in high-power fuses, using ANSYS software. A 3D model of a high-power fuse is developed in [7], studying the influence of ambient temperature and electric current on the distribution of the thermal field of the fuse. In [8], is described a fuse model for domestic applications using ANSYS software.
During fuse operation, inside the quartz sand-filled ceramic envelope, the fuse element is the first to begin to melt and vaporize and arcing occurs. During the vaporization of the fuse element, the volume can be considered as fixed, so that the pressure increase reaches values higher than the atmospheric pressure. Thus, in [9] two pressures are considered, 1 atm and 10 atm. The electric field inside the plasma can reach high values because the gap between the cathode surface and the anode surface varies with time. Different electric fields have been considered: 102 V/m, 103 V/m, 5 × 10³ V/m, 104 V/m to atmospheric pressure and 105 V/m to 10 atm. The study conducted in [9] is carried out for the temperature range 2400 K–10,000 K. For the study of the plasma created inside the fuse, some characteristics were first determined to justify the classical hypotheses of the physics of the thermal behavior of plasma: plasma frequency, plasma ideality, Debye–Huckel approximation. Considering the high electron mobility, the electrical conductivities were also evaluated.
In the paper [10], are presented several methods of measuring arc current and voltage using analog/digital converters, and we study the observed phenomena. The multiple arcs and the short period of the arc-induced voltage drop have been explained. Moreover, the adiabatic hypothesis usually applied in modeling is considered in [11]. The influence of a pre-arcing step on the arcing step is analyzed using Joule integral. The energy released in the fuse and the fulgurite mass and length are also analyzed in the paper.
Manufacturers of high-breaking-capacity fuses need more accurate models of fuse behavior during the arcing period when the main electric circuit is interrupted. New models will be obtained if the understanding of arcing phenomena in fuses improves. Therefore, in [12] are performed some experimental tests such as calorimetry, fuse fulgurite analysis, electron spectroscopy for the chemical analysis and determination of the generated gas. The conclusions were that no chemical change occurs during the arc in the fuse.
A methodology that describes the thermal process in high-voltage current-limiting fuses for currents up to a nominal value is presented in [13]. This solves the transient heating aspects of the fuse until the values of the power dissipation and those of the heat transfer coefficient are reached, under steady-state conditions.
The difficulties of designing and constructing a fuse of high-breaking capacity of low-rated current are described in [14]. The fuse element has such small dimensions that its mechanical fragility is very high. Even during the process of filling the fuse with quartz or sand, this fuse may be damaged. A model of fuse-on-substrate technology is shown. The technique of printing on a flexible substrate and the use of a new ink with conductive properties allowed the production of fuses with good precision dimensions. Lithography-based fuses can find an excellent field of application in the protection of small semiconductors. Several fuse samples were manufactured on three different flexible substrate materials, with rated currents from 0.1 to 1 A. The temperature-rise and rated-current tests are not a problem, due to the low-current values; however, the rated-current and temperature-rise test is not a challenge due to the low-current values. However, the main concerns of producers are related to prolonged overload cyclic behavior and high current-interrupting performance. Further research is needed, in particular on the dimensional accuracy of the fusible material and on the behavior of the substrate material under arcing conditions.
Understanding the thermal behavior of fuses is important for design optimization and for selection of the correct fuse rating for each application. A fuse model based on the Thermal Network Methodology, including terminals, electrical connections and fuse envelopes, was developed in [15]. In this case, the thermal behavior of a high-breaking capacity fuse depends only on the design of the melting element, material parameters and environmental conditions. The estimation of the pre-arcing time for fuses used in industrial protection circuits in case of high fault currents is described in [16]. An enthalpy method for solving the heat-transfer equation with two phase changes was described. The mathematical model combines the thermal and electrical equations based on the principle of energy conservation and Ohm’s law, respectively.
The standardized fuse classes are listed in [17] based on the technical rules in IEC 60282. The mistake in selecting the right class is the most common error and may result in a failure of the protected equipment and even a severe fuse blow-up. Common cases of wrong selection are discussed, highlighting the problems and risks resulting from this wrong selection. Thus, a thorough knowledge of the methodology of using high-breaking-capacity fuses is necessary to avoid selection errors. The distribution of temperature in the fuse under normal operating conditions was studied in [18] and large-scale experiments were also performed with different types of fusible elements for different values of thermal stress. The influence of the rise in the temperature of the medium inside a ceramic envelope due to Joule losses on the rated fuse current is studied in [19], in connection with the current carrying capacity of overhead conductors. The increase of temperature in the ceramic envelope was estimated according to IEC 60890, taking into account the heating due to solar irradiation in switchboards installed outdoors.
This article is a continuation of the one presented in [5], in which the problem regarding the breaking capacity of the minimum current I3 was addressed, while in the current article the study is extended to all series of currents related to the various types of severity encountered during operation. Thus, in this work we are interested to compare high-voltage current-limiting fuses that contain a fusible element of aluminum with the ones existing on the market with a copper fusible element. To show real-world performance and challenges of this type of fuses, linear high-power circuits were designed to simulate the most severe conditions that these fuses can meet in service. Additionally, filler material and the shape of the fusible element were studied. Real high-power experiments were performed, because simulations cannot show the behavior of the fuses and the phenomena that take place inside. Furthermore, international standards such as IEC 60282-2 require real-life testing. The rest of this paper is organized as follows: Section 2 presents the linear test circuits designed for these experiments to simulate the most severe conditions fuses can meet in service. Section 3 discusses the main construction elements: filling material and the fuse elements. The experiments on fuses with an aluminum fuse element are presented in Section 4 for the purpose of illustration and validation. Our conclusions are drawn in Section 5.
2. Linear Test Circuits for High-Voltage Current-Limiting Fuses
The testing of fuses is carried out in accordance with international standards that take into account the actual operating conditions of the circuits protected by them. Even if the high-voltage fuses operate in three-phase networks, the test circuits are single-phase and they reproduce the stress conditions of the first pole that interrupts the current between the three phases of a three-phase circuit [20,21,22,23,24,25,26,27,28,29,30].
The breaking capacity of fuses is tested in three sequences: short-circuit current I1, maximum-energy current I2 and minimum breaking current I3. These sequences are characterized by circuit parameters: voltage, current, cos φ, first pole-to-clear factor that depends on the network neutral grounding, transient recovery voltage that is in turn characterized by: oscillation factor, rise time and rise rate. All these parameters are determined by the circuit elements R, L and C and they have values found in the circuit protected by the high-voltage fuse.
The first two sequences, I1 and I2, are purely inductive short-circuit sequences (cos φ ≤ 0.1) characterized by high currents and “hard” transient recovery voltages with high values of Uc (high oscillation factor) and short rise times, which makes current interruption difficult. The I3 sequence sets the minimum breaking current (3–8)In with cos φ = 0.4–0.6 and is an important stake for fuse manufacturers and an equally important goal for users.
In the first two sequences, the test voltage is , where k = 1.3 in the circuit with grounded neutral and 1.5 in the circuit with isolated neutral; Un is the nominal voltage and represents the stress condition of the first current-breaking phase in a three-phase circuit. In the sequences I1 and I2, the test circuit diagram shown in Figure 1 represents, by means of concentrated circuit elements, the real operating conditions of the fuses but at the upper limit of difficulty.
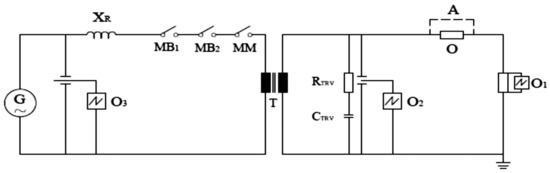
Figure 1.
Test circuit for test series I1 and I2.
Considering that the fuses have a high-breaking capacity (on the order of tens of kA), the power supply G of the test circuit must have a high power (> 1000 MVA), as well as the step-up transformer, whose magnetic circuit is specially designed to reduce the capacitances both on the primary side and the secondary side, and the current regulating coils (XR) must be air coils (linear). For the switching devices used in the linear circuit (MB1, MB2 and MM) the closing and opening times must be short and extremely precise (dispersion of max. 100 μs). No reactance susceptible to saturation is used and the circuit frequency used in the experiments is between 48 and 52 Hz.
In the circuit used in the experiments for the series of tests I1 and I2, in addition to the circuit elements that supply the current, voltage and power factor values, the RTRV (resistor) and CTRV (capacitor bank) elements that determine the parameters of the transient recovery voltage (frequency, amplitude and rise rate) are very important. After arcing in the fuse element (interaction of the fuse with the network), the TRV parameters are critical in the arc extinguishing process as they can reach dangerous values: frequencies > 10 kHz and amplitudes of kV (Un = rated voltage).
Therefore, prior to the experiments, f and Uc are modeled and we assume their values as allowed by the standard: f = 1/2t3 ~ 10–20 kHz.
It is also known that the interruption of the current by the fuse also depends a lot on the making angle of short-circuit current (between 0 and 90 electrical degrees). The energy developed in the arc column, which is also crucial in the current-interrupting process, depends on the making angle of the short-circuit current.
In the experiments performed to determine the minimum breaking current I3, in addition to the considerations for I1 and I2, there is the difficulty of obtaining a very low minimum breaking current I3, which involves a long ignition time (pre-arcing) in the order of tens of minutes. Due to the long pre-arcing times, sometimes it is impossible to perform tests in a direct circuit, similar to that for I1 and I2, therefore a synthetic circuit was created, consisting of two circuits: a low-voltage circuit and a high-voltage circuit (Figure 2).
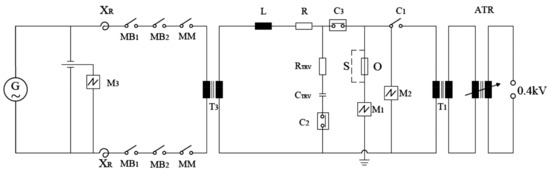
Figure 2.
Test circuit for test series I3.
The high-voltage circuit consisting of G, MB, MM, L, R and T3 capable of supplying the test current for rated voltage, but with a limited time, and the low-voltage circuit consisting of T1, ATR and circuit breaker C1, which supplies the test current for an unlimited time, at low voltage.
The S device detects the starting of fuse melting and switches between the two circuits. The operation of the diagram is as follows: the two circuits are sized for the nominal test parameters and, at first, the low-voltage circuit is connected and it maintains the steady current through the fuse for up to 60 min according to the time–current characteristic of the fuse. At the moment of arc initiation (fuse melting), the S device switches the two circuits by opening circuit breaker C1, closing circuit breaker C3 and ensuring the current interruption under the action of its rated voltage. It was made using a minimum-current comparator circuit with two inputs: input 1 with 0–10 V reference signal and 0–300 A prescribed current setting, and input 2 with 0–300 A test circuit current measurement. The test current measurement is performed with a 300 A/1A M1− current transformer and a 0–10 A → 0–10 Vd.c. conversion circuit. When the test current drops below the prescribed current value (coinciding with fuse interruption), the comparator circuit initiates the opening of the circuit breaker I1 (low-voltage circuit) and the closing of I3 (high-voltage circuit).
The circuit interruption when switching the two sources must be less than 200 ms in order not to influence the arc-extinguishing process and for the test to comply with international standards. Thus, by a synchronized combination of the two circuits, a test is performed to nominal parameters with a long duration (≤ 60 min) as required by the time–current characteristic.
In Figure 2, the load side of the circuit includes resistive and inductive elements to adjust the power factor cos φ. The circuit used allows an adjustment of the resistive part R up to a value of 40 Ω. The inductive load L consists of unsaturable air coils with values between 5 and 2500 mH. By combining the values of the resistive and the inductive parts, any power factor in the range 0.1–0.9 can be obtained.
The M1, M2, M3 measurement system has an industrial frequency response and does not show distortion when examining the oscillograms. The circuit protections against operating overvoltage were chosen so that no striking occurs during normal fuse operation, as the use of a protective device can reduce the stresses on the fuse. In Figure 1, O1 is the current measurement point using a Rogowski coil with sensitivity of 0.02 mV/A, measuring range of 300 kApeak, rise rate di/dt = 40 kA/µs and maximum noise of 3 mVpeak-peak; O2 and O3 is the voltage measurement point using a voltage divider with a maximum DC input voltage of 160 kV and a maximum AC input voltage of 120 kV for a frequency of 50 Hz, ratio 2000:1, rise time 35 ns and frequency range 0–10 MHz.
Particular importance must be given to the circuit for adjusting the parameters of the rated transient recovery voltage. The rated transient recovery voltage associated with the rated maximum breaking current is the reference voltage which represents the upper limit of the presumed transient recovery voltage of the circuits that the fuse must be capable of interrupting in the event of a short circuit. In the circuits used in the experiments (Figure 1 and Figure 2) resistors, RTRV, and capacitors, CTRV, have been introduced to model the parameters Uc, t3 and Uc/t3. Uc represents the peak value of TRV and is expressed according to IEC 60282-1 by the relation [25]:
where k = 1.3 or 1.5 first-pole factor, γ = 1.4 or 1.5 oscillation factor, Un is the rated voltage and t3 is the time required to reach the voltage UC and is expressed in microseconds. The fraction Uc/t3 is defined as the rise rate and is expressed in kV/µs.
During the interaction of the fuse with the circuits in Figure 1 and Figure 2, the arc and transient voltages decisively influence current interruption, therefore Uc and t3 must have the presumed values; their values are verified by means of a negligible resistance conductor replacing the fuse in the circuit, but during the test they are determined by the fuse.
The waveform of the transient recovery voltage is variable depending on the layout of the circuit used. For the experiments that are the subject of this article, the recovery voltage takes the form of damped oscillation with a single frequency or a form close to this oscillation. The capacitive value of the circuit on the power supply side reduces the voltage rise rate in the first microseconds of the TRV.
The presumed current for the two linear circuits in Figure 1 and Figure 2 results from the relation [25,26]:
where is the source voltage G, R is the resistive load, L is the inductive load, ω is the angular frequency at 50 Hz, θ is the making angle of short-circuit current, cos φ is the power factor and t is the duration.
3. Construction Elements
The replacement elements, known as high-voltage fuses, current limiters, which are relatively inexpensive but very fast-operating in case of short-circuit currents, are widely used in electrical power installations. In its passive or current-carrying role, the fuse is required to carry load current and cyclic or other transient overloads allowed for an indefinite period, with no damage. In its active or overload/fault current-interrupting role, the fuse must disconnect the circuit, either relatively slowly, based on predetermined melting characteristics or time–current characteristics, or very fast to high-fault currents, absorbing kilojoules of the resulting arc energy and limiting as much as possible the energy dissipated into the protected circuit.
The construction of fuses is apparently simple, but the phenomena that occur during operation are quite complex. Because of this, the research and development of fuses has relied more on empirical methods, requiring many expensive experiments and tests. The research carried out in the field of fuses can be summarized by the following directions:
- Pre-arcing phenomena, including complex analyses of the thermal relations between the fusible element and the filler that forms the arc extinguishing medium, the electrical insulating envelope and the fuse terminals. Additionally, in this context of pre-arcing phenomena, the behavior of the fusible element is studied from a metallurgical point of view, especially under conditions of long-term cyclical loading. IEC standards stipulate such cyclical tests on fuses; however, the correct understanding of the mechanical and thermal stress of the fusible element under these conditions is far from complete. The use of a eutectic point (metallurgical M-effect) formed from an alloy with the melting point attached to the fusible element to ensure operation at a lower temperature (hence at lower melting currents) has raised pro and con reactions [3,4,5,6]. The disadvantages of using the eutectic point relate to the irreversible structural changes that take place in these areas during the temporary flow of overloads that have the effect of starting the process of melting of these points, and also to the changes that occur over time due to the diffusion effect that takes place even at the fuse operating temperature under normal conditions (at rated current). These phenomena ultimately lead to a malfunction of the fuse.
- Arc phenomena, including the transient phenomena that occur in a fuse during the short but crucially important period when arcing, a complex phenomenon that is not yet fully understood that occurs after the melting of the fuse element. The research into the phenomenon has led to a new theory on the subject [1], as follows. The vitrified quartz tube formed by the heat of the electric arc contains the plasma column. At the ends of this vitrified quartz tube, where the melted ends of the fusible element form the anode and the cathode of the arc, plasma jets are hurled into the surrounding filling material. It has also been shown that only a small fraction of the material of the fusible element is evaporated by the arc, while the fusible element material, in the form of melted droplets, is scattered into the surrounding filling under the action of gas turbulence.
- The properties of fuses, in terms of electrical circuit protection, are indicated by three characteristics:
- The time–current characteristic indicates the melting (pre-arcing) duration according to the load current and, from this point of view, fuses are fast-operating, ultra-fast-operating, slow-operating or combined slow–fast operating, etc. Depending on the nature of the protected object, the fuse is selected with an appropriate time–current characteristic. Thus, specialized fuses were created for the protection of motors, transformers and capacitor banks.
- The limiting characteristic represents the value of the interrupted current according to the value of the presumed short-circuit current, allowing the evaluation of the thermal and mechanical effects of the protected short-circuit current.
- I2t characteristic, Joule integral of the presumed short-circuit current. These values relate to the thermal stresses of the protected circuit in case of overload and short circuit and allow the appropriate choice of fuses from this point of view.
The pre-arcing phenomena, as well as the arc phenomena and implicitly the characteristics stated above, are closely dependent on, and even determined by, two basic elements of fuses: the nature and structure of the fusible element and the nature of the material of the arc extinguishing medium.
3.1. Filling Material
A granular filling material is mainly used in the cavity between the fuse element and the walls of the cartridge of a high-breaking-capacity fuse. Silica quartz is the most commonly used filling and its role has been extensively studied [20,21]. Materials such as river sand, marble dust, lime [20] and other combinations such as potassium silicate and special ceramics [22] have been used and evaluated as fillers. In general, their properties are inferior to silica, which is proper, inexpensive, abundant and chemically stable.
3.1.1. Silica Quartz/Quartz Sand (SiO2)
Typically, granules of approximately equal size are used to fill the cartridge of a fuse. Sizing is achieved by sieving the quartz through standard mesh sieves. The size of the filling granules influences the minimum melting current of wire fuse elements [30,31]. Moreover, it has been noted that granule size and packing density influence the voltage drop across the electrode of the ignited electric arcs during the disintegration of fusible elements [32]. The physical attributes of the filler have been recognized and incorporated into empirically determined models of fuse arc and element disintegration [33]. The nominal grain size of the filler used in high-breaking-capacity fuses is of 300 microns and it is suggested that grains in the 250–500 micron size range are most suitable for arc extinguishing.
The filler is poured into the cartridge and then subjected to mechanical vibration to a specific compaction density. A nominal value of 1.6 g/mm3 has been suggested [34]. The many non-transient properties of the filler have a significant influence on the overall fuse behavior. In particular, they influence the process of the fuse element heating by providing a temperature drop. In addition, the filler restricts the movement of the fuse element due to thermal expansion and consequently transmits mechanical forces to the fuse element.
Five independent transient properties of the filling material have been identified that help to extinguish the arcs ignited during the breaking process in the high voltage fuses:
- During the arcing period of fuse operation, the filler draws energy from the arc/arcs by melting.
- During melting, the filler forms a melted shield that contains the arcs of the solid filler in the cartridge and thus prevents arcs from merging and stretching between individual elements.
- The filler allows pressure to build up inside the melted shield, which helps extinguish the arc.
- The filler provides conductance when it is very hot, which has a damping effect on the circuit transition.
- The filler provides insulation against thermal and mechanical operating shock.
- In addition, when cooled, the electrical conductance of the filler is extremely low, which supports the fuse insulation post-operation. In determining the performance of high-voltage fuses, the role of the extinguishing medium is no less important than that of the material of the fuse element. This role of the extinguishing medium manifests itself in the following ways:
- Extinguishing the arc by the built-up pressure and taking up the mechanical and thermal shocks transmitted to the electrical insulating envelope;
- Absorbing the arc energy, which leads to a rapid current decrease, thus achieving the current limiting and breaking operation;
- Attenuating the recovery voltage by increasing the conductivity of the medium in the warm state;
- Forming a melted shield which contains the electric arc and prevents the arcs from merging or flashing-over between adjacent fusible element;
- Having an effect on the time–current characteristic by the conduction of heat generated by the fusible element;
- Supporting the fusible element and protecting it against external agents.
3.1.2. Boric Acid
Boric acid is a very suitable medium for extinguishing electric arcs. Under the influence of electric arc heat, the boric acid breaks down according to the relation [21]:
Dehydration is accompanied by high heat absorption, as water is highly bound in boric acid crystals. Secondly, the water absorbs energy to vaporize, and thirdly the boric oxide (insulating) absorbs energy to melt. Most commonly, however, the filler used contains boric acid, quartz sand (SiO2), calcium silicates or similar materials. When used alone, due to the pressure of the vapors formed, the boric acid may result in damage to the electrical insulation. An improvement of the breaking characteristics (reduction of I2t) can be obtained using a reduced amount of boric acid, even below 1% of the weight of the filler, which could be quartz sand (SiO2).
3.1.3. Aluminum Sulphate or Mixture of Aluminum Sulphate and Calcium Sulphate
Aluminum sulphate or a mixture of aluminum sulphate and calcium sulphate, as such or mixed with quartz sand, used as extinguishing media rely on the energy they absorb from the arc column for their dehydration, as these substances contain a certain amount of water. The use of quartz sand mixed with aluminum trihydrate (Al(OH)3) or aluminum silicate hydrate (Al6H2O14Si2) is also based on the same principle.
3.1.4. Other Solutions Used for the Filling Material
Due to the particularly high dielectric strength of the advanced vacuum, vacuum fuses have emerged as exceptional achievements, however without generalizing the principle in serial production. Moreover, the properties of sulfur hexafluoride (SF6), which is a colorless, odorless, non-combustible and non-toxic electronegative gas with a high dielectric strength (but below the value corresponding to the vacuum) led to the creation of SF6 fuses used in the wide range of switchgear with the same arc extinguishing medium [35].
The wide range of materials used as extinguishing media has not been exhausted; more or less viable solutions include calcium sulfate, calcium carbonate, talc, alumina, glass beads, marble powder, etc.
However, because of its properties, as well as the fact that it is found in nature relatively easily and in large quantities, with a high purity according to the purpose of use, and inexpensively, SiO2 remains the filler most often used as the extinguishing medium in fuses.
However, the factors that influence the performance of fuses using quartz sand as an extinguishing medium must be taken into account: purity, grain size and its settling.
In terms of purity and the qualities of the impurities that quartz sand used for electrotechnical purposes may contain, there are standards imposing strict limits on these impurities. SiO2 must be at least 99%, Fe2O3 less than 0.03%, Al2O3 less than 0.5%, etc. FeO3 is listed among the impurities with negative effects on fuse operation.
The grain size of the sand plays an important role in the phenomenon of current interruption, but the requirements are contradictory in the sense that a certain grain size with positive effects in one operating mode has negative effects in another mode, so that a mixture is required with certain ratios of the various grain diameters. Most commonly, quartz sand with a grain size of 0.1 to 0.5 mm is used, with the following ratios of the various diameters:
- A total of 2% of the grain mass has a diameter less than 0.1 mm;
- A total of 23% of the grain mass has a diameter of 0.1 to 0.2 mm;
- A total of 45% of the grain mass has a diameter of 0.2 to 0.25 mm;
- A total of 28% of the grain mass has a diameter of 0.25–0.3 mm;
- A total of 2% of the grain mass has a diameter higher than 0.3 mm.
This results in an average grain size of 0.21–0.22 mm. A small grain size is desirable for the nominal rating, as it ensures a good cooling of the fusible element and a corresponding (high) pressure on short-circuit current interruption, while a large grain size and a good compaction (above 1.65 g/cm3) allow the interruption of overload currents. Therefore, a fuse was created in which quartz sand of different grain sizes is arranged in layers inside the electrically insulating tube, which are effectively separated by another electrically insulating medium put into the tube in a liquid state (sodium silicate), forming a continuous and impermeable barrier between the respective layers.
The filler density is the third element among the characteristics of the extinguishing medium which influence fuse operation. By increasing the compactness of the filler, a number of characteristics are improved: the arcing time is reduced and the burnt length of the fuse element and the energy released (I2t) are reduced. As the density of the filler increases, by vibration at a certain frequency and amplitude, the compressibility of the filler and the size of the gaps between the grains decrease, and the volume taken by the metal vapor during fuse vaporization decreases. This results in increased vapor pressure, causing the electrical resistance of the arc column to increase and the arc current to decrease sharply. As a result, as the compactness of the quartz filler increases, the operating overvoltage must also increase.
The compaction of the granular extinguishing medium also applies to the granular extinguishing medium in the form of a rigid, compact and porous mass that includes the fusible. The compact mass can be obtained by mixing it before or after filling with a suitable inorganic binding agent that binds the grains together without substantially reducing the porosity. The binder, which may also be a cold-curing resin, must be stable in time and temperature without releasing under the action of electric arc gases or substances with a negative effect when the electric arc is interrupted.
The use of another extinguishing medium that provides the same performance (breaking capacities) in relation to the very low-cost price of quartz sand is not yet envisaged, and quartz sand (SiO2) remains the most commonly used filler (at least in high-voltage fuses).
Several arc extinguishing media have been analyzed, since the arc energy inside the fuse is dissipated, resulting in the formation of fulgurite clumps from the sand filler surrounding the fuse elements, in this case aluminum, a phenomenon less studied previously. Fulgurite is the mixture of sand grains sintered and melted together with metal globes from the melted fusible elements. The amount of fulgurite produced during the fuse operation is directly related to the amount of arc energy absorbed by the fuse. Approximately 0.5 g of fulgurite is produced per kilojoule of arc energy. Small increases in system voltage (above the rated voltage for the concerned fuse) result in a large increase in arc energy and therefore in the amount of fulgurite produced. The fuse casing has a defined upper limit for the mass of hot fulgurite it can contain. Thus, in general, current-limiting fuses can correctly interrupt only short-circuit currents to system voltages not exceeding the rated fuse voltage. In parallel with the behavior of the fuse to high currents, Chapter 6 shows the evolution of the fulgurite mass, which consists of aluminum globes.
3.2. The Fusible Element
The materials used in the construction of fusible elements are selected on the basis of their electrical, thermal and mechanical characteristics; the quantities under consideration when choosing one material or another are electrical resistivity, thermal conductivity, the integral of the square of the current density in relation to time (Mayr constant, Table 1), melting temperature, vaporization temperature, resistance to oxidation, mechanical strength, etc. These technical characteristics must also include the economic “characteristic” relating to the material of the fusible element, and the final decision is taken only taking into account the sum of the two aspects: economic and technical.

Table 1.
Electrical and thermal characteristics of the materials used to build the fuse.
In addition to silver, which was and still is the material most often used for the construction of high-voltage fuses both in fuses built in the country and abroad, copper, aluminum, zinc, tin, etc., have been used on a much smaller scale, each with its advantages and disadvantages.
Aluminum is the third most widespread element across the surface of the earth after oxygen and silicon, accounting for 8.3% of the lithosphere’s composition and being the most widespread metal. Aluminum oxide deposits, which make up almost 1/6 of the lithosphere, can be considered practically unlimited, and aluminum is a promising material with important economic effects for the construction of fuses. Its electrical conductivity, which is almost 1.5–2 times lower than that of silver and copper, is sensitive to changes in composition and thermal conditions, and all metallic additions reduce the electrical conductivity of aluminum. For 99.6 aluminum, Cu, Fe, Si, Ti are common impurities. The conductivity of Al 99.6 is reduced by 0.8% for every 0.01% of the total amount of vanadium and titanium.
The electrical resistivity can be calculated for the temperature range 0–6580 °C according to the relation:
Furthermore, the relation between the electrical conductivity λ/1/Ωcm/, the thermal conductivity K/ca1/cm × sec × °C/and the absolute temperature T is expressed as follows:
K = aλT + b, in the range 0–6580 °C, where a = 5.02 × 10⁻⁹, b = 0.03
Furthermore, because electrical resistivity can be measured with great accuracy according to relation (5), thermal conductivity can be determined.
Chemically, aluminum is a very active metal, but for normal temperature this phenomenon has little influence, because aluminum is coated with a thin oxide film which is impermeable to oxygen, but, when the current is interrupted, an exothermal reaction of aluminum combustion occurs according to the relation [21]:
and for the corresponding arc temperature, the aluminum becomes so active that it has a chemical reaction with the quartz sand to form pure silicon and aluminum oxide:
This process is exothermic, i.e., an amount of chemical energy is released in addition to the electrical energy of the arc and, since the heat required for aluminum melting is very low, this results in a considerable increase in the back-combustion rate. The consequence of this is a rapid increase in arc voltage, a positive phenomenon in the arc-interruption process. The formation of small crystals of pure silicon seems to have no consequences, because pure silicon is a good insulator and is very finely dispersed.
Aluminum has a standard electrode potential of −1.6 V and, in contact with ordinary technical metals that have an electrode potential positive or more positive than aluminum, it is destroyed.
Aluminum corrosion is associated with the current flow between different anode and cathode regions. The electrochemical corrosion produced is dependent on the potentials of these regions, but these potentials serve only as an indication of the possible galvanic corrosion and cannot indicate the extent of the galvanic corrosion expected.
The high-voltage fuse models used in the experiments contain several fuse elements connected in parallel, and each element has constrictions or notches. The purpose of the notches is to create areas of maximum current density, thus inducing melting and then arc initiation in the middle of the notch. To obtain the fusible element shown in Figure 3, made exclusively of aluminum, its transient properties were examined: high electrical and thermal conductivity, low specific thermal capacity, low melting and vaporization temperature, low latent heat and low density. The model obtained and shown in Figure 3 was obtained by repeated tests on various constructive types.
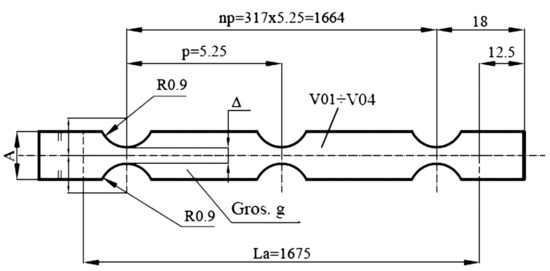
Figure 3.
Drawing of the fuse element used in experiments.
From the rated current level to the minimum-melting current level, the fuse must steadily maintain thermal equilibrium and steady state conditions. Thus, the electrical energy input into the fusible element is conducted and dissipated as heat. Thus, using aluminum is justified in order to meet these conditions. Fast fuse operation and rapid interruption of electric current is an expected requirement under high-fault current conditions.
4. Experiments on the Behavior of Fuses with Aluminum Fusible Element
4.1. Experiments on the Temperature-Rise Behavior and the Time–Current Characteristic
In the case of low-fault currents or over currents, in fuses with more than one fuse element, the fuse elements do not melt and arc simultaneously, as in the case of high-fault currents, but melt randomly one at a time, usually in a single location on each element, until the last one melts.
Experiments have shown that the last fuse element to melt must “receive” sufficient current to achieve multiple melting processes during the arcing that occurs afterwards. This arcing causes each of the remaining parallel fusible elements to re-ignite and create more arcs in series, which in turn extinguish when another element re-ignites. This process continues until all fuse elements have sufficient arcing to withstand the recovery voltage (including any present TRV).
Therefore, if the fault current is below a certain critical value (approximately 3 to 10 times the rated current), the current density in each fuse element during arcing may be too low to initiate multiple series breaks in each element. The result is the formation of long single arcs that re-ignite after each zero current, burning backwards and possibly causing a fuse failure.
Therefore, this type of fuse has a defined “minimum breaking current” below which circuit protection cannot be ensured. A series of experiments were performed to determine the time–current characteristics of fuses with aluminum fusible using the circuit from Figure 4 in order to compare them with the characteristics of fuses with fusible made of copper or silver.
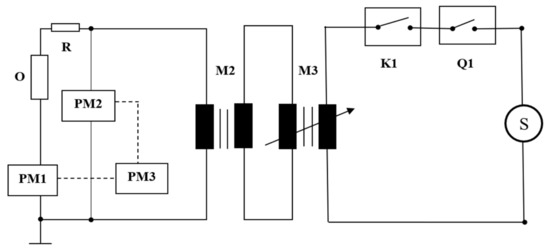
Figure 4.
Circuit used to determine the time–current characteristic where: S—source; Q1—single-phase circuit breaker 400 V/1000 A; K1—protection circuit breaker 400 V/1250 A; M2, M3—autotransformer 70 kVA; R—variable power resistance PM1—current transformer 2 × 50/5A and Rogowski coil 2 kA/V; PM2—digital voltmeter; O—fuse; PM3—data acquisition system TRAS_1: 16 channels, 16 bits.
The experiments were performed to compare fuses with maximum and minimum current with the fusible element made of copper and of silver. The values obtained and presented in Table 2 show a similar behavior for high currents and a small advantage for fuses with copper fusible for low currents. The results obtained by aluminum fuses for low currents are within the limits required by the standards.
Table 2.
Values obtained for the time–current characteristic.
Currents were used to produce the melting curve to avoid asymmetry variability, although usually true time is used not virtual time (virtual time is the value of I2t divided by the square of the RMS value of the presumed current). The time–current characteristic curves show the relationship between the pre-arcing time and the presumed current using average current values with an appropriate tolerance to allow for the variations that occurred in the construction of the fuse since it does not have the tolerances of series products. For very short melting times of less than 0.1 s, the melting time can vary greatly depending on the time of the fault, therefore the current used to generate the melting curves was substantially symmetric.
A fuse generates an appreciable amount of heat during operation. For example, a 100 A, 12 kV fuse can generate 100 W or more when carrying its rated current. This heat must be dissipated efficiently to the surroundings so that the fuse will not be damaged. In the case of a fully enclosed switchgear, the heat generated by the fuse could be a serious limiting factor on the rated current of the protected equipment. Fortunately, it is unusual for fuses to operate to the full rated current due to other factors such as transient current resistance, e.g., transformer start-up or motor start-up. In general, fuses with the lowest dissipated power are preferred. Such fuses will require less derating when used in enclosed environments and will dissipate less energy. The circuit in Figure 5 was used to check the heating of a fuse with an aluminum fusible element.

Figure 5.
Temperature-rise test layout (caption: G—generator, T—step-up transformer, TC—current transformer, A—ammeter, O—fuse, V—voltmeter).
Temperature-rise experiments were carried out by allowing a current equal to the rated fuse current expressed in amps at a frequency of 50 Hz to flow through the fuse until the temperature variation did not exceed 1 °K per hour. The power supply was achieved with copper rods with sections 10 × 2 mm2.
The temperatures were measured using a computer-based J thermocouple system, with measuring points MP1–MP7, located as in Figure 6. The ambient temperature was measured using three mercury thermometers evenly spread around the cell unit at mid-height and approximately 1 m away from it.

Figure 6.
Arrangement of measuring points.
The dissipated power was measured during the temperature rise, when the temperature had steadied. Two values were measured for 1/2In and In.
The values obtained in the temperature rise test for a 63 A are presented in Table 3, with the power dissipated measured as shown in Figure 6 presented in Table 4. Similar values for a 10 A fuse are presented in Table 5 with the power dissipation in Table 6. All the data prove that for this kind of tests the values are in the range imposed by the standards and similar with the ones taken on fuses with copper and silver fusible elements [1,2,3,4,5,6,7,8,9,10]. The power dissipated by the fuse is an essential parameter for obtaining its thermal behavior. The value is equal to the Joule losses produced in the fuse by the circulating current, due to its resistance. As a result of their lower resistivity with regard to other components of the fuse, the fuse resistance can be considered solely due to the fuse elements.
Table 3.
Values obtained during temperature-rise experiments on 63 A fuse.
Table 4.
Values obtained during measurement of the dissipated power in 63 A fuse.
Table 5.
Values obtained during temperature-rise experiments on 10 A fuse.
Table 6.
Values obtained during measurement of the dissipated power in 10 A fuse.
The values obtained during the temperature-rise experiments performed for a rated current show that the fuses with an aluminum fusible element have a similar behavior to those with a copper fusible and are within the limits required by the standards. As these values are evaluated on a sealed fuse, measurements are not possible on the fuse element. The fusible element used in the experiments, in Figure 3, has constrictions which are useful in breaking high currents but, due to the small cross-section, their area is susceptible to higher heating than the other areas. In fact, these constrictions are a source of heating along the fusible element. There are P0x losses in each junction, resulting in an axial heating flow. The areas beside the constrictions are in fact conductors of a fixed cross-section and, under steady-state conditions, the balance of power can be considered as follows [1]:
For the analysis of the fuse-heating phenomenon, we consider the electrical parameters in Table 1 (ρ0—initial electrical resistivity, j—current density, αR—coefficient of variation of the electrical resistivity according to temperature) and the thermal parameters (λ—thermal conductivity, k—coefficient of heat transfer), the fuse parameters and fusible geometry (lp—fuse section perimeter, S—fuse section) and θ is the distributed temperature in x point. Considering the asymmetrical distribution of the current along the fusible, we can obtain the heating distribution ϑ.
The first part of Equation (8) represents the heat flow based on the thermal gradient of the conductor, the second part expresses the heat losses of the conductor and the third part represents the heat flow released through the sides of the conductor. The electrical resistivity has a linear evolution in relation to temperature:
Considering that:
We obtain:
The differential equation has the following general solution:
Considering the boundary conditions:
In Equation (13), considering that the integration of constant A1 must be zero, we obtain the following solution:
The results obtained indicate an inferior behavior of the aluminum element compared with the copper one, but in the final behavior inside the fuse, as shown by the temperature-rise experiments, a large part of the energy is dissipated in the quartz sand. When the arc occurs, the plasma induces a local vaporization of the material, consisting of the aluminum fuse element and the quartz sand surrounding the plasma, which influences the total density and pressure.
After analyzing the fusible element after being the subject of the experiments we concluded that the thermal conductivity presents for aluminum a particularity: it becomes higher with the increase of the temperature, a phenomenon opposite to the behavior of copper and silver. When aluminum is right bellowing its melting point, the thermal conductivity is twice as high then the one at 100 °C.
4.2. Experiments on the High Current: Induced Behavior
In order to verify the high-current-breaking capability of a fuse, the minimum breaking current I3 and the maximum short-circuit current, experiments were performed on a single type of fuse using two fusible elements in parallel as described in Figure 3. The parameters of the experimental tests are in accordance with international standards in order to make the comparison with other fuse variants: rated voltage UN = 24 kV, rated current IN = 50 A, presumed maximum current Ik = 50 kA.
Before each test to I1, I2, I3, (presumed) calibration tests are performed to check currents, voltages, the making angle of short-circuit current, power factor, TRV parameters, etc.
Figure 7 shows the oscillogram obtained during the calibration of the circuit in Figure 1, by replacing the fuse with a negligible resistance conductor. A current of 50,400 A was obtained for a connection of 44 electrical degrees RMS value.
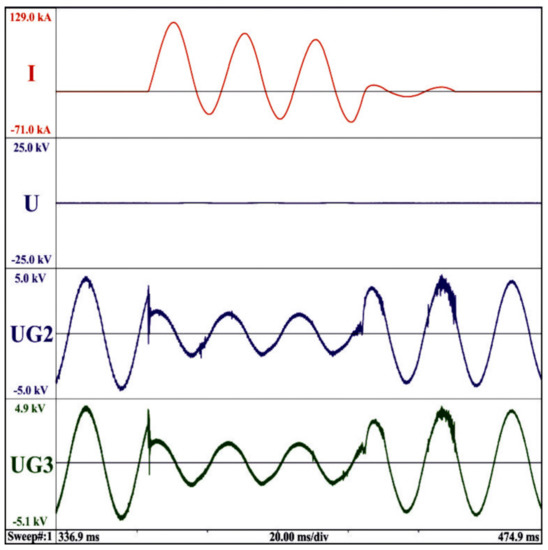
Figure 7.
Oscillogram obtained during calibration for I1 current.
Figure 8 shows the first oscillogram obtained for I1 series of tests, together with a detail in Figure 8b where the shape of the cut-off current and the shape of the recovery voltage can be noted. The circuit shown in Figure 1 was used, where the elements for regulating the current and the power factor are connected in series with each other and in series with the fuse (XR = 32 mΩ); the power factor is <0.15 and the circuit frequency is 50 Hz. The purpose of this experiment is to test the operation for the maximum-rated breaking current and is performed in a single-phase alternating current. The current I1 is the RMS value of the periodic component of the 50.4 kA current resulting from the calibration. The current obtained is referred to as the limited breaking current (cut-off current), IC, and represents the maximum instantaneous value of the current reached during breaking by a fuse. The value of the limited breaking current in the first experiment was of 8100 A with arc initiation after voltage zero-crossing at 36°. The voltage applied in the experiment was 87% of the rated voltage and represents the power frequency recovery voltage Uap. Fuses are not sensitive to TRV characteristics, unless they reach a very high arc voltage immediately after arc initiation. To simulate the harshest operating conditions to which these fuses could be subjected, the standard TRV values for 24 kV have been assumed, namely: peak voltage value uc = 41 kV, duration t3 = 88 µs, delay td = 13.2 µs, rise rate uc/t3 = 0.47 kV/µs. To obtain these values, in the circuit of Figure 1, the relations RTRV = 25 Ω and CTRV = 0.4 µF are obtained. Since, in the case of the experiment in Figure 8, the arc voltage did not reach the highest peak value in a time interval less than or equal to 2t3 after the time of arc initiation, the experiment is considered to be adequate in terms of transient recovery voltage, and the RTRV and CTRV values will be kept for the next two experiments. Otherwise, the circuit parameters in Figure 1 should have been modified to obtain a TRV curve whose winding is not at any point below the reference line and whose initial segment does not intersect the line segment defining the specified delay.
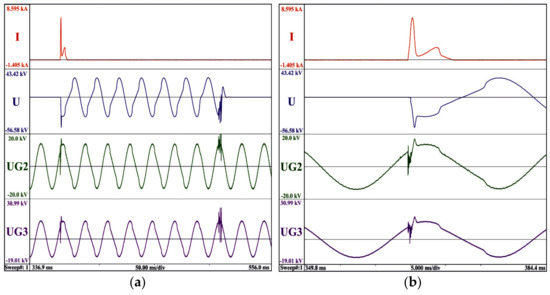
Figure 8.
(a) Oscillogram obtained for the making angle of short-circuit current of 43.7 electrical degrees; (b) connection detail in the oscillogram.
An important value which was determined as a result of the test is I2t (∫i2dt) for a fuse with an aluminum fuse element. I2t is an indicator of the energy allowed to pass through the fuse to the protected circuit under fault conditions. The energy released in the event of a fault developing into an arc is the product of I2t and the arc impedance. A constant I2t value is very useful in achieving coordination between the fuse and other protective devices. Thus, it is imperative to know the minimum melting value I2t, which is the lowest value of I2t that melts the fusible element for the maximum breaking current.
The next test was performed on an identical new fuse, under the same conditions as the first one, in which the making angle of short-circuit current was set to 70 electrical degrees. The limited current IC increased to 10.1 kA, and I2t increased to 128 kA2s compared with 51.4 kA2s, as previously obtained. It can be considered that the maximum value I2t, which can be reached during an operation for any current that can cause current limitation, has been obtained. The limiting I2t can be considered as the sum of I2t of melting and I2t of arc. In the literature, there are other names for limiting I2t, namely: maximum operating I2t, total I2t value, maximum let-through I2t.
The third test on a new fuse was performed under identical conditions as the previous one. The limited current decreased to 7.9 kA, and I2t to 60.1 kA2s, proving the hypothesis that the maximum value of I2t was previously obtained.

Figure 9.
(a) Oscillogram obtained for the making angle of short-circuit current of 70 electrical degrees; (b) connection detail in the oscillogram.
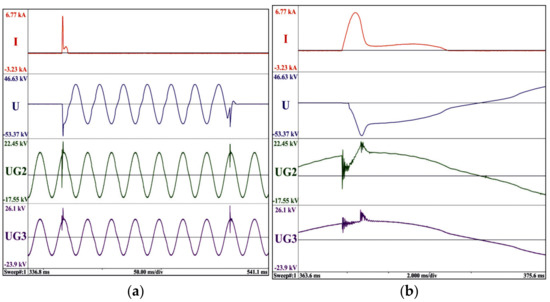
Figure 10.
(a) Oscillogram obtained for the making angle of short-circuit current of 75 electrical degrees; (b) connection detail in the oscillogram.
Table 7.
Values obtained in I1 series of tests.
Figure 8, Figure 9 and Figure 10 show the oscillograms obtained for maximum 50 kA short-circuit currents and the angle of the short-circuit between 40–90 electrical degrees, limited currents Ic = 8–9 kA moderate in value and arc energies that do not compromise the capability of the fuse to correctly interrupt 50 kA currents (which represents a high short-circuit capacity). The limited current has a much lower value than the presumed current, since the arc adds a high resistance into the circuit, which results in a sharp drop in current. Since both the peak current value and the duration are substantially reduced, the energy released into the circuit is also reduced. This process results in TRV recovery overvoltage, also known as arc voltage. The cause of these voltages is the collapse of the field associated with the circuit inductance, which is why the circuit in Figure 1 is made with a low-power factor.
Moreover, the arc times and the switching overvoltage obtained are comparable with those of other types of fuses.
Experiments followed for current I2, which is defined as the value of the maximum-energy current and which is the RMS value of the periodic component of the current. The value of I2 was determined based on equation [20,21,22,23,24,25,26,27,28,29]:
where I2 is the presumed current for this set of tests; IC is the average of the instantaneous current values at the time of melting in the previous tests.
These tests reveal values of the limited current in the range (0.8–1.07)I2 presumed, low switching overvoltages not exceeding 50 kV and operating times around 10 ms.
In the three experiments performed for current I2 obtained with (15), Figures 12–14, it is assumed that fuses will be used in three-phase circuits with effectively earthed neutral, requiring a value of 87% of the rated voltage. The value of 87% represents the recovery voltage across the first fuse interrupting the three-phase ungrounded fault current. The recovery voltage will be distributed to the remaining two fuses and its value will be less than 87% of the rated voltage. A special situation may occur if the fuse is used in a three-phase circuit with isolated neutral or a grounded circuit operating in resonance mode. Because a double earthing fault may occur in a circuit, with one fault on the supply side and the other on the load side but on the other phase, the fuse voltage is at least 115% of the phase-to-phase voltage of the circuit. Moreover, the situation where the fuse must interrupt capacitive currents in a single-phase circuit with earth fault was taken into account when choosing the presumed values. However, the experiment contains assumptions regarding the faults related to the probability of the occurrence of an earth fault on the distribution transformer load.
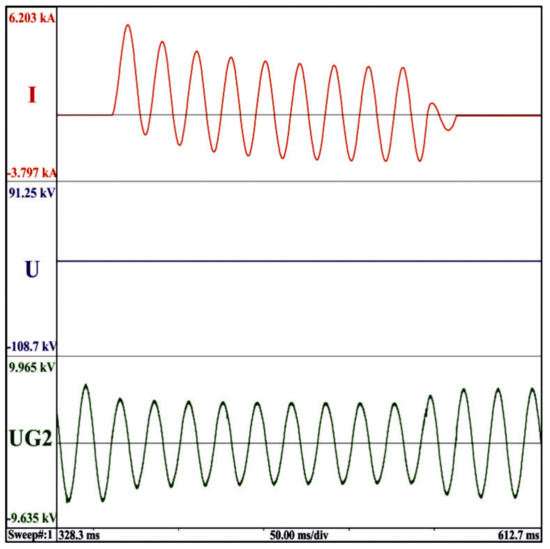
Figure 11.
Oscillogram obtained during calibration for I2 current.
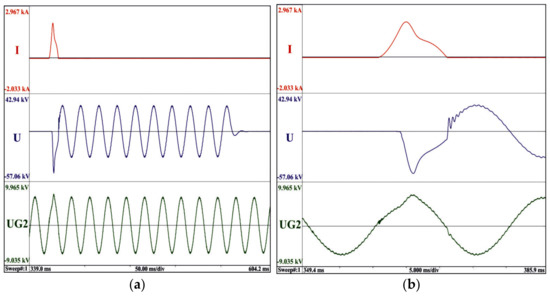
Figure 12.
(a) Oscillogram obtained for the making angle of short-circuit current of 9.5 electrical degrees; (b) connection detail in the oscillogram.
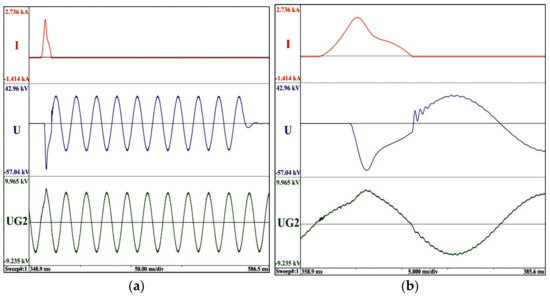
Figure 13.
(a) Oscillogram obtained for the making angle of short-circuit current of 6.9 electrical degrees; (b) connection detail in the oscillogram.

Figure 14.
(a) Oscillogram obtained for the making angle of short-circuit current of 8.6 electrical degrees; (b) connection detail in the oscillogram.
Table 8.
Values obtained in I2 series of tests.
The tests performed to determine the minimum breaking current are more laborious due to the test scheme in Figure 2, but also due to the large number of tests to determine the lowest possible minimum breaking current.
The oscillograms in Figure 15 represent tests for the calibration of low-voltage and high-voltage circuits for current I3 = 190 A after many failures at 150 A and 175 A. The fuses blew after long (tens of minutes) heating (pre-arcing) times.
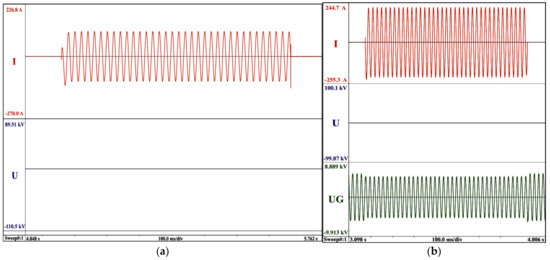
Figure 15.
Oscillograms obtained during (a) high-voltage calibration and (b) low-voltage calibration.
After increasing the current I3 to 190 A, after about 20 s of pre-arcing under the influence of the low-voltage source and switching the high-voltage source at the fuse terminals, there was a correct interruption of the current and recovery of the rated voltage, and the fuse did not blow out in Figure 16.
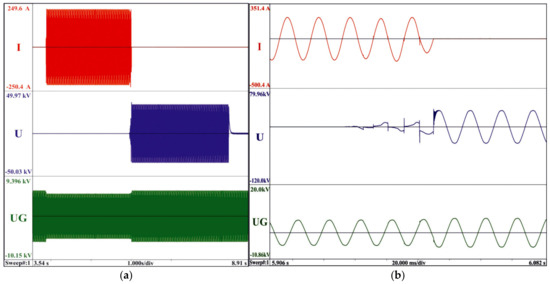
Figure 16.
(a) Oscillogram obtained during the first test for the minimum breaking current a, overview; (b) detail of the oscillogram.
As can be seen in the oscillogram, the current break (180 ms) when applying the high-voltage source does not exceed 200 ms, as required by the standards, and the fuse interrupts with an arc time of 60 ms.
The second test was performed for the same parameters (Figure 17); after 22 s, the first tentative fuse melting occurs and the arc detector switches the two sources, achieving a correct interruption after an arc time of 70 ms.
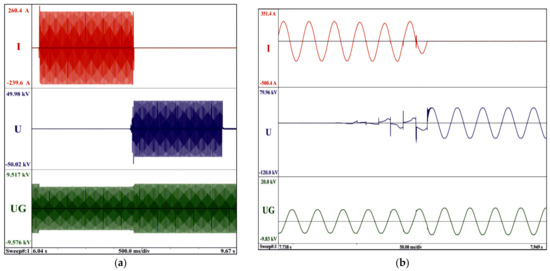
Figure 17.
(a) Oscillogram obtained during the second test for the minimum breaking current a, overview; (b) detail of the oscillogram.
Table 9.
Values obtained in I3 series of tests.
The temperature-rise behavior was studied for two types of fuses: the first with a rated current of 10 A containing a single fuse element and the second of 63 A containing two paralleled identical fuse elements. The same tests were performed on fuses with the same rated current but with a copper fuse element, and the values obtained were similar and within the limits imposed by the technical standards.
When plotting the time–current characteristics, although the results should have been clearly in favor of aluminum, which has a melting temperature of 658 °C compared with 960 °C for silver and 1083 °C for copper, the tests showed an advantage for fuses with a copper fusible. Thus, both types of fuses interrupted currents several tens of times higher than the rated current, but there was a difference in the 10 A fuse, where the aluminum fuse could not interrupt the 6 × In current, while the copper one was successful after 38 s. The 6 × In current could not be interrupted by the 63 A fuses, neither the copper fuse nor the aluminum one. No test was performed on silver fuses. Although the fuse did not interrupt this current, according to the standards, the results obtained by the fuse are considered satisfactory and it can be used in certain types of electrical circuits. However, in the future, other constructive variants will be studied for this nominal current, and wire instead of fuse strip will be considered.
For the tests performed for high currents I1, I2, I3, a single type of fuse with a rated current of 50 A was used, being considered representative of the homogeneous series to which it belongs. A limited current of 8.1 kA at 36 electrical degrees and 10 kA at 63 electrical degrees was obtained, the presumed current being 50 kA. In the I3 series, a value of 190 A was obtained for the 24 kV-rated voltage, after several failed attempts to obtain a lower current the fuses blew after long (tens of minutes) heating (pre-arcing) times. The values obtained are considered satisfactory according to the standards.
In the case of low-fault currents or over currents, for the fuse used in the experiments that have more than one fusible element, the fusible elements do not melt and the arc does not occur simultaneously, as in the case of high-fault currents, but melt randomly one at a time, usually in a single location on each element until the last one melts. Furthermore, the fusible elements have constrictions and more than one series interruption is required to interrupt the current. Therefore, the last fusible element which melts must withstand a current sufficient to achieve multiple melting processes during arcing. The remaining fuse element reignites (restrikes) again and creates more arcs in series which in turn extinguish when another element reignites. This process continues until all the fuse elements have withstood the arc sufficiently to withstand the recovery voltage (including any TRV present). Thus, a value of the fault current below the current obtained in the experiments in Figure 16 and Figure 17 creates a current density on each fuse element that is too low to allow the fuse to break the current. This results in multiple isolated arcs with long durations that reignite at each zero crossing of the current, with the final effect of fuse destruction. Thus, the current I3 has been defined above as the minimum breaking current, below which satisfactory circuit protection cannot be provided. The value obtained for the minimum breaking current is approximately 4 × In, which is satisfactory and competitive compared with other fuses, but not low enough as would be indicated by the value of the aluminum melting time.
In order to simulate the phenomena, we used a simplified approach without taking into account the heat transfer toward the silica sand. We have modeled a circuit similar with Figure 1 with an ideal source with 10 kV voltage and 110 kA current in the circuit. To reach similar data as the real-life experiment, a step-up transformer was inserted with a ratio of 2.14. A reactance of 68 mΩ was used on the supply side and RTRV = 21 Ω, CTRV = 5 mF, in order to obtain the impose values for the transient recovery voltage (time coordinate = 88 µs, amplitude factor of 1.4 and a rate of rise of 0.47 kV/µs).
The values obtained in Figure 18 are: test voltage 20.88 kV with a cut-off current of 7 kA at a making angle of 40 electrical degrees (imposed as in the real-life experiment to be able to compare the results). Similar to the real experiment the pre-arcing time was 0.5 ms and arcing time 6 ms. In Figure 18, i1 is the current in the circuit without a fuse inserted obtained with (2) and i2 is the cut-off current.

Figure 18.
Simulated oscillogram obtained for I1 with detail on making angle.
In Figure 19, it is presented the simulated obtained for a prospected current with (15) with the current i1 obtained in the previous simulation. The making angle was set to 8 electrical degrees (imposed as in the real-life experiment to be able to compare the results) and the voltage to 20.8 kV. The cut-off current i2 obtained was 2000 A.
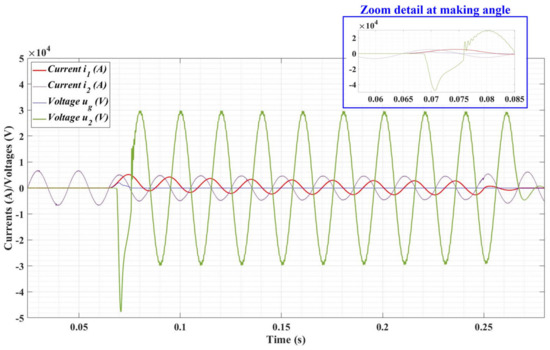
Figure 19.
Simulated oscillogram obtained for I2 with detail on making angle.
We compared our measurements with the results of the simulations with the heat transfer with the surrounding silica sand and radiated loss not taken into account. The heat transfer by radiation is proved to be negligible for the pre-arcing time obtained. The discrepancy observed is considered to appear because in real-life experiments the notches are not perfectly symmetrical, so the width of the fuse element is lower than the one put in the simulation. Furthermore, in the simulation the resistance of the fuse element is constant.
The images from the experiments are presented in Figure 20.
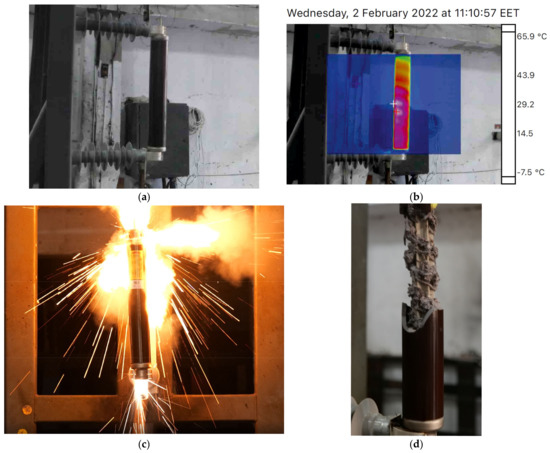
Figure 20.
Images from the HV fuse experiments: (a) normal operation; (b) real-life termovision during experiment; (c) malfunction of the HV fuse’s caps; (d) overheating of the HV fuse with ceramic envelope.
Main characteristics of the equipment used in the circuit are as follows:
- Three short-circuit generators, each with 2500 MVA 120 kA for 0.5 s, with parallel operation possibilities;
- Six single-phase units of master brakers (12 kV, 120 kA);
- Three single-phase units of master makers (24 kV, 330 kA);
- Six single-phase units of master makers (12 kV, 330 kA);
- Nine single-phase step-up transformers (80 MVA; 12/12/25/51 kV);
- Four single-phase step-down transformers (10 MVA; 10/0.125/0.25/0.5 kV);
- Capacitors bank for direct testing: trifazat 36 kV, 400 A;
- Multichannel sequential programmer BE3200-type;
- Data acquisition system for measurement and processing with optical isolation (25 MS/s, input range 20 mVDC–100 VDC).
5. Conclusions
High-voltage fuses are common in electrical equipment and power distribution systems and are used as protective devices. Depending on the rated current, these fuses contain one or more fusible elements made of copper or silver. This article studies the behavior of high-voltage fuses with fusible made exclusively of aluminum. The behavior was studied in high-power linear circuits by simulating the harshest operating conditions. The fuse element contained by these fuses and presented in detail in the article has constrictions to facilitate current breaking for high-current values. The reason why silver and copper are preferred to aluminum is the thermal conductivity 418 λw/m·grd. for silver, 393 for copper and, respectively, 220 for aluminum. Oxidation of the fusible element is also one of the reasons why aluminum is not preferred, but this phenomenon can be mitigated by means of the extinguishing medium and fuse tightness.
We have depicted a test circuit to reproduce the most severe working conditions for high-voltage fuses. The experiments were made in various conditions to obtain the required power factor and making angle. The influence of the closing angle is shown from the measurement of the main electrical parameters, especially the Joule integrals for the pre-arcing stage, the arcing stage and the total duration of the fuse working.
Several arc extinguishing media were analyzed, as the energy of the arcs inside the fuse is dissipated to the formation of fulgurite clumps from the sand filling surrounding the fuse elements, in this case made of aluminum, a phenomenon less studied previously. The mixture of sintered and melted sand grains and aluminum globes had the same mass as the copper globes mixture and did not affect the ceramic envelope of the fuse because of volume increase.
The comparison of the experimental pre-arcing times with the simulated results shows some discrepancies which are due to the constant fuse resistance and the imperfect notch geometry on the fuse element.
Although the results are considered adequate, future research is needed to establish a model of the fusible element for low currents, the homogeneous series, as well as a model for higher-rated voltages.
Author Contributions
Conceptualization, C.-E.S. and M.N.; Data curation, C.-E.S., C.-I.N., C.D. and S.E.; Formal analysis, C.-E.S., M.N., D.O., C.D., D.I. and S.E.; Funding acquisition, C.-E.S.; Investigation, C.-E.S., D.O., C.D., D.I. and S.E.; Methodology, C.-E.S., M.N., D.O. and C.D.; Project administration, C.-E.S.; Resources, C.-E.S.; Software, C.-E.S., M.N. and C.-I.N.; Supervision, C.-E.S., M.N., C.-I.N. and S.E.; Validation, C.-E.S., M.N., C.-I.N., C.D., D.I. and S.E.; Visualization, C.-E.S., M.N., D.O., D.I. and S.E.; Writing—original draft, C.-E.S.; Writing—review & editing, C.-E.S. All authors have read and agreed to the published version of the manuscript.
Funding
This work was developed with funds from the Ministry of Research, Innovation and Digitization of Romania as part of the NUCLEU Program: PN 19 38 02 04.
Data Availability Statement
Not applicable.
Conflicts of Interest
The authors declare no conflict of interest.
Nomenclature
| I | Current that flows through the fuse link; |
| Us | Supply source voltage; |
| Uap | Test voltage; |
| I1,2 | Prospective current (r.m.s.value of the a.c. component) in test duties 1 and 2; |
| IC | Cut-off current; |
| ρ | Making angle of short-circuit current; |
| φ | Initiation of arcing after voltage zero; |
| Ur | Recovery voltage; |
| Uc | Overvoltage; |
| Tpa | Pre-arcing time; |
| Tarc | Arcing time; |
| I3 | Breaking current in test duty 3; |
| I2t | Joule integral, total energy; |
| P0x | Additional power losses due to notches; |
| x0 | Distance between notches; |
| s | Total section of notches; |
| l0 | Length of notches; |
| S | Section of the fusible element; |
| lp | Perimeter of the fusible element section; |
| j | Current density; |
| ρ | Electrical resistivity; |
| ρ0 | Initial electrical resistivity; |
| λ | Thermal conductivity; |
| k | Heat transfer coefficient; |
| θ | Temperature; |
| θa | Ambient temperature; |
| αR | Coefficient of variation of electrical resistivity with temperature; |
| α | Asymmetric coefficient; |
| γ | Density; |
| c | Specific heat. |
References
- Pleșca, A. Temperature distribution of HBC fuses with asymmetric electric current ratios through fuselinks. Energies 2018, 11, 1990. [Google Scholar] [CrossRef]
- Wright, A.; Newbery, P.G. Electric Fuses; IEEE: London, UK, 2004; ISBN 13:9780863413995. [Google Scholar]
- Rochette, D.; Bussiere, W.; Touzani, R.; Memiaghe, S.; Velleaud, G.; André, P. Modelling of the Pre-Arcing Period in HBC Fuses Including Solid-Liquid-Vapour Phase Changes of the Fuse Element. In Proceedings of the 2007 8th International Conference on Electric Fuses and their Applications, Clermont-Ferrand, France, 10–12 September 2007; pp. 87–93. [Google Scholar]
- Bussiere, W.; Rochette, D.; Velleaud, G.; Latchimy, T.; Gelet, J.L.; Gentils, F.; Perez-Quesada, J.C.; Rambaud, T.; Andre, P. Experimental study of HBC fuses working at short and medium pre-arcing times. J. Phys. D Appl. Phys. 2008, 41, 195210. [Google Scholar] [CrossRef]
- Sălceanu, C.-E.; Nicola, M.; Ocoleanu, D.; Iovan, D.; Enache, S. Experimental Study of HBC Fuses with Aluminum Fuse Element at Minimum Rated Breaking Current. In Proceedings of the International Conference on Applied and Theoretical Electricity (ICATE), Craiova, România, 27–29 May 2021; pp. 1–6. [Google Scholar]
- Hadzhiev, I.; Malamov, D.; Balabozov, I.; Yatchev, I. Experimental and Numerical Analysis of the Thermal Field in a High-Power Low Voltage Fuse. In Proceedings of the 16th Conference on Electrical Machines, Drives and Power Systems (ELMA), Varna, Bulgaria, 6–8 June 2019; pp. 1–5. [Google Scholar] [CrossRef]
- Pleșca, A. Thermal analysis of the fuse with unequal links using finite element method. Int. J. Electr. Comput. Energ. Electron. Commun. Eng. 2012, 6, 1447–1455. [Google Scholar]
- Tzeneva, R.; Slavtchev, Y.; Mateev, V. Modeling of Thermal Field of Electrical Fuses for Domestic Application. In Proceeding of the Technical University of Sofia; Technical University of Sofia: Sofia, Bulgaria, 2014; Volume 64, pp. 105–112. [Google Scholar]
- André, P.; Bussiere, W.; Coulbois, A.; Gelet, J.L.; Rochette, D. Modelling of Electrical Conductivity of a Silver Plasma at Low Temperature. In Plasma Science and Technology; Hefei Institutes of Physical Science, Chinese Academy of Sciences: Hefei, China; IOP Publishing: Bristol, UK, 2016; Volume 18, pp. 812–820. [Google Scholar]
- Psomopoulos, C.S.; Karagiannopoulos, C.G. Measurement of fusible elements during current interruption and interpretation of related phenomena. Measurement 2002, 32, 15–22. [Google Scholar] [CrossRef]
- Magnago, F.; McEwan, P.M. Computer Modelling of HBC Fuses and Their Co-Ordination with Power Electronic Devices for Sinusoidal and Non-Sinusoidal Short-Circuit Fault Conditions. In Proceedings of the IEEE Applied Power Electronics Conference and Exposition—APEC’95, Dallas, TX, USA, 5–9 March 1995; Volume 1, pp. 135–139. [Google Scholar] [CrossRef]
- Barrow, D.R.; Howe, A.F.; Cook, N. The chemistry of electric fuse arcing. IEEE Proc. Sci. Meas. Technol. 1991, 138, 83–88. [Google Scholar] [CrossRef]
- Torres, E.; Mazón, A.J.; Fernández, E.; Zamora, I.; Pérez, J.C. Thermal performance of back-up current-limiting fuses. Electr. Power Syst. Res. 2010, 80, 1469–1476. [Google Scholar] [CrossRef]
- Tourn, D.H.; Gomez, J.C. Low Voltage Lithographic Fuses: Preliminary Results of Breaking Capacity and Cyclic Load Tests. In Proceedings of the 8th International Conference on Electric Fuses and their Applications, Ceyrat, France, 10–12 September 2007; pp. 57–60. [Google Scholar] [CrossRef]
- Hoffmann, G.; Kaltenborn, U. Thermal Modelling of High Voltage H.R.C. Fuses and Simulation of Tripping Characteristic. In Proceedings of the 7th International Conference on Electric Fuses and their Applications, Gdansk, Poland, 8–10 September 2003; pp. 174–180. [Google Scholar]
- Memiaghe, S.; Bussière, W.; Rochette, D. Numerical Method for Pre-Arcing Times: Application in HBC Fuses with Heavy Fault-Currents. In Proceedings of the 8th International Conference on Electric Fuses and their Applications, Clermont-Ferrand, France, 10–12 September 2007; pp. 127–132. [Google Scholar]
- Gómez, J.C.; Tourn, D.H.; Nesci, S.; Sanchez, L.; Rovere, H. Why the operation failure of high breaking capacity fuses is so frequent? CIRED-Open Access Proc. J. 2017, 1, 1545–1549. [Google Scholar] [CrossRef]
- Kühnel, C.; Schlegel, S.; Großmann, S. Investigations on the long-term behavior and switching function of fuse-elements for NH-fuse-links (gG) at higher thermal stress. In Proceedings of the 2017 6th International Youth Conference on Energy (IYCE), Budapest, Hungary, 21–24 June 2017; pp. 1–8. [Google Scholar]
- Halevidis, C.D.; Mouzakitis, P.I.; Polykrati, A.D.; Bourkas, P.D. The Effect of the Fuse Enclosure Temperature Rise on Low Voltage Overhead Conductor Protection. In Proceedings of the MedPower 2014 Conference, Athens, Greece, 2–5 November 2014; pp. 1–5. [Google Scholar]
- IEC 60038; IEC Standard Voltages. International Electrotechnical Commission: Geneva, Switzerland, 2009.
- IEC 60071-1; Insulation Coordination—Part 1: Definitions, Principles and Rules. International Electrotechnical Commission: Geneva, Switzerland, 2019.
- IEC 60076-1; Power Transformers—Part 1: General. International Electrotechnical Commission: Geneva, Switzerland, 2011.
- IEC 60076-7; Power Transformers—Part 7: Loading Guide for Mineral-Oil-Immersed Power Transformers. International Electrotechnical Commission: Geneva, Switzerland, 2018.
- IEC 60076-12; Power Transformers—Part 12: Loading Guide for Dry-Type Power Transformers. International Electrotechnical Commission: Geneva, Switzerland, 2008.
- IEC 60282-1; High-Voltage Fuses—Part 1: Current-Limiting Fuses. International Electrotechnical Commission: Geneva, Switzerland, 2020.
- IEC 60282-2; High-Voltage Fuses—Part 2: Expulsion Fuses. International Electrotechnical Commission: Geneva, Switzerland, 2009.
- IEC 60549; High-Voltage Fuses for the External Protection of Shunt Capacitors. International Electrotechnical Commission: Geneva, Switzerland, 2013.
- IEC 60644; Specification for High-Voltage Fuse-Links for Motor Circuit Applications. International Electrotechnical Commission: Geneva, Switzerland, 2019.
- IEC/TR 60890; A Method of Temperature-Rise Assessment by Extrapolation for Partially Type-Tested Assemblies (PTTA) of Low-Voltage Switchgear and Controlgear. International Electrotechnical Commission: Geneva, Switzerland, 2002.
- Baxter, H.W. Electric Fuses; ERA Report GT/224; Edward Arnold: London, UK; ERA Technology Limited: Leatherhead, UK, 1950. [Google Scholar]
- Turner, H.W.; Turner, C. Phenomena occurring During the Extinction of Arcs in Fuses. In Proceedings of the 2nd International Symposium on Switching Arc Phenomena, Lodz, Poland, 20–22 September 1977; pp. 293–299. [Google Scholar]
- Gomez, J.C. HBC Fuse Models Based on Fundamental Arcing Mechanism. Ph.D. Thesis, Sheffield Hallam University, Sheffield, UK, September 1994. [Google Scholar]
- Hibner, J. Calculation of the Over Voltage Peak Values when breaking Short Circuits by means of Multi Strip Fuses. In Proceedings of the 2nd International Symposium on Switching Arc Phenomena, Lodz, Poland, 20–22 September 1977; pp. 269–274. [Google Scholar]
- Paukert, J. Electrical Conductivity of Arc Extinguishing Media for Low Voltage Fuses. In Proceedings of the International Conference on Electrical Fuses and their Applications, Trondheim, Norway, 13–15 June 1984; pp. 70–75. [Google Scholar]
- Blewitt, D.D.; Gupta, T.K. Fuse with Electronegative Gas Interrupting Means. US Patent 4544908/1985, 1 October 1985. [Google Scholar]


Publisher’s Note: MDPI stays neutral with regard to jurisdictional claims in published maps and institutional affiliations. |
© 2022 by the authors. Licensee MDPI, Basel, Switzerland. This article is an open access article distributed under the terms and conditions of the Creative Commons Attribution (CC BY) license (https://creativecommons.org/licenses/by/4.0/).