Abstract
Automated guided vehicles (AGV) or mobile robots (MR) are being used more and more in modern factories, logistics, etc. To extend the work-time of the robot, kinetic energy recovery systems are implemented to store the braking or lifting energy. In most applications, the energy storage system is a Li-ion battery, which is therefore subjected to increased stress and is also oversized. Super-Capacitors can be used in combination to solve this issue. In this paper, different power distribution systems are analysed and compared, using both single or hybrid storage systems (battery and super-capacitor combined). The comparison is both qualitative, using general system characteristics, and quantitative, using an efficiency/power density Pareto front analysis.
1. Introduction
Nowadays, it is impossible to imagine everyday industrial life without mobile robots. These have a variety of requirements for their energy supply network [1,2,3]. One of these requirements is energy recovery during braking. This is already happening in many applications such as elevators, electric vehicles, robots in general, etc., as shown in [4]. This energy needs to be stored in electrical energy storage devices so that it can be reused. Different technologies can be used to store this energy. A review and a qualitative comparison were conducted in the conference paper [5]. In this paper, the comparison is extended, and a quantitative comparison with Pareto front analysis is conducted.
Batteries are key to modern electric transportation without a static connection to the power grid. These batteries have a high energy density and are easy to implement without adding complexity. Because of this, the battery is used as the preferred energy storage device, and it has become a standard in a variety of mobile applications such as electric vehicles, cell phones, and mobile robots. Consequently, the demand for Li-ion and other materials for battery production is increasing and represents a significant environmental burden. Accordingly, the question arises whether there are enough raw materials for production in the future and whether current recycling processes are sufficient to recover most of the components of the battery [6]. On the other hand, a disadvantage of the battery is that it has a relatively low number of equivalent full charge cycles (–) [7,8].
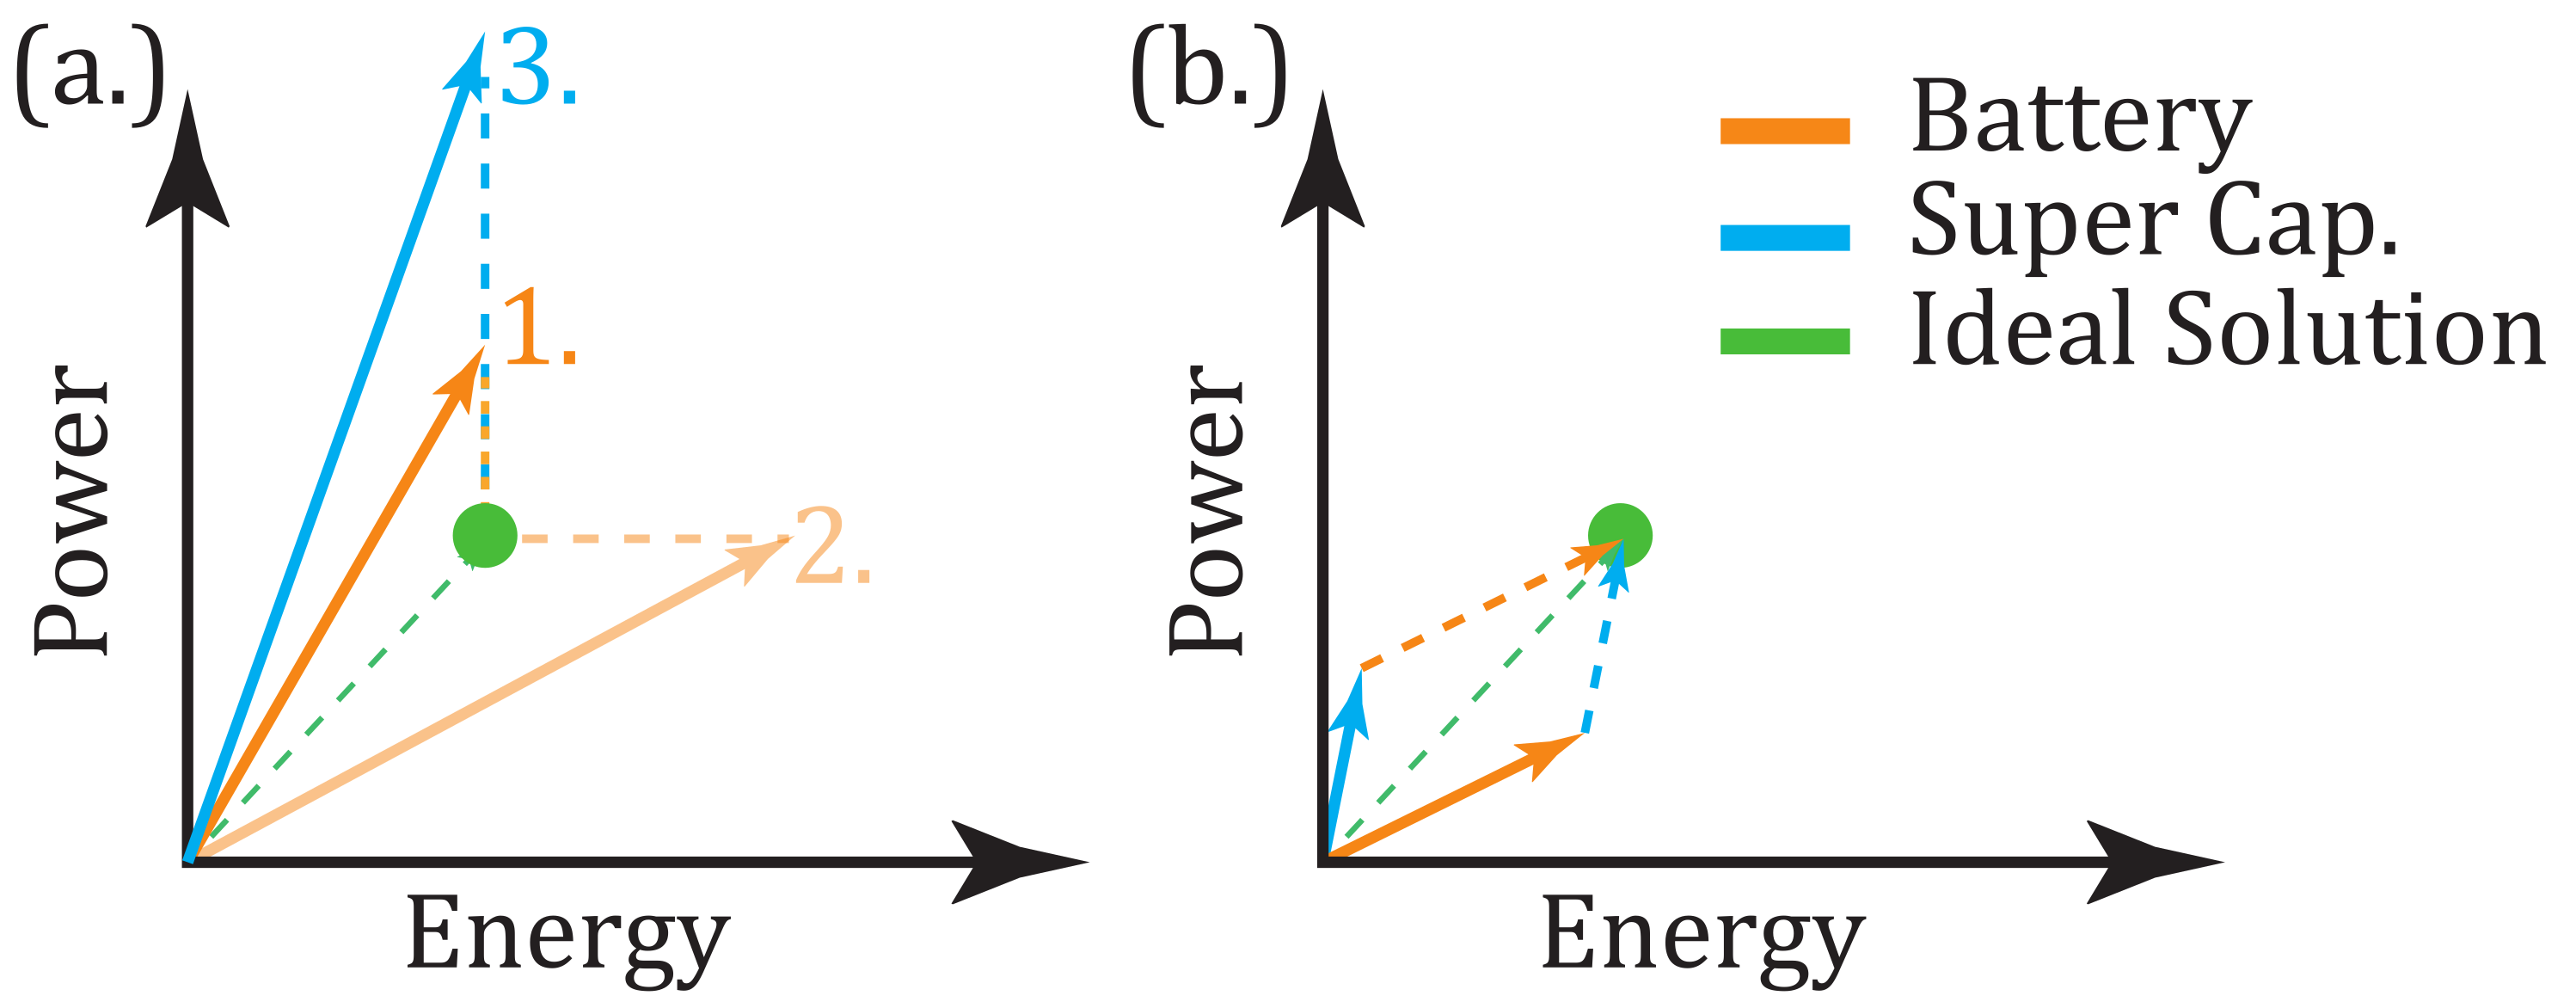
In contrast, the super-capacitor or ultra-capacitor has outstanding characteristics in terms of peak power and a high number of full charge cycles (–) [7,8,9,10], but the energy density is lower than for batteries. In [11], two different Li-ion cells, one for high power and one for high energy [7], were used to create a battery pack that meets the requirement without oversizing. Using the same method, two completely different technologies such as the battery and super-capacitor can be combined to meet the requirements shown in Figure 1 while increasing the battery life. By reducing the number of equivalent charge cycles [4,9,12], they contribute to an increased battery life expectancy [7,8,11]. Another advantage of using hybrid energy storage systems (HESS) is that the energy density of the overall system can be increased without sacrificing peak performance. This also leads to interesting economic aspects in the use of hybrid technology. For example, the cost of a standard Li-ion cells in 2020 cost 102 USD/kWh and 35 USD/kWh for the cell-pack [13]. The electricity required for cell production generates 80.1 kg/kWh of [14]. These lithium-ion systems with an energy density of about 77 Wh/kg can be changed to a hybrid energy storage system with a Li-ion battery with higher energy density (156 Wh/kg), see Table 1. Based on these assumptions, this synthesis can also significantly reduce emissions for cell production and the price of the battery, as the specific energy density of the new battery is increased by about 100%. This leads to a reduction in the total number of cells and thus also to a reduction in raw material requirements.
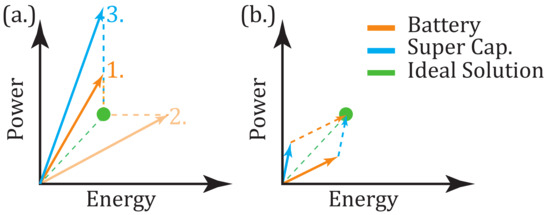
Figure 1.
Qualitative comparison of two methods to meet the requirements: (a) With an oversized battery with either 1. power, 2. energy or 3. oversized super-capacitor; (b) A hybrid solution consisting of the combination of the battery with a super-capacitor module to meet the requirements [11].

Table 1.
Overview of three commercially available battery systems for AGV’s from the company Varta [15].
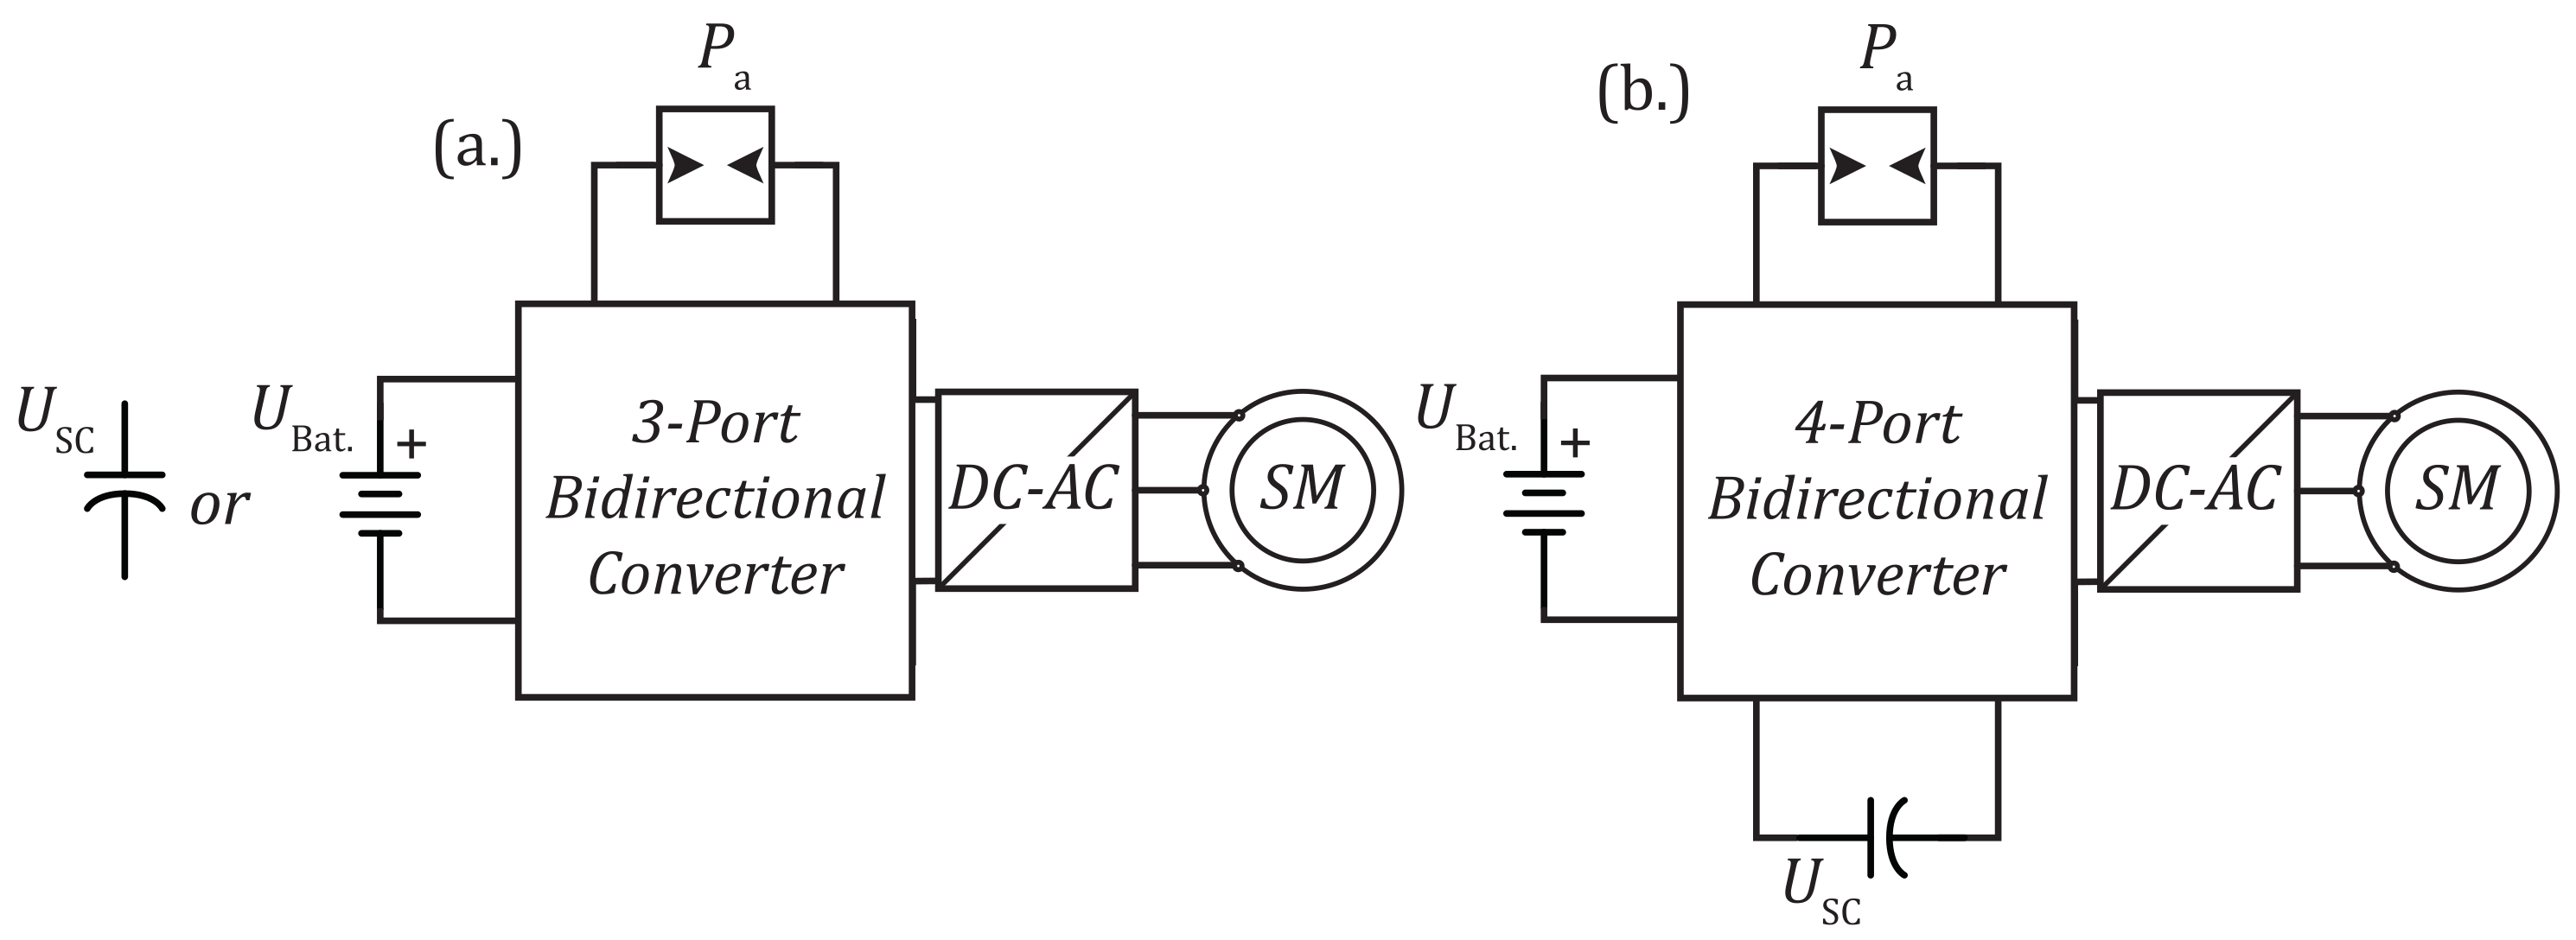
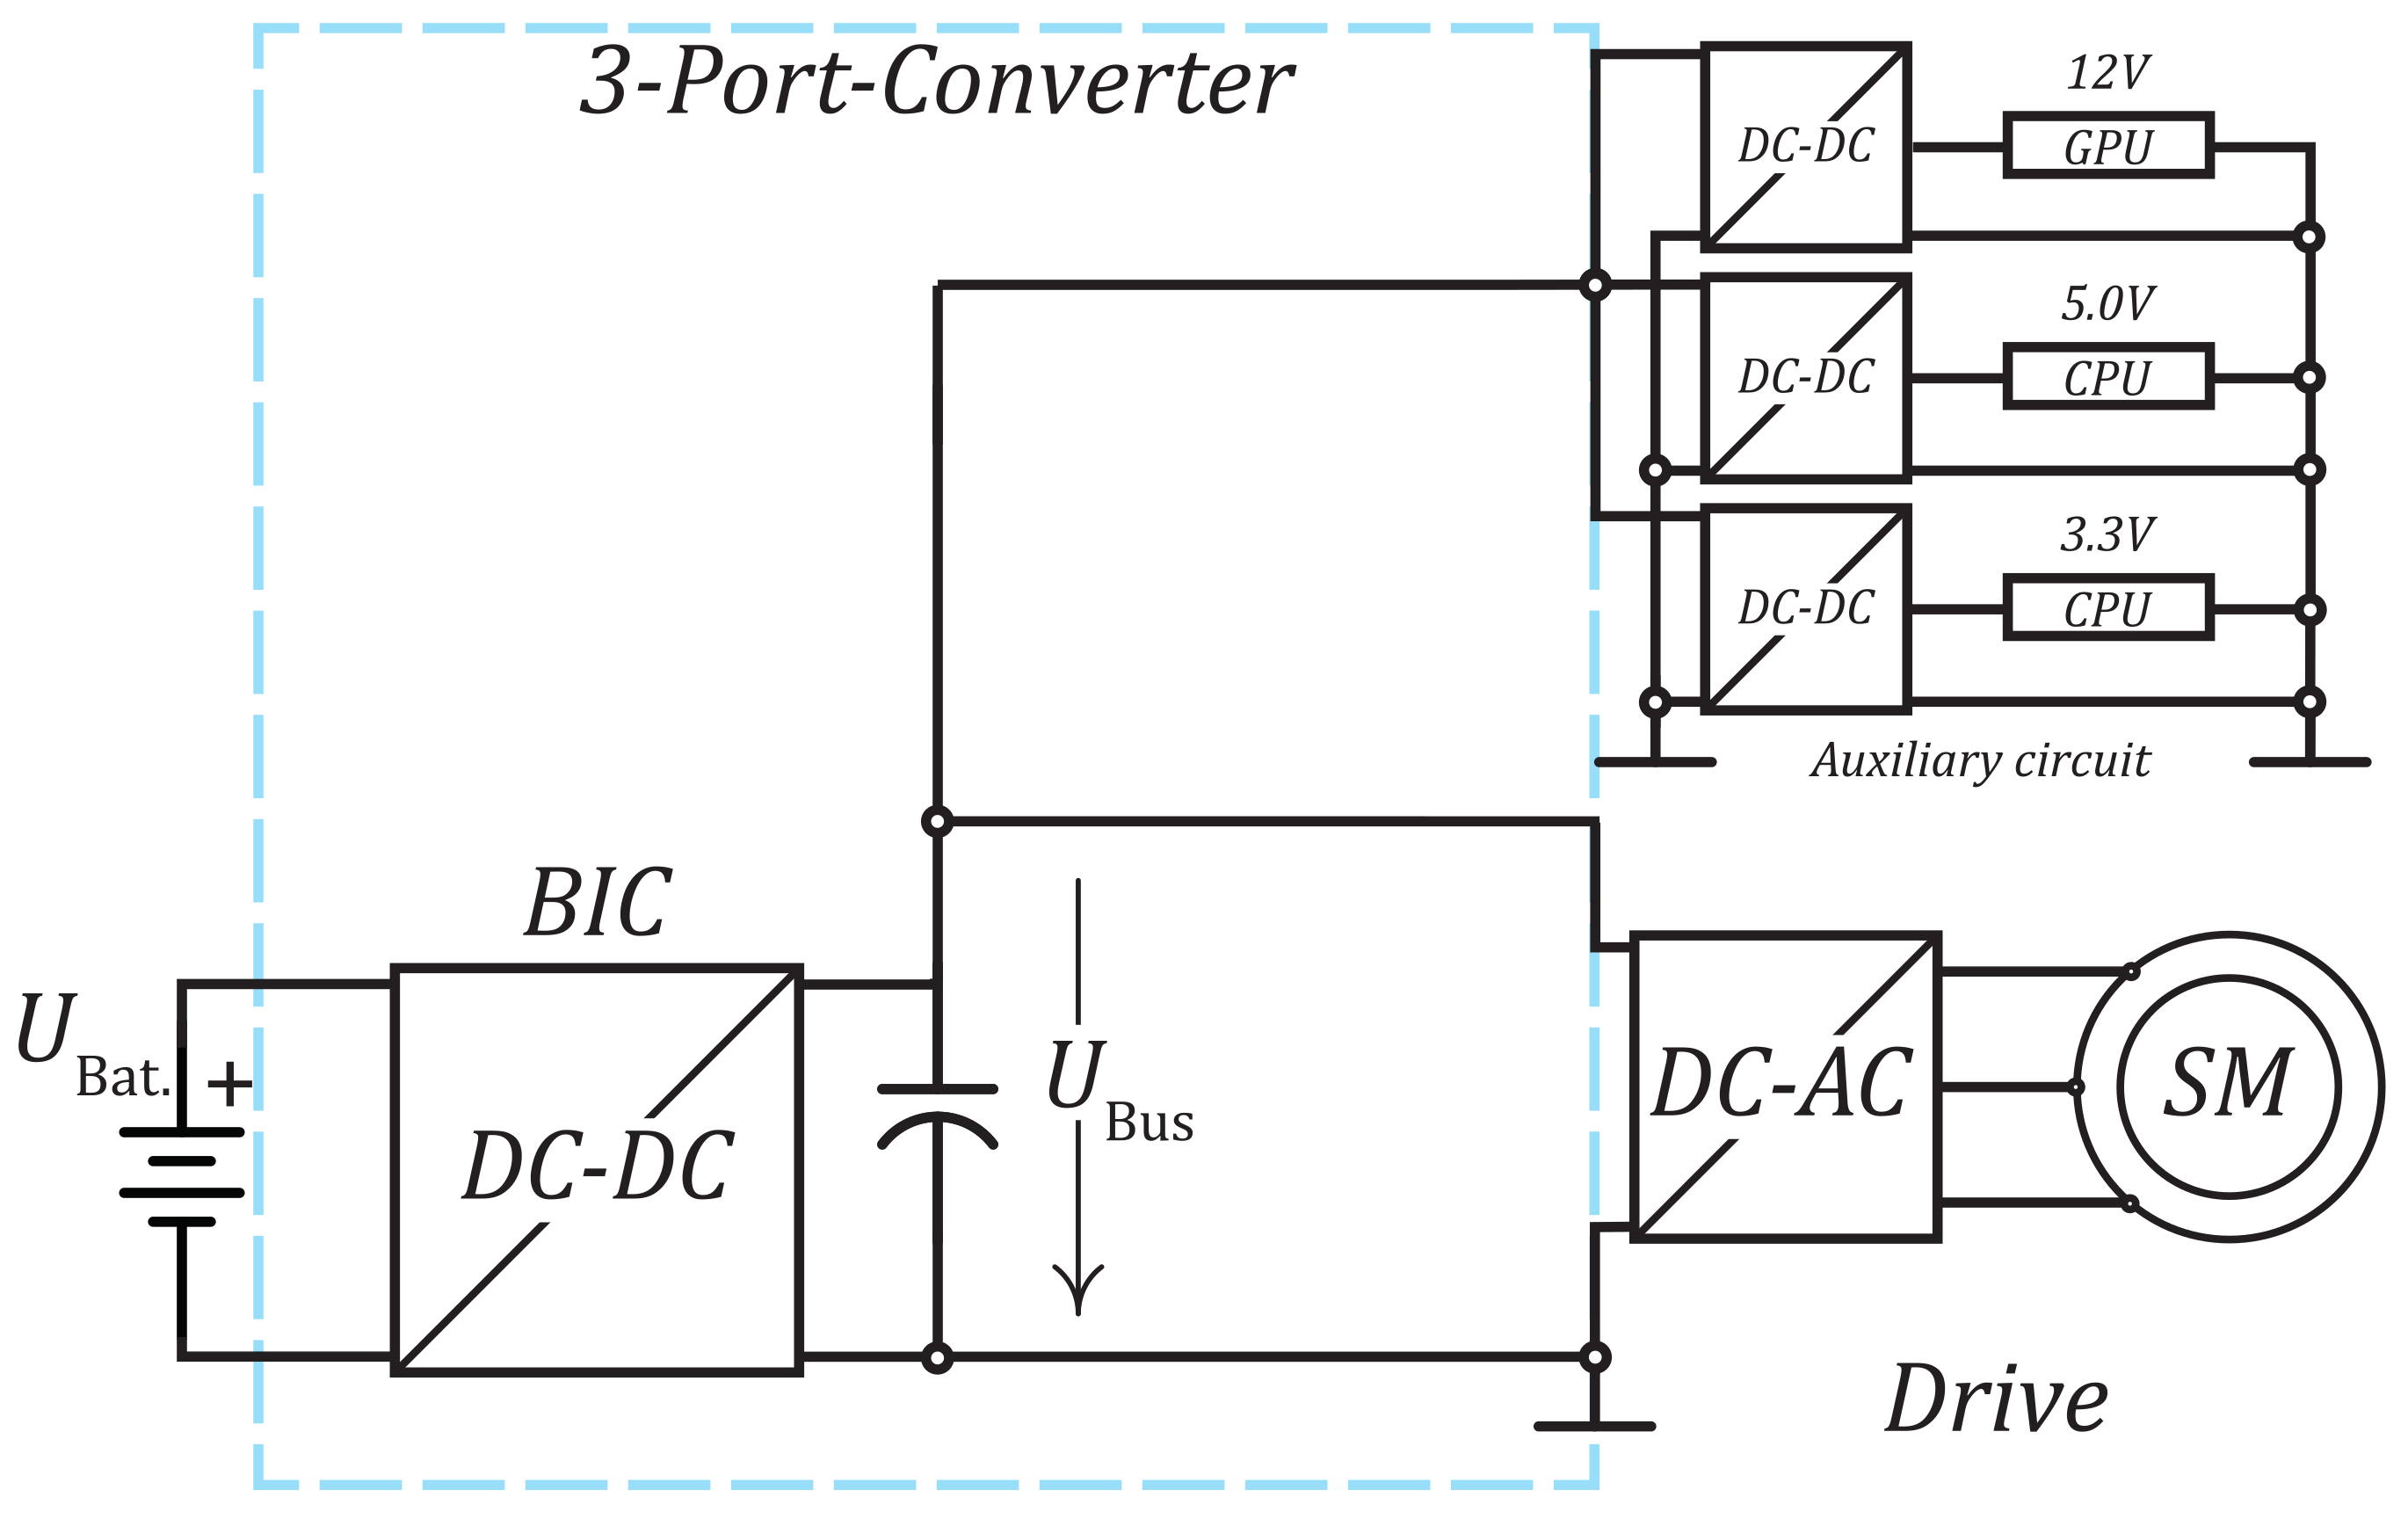
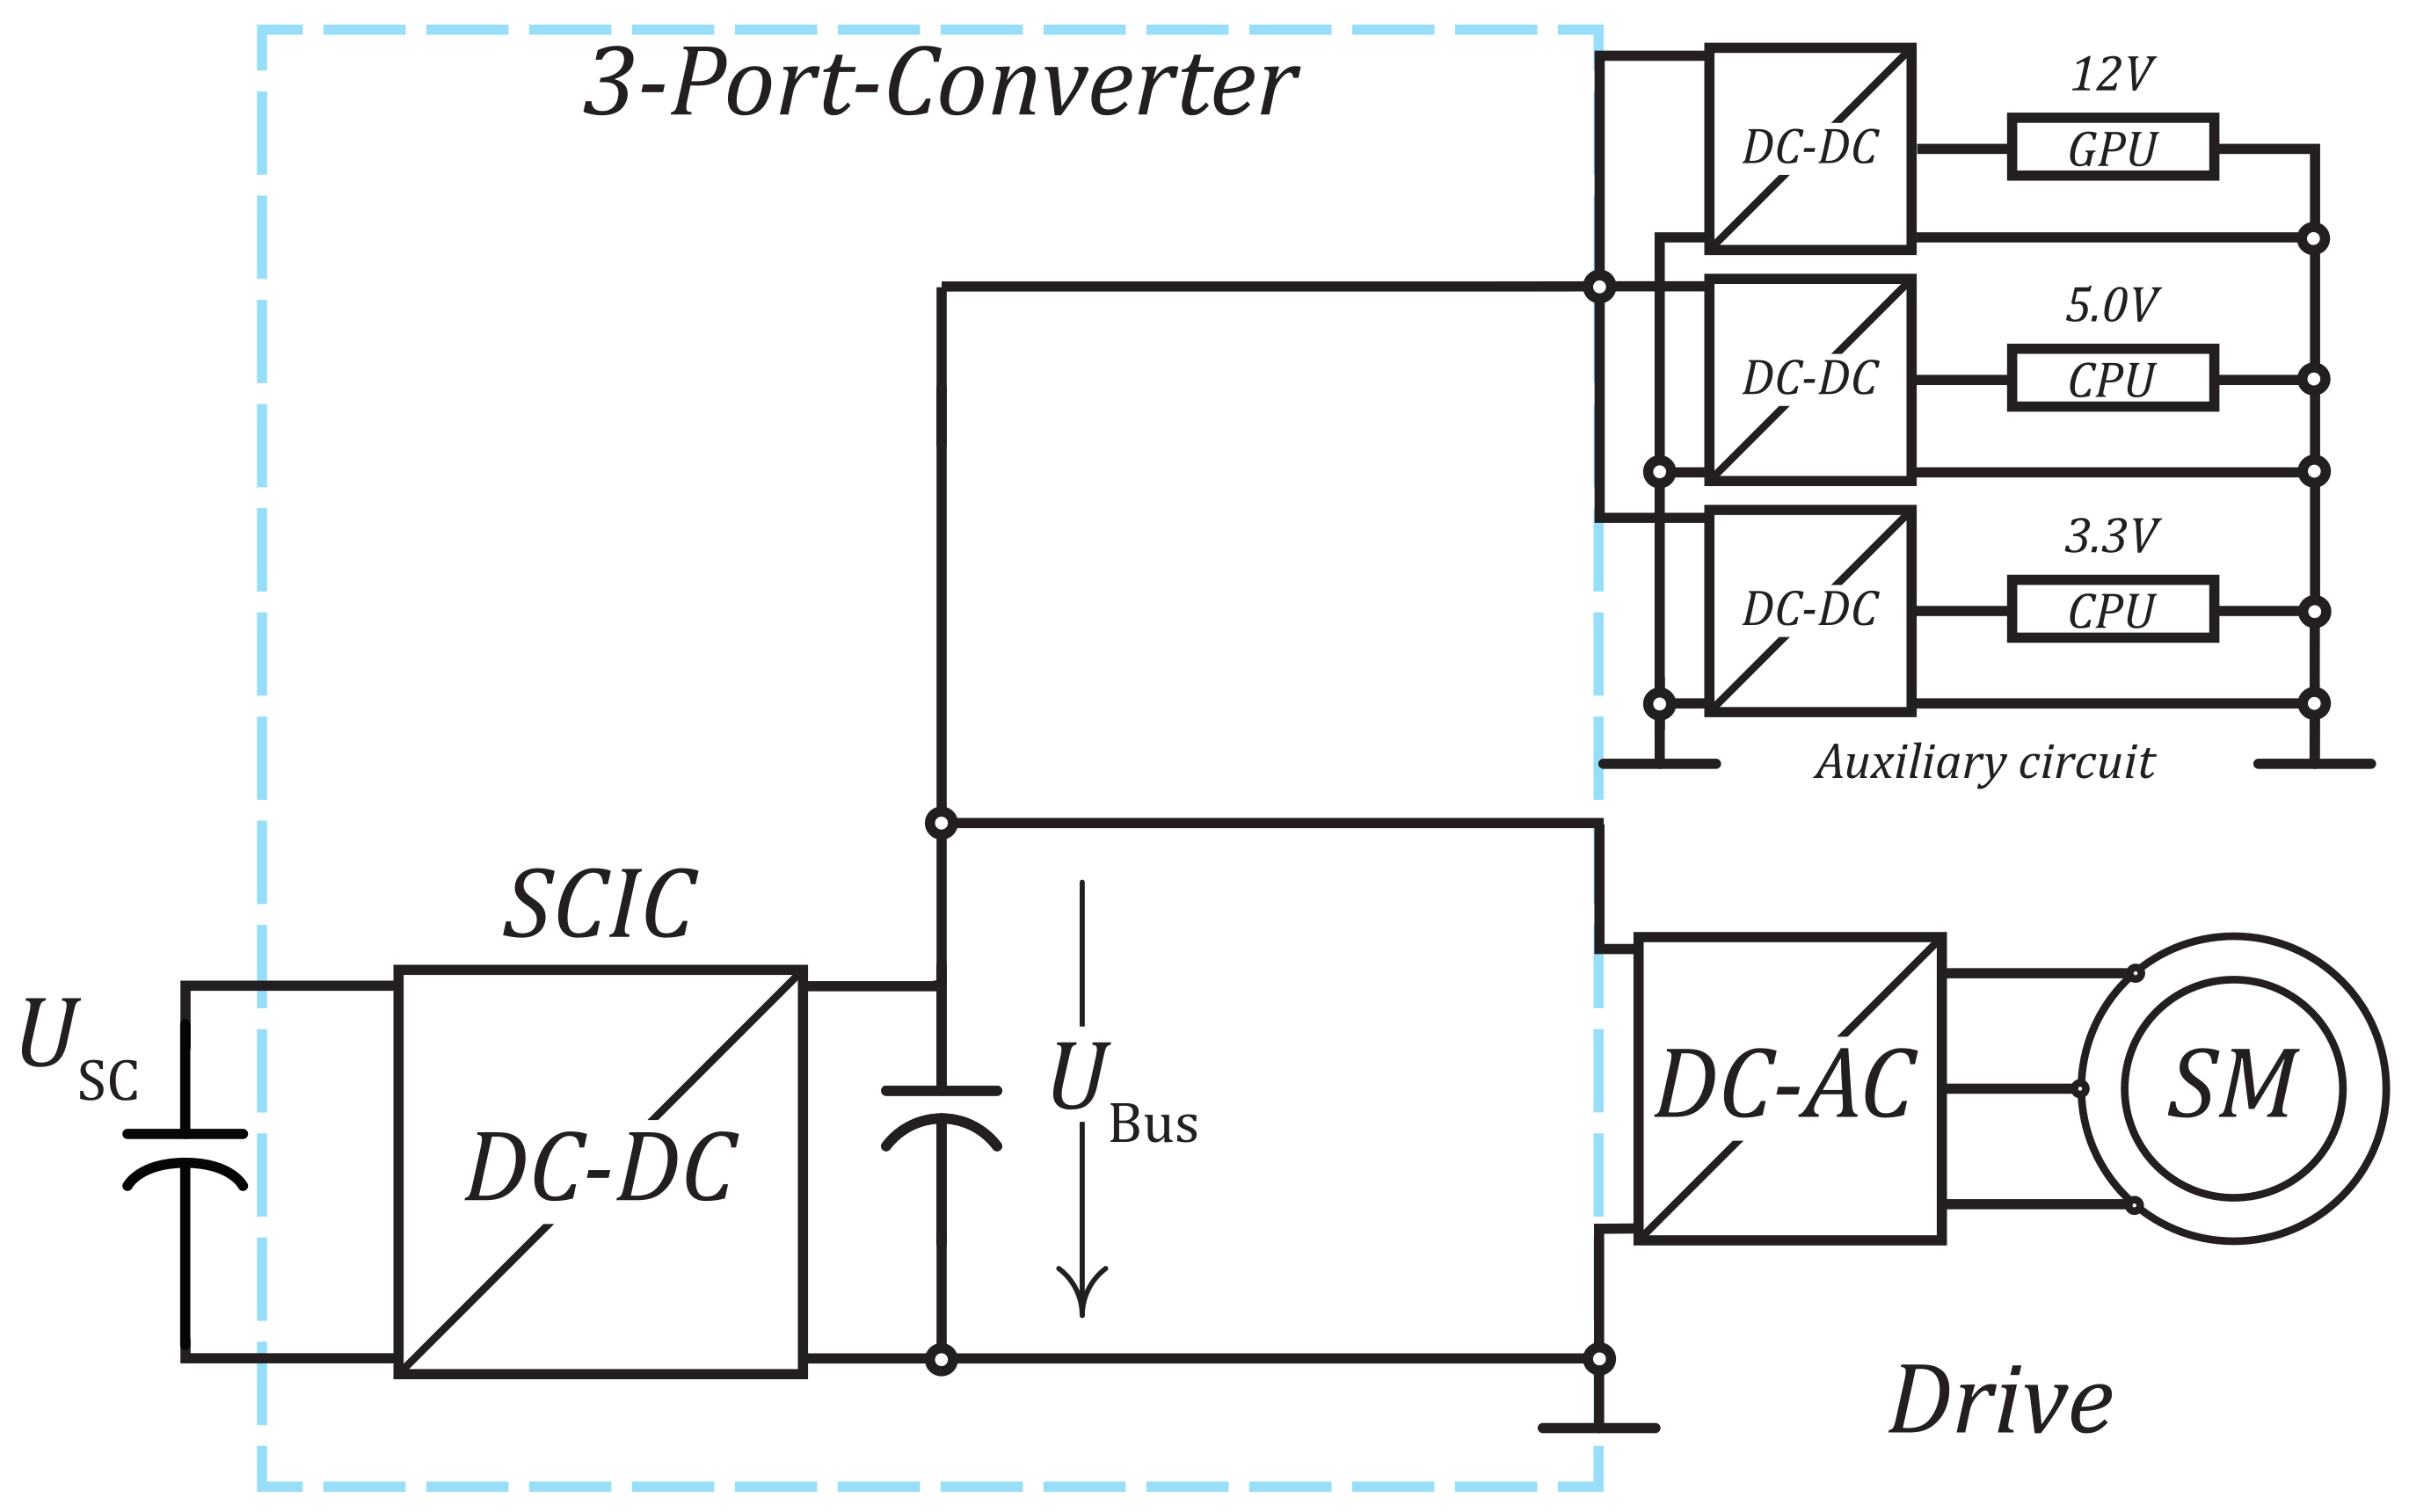
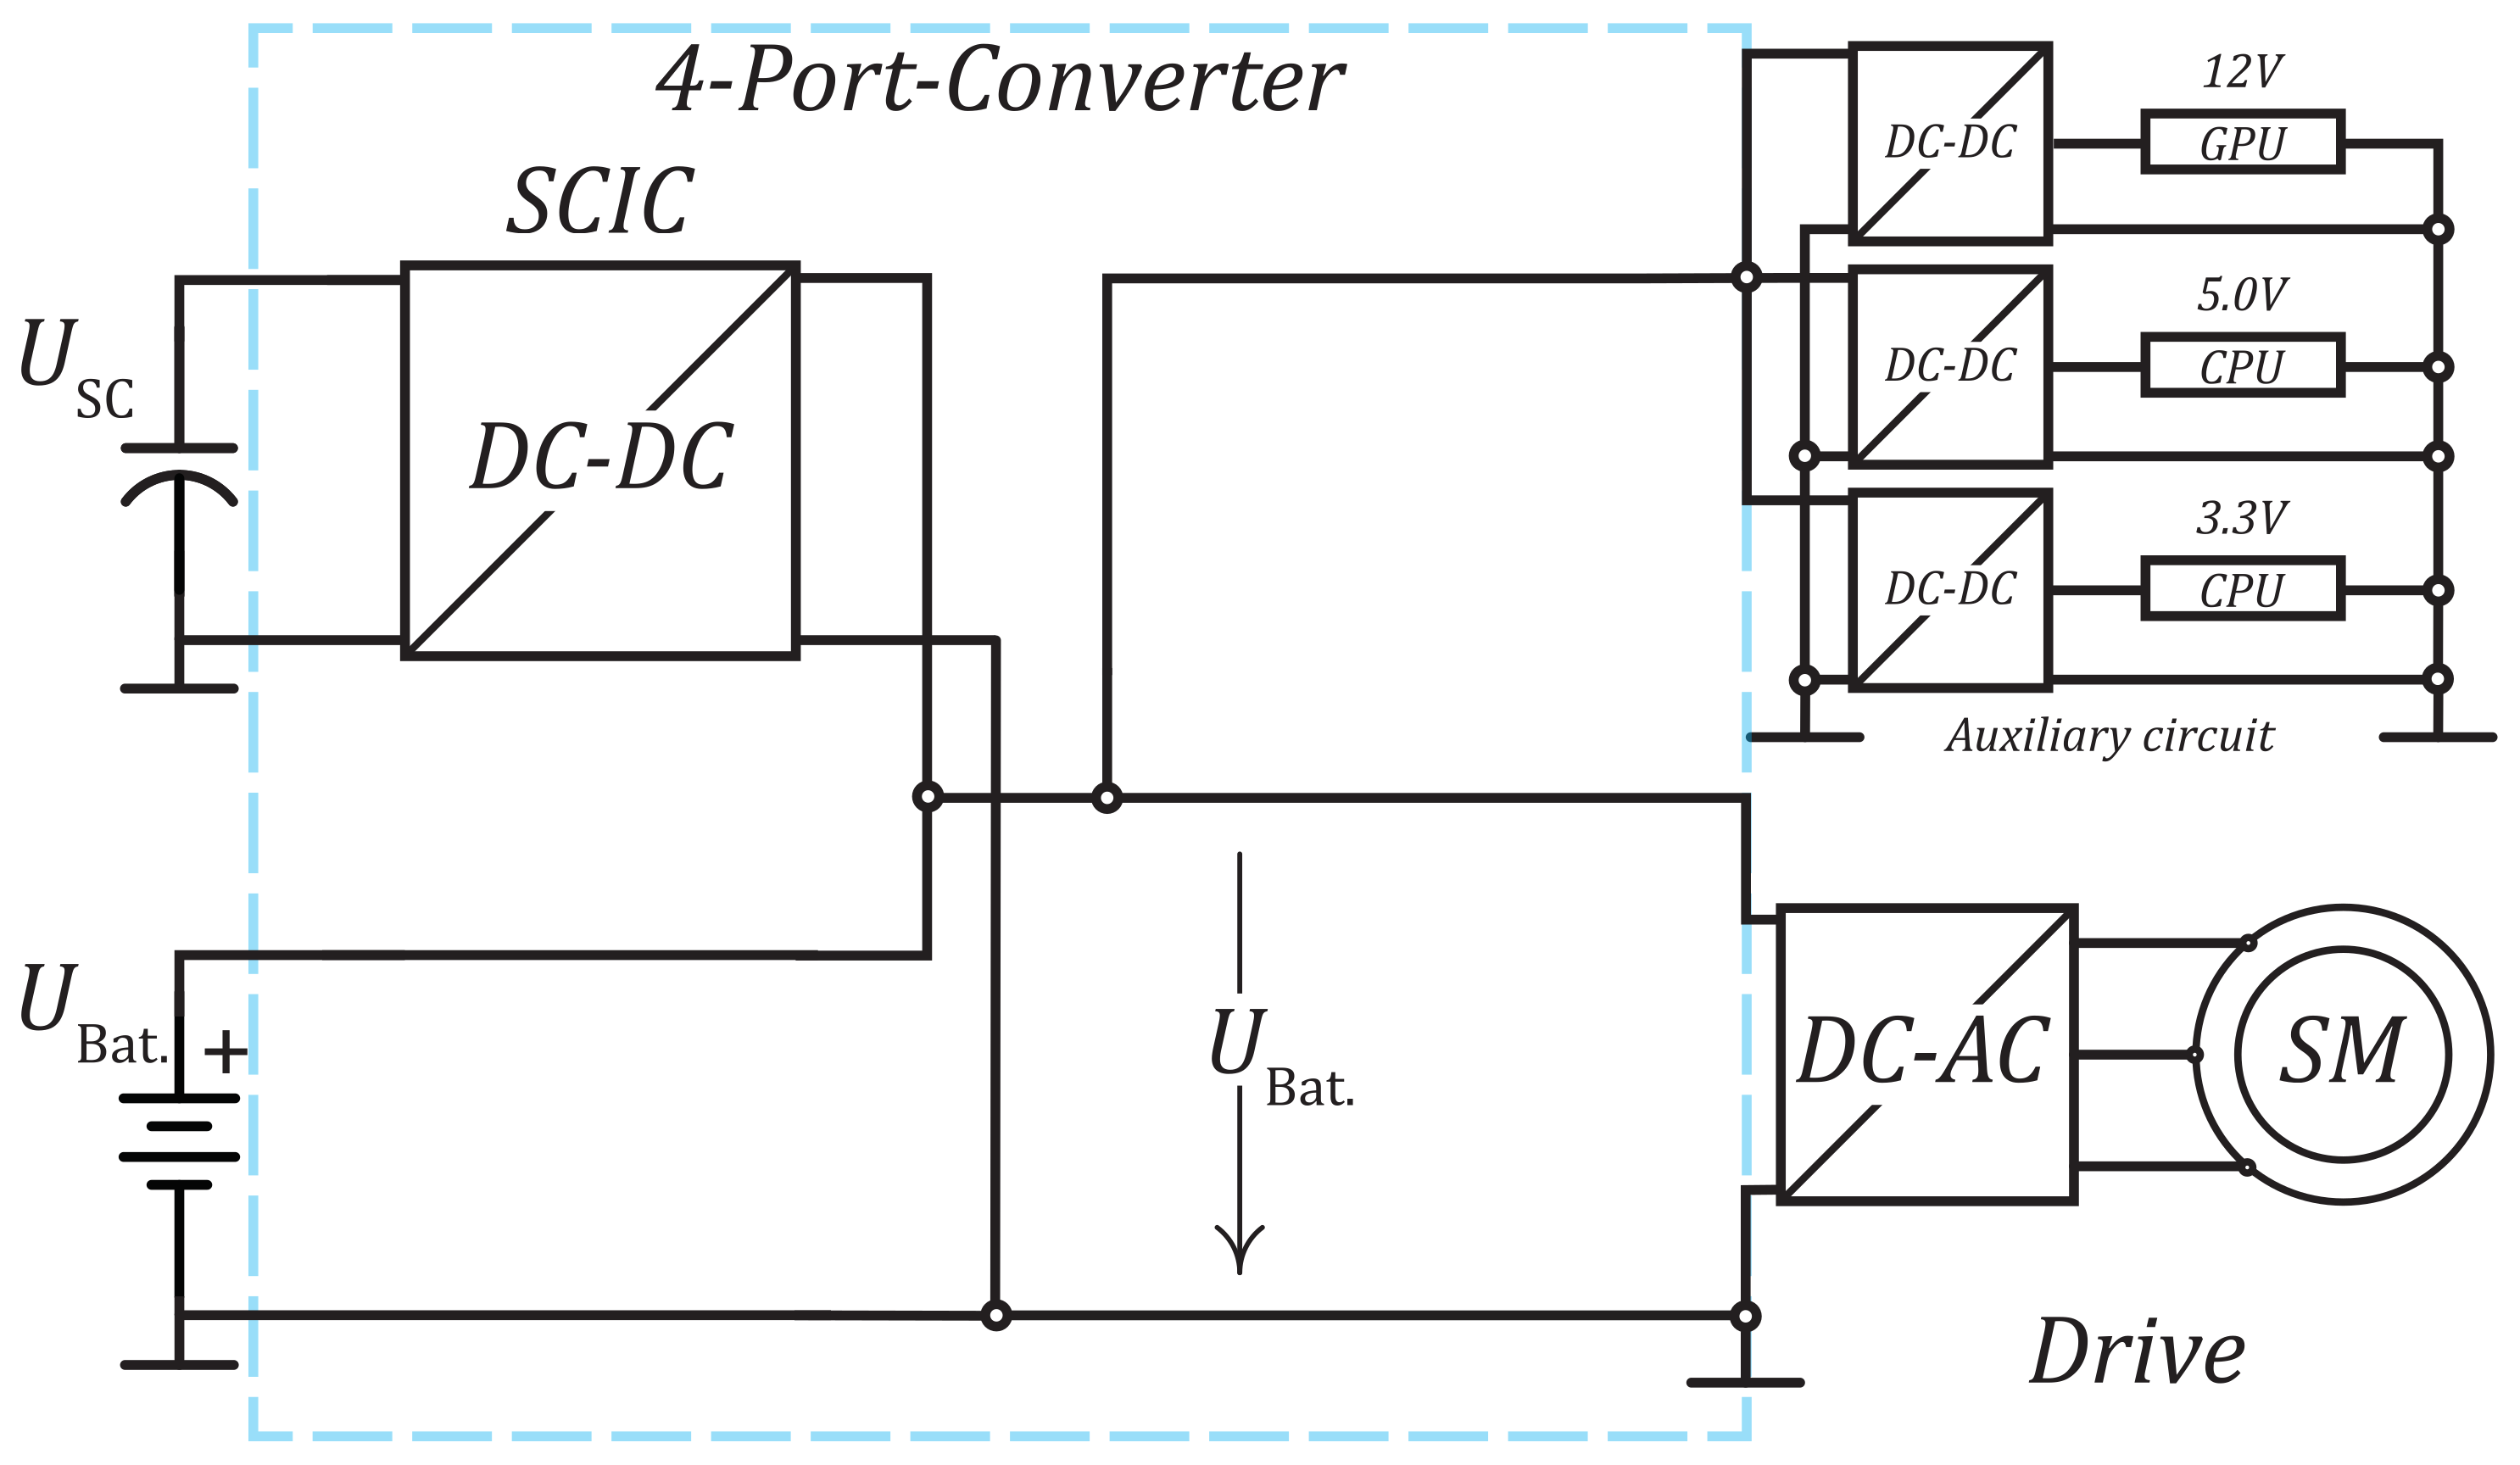
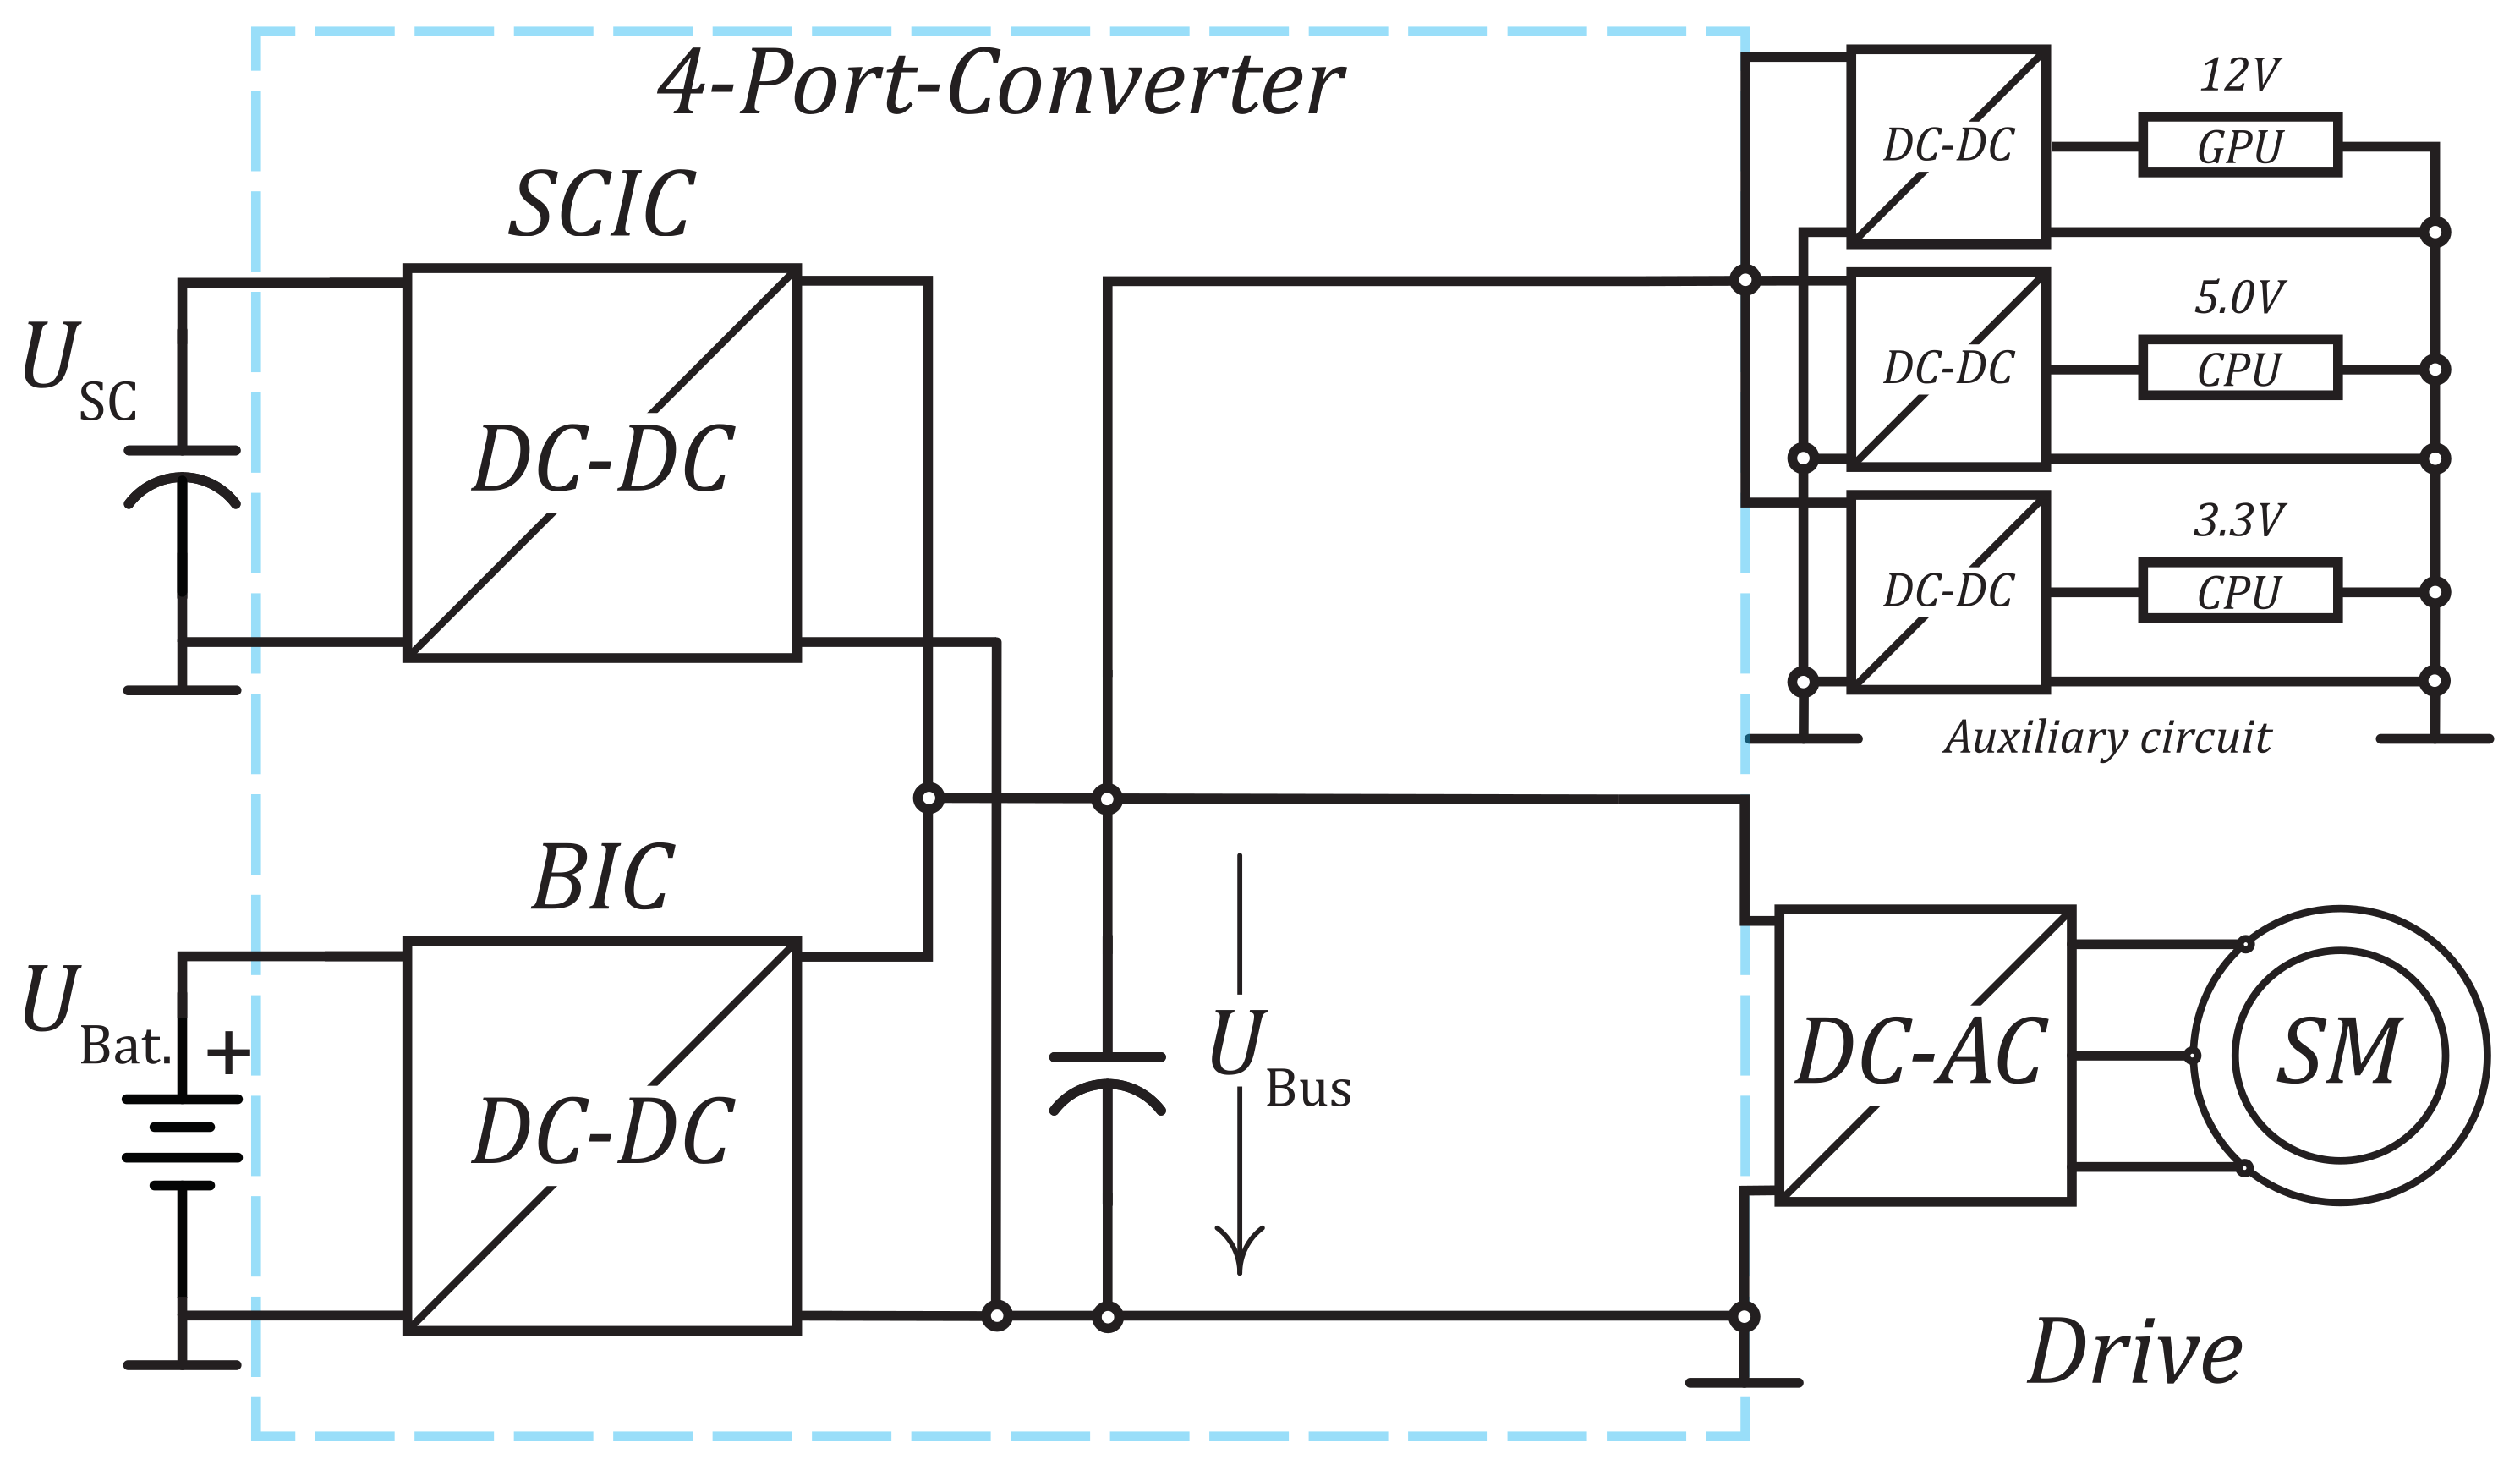
To distribute the available power and energy to different loads such as electric drives or auxiliary circuits, a static power converter is needed. This can be enabled either with a 3-Port converter or with a 4-Port converter, as shown in Figure 2.
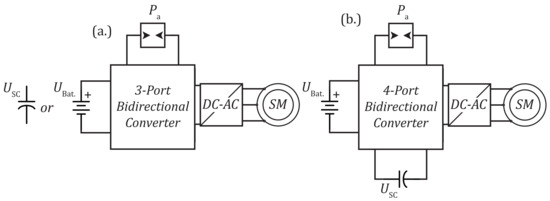
Figure 2.
Overview of the possible connections of the energy distributions converter: (a) A 3-Port bidirectional converter for battery or super-capacitor (single energy storage system); (b) A 4-Port bidirectional converter with combination of battery and super-capacitor-module (hybrid energy storage system).
In order to be able to make a situation-specific selection, the various options for the design of the 3-Port converter as well as the 4-Port converter are described. In this paper, the advantages and disadvantages of the respective topologies are first described and finally compared with each other.
2. Energy Storage Systems
The energy storage systems (ESS) for mobile robots consists of the power supply that delivers the energy to the motors. The power supply allows for bidirectional power flow and energy recuperation during the braking process. The power distribution structure can be 3-Port (Figure 2a) for single energy storage systems (SESS) (with battery or super-capacitor) or 4-Port (Figure 2b) for the hybrid energy storage systems (HESS), where the battery is used in combination with a super-capacitor.
For the analysis conducted in this paper, the robot Kuka KMP 600-S will be considered, with his specifications shown in Table 2, for all the calculations.
Table 2.
Specifications of the considered robot.
2.1. Single Energy Storage System
A single energy storage system (SESS) consists of only one type of energy storage device such as a battery or super-capacitor. For the battery storage, commercially available batteries were selected, as shown in Table 1. All of the different battery designs are selected to match the power/energy specification, marked as a green circle in Figure 3. To achieve a power of 3000 W and an energy of 1500 Wh according to Table 2, 3 Easy Block 48s are required to obtain the minimum amount of energy, but the power is 3 times oversized. To match the same specification, only one Easy Pro 48 is needed, but both the energy and power are oversized two times or higher. Lastly, two Easy Blade 48s are necessary to obtain the minimum amount of power, but then the energy is double the requirement.
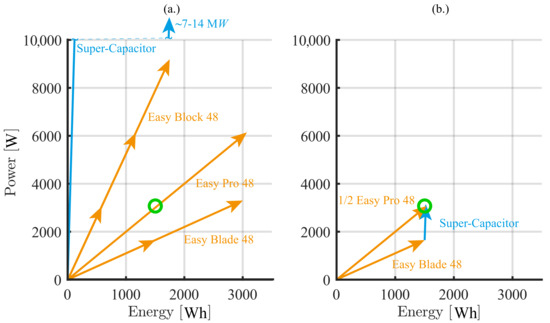
Figure 3.
Graphical representation according to Figure 1 of the different possibilities to achieve the system goals with real values: (a) With an oversized battery or the super-capacitor module; (b) A hybrid solution consisting of the combination of the battery with an optimally designed super-capacitor module.
In Table 3 and Table 4, the specifications for the super-capacitors’ designs are shown. The first design is calculated to store the same energy as the battery of 1514 Wh and, therefore, is vastly oversized in weight (783 kg). The Kuka KMP-S AGV, chosen as an example for this publication, has a total unloaded vehicle mass weight of 280 kg. Therefore, this design is massively oversized in weight, with around three times the weight of the AGV. The second design has an energy of 189 Wh, which is 8 times less, and the robot will also have 8 times less operating time with a weight of 136.8 kg; this weight is still too high, as it represents close to half of the AGV’s weight. Finally, the third design has 24 times less energy (63 Wh) and operating time, and the weight is reduced to only 53.3 kg. This comparison is summarized in Table 5. The weight of the third super-capacitor design is manageable, but it is still higher than the weight of the commercial batteries from Table 1. Additionally, the operating time is now more than one order of magnitude lower. Typical AGV’s have operating times in the range of several hours, so this will mean that with these super-capacitor designs, it is in the range of minutes, which is not acceptable for an AGV.
Table 3.
Electrical specifications of super-capacitor modules based on SESS.
Table 4.
Electrical and physical specifications of super-capacitor modules based on SESS.
Table 5.
Comparison of the weight of the different super-capacitor SESS, considering the weight and volume of the robot (280 kg/262.5 ).
2.2. Hybrid Energy Storage Systems
An HESS consists of the combination of a battery and an additional super-capacitor module to filter the peak power pulses that occur. The super-capacitor handles the peak power, while the battery handles the peak energy, this helps to optimize the designs of both. Figure 3 and Table 6 show the effects of matching a high energy battery with an optimized super-capacitor. This comparison shows that this HESS has +103% of specific energy, +8% specific power, and weight/volume reduced by 48% compared to SESS. The same method as in Figure 1 is used in Figure 3 to visualise the real values for power and energy from Table 1 and Table 3.
Table 6.
Comparison of the batteries for the different topologies.
In order to integrate the batteries and super-capacitors, some interface converters are necessary: the battery interface converters (BIC) and the super-capacitor interface converters (SCIC).
3. Comparison of the Topologies
In this section, the different topologies for SESS and HESS will be presented and compared. First, the topologies are briefly explained, and the advantages and disadvantages are listed. After that, a qualitative comparison is performed and a quantitative comparison of the efficiencies and densities is made using Pareto front analysis. The section ends with a summary of the comparison.
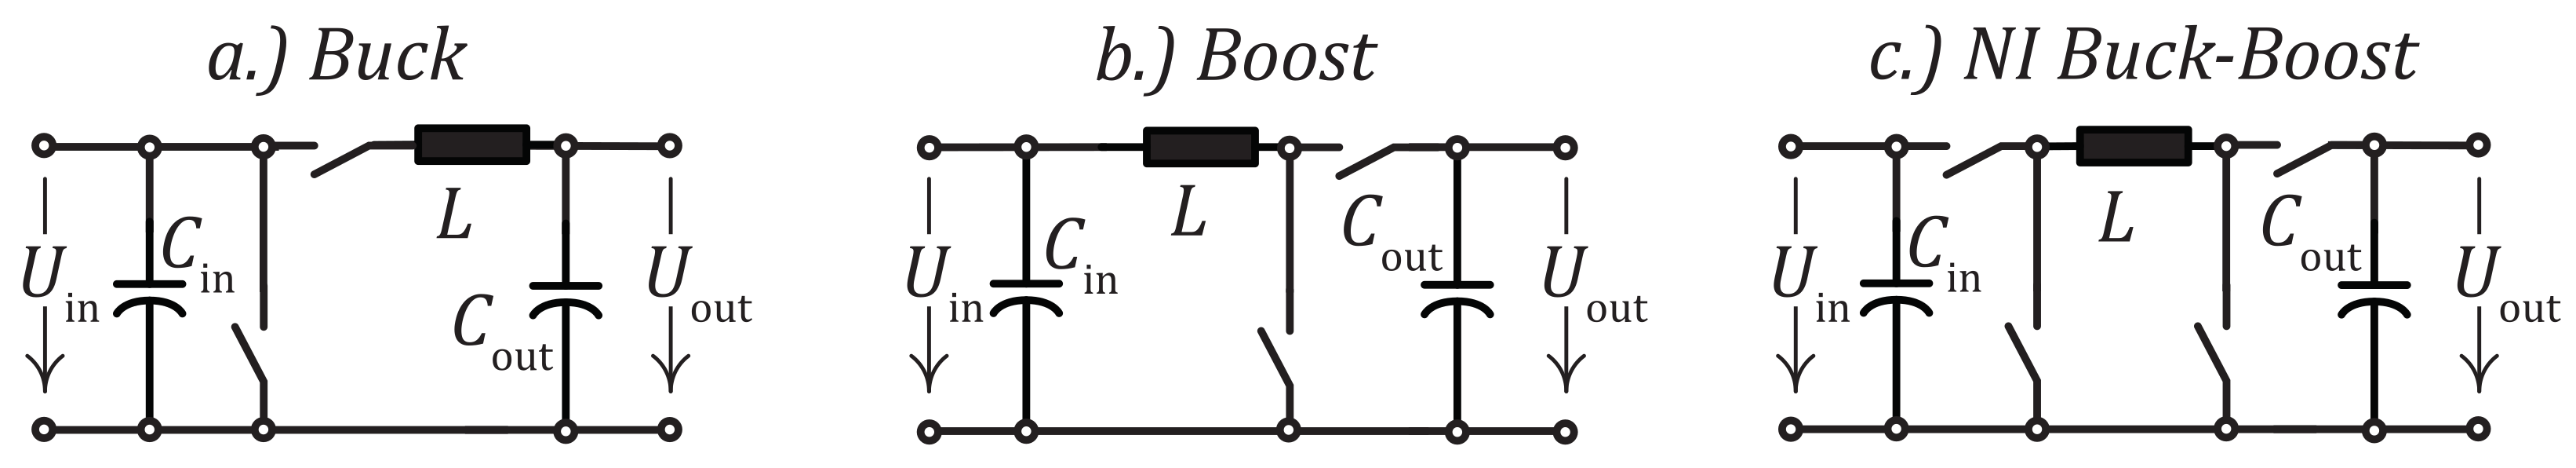
To ensure a fair comparison, only basic non-isolated converters are considered for the BIC and SCIC. These topologies are the Buck, Boost, and non-inverting Buck–Boost (NI Buck–Boost), as depicted in Figure 4. Advanced topology solutions such as interleaved multi-phased converters could significantly improve the results [9,16]. However, these topologies are not within the scope of this publication and therefore will not be included in the design calculations.
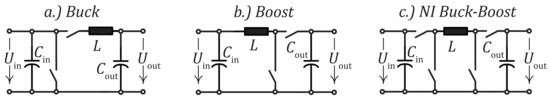
Figure 4.
Considered DC–DC Converters: (a) Buck Converter; (b) Boost Converter; (c) Non-inverting (NI) Buck–Boost Converter.
3.1. Energy Storage System Topologies
This section presents eight energy storage system topologies to power a mobile robot or AGV. Topologies I, II, III, and IV are for redSESS, and Topologies V, VI, VII, and VIII are for redHESS. The hybrid topologies V to VIII should still be able to function without a super-capacitor module and interface. This excludes all topologies in which the super-capacitor module is connected to the system directly or without an interface converter. An overview of the subsystems contained in Topologies I–VIII is shown in the following Table 7.
Table 7.
Sub-systems of the different topologies.
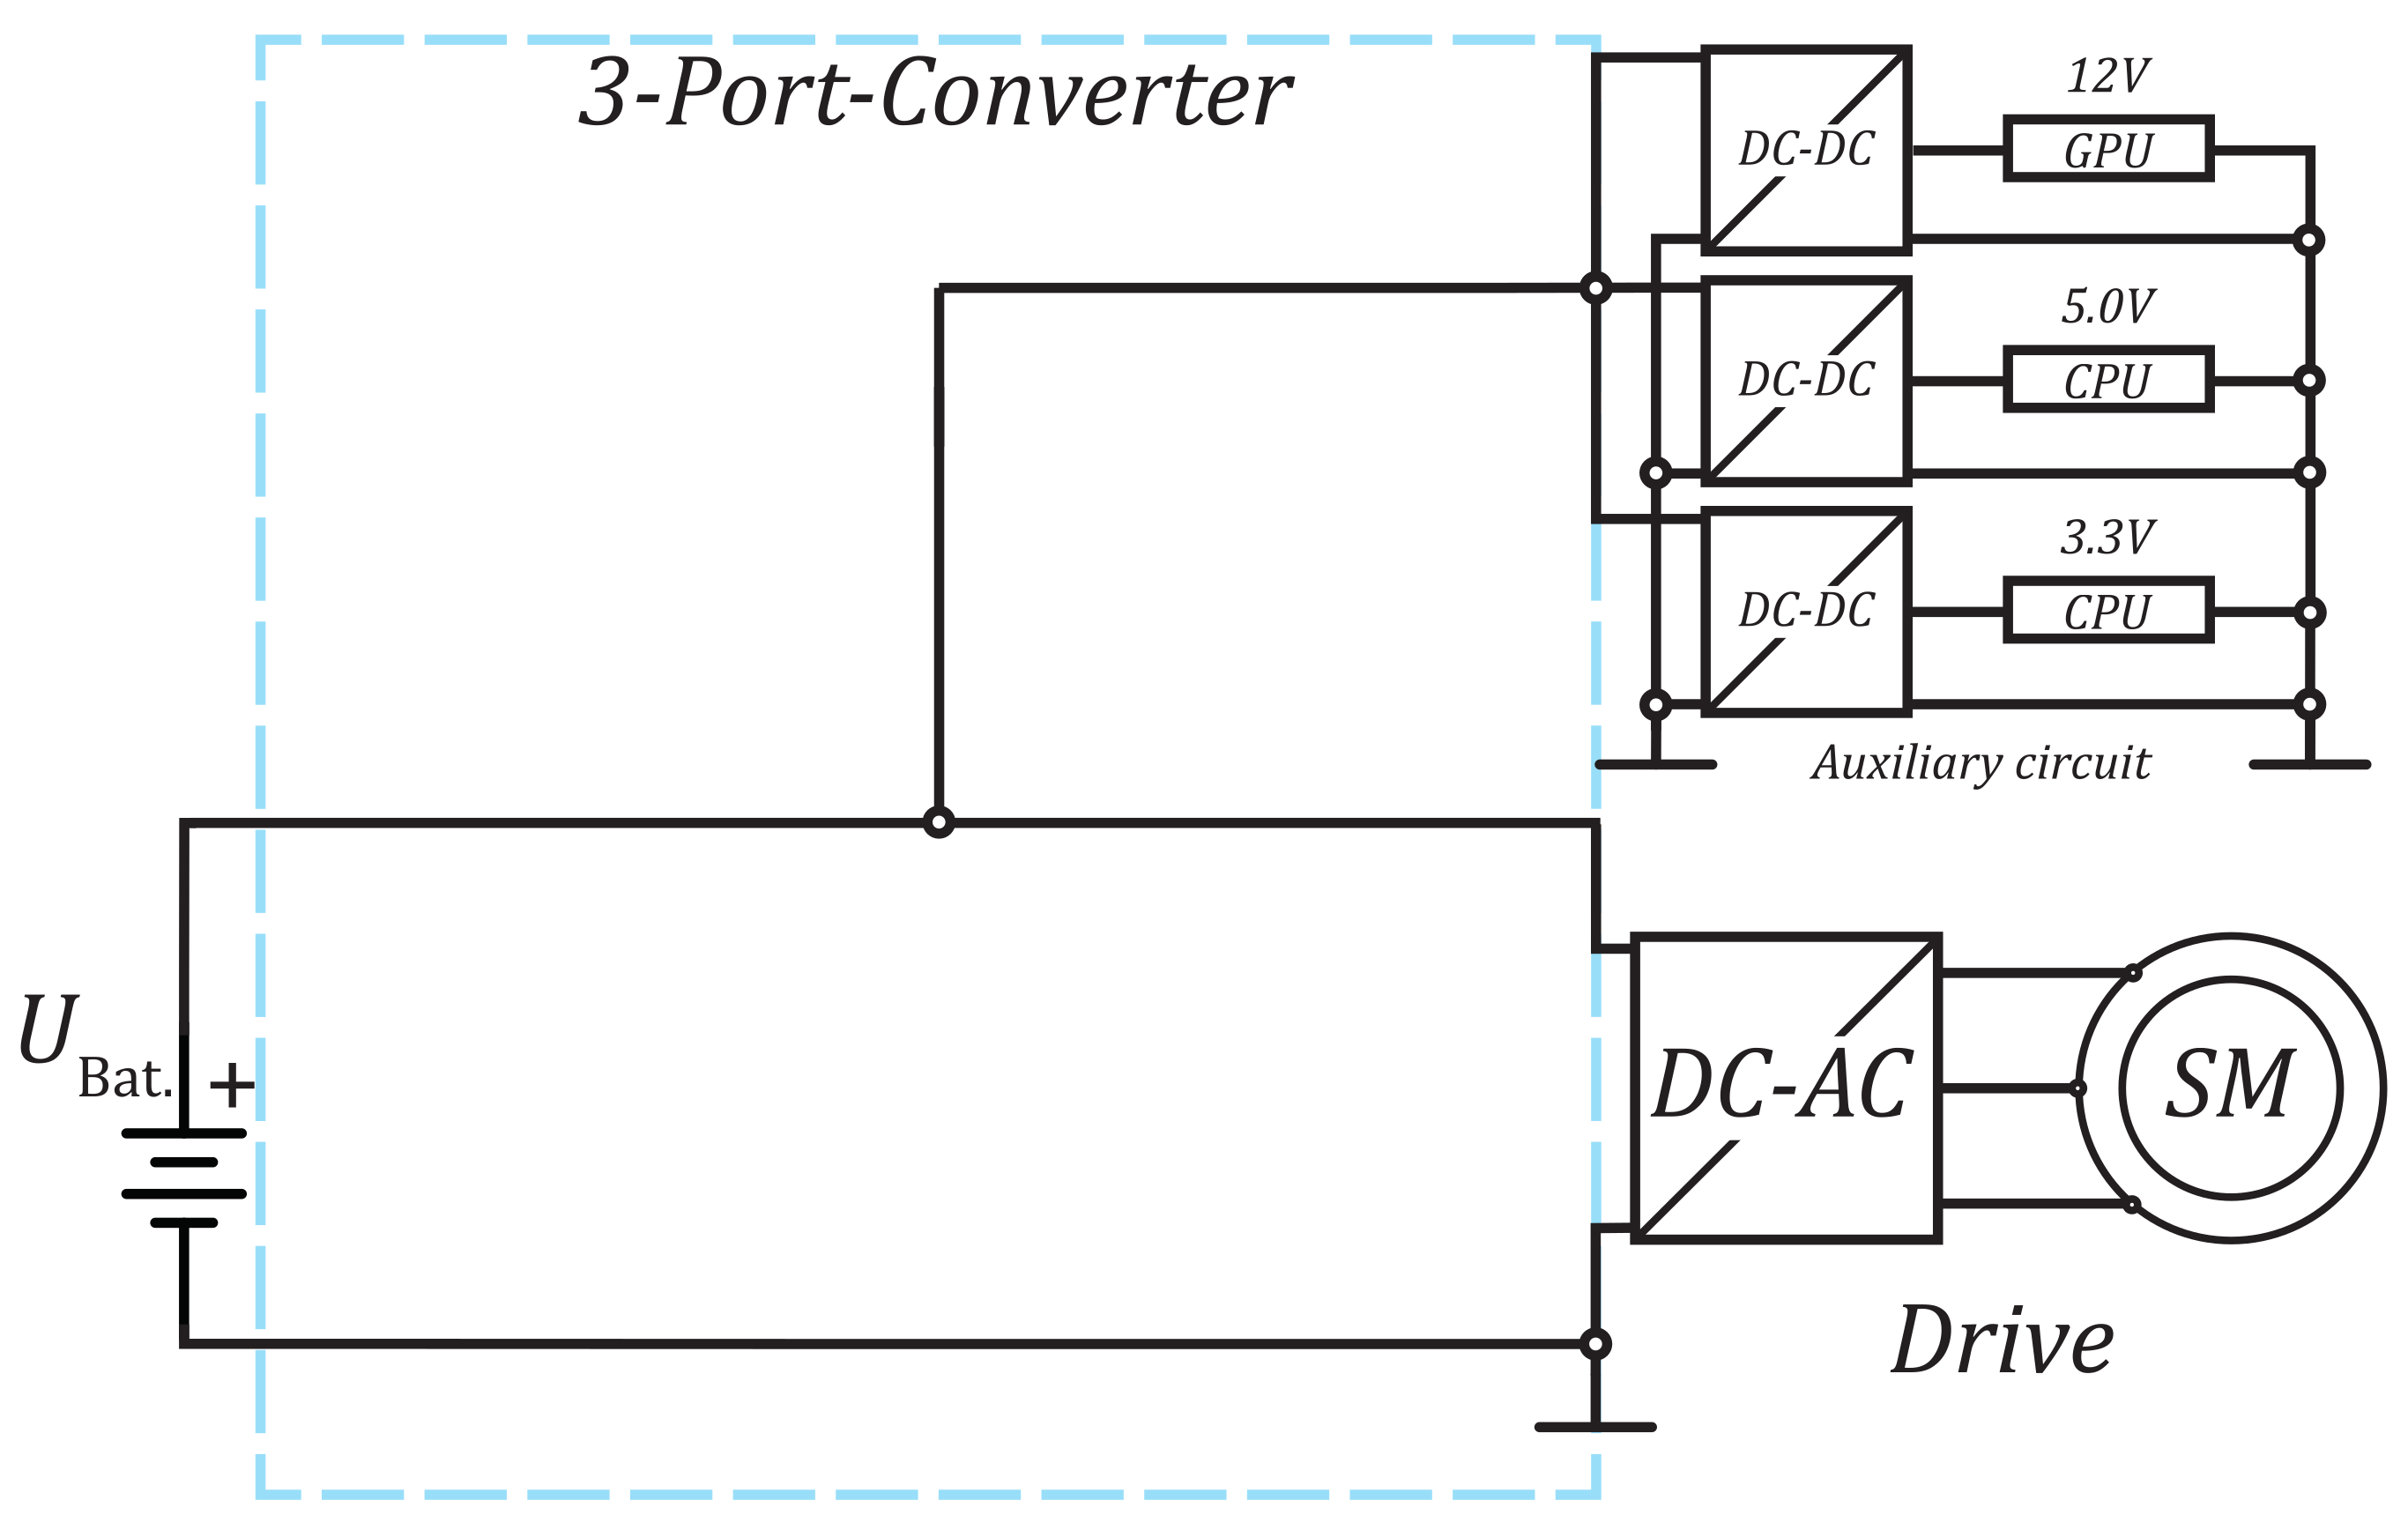
3.1.1. Topology I: Classic Energy Distribution
Today, the classic power supply is mainly found in low-cost applications and is characterised by the direct connection of the loads to the battery shown in Figure 5. The reasons for this are its simple implementation, simple control structures, and the reduction in costs due to the omission of a BIC. The drive and each individual auxiliary converter have to cope with the changing bus voltage [2], which is dependent on the battery voltage. In this setup, the bus voltage can rise and fall very quickly [1], as the fluctuation in the load or recovered energy returns directly to the battery. The reason for this is that the battery has parasitic resistances and capacitances [17,18] and also parasitic inductance due to the lead wires and terminals [18].
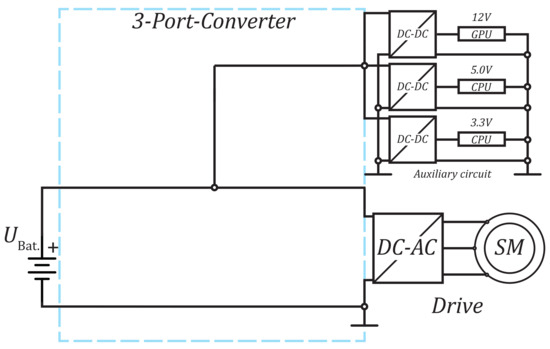
Figure 5.
Topology I: Auxiliary circuits and drives are connected directly to the battery. The bus voltage is equal to the battery voltage which depends on the state of charge.
The advantage of Topology I is that few components have to interact with each other. Since this design does not have an interface converter to the battery, the development of a control system is not necessary. In addition, the fewer components are involved in a system, the lower the probability of faults. The costs for development are drastically reduced. However, the direct connection to the energy storage system has its drawbacks because all load fluctuations are reflected in the energy storage system. This also affects the life expectancy of the Li-ion battery since all partial load cycles are absorbed by the battery and contribute to its ageing. The advantage and disadvantages of Topology I are shown in Table 8.
Table 8.
Advantage and disadvantages Topology I.
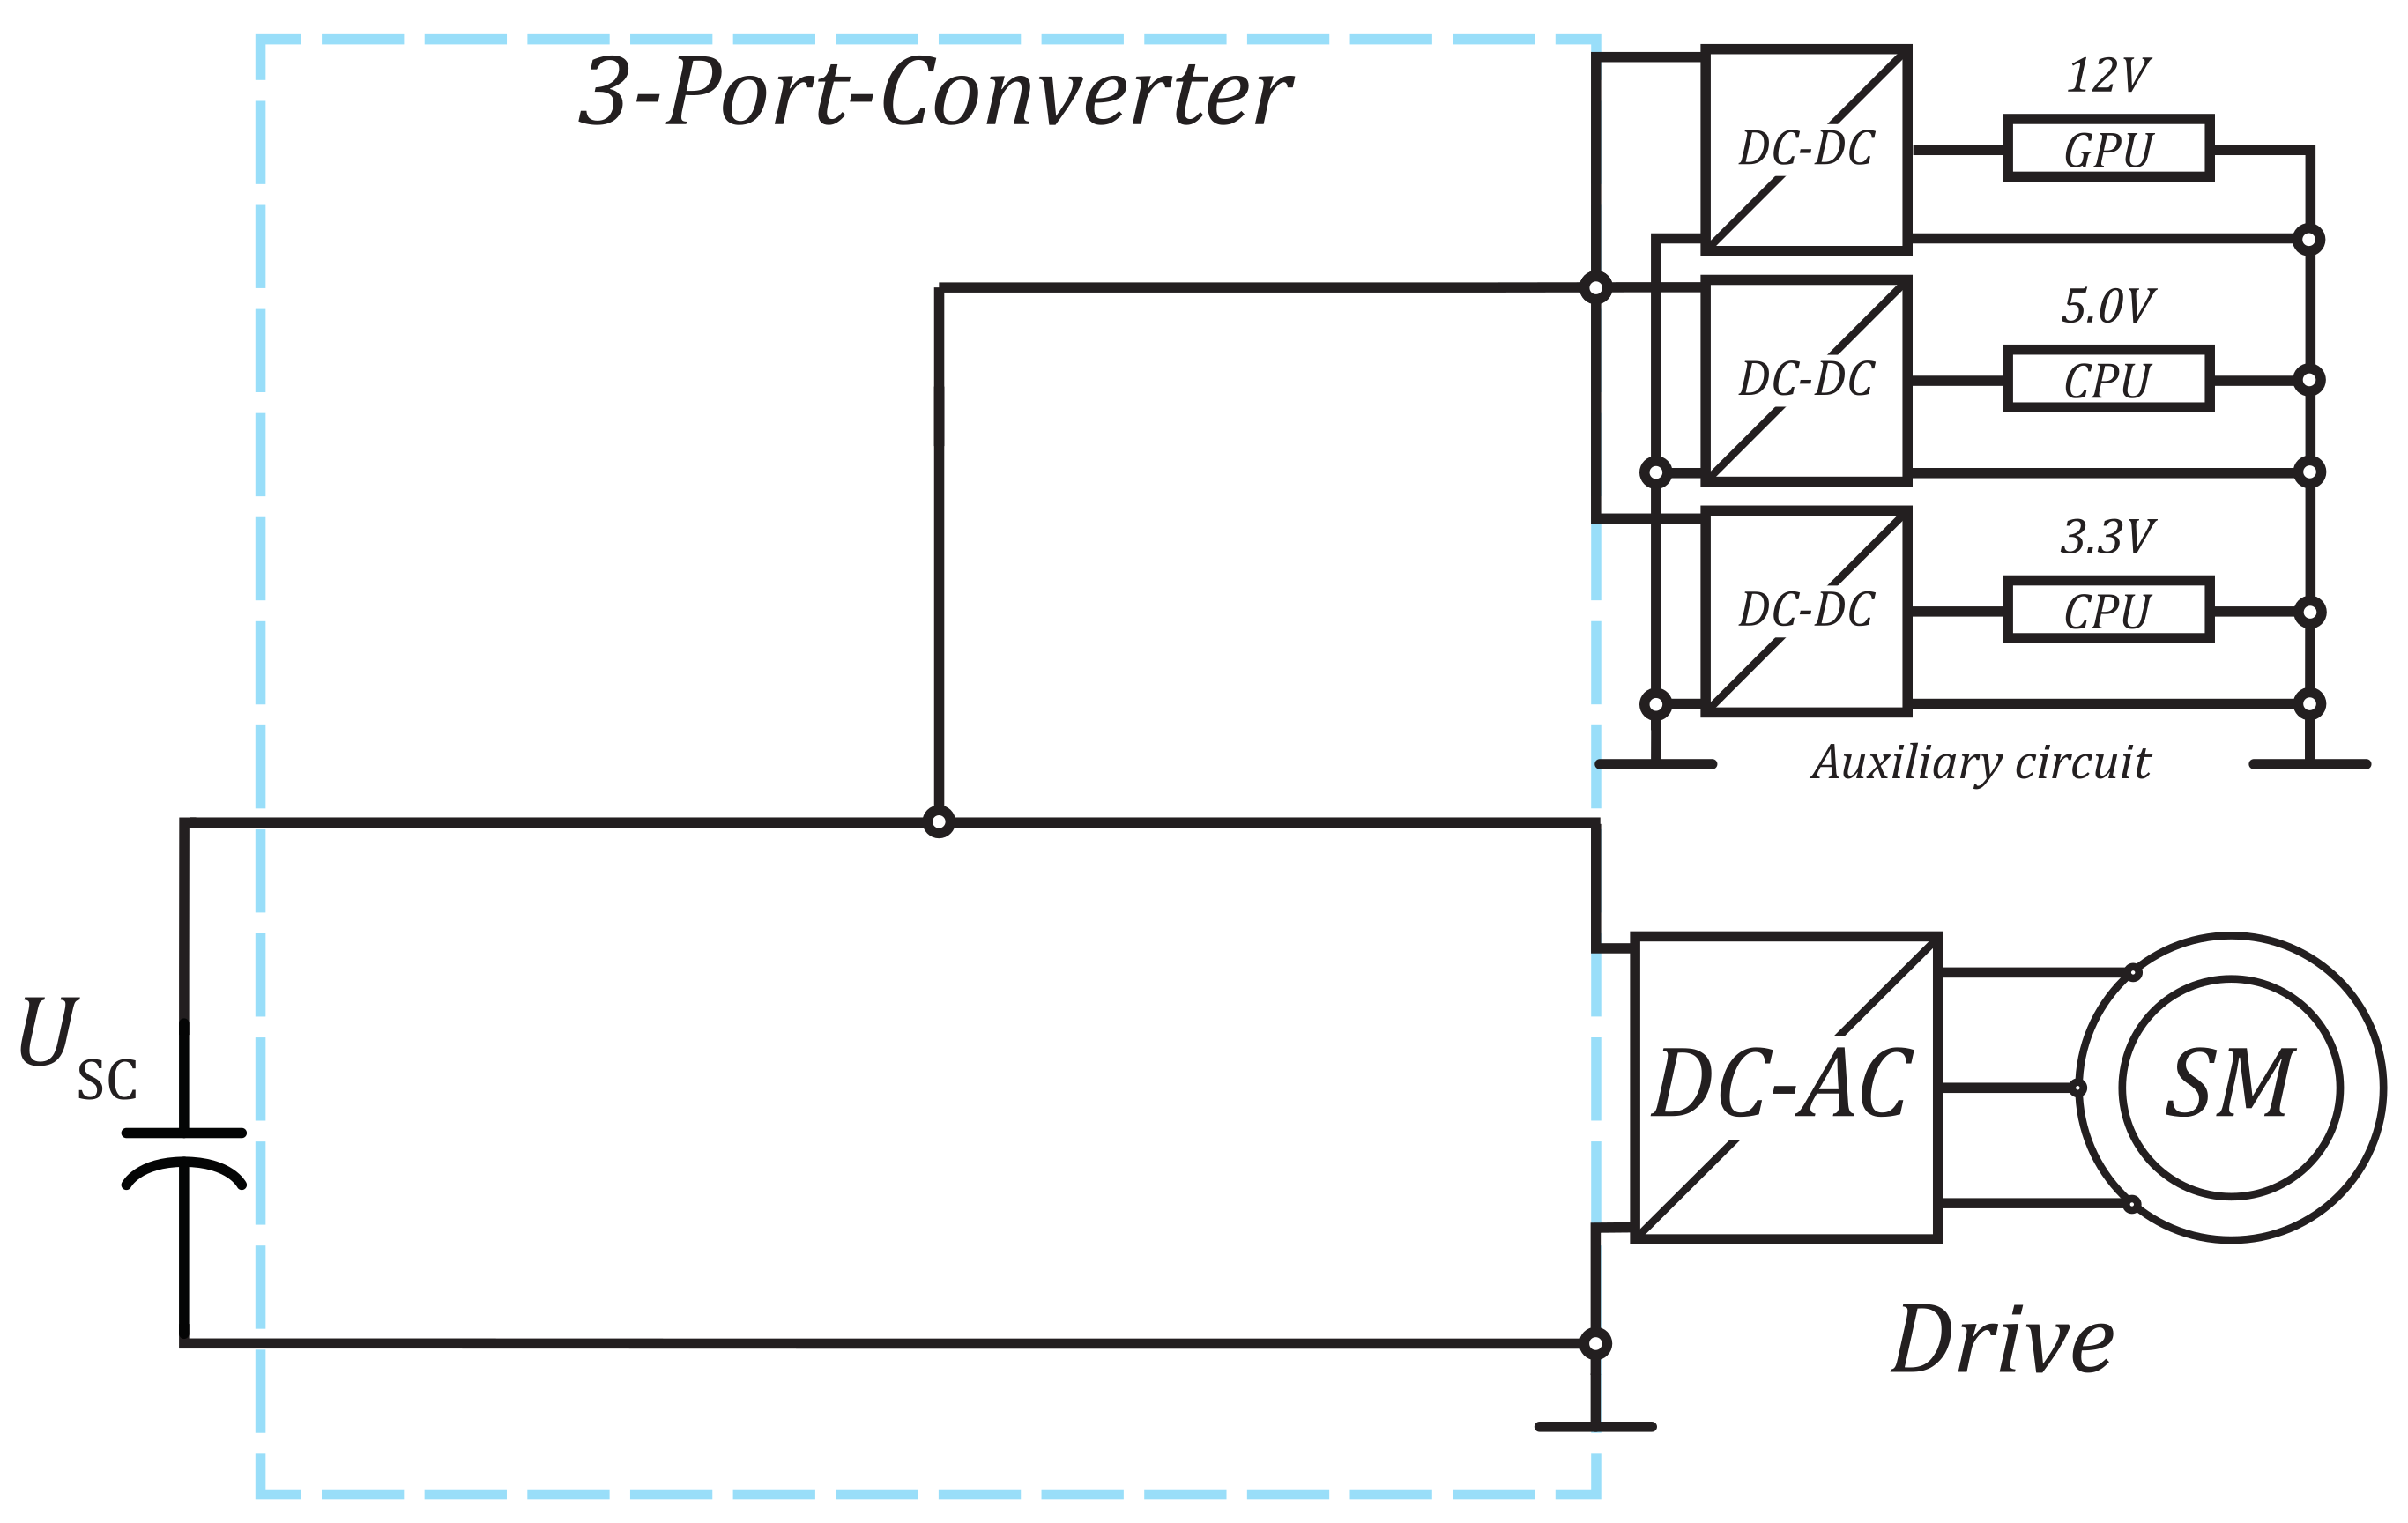
3.1.2. Topology II: Classic Energy Distribution with Super-Capacitor
This approach of the classic power supply is mainly found in low-cost applications with less need for for high-density energy storage with many places for opportunity charging and characterised by the direct connection of the loads to the super-capacitor shown in Figure 6. The reasons for this are the simple implementation, simple control structures, and the reduction in costs due to the omission of a super-capacitor interface converter. The drive and each individual auxiliary converter have to cope with the changing bus voltage [2], which is dependent on the super-capacitor voltage. In this setup, the bus voltage can rise and fall very quickly depending on the energy demands of the system and its low energy density.
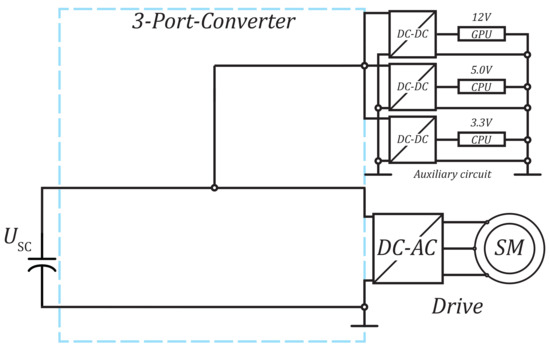
Figure 6.
Topology II: Auxiliary circuits and drives are connected directly to the super-capacitor. The bus voltage is equal to the super-capacitor voltage, which depends on the state of charge.
In contrast to Topology I, the energy storage in Topology II consists of a super-capacitor module that can be discharged and charged in less time than a battery. The main disadvantage is that these energy storage devices are not suitable for long-term energy storage. Furthermore, all subsequent converters must be designed for a wider voltage range. However, it can be designed as opportunity charging system, which will require a high number of charging stations. The advantage and disadvantages of Topology II are shown in Table 9.
Table 9.
Advantage and disadvantages of Topology II.
3.1.3. Topology III: Standard Energy Distribution
Due to the wide availability of DC–DC converters, the topology with an interface converter for the battery (Figure 7) has become established. This allows a stable bus voltage independent of the battery charge and the resulting battery voltage. The auxiliary converters can now refer to the stable bus. This has the advantage for the inverter that it can always refer to the same voltage, thus providing a constant speed range for the downstream motor. In addition, the DC–DC converter interface can be used to mitigate fluctuations such as energy recovery within the system limits.
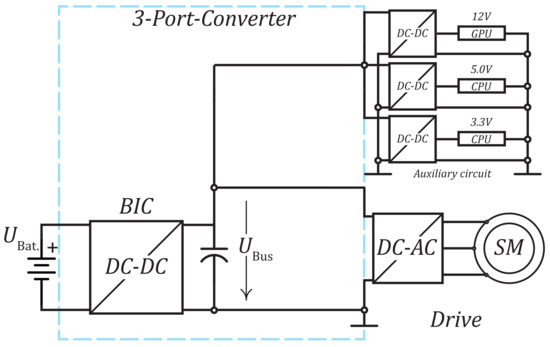
Figure 7.
Topology III: Interface converter between the battery and auxiliary circuits.
Topology III with an interface converter has increased the number of components compared to Topology I, but this also enables the establishment of a voltage bus that is independent of the battery voltage. This voltage bus is very helpful for the subsequent converters, such as the auxiliary circuits and the drive, as they no longer have to be designed for a wide voltage range. Small fluctuations can be compensated by the interface converter, but large fluctuations such as energy recovery still have a large influence on the bus voltage. In addition, all recovered energy is fed back directly into the battery, causing it to age. The advantage and disadvantages of Topology III are shown in Table 10.
Table 10.
Advantage and disadvantages Topology III.
3.1.4. Topology IV: Standard Energy Distribution with Super-Capacitor
This approach of the Standard energy distribution substitute the battery with an super-capacitor compare Figure 8 with Figure 7. This also allows a stable bus voltage independent of the super-capacitor charge and the resulting super-capacitor voltage. The auxiliary converters can also refer to the stable bus. This has the advantage for the inverter that it can always refer to the same voltage, thus providing a constant speed range for the downstream motor. In addition, the DC–DC converter interface can be used to mitigate fluctuations such as energy recovery.
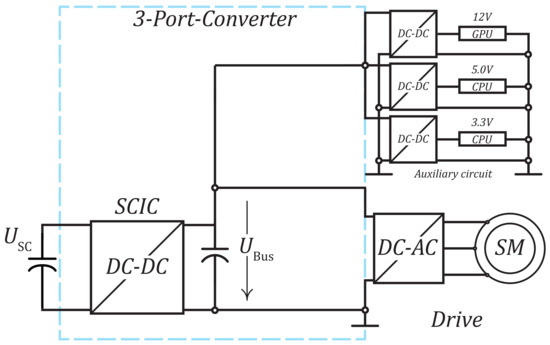
Figure 8.
Topology IV: Interface converter between the super-capacitor and auxiliary circuits.
Topology IV with an interface converter is the extended version of topology II and allows the establishment of a voltage bus independent of the super-capacitor. This voltage bus is very helpful in all of the hybrid topologies, as it helps reduce the worst cases for the designs of the auxiliary circuits. Compared to previous topology, higher fluctuations such as energy recovery can be compensated by the ICSC and the energy fully stored in super-capacitor. The advantage and disadvantages of Topology IV are shown in Table 11.
Table 11.
Advantage and disadvantages Topology IV.
3.1.5. Topology V: Classic Power Distribution Solution with Super-Capacitor Module and Interface Converter
The Topology from Figure 5 is extended to include a super-capacitor module and an interface converter, as shown in Figure 9. This concept represents the first 4-Port converter in this comparison. This concept has a battery-dependent bus voltage like the first concept. In the event of recuperation, large parts of the energy peaks can be stored in the super-capacitor module via the ICSC. This stored energy can then be fed back into the system when needed.
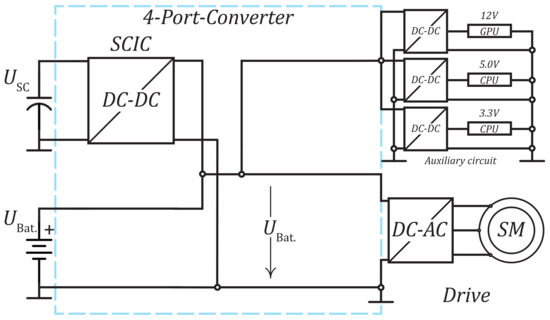
Figure 9.
Topology V: Extension of the Classic solution with a super-capacitor module and an interface converter.
Topology V is the first hybrid topology. Therefore, it has the benefits of combining the battery and super-capacitor and can meet the requirements without oversizing either. This leads to a reduction in the battery/super-capacitor size, as was previously depicted in Figure 3. The battery aging is then reduced by the equivalent partial charge cycles of the battery due to the energy recovery being assigned to the super-capacitor, which can handle higher charge cycles. This leads to an increase in battery life-time. This Topology requires an SCIC to handle the voltage fluctuations and ensure a smooth charging of the super-capacitor. On the other hand, it does not require a BIC. The advantage and disadvantages of Topology V are shown in Table 12.
Table 12.
Advantage and disadvantages Topology V.
3.1.6. Topology VI: Standard Energy Distribution Solution with Super-Capacitor Module and Interface Converter
The Topology IV from Figure 7 is extended by a super-capacitor module and an interface converter shown in Figure 10. This concept represents the second 4-Port converter in this comparison and is used in a variety of applications [3,4,9,10,12,18]. This concept has a stable bus like Topology III. In case of recuperation, these energy peaks can be stored via the interface converter of the super-capacitor module. This stored energy can then be fed back into the system as needed.
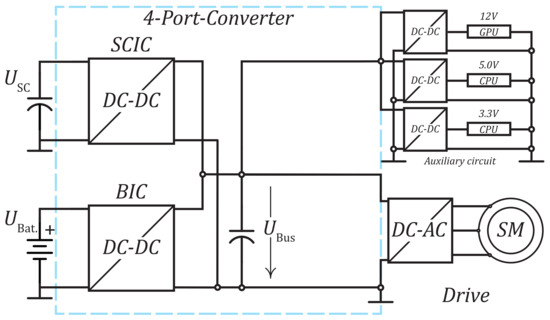
Figure 10.
Topology VI: Extension of the standard solution with a super-capacitor module and an interface converter.
Topology VI is like the previous topology but with an additional BIC. This ensures a constant and controlled voltage bus, which leads to improved design for all interface converters (SCIC and BIC) Additionally, the BIC and SCIC peak power loads are reduced. Unfortunately, a more complex control scheme is required to handle the interactions between the battery and super-capacitors.To ensure smooth interaction of the two interface converters, a complicated energy management algorithm must be established. The number of possible error sources increases due to the complexity and the number of components. The advantage and disadvantages of Topology VI are shown in Table 13.
Table 13.
Advantage and disadvantages Topology VI.
3.1.7. Topology VII: Advanced Energy Distribution Converter with Bus-Balancer, Super-Capacitor Module, Interface Converter, and Reduced Output Voltage
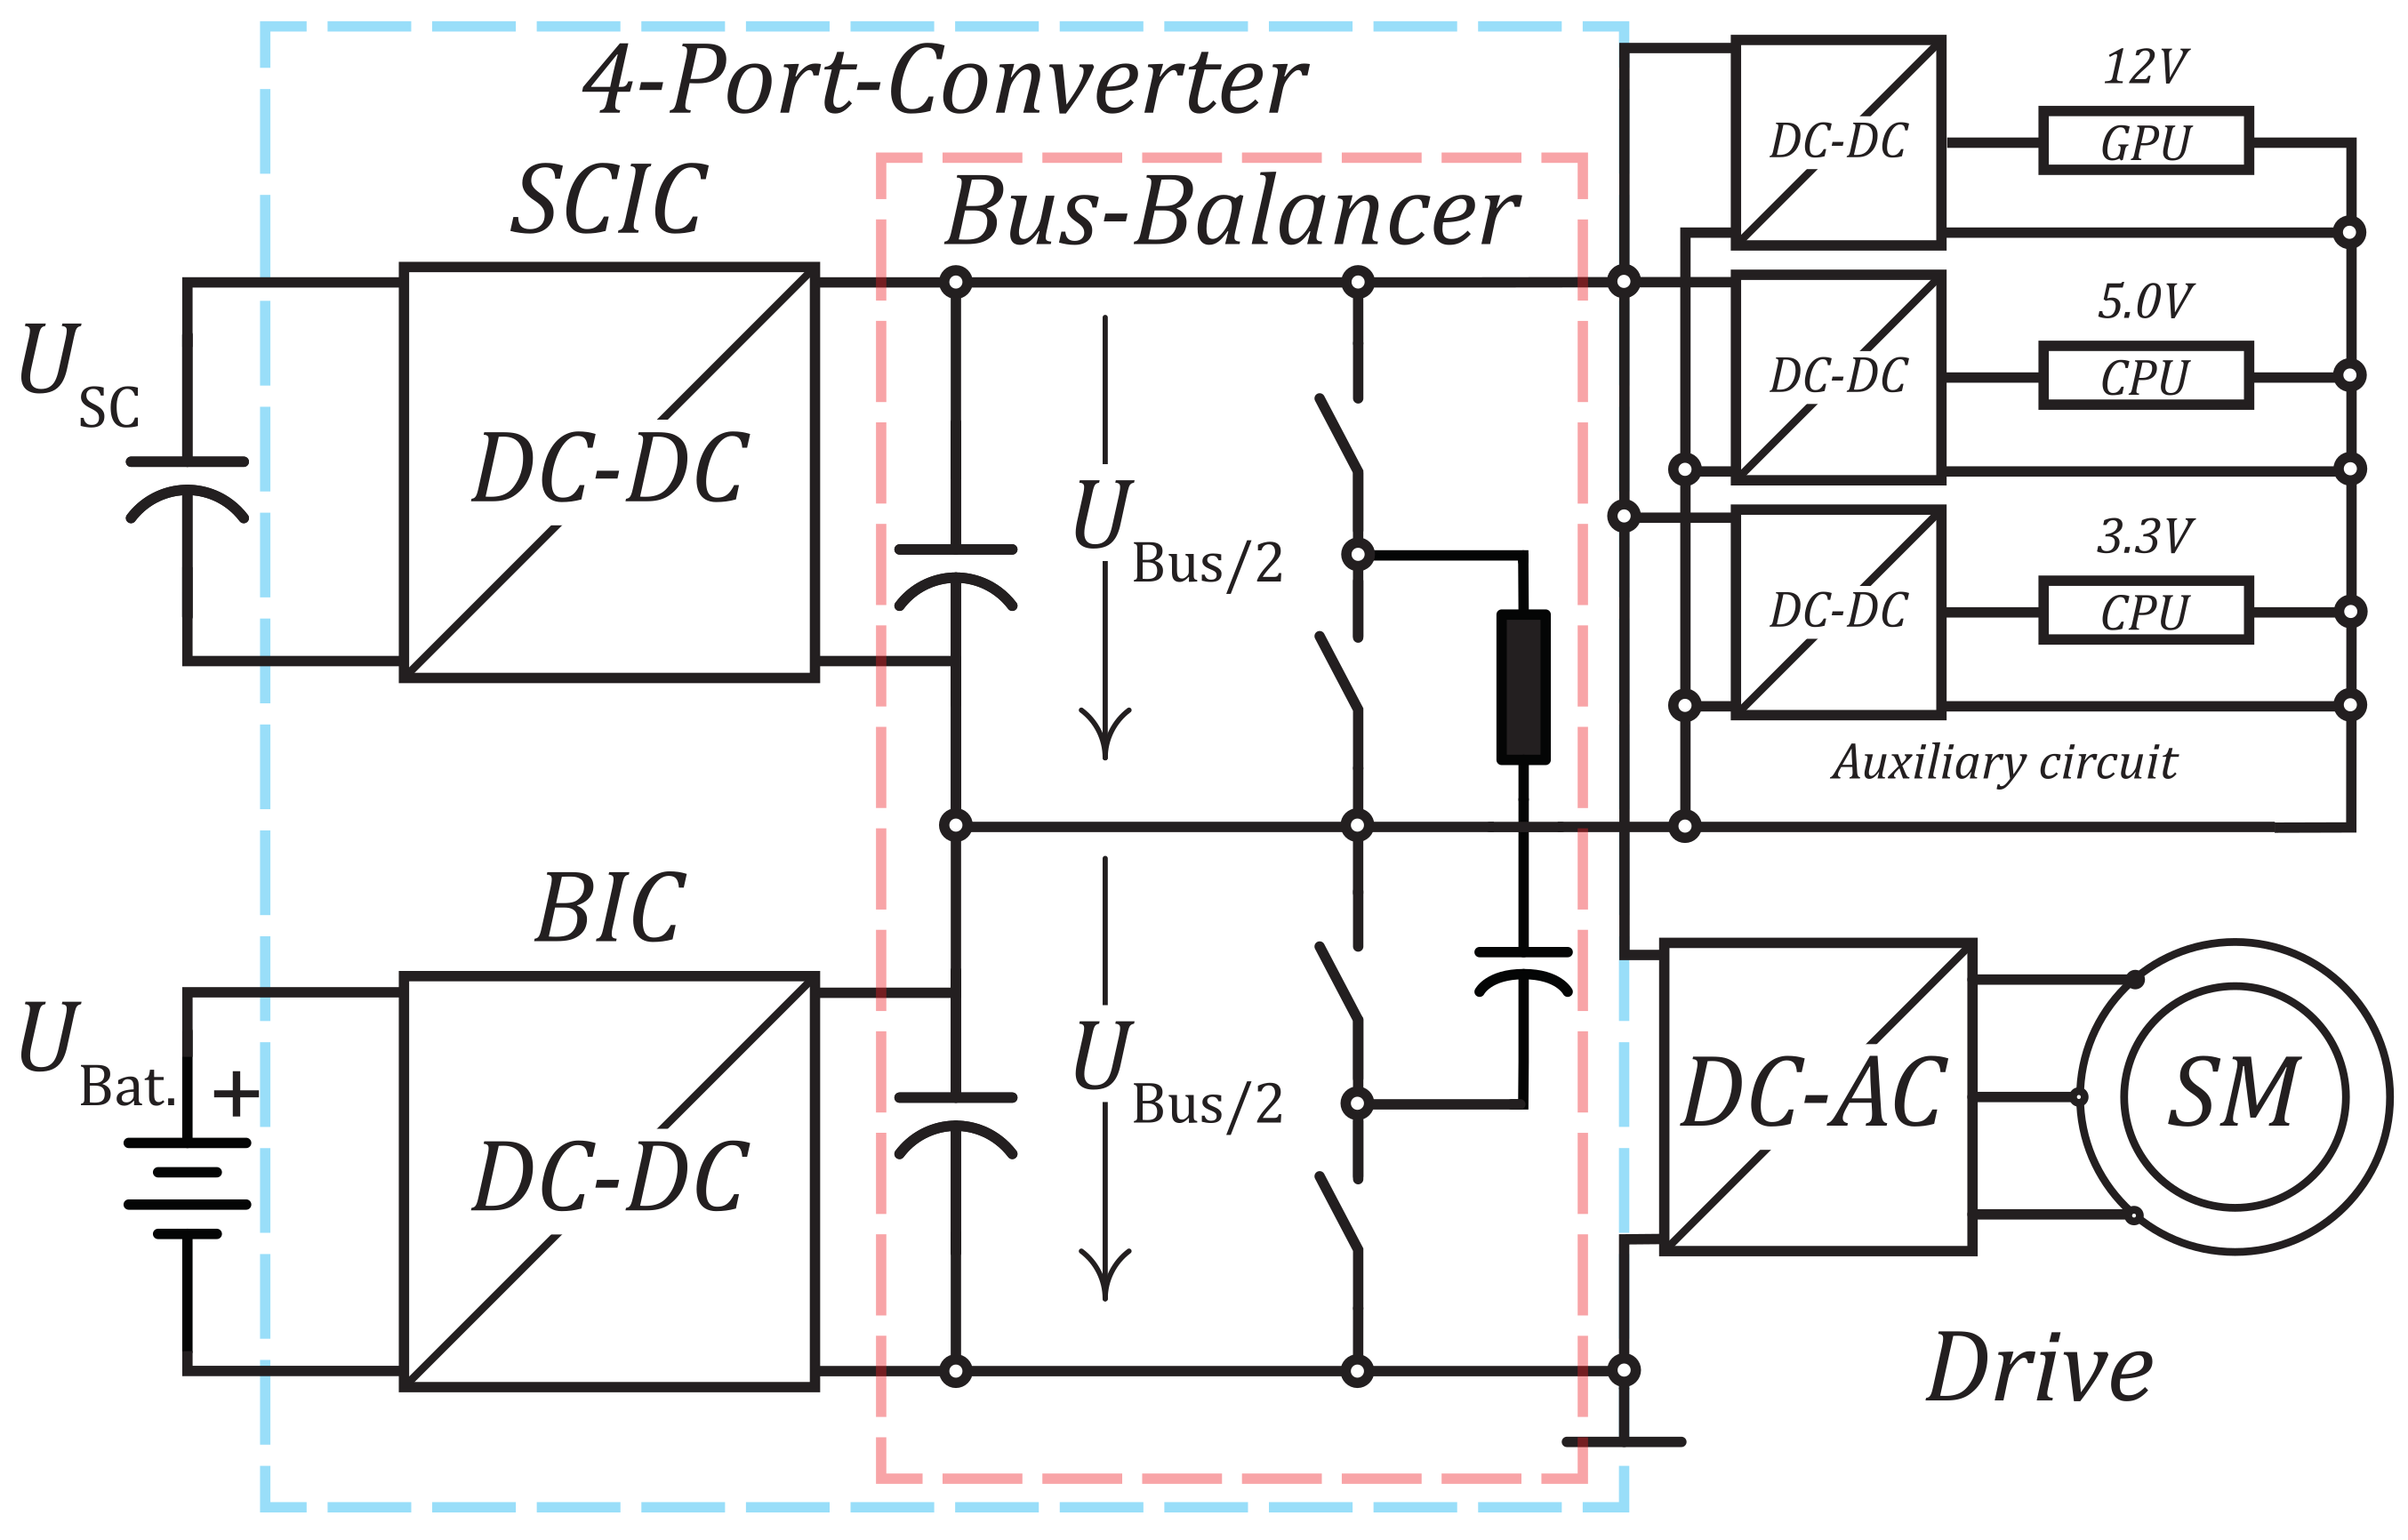
The extended power distribution Figure 10 with additional Bus-balancer converter shown in Figure 11. With the help of the voltage Bus-balancer, three stable buses can be established. One with the full Voltage and two with the half Bus Voltage . This reduces the output voltage of both interface converters by half. In addition, the input voltage of the auxiliary circuits is also be reduced by half.
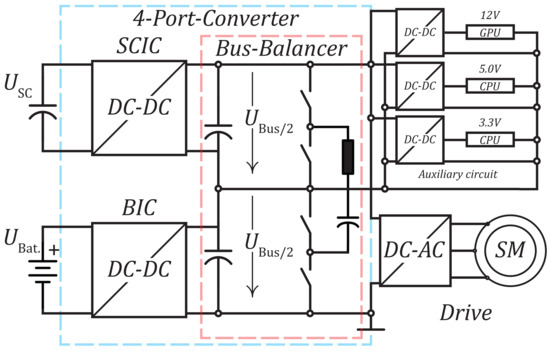
Figure 11.
Topology VII: Combining the battery and the super-capacitor module.
In this topology each converter is connected to a split bus, achieving half the voltage but also requiring double the current. This topology has a clearly worse performance than others. First, the super-capacitor design has a maximum voltage of 24 [V], which is a value half of the 48 [V] of the other topologies. In Figure 12, it can be seen how the super-capacitor designs are strictly worse in both volume and energy lost during the braking cycle.
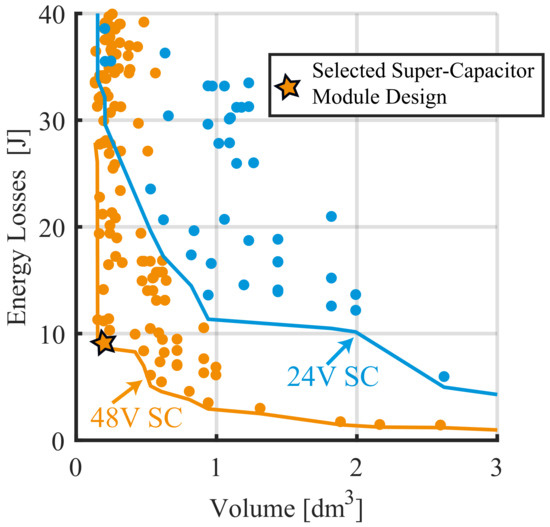
Figure 12.
Estimated super-capacitor module’s energy losses to volume Pareto fronts for 24 V and 48 V. The selected design for 48 V is represented by the star.
As it will be shown in the quantitative comparison, the SCIC volumes are one order of magnitude smaller than the super-capacitor volume. Additionally, because the voltage on the BIC and SCIC is half, the currents are required to be double to maintain the power and energy in the braking cycle constant. This will lead to worse magnetic component designs. Finally, it also requires a balancer circuit without the added benefits of a partial power configuration, as for the case of topology VIII. However, this topology is improved in comparison to the single storage system topologies (I, II, III, and IV). The advantage and disadvantages of Topology VII are shown in Table 14.
Table 14.
Advantage and disadvantages Topology VII.
3.1.8. Topology VIII: Partial Power Topology
Topology VIII has the highest circuit complexity. The main difference with Topology VI is that it uses partial power configuration for both the BIC and SCIC. The partial power configuration has been known in the literature for some time [19,20,21,22,23,24]. These types of topologies can improve the efficiency and power density of designs. The type of partial power topology used for this system is the input series output parallel, which will decrease the voltage on the switching devices while maintaining the current constant, and the super-capacitor module can see the full voltage and store the maximum energy. However, this topology requires a balancer circuit on the bus side, as depicted in Figure 13. To ensure proper operation, the super-capacitor module must be pre-charged to at least half the bus voltage. This must be achieved with an additional circuit and a start-up sequence. The input voltage of the interface converters () can be calculated by Equation (1), and the output voltage is half () of the required bus voltage (). The advantage and disadvantages of Topology VIII are shown in Table 15:
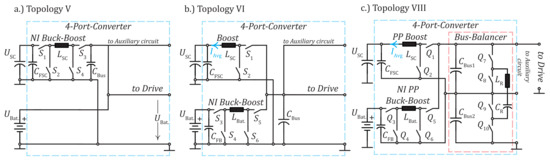
Figure 13.
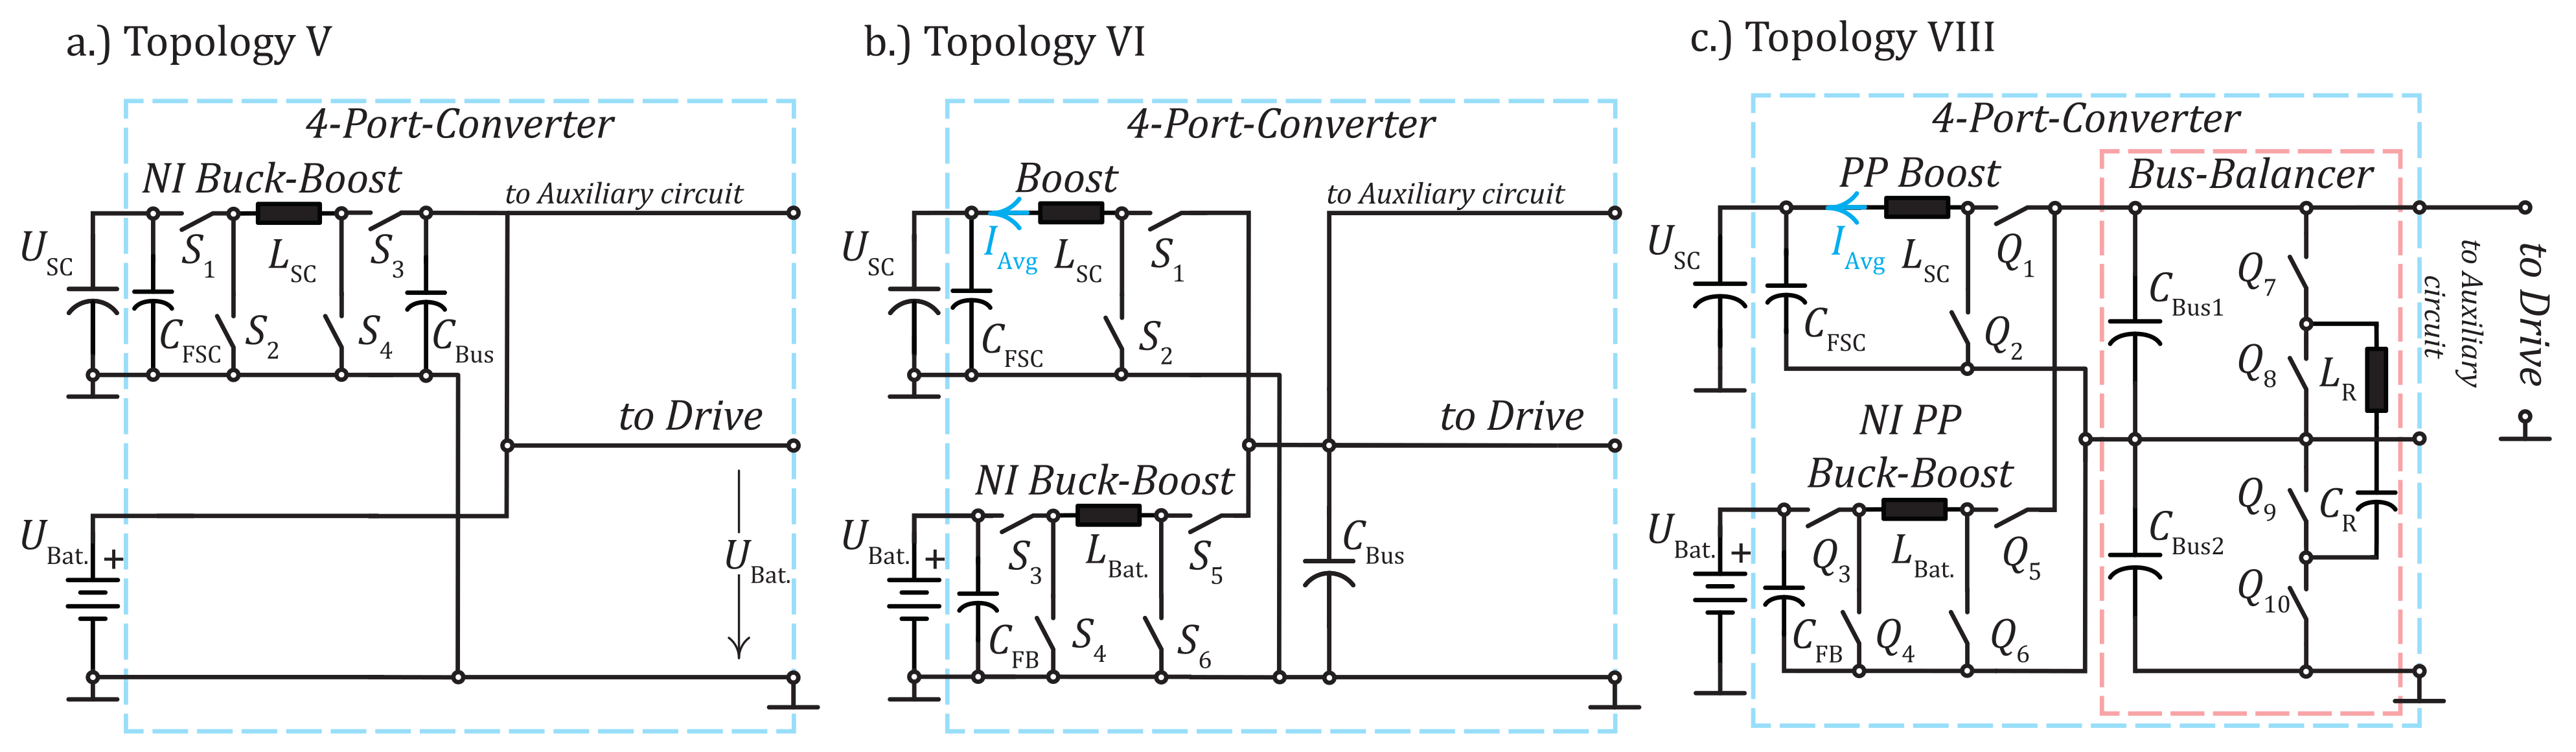
Considered Topologies with SCIC and BIC for the qualitative comparison: (a) Topology V withNI (non-inverting) Buck–Boost as SCIC; (b) Topology VI with Boost as SCIC and NI Buck–Boost as BIC; (c) Topology VIII with PP (partial power) Boost as SCIC and NI PP Buck–Boost as BIC.
Table 15.
Advantage and disadvantages Topology VIII.
As a result, the switching devices breakdown voltage is reduced by two, these devices can have better and switching loss performance, increasing the efficiency.
3.2. Qualitative Comparison
In Table 16, an overview of the electrical specifications for all the considered topologies is shown. Table 16c,d show the specifications for the different interface converter topologies. These topologies are bidirectional by design, as they both need to store and release energy from the battery or the super-capacitor. Because of this, a buck converter can also be called boost, depending on the direction of the power flow. To avoid confusion, all converters will be named considering the input port to be the energy storage system (battery or super-capacitor). When the input voltage is strictly lower than the output, the bidirectional Boost converter will be used. In the opposite case of the input being always higher than the output, the bidirectional Buck converter will be used, and finally, when the input voltage can be both higher or lower than the output, the non-inverting (NI) Buck–Boost converter will be used. Different topologies could be considered, but the most simple ones were selected for ease of calculation. In Table 17, the qualitative advantages and disadvantages are shown, as well as an explanation of the Table 16. In general, it can be noted that the hybrid topologies have increased efficiency, power density, and better battery/super-capacitor designs while increasing the complexity of the design.
Table 16.
Electrical specifications for the batteries, super-capacitors, BIC, and SCIC for all the topologies.
Table 17.
Qualitative comparison of the different ESS topologies.
3.3. Quantitative Comparison: Pareto Front Analysis
To identify the trade-off between the losses and the volume for the different converters and the super-capacitor designs, Pareto front analysis is used [26]. In power converters, the Pareto front calculation is typically performed with efficiency and power density . However, in the case of the SCIC, the concept of power efficiency is difficult to predict since the converter only has losses during the braking process and the number of braking cycles is variable and random during the working time of a mobile robot. Therefore, it is more convenient to use the energy efficiency and the energy density to be more accurate in the analysis of the trade-offs for these topologies.
In this system, most of the volume is represented by the battery and super-capacitor modules. In topologies I to IV, either the battery or super-capacitor are oversized, as explained in previous sections. Because of this, only the hybrid topologies will be compared quantitatively using the Pareto front analysis, as all these designs will have access to an optimized battery and super-capacitor. This is due to the fact that the super-capacitor and battery designs for single energy storage topologies are oversized in comparison, as shown in Figure 3. The estimation of the losses and volumes will be performed using the specifications from Table 16, and the configuration is shown in Figure 13.
In order to carry out the Pareto analysis trade-off analysis of the efficiency and density, the power losses and volume of the different components needs to be estimated. In the case of the power losses, the switching devices, the inductors and the capacitive filters will be considered. The different topologies in Table 16c,d will be considered, with two different switching frequencies of and , two different maximum current ripples of 40% and 200%, an ambient temperature of 25 °C, and a triangular power profile of a regenerative charging cycle as depicted in Figure 14.
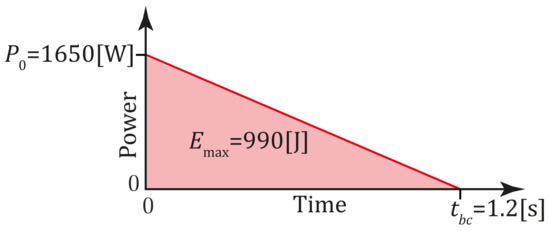
Figure 14.
Triangular power profile of a regenerative charging cycle. The stored energy is represented by the the red area.
3.3.1. Switching Devices Loss Estimation
To estimate the efficiencies and include them in the Pareto front analysis, the losses of the switching devices have to be calculated. The selected devices are all Silicon MOSFET technology. Depending on the different voltages of each topology, as presented in Table 16, the voltage breakdowns of these MOSFET are 80 V or in the range of 40 to 60 V. The different devices used in the estimation are listed in Table 18.
Table 18.
MOSFET used for the Pareto front estimation of the BIC and SCIC for topologies V, VI, and VIII, as depicted in Figure 13.
The total losses of the switching devices are calculated using the method described in [27], both for the conduction and switching losses. For the BICs, constant currents and voltages are considered, but for the case of the SCICs the charging profile is considered as a triangular power pulse, for constant braking torque in the electrical machine. The equation for the instantaneous power is as follows:
where describes the maximum power and the total braking cycle time. Because the bus voltage is constant, the input current will also be triangular. However the super-capacitor’s instantaneous voltage can be derived from the super-capacitor differential equation with a triangular power source, assuming the converter losses are negligible. The equation for the voltage is as follows:
where is the capacitance of the super-capacitor module, and is the initial voltage at the start of the charging cycle. The super-capacitor instantaneous current is:
To calculate the conduction losses of the semiconductors, the profiled RMS current for each device is required. It can be calculated with the discrete moving average method, with the following equation:
where is the switching frequency; are all of the starting times for the switching cycles (, , , ...), such as ; and N is the number of total switching cycles during the total braking cycle time, and it is calculated as . The RMS current in each of these cycles is calculated for each device using the normal method considering the average inductor current equal to Equation (4) evaluated at a time and with a voltage ripple that is also dependent on the voltage in Equation (3). Finally, the equation for the conduction losses is as follows:
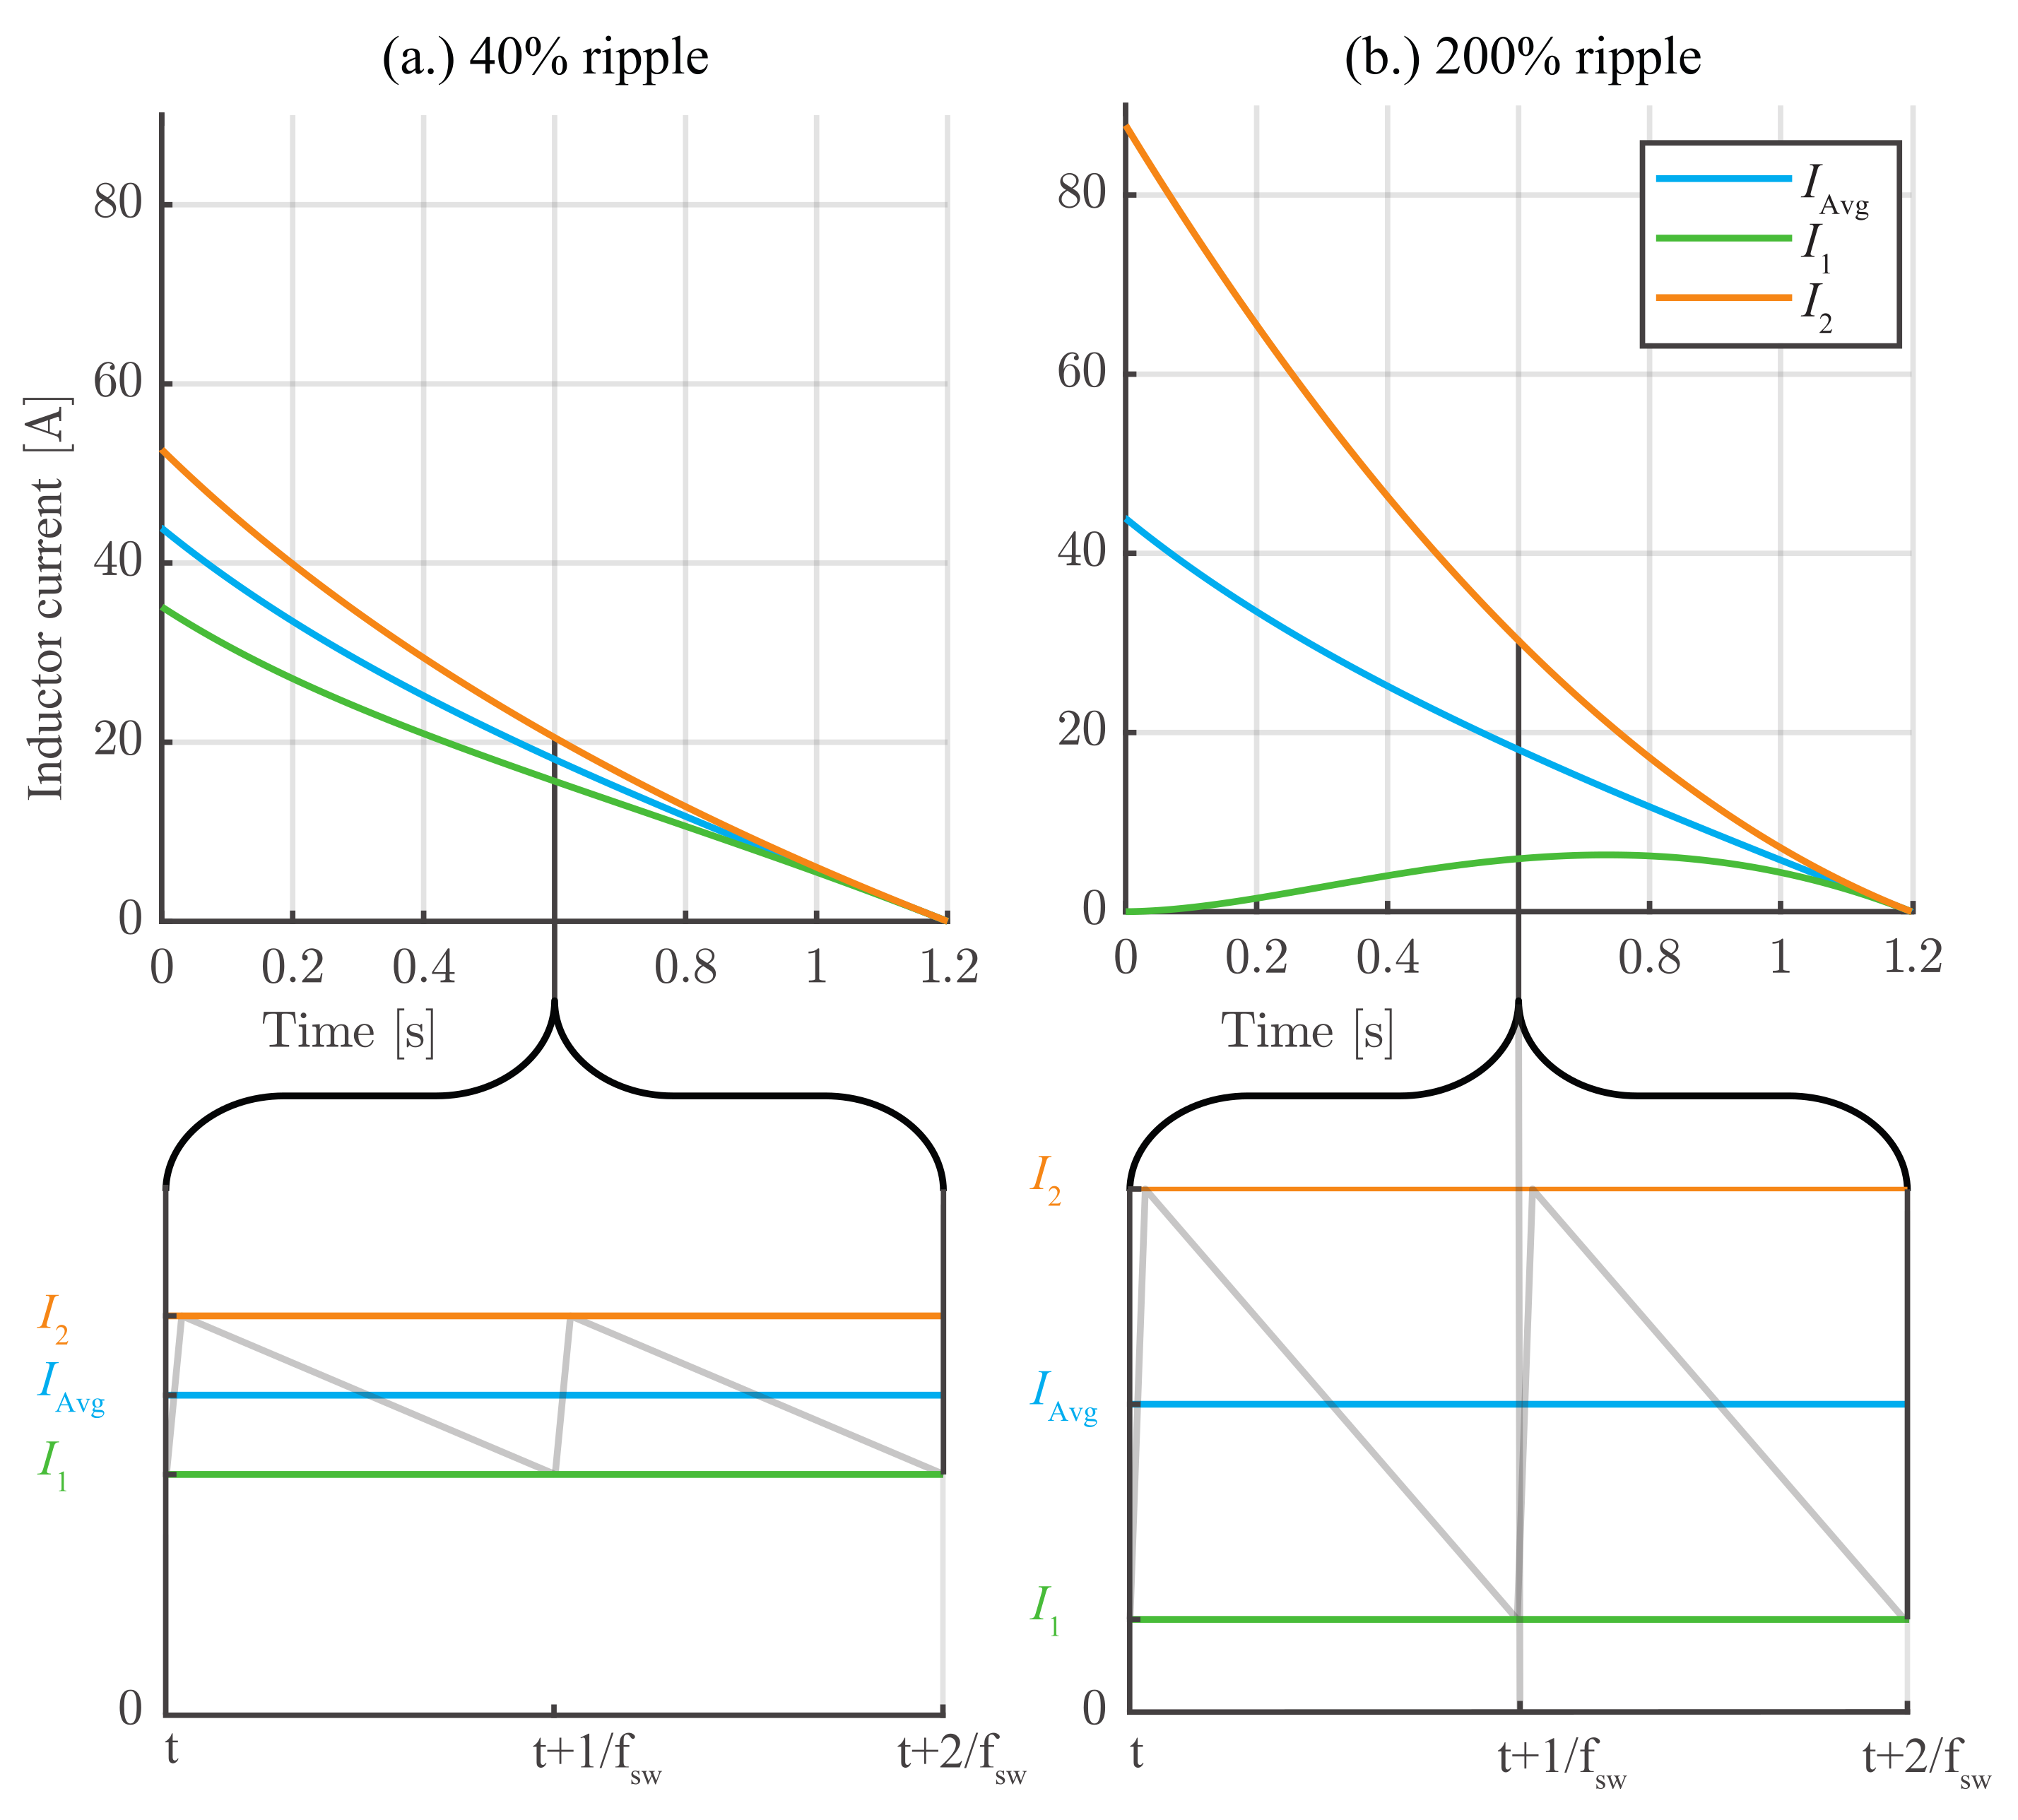
where is the Drain-Source resistance of the selected MOSFET. To calculate the switching losses, the peak and valley values of the inductor currents and will be considered for each individual switching cycle, as depicted in Figure 15. The total switching losses will be calculated with the following equation, for the high-side switches:
and for the low side switches:
where and are the turn-on and turn-off losses in function of the variable currents in time, respectively, and is the MOSFET blocking voltage, which can be different depending on the topologies. These energies are calculated with the method described in [27], using the variable valley and peak currents and , as depicted in Figure 15. In the case of the NI Buck–Boost converter, the ripple would be different than the one shown in the Figure.
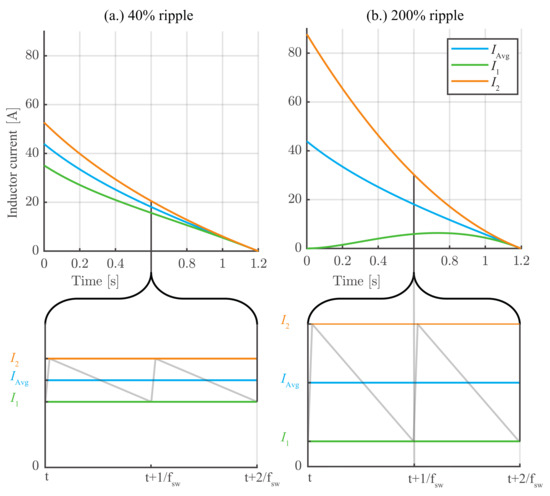
Figure 15.
Boost and PP Boost super-capacitor inductor () current and ripple envelope during energy recovery braking process for two different initial voltage ripples, (a) 40% and (b) 200%, based on a 48 V super-capacitor design.
3.3.2. Switching Devices Heat-Sink Volume Estimation
In power converters, the size of the switching devices is typically negligible compared to the size of passive components (inductors and capacitors). However, the switching devices usually require a heat-sink to dissipate their power losses, which can have a volume comparable to the magnetic components. The thermal time constant of the devices will be always lower than the braking time of 1.2 s; therefore, the design of the heat-sink will consider the peak power losses of the devices. To estimate the volume of these heat-sinks, we can use the “cooling system performance index” CSPI from [28], but applied to natural convection cooling instead. Using CSPI = 3 , the maximum allowed temperature increases from the ambient of = 75 °C and an ambient temperature of 25 °C, and the following equation for the heat-sink volume is obtained:
where is the peak total losses of all switching devices connected to the heat-sink, considering both conduction and switching losses.
3.3.3. Inductor Design and Loss and Volume Estimation
Inductors are a critical part in any Pareto front estimation for power converters, as they typically have the biggest volume of all the components. In this section, the design method of the inductors for the BIC and SCIC will be presented. The BIC inductors, in Figure 13, are inductors designed for a constant current. In the case of the SCIC inductors, in Figure 13, they have a variable current profile like the one depicted in Figure 15. The design tool PExprtTM from Ansys is used to estimate the power losses and volumes.
For the BIC inductors, the power specification is constant, and the PExprtTM tool can be used with any modifications. However, in the case of the SCIC inductors, the triangular power profile lasts 1.2 s. Typical inductors are massive, and their thermal time constants are in the order of magnitude of minutes. Therefore, the thermal models considering thermal capacitance have to be used to estimate the maximum temperature achieved and avoid the oversize of the designs. For this estimation, the thermal models in [29] are used. The PExprtTM tool does not include thermal capacitance models or variable profile currents. Therefore, the equivalent RMS current has to be calculated, as explained in Equation (5), and uses as a constant current for in the PExprtTM tool while reducing the maximum B field to account for the higher ratio of RMS current to saturation current that the variable profile current has in comparison to a regular inductor waveform with constant current and ripple.
All of the designs are calculated using 2 different frequency specifications of 100 and 200 , 2 different maximum current ripples of 40% and 200%, and an ambient temperature of 25 °C. Equation (5) is also used for the estimation of the RMS current. For the windings, the wires AWG28 and AWG36 are used for the designs of 100 and 200 , respectively. The core shapes considered for the estimations are EPCOS E, ETD, and RM cores of different sizes, and the core material is Ferrite material N97. The volume of the inductor is calculated conservatively, multiplying the footprint by the total height of the core.
3.3.4. Filter Capacitor Design Considerations and Loss and Volume Estimation
Different filter capacitors are required for the different topologies. These can be Bus filter capacitors or super-capacitor/battery-filter capacitors to increase the life-time by reducing the high-frequency ripple currents in those components. The design criteria will be the same for all filters, with a maximum ripple of 2%.
The designs are always limited by the ripple criteria instead of the maximum RMS current criteria. However, the RMS current is calculated to estimate the power losses. In the case of the filters for SCIC, the moving average RMS of the triangular profile will be used, instead of constant. In the case of topologies VII and VIII, the DC-Bus filters and the balancer circuit capacitors are fused into a single component, which will increase the total RMS current of the component, but will not be enough to oversize the capacitors. The balancer circuit design will be explained in the following subsection.
3.3.5. Balancer Circuit Loss and Volume Estimation
Topologies VII and VIII include a voltage balancer for the split DC bus, see Figure 11 and Figure 13. This voltage balancer includes a resonant tank that operates at a lower switching frequency of 20 [kHz]. The design of the resonant tank is simplified, as it is not the main focus of the publication. The inductor was fixed at = 0.5 [H]; therefore, the capacitor is = 63 [F]. Using an RM5 core, the inductor has a volume of 1.5 [] and 0.7 [W] for the power losses. Moreover, the resonant capacitor is designed using ceramic technology, which has a volume of 0.3 [] and negligible losses. The balancing capacitors have a volume of 6.3 [] and also negligible losses, again using ceramic capacitor technology.
3.3.6. Analysis of Pareto Results
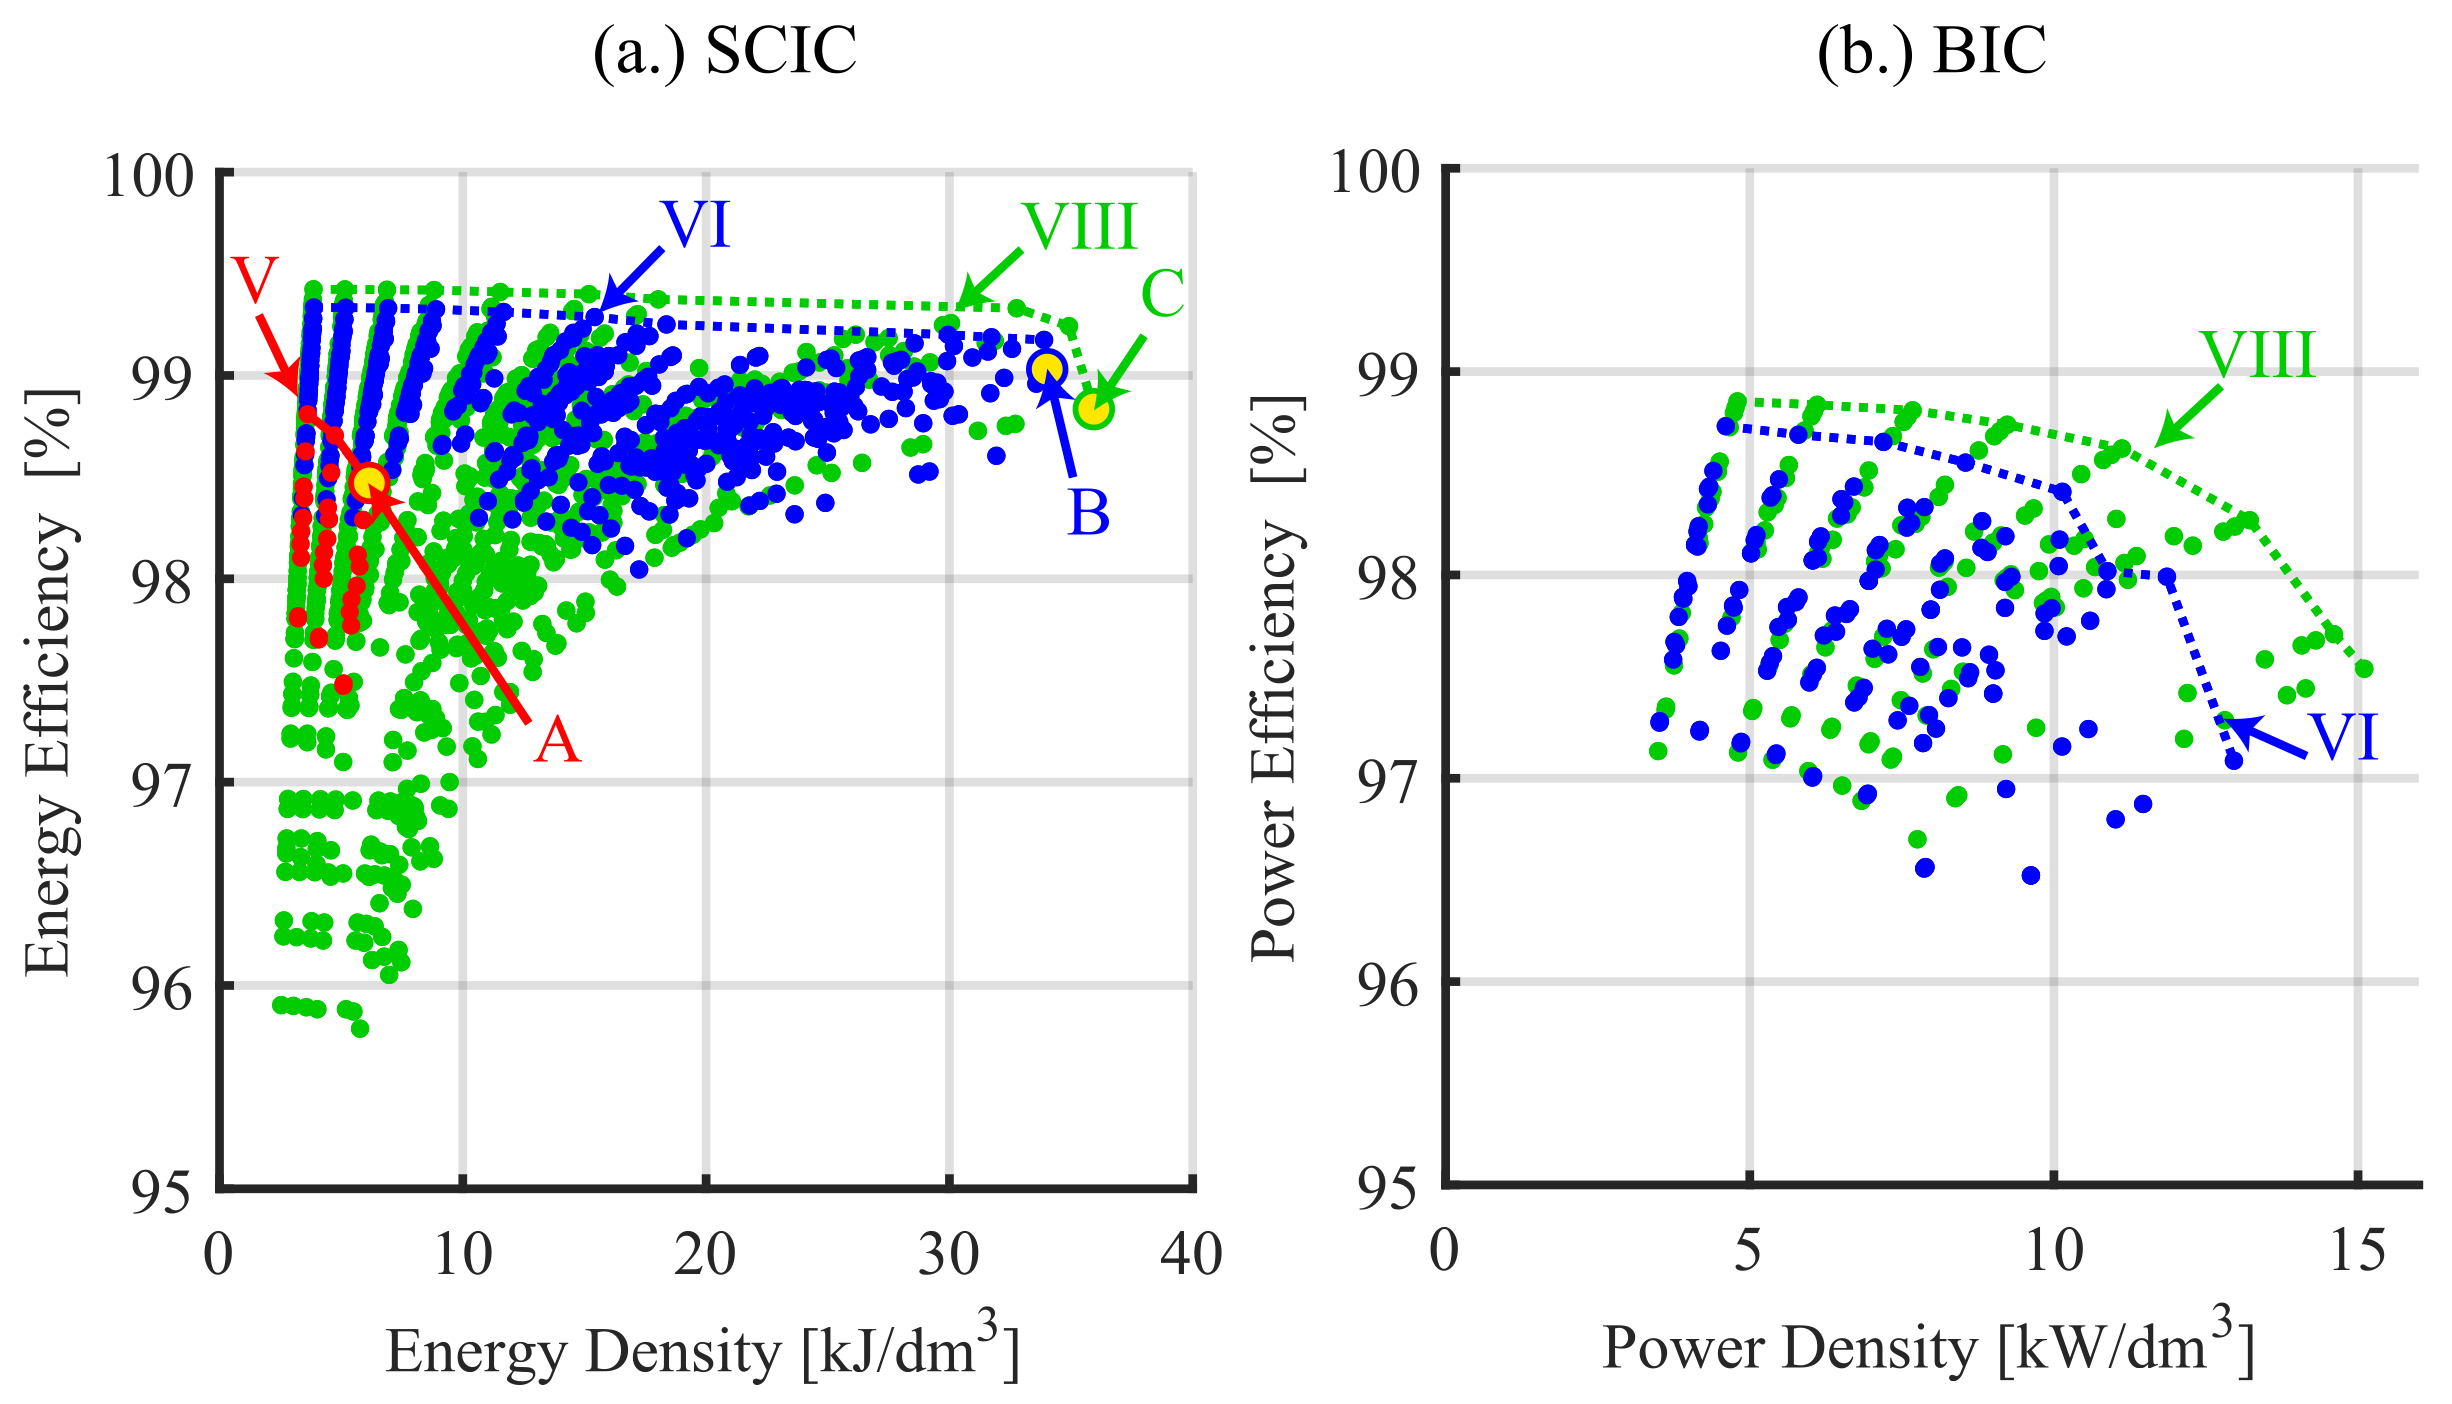
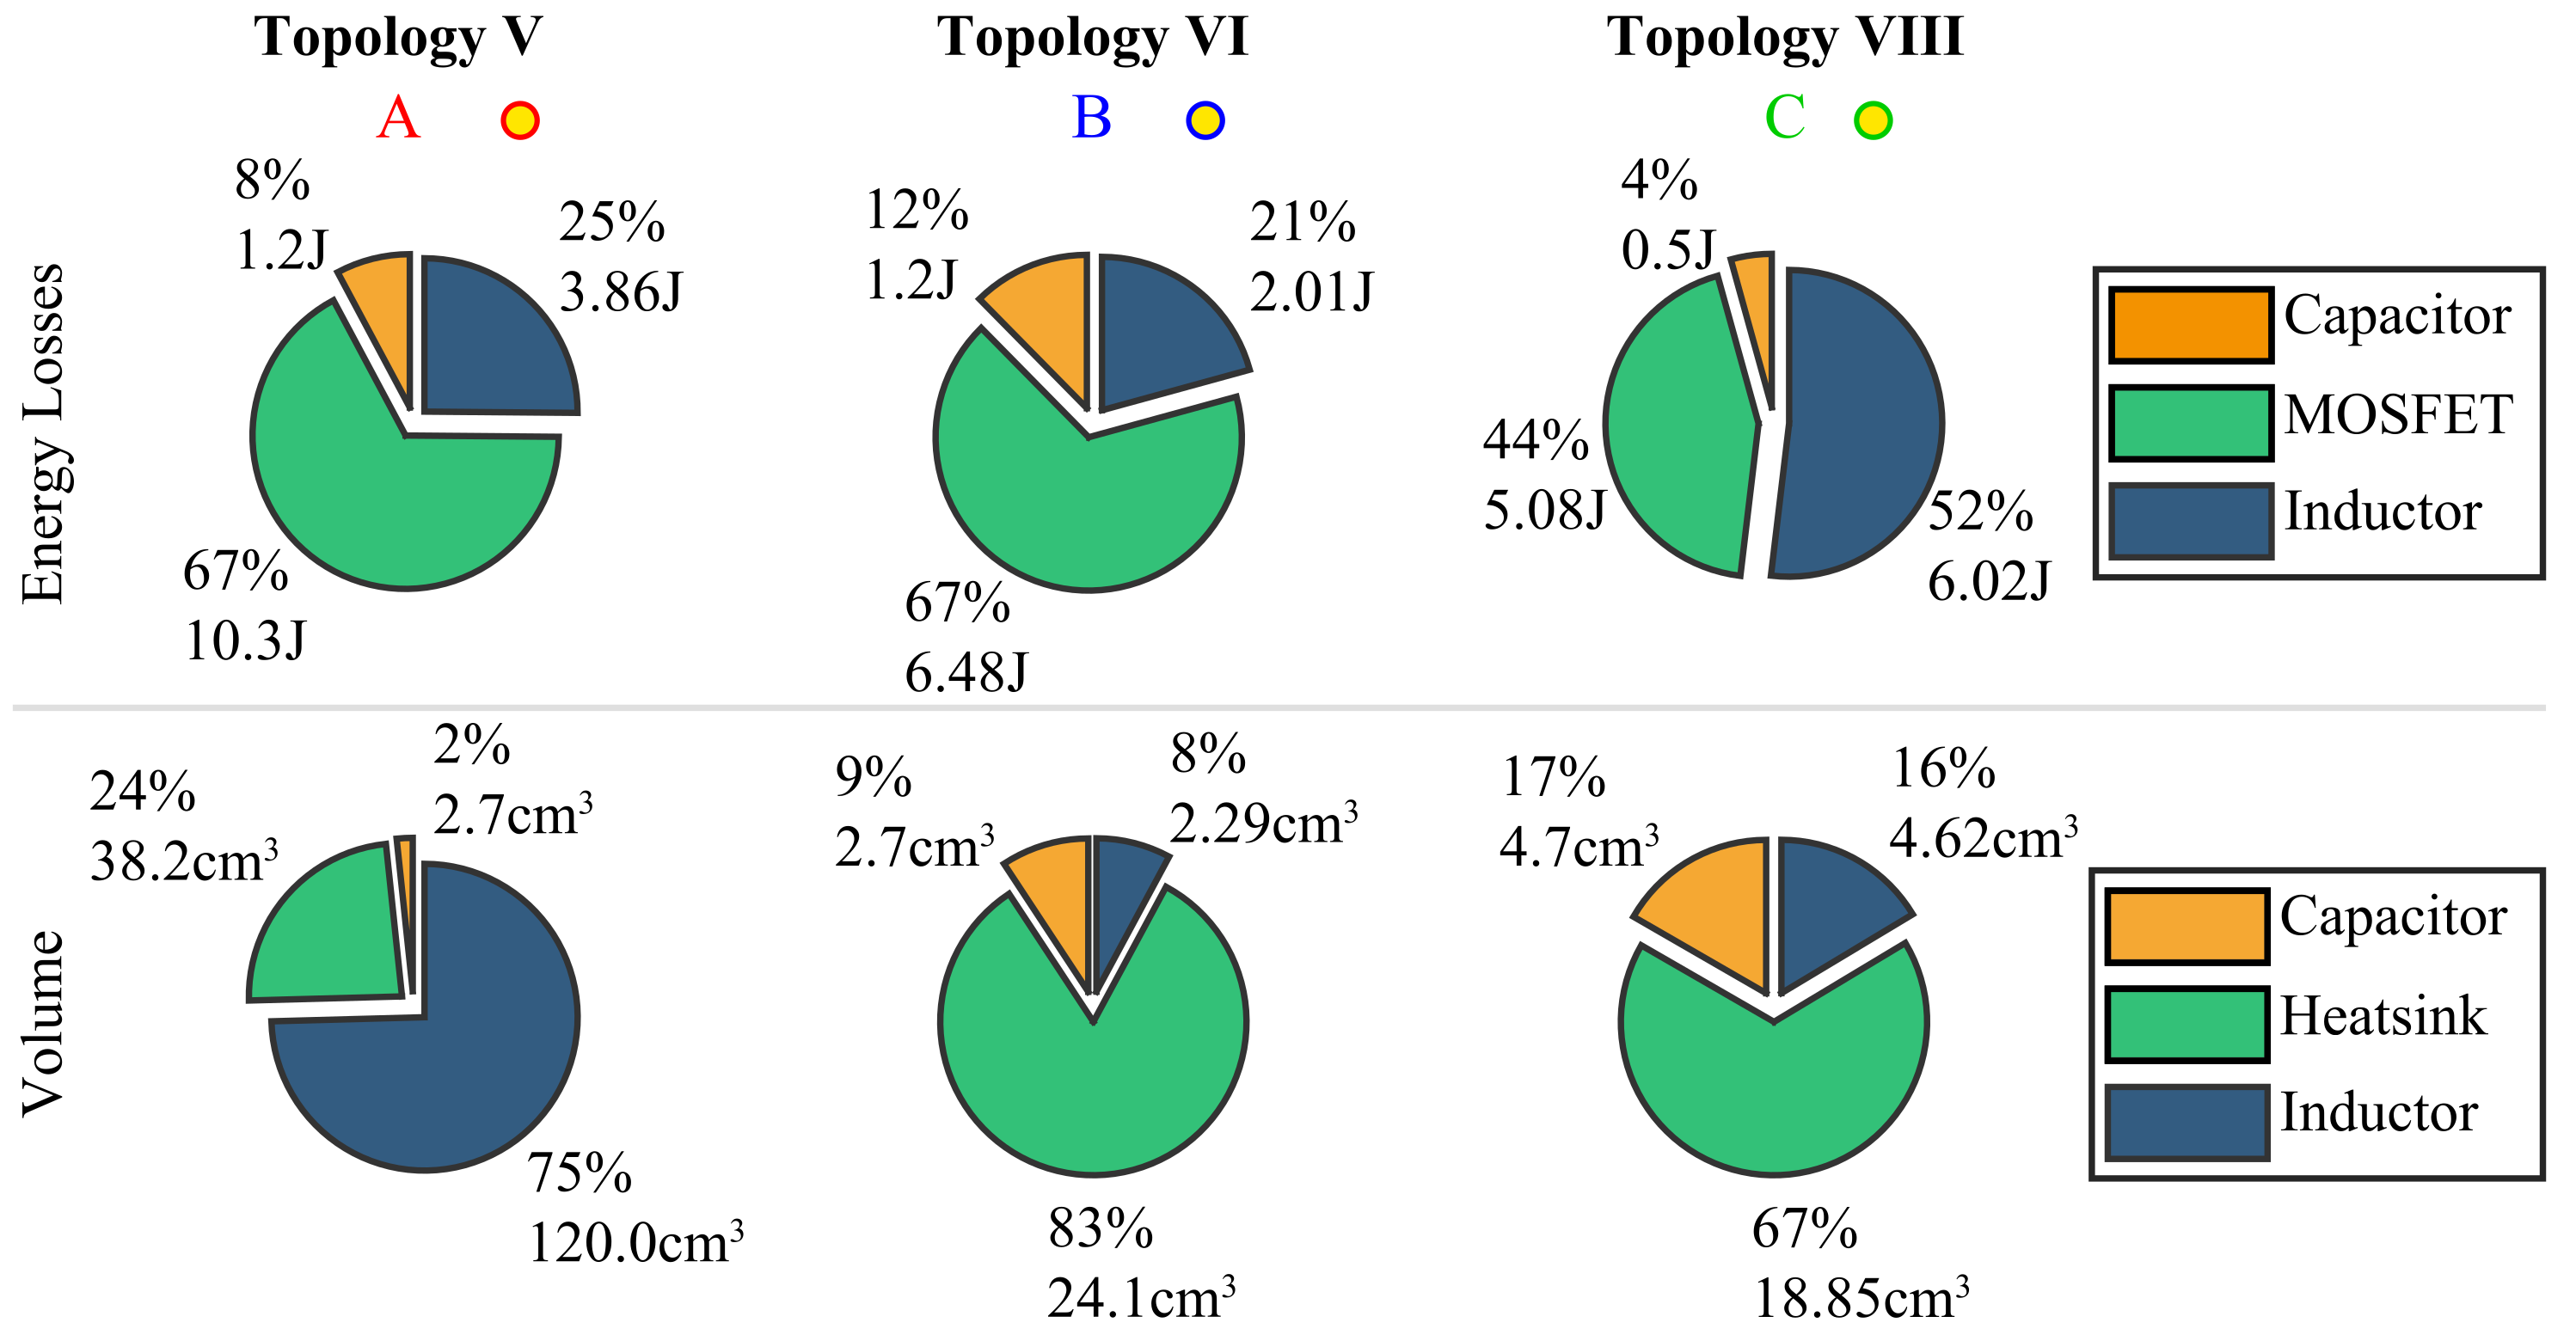
Figure 16a depicts the energy efficiency and energy density Pareto fronts for the SCIC of topologies V, VI, and VIII. Topology V has the lowest Efficiency/Density trade-off with 6 . This result is expected due to the lack of BIC, and the Bus voltage is directly connected to the battery, with a variable voltage which deteriorate the worst case scenarios for loss estimation. In addition, the converter is required to boost and reduce the voltage, so the NI Buck–Boost topology is needed, which has more devices and worse performance. On the other hand, topologies VI and VIII have a controlled bus voltage and therefore higher efficiencies and densities in comparison to Topology V. Finally, Topology VIII has the best trade-off because of the use of the partial power structure, where voltages are reduced while currents remain constant for the same power and energy. A maximum energy density of 35.94 can be achieved with this topology, with an estimated energy efficiency of 98.83%. Figure 17 shows the breakdown of energy losses and volumes for the maximum energy density designs, A, B, and C in Figure 16. It can be noted that for topologies V and VI, the MOSFET losses are dominant and for topology VIII, and they represent 40% of the total losses. Because of this, all the Pareto front results have a switching frequency of 100 []. The Pareto front analysis of the BIC is depicted in Figure 16b. Topology V is not included as it does not have a BIC. These Pareto fronts are calculated with the peak power as reference instead of the total braking energy. Therefore, the efficiencies cannot be directly compared with the ones in Figure 16a. For these Pareto fronts, the partial power topology VIII has improved efficiency and maximum density in comparison to the topology VI. The maximum power density estimated is 15 with an efficiency of 97.53%.

Figure 16.
Estimated efficiency/density Pareto front: (a) For SCIC, considering total brake energy recuperated V, VI, and VIII; (b) For BIC, considering full battery power for topologies VI and VIII.

Figure 17.
Estimated energy losses and Volume breakdown for the SCIC of topologies V, VI, VIII.
Finally, in Table 19 a comparison of the total volumes for the battery, the super-capacitor, and the HESS topologies V, VI, and VII is depicted. It can be noted that the total volumes for BIC are higher than for the SCIC and that they are both one to two orders of magnitude lower than the volumes of the super-capacitors and batteries, respectively, making the additional converters worthwhile to consider as they do not increase significantly the overall volume of the system. Additionally, it can be seen that Topology V has bigger minimum volume for the SCIC than the combination of the lowest volumes of BIC and SCIC for Topologies VI and VIII.
Table 19.
Comparison of estimated volumes of batteries, super-capacitors, BIC, and SCIC.
3.4. Summary of the Comparison
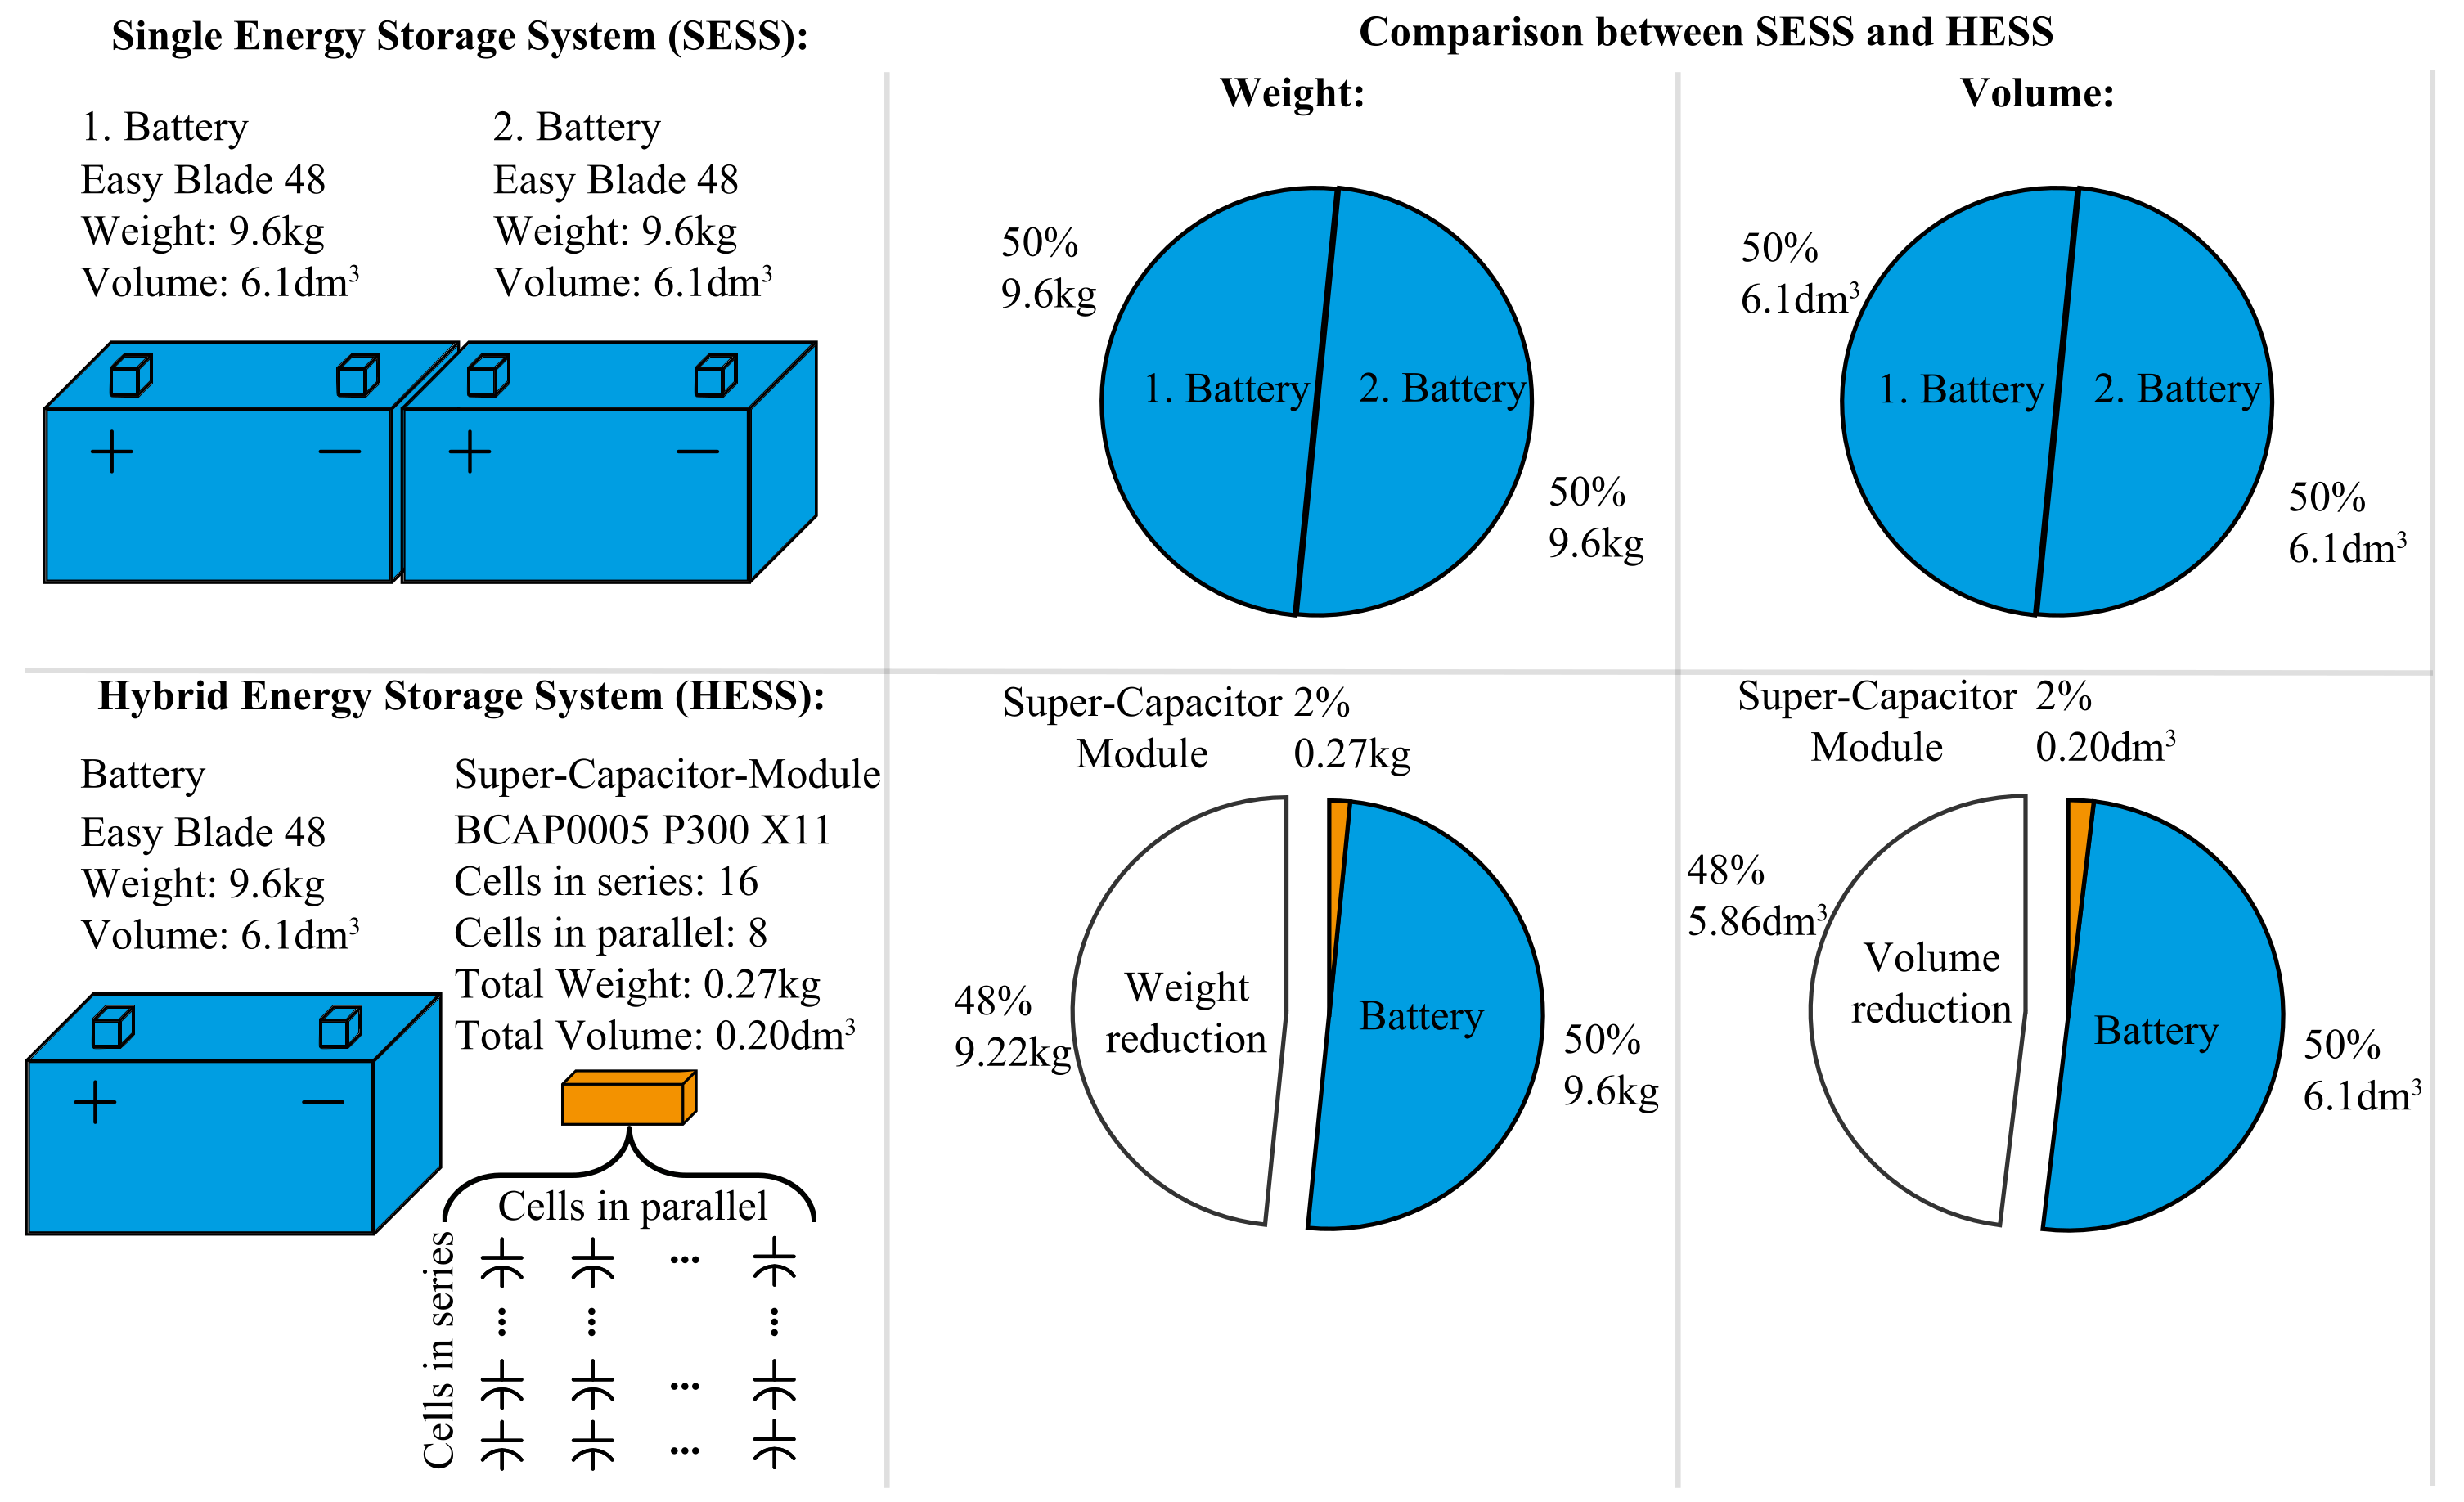
As conclusion for the comparison, it can be stated that the SESS have very oversized designs for the battery or super-capacitor module, as it can be seen in Figure 1 and Table 1. Batteries can be oversized in peak power or peak energy specifications, and super-capacitors will always be oversized in peak power. In Figure 18, a summarised comparison of the volume and weight of the storage system for ESS and HESS is depicted. The ESS design has two identical batteries (Easy Blade 48) to achieve the required peak power specification (3000 [W]). In the HESS design, the second battery can be substituted by a super-capacitor module. Both requirements of peak energy and peak power are met without any over-sizing. It can be noticed in Figure 18 that the total reduction in weight and volume achieved is 48%. In addition to these quantitative improvements, the lifetime of the battery is increased by reducing the total amount of charge cycles that are now handled by the super-capacitor. Super-capacitor technology is more adequate for a high number of charge cycles. Therefore, the overall lifetime of the system is improved.

Figure 18.
Estimated volume and weight breakdown for topologies VI and VIII and reduction in weight and volume compared to the SESS Battery.
The combination of battery and super-capacitor module has the drawback of requiring more additional electronic circuitry. Two types of converters are needed, the BIC to interface with the battery and the SCIC to interface with the super-capacitor module. Different topologies for BIC and SCIC are possible. As a result of a Pareto front analysis, it can be stated that the volumes of these converters are negligible in comparison to the batteries and super-capacitor volumes, see Figure 17 and Figure 18, as they are orders of magnitude smaller. As a result of this, it is worth to just compare the volume of the different SCIC and BIC without including the battery and super-capacitor modules. As depicted in Figure 16 and Figure 17, Topologies V, which only uses SCIC, achieves a very poor energy density of 6 . This is due to the fact that the converter is an NI Buck–Boost with more switching devices and worst specifications because of the unregulated Bus voltage. On the other hand, the SCIC of topologies VI and VIII reach energy densities of 35.94 and 35.94 , respectively. Topology VIII also has a higher power density for the BIC than topology VI, as depicted in Figure 16. The improved performance of topology VIII is a consequence of the use of the partial power configuration, which improves the quality of the switching devices by reducing the voltage rating of those, as well as reduces the size of magnetic components by improving their ripple. However, all of these improvements have the trade-off of increased circuit and control complexity.
4. Conclusions
In this paper, a quantitative and qualitative comparison of 3-Port topologies for single energy storage systems (SESS) and 4-Port topologies for hybrid energy storage systems (HESS) for automated guided vehicle (AGV) power supply was described. The SESS have very oversized designs. Using a hybrid system, a combination of a super-capacitor and a battery, the designs of both the battery and super-capacitor are optimised, saving up to 48% in volume and weight. The trade-off is the increase in complexity and the additional volume and losses of the interface converters. However, the comparison shows that the volume and losses of these additional converters are negligible in comparison to the battery and super-capacitor volumes. To do this, quantitative comparison using efficiency/density Pareto front analysis was used. The conclusion of this analysis shows that topology VIII, which uses partial power configuration, has the best trade-off between efficiency and density, with a maximum estimated energy efficiency of 98.83% and 35.94 energy density for the SCIC and a maximum power density of 15 for the BIC, while maintaining 97.54% power efficiency.
Author Contributions
Conceptualization, A.J.H. and Y.E.B.; methodology, A.J.H., Y.E.B., E.J. and P.J.G.; software, Y.E.B. and E.J.; validation, A.J.H., Y.E.B., E.J. and P.J.G.; formal analysis, A.J.H., Y.E.B. and E.J.; investigation, A.J.H., Y.E.B., E.J. and P.J.G.; resources, P.J.G.; data curation, A.J.H., Y.E.B. and E.J.; writing—original draft preparation, A.J.H. and Y.E.B.; writing—review and editing, A.J.H., Y.E.B., E.J. and P.J.G.; visualization, A.J.H., Y.E.B. and E.J.; supervision, P.J.G. and Y.E.B.; project administration, P.J.G. and A.J.H.; funding acquisition, P.J.G. and A.J.H. All authors have read and agreed to the published version of the manuscript.
Funding
This research was funded by the Förderkreis der Universität Innsbruck 1669 -Wissenschafft Gesellschaft. The APC was funded by the University of Innsbruck.
Institutional Review Board Statement
Not applicable.
Informed Consent Statement
Not applicable.
Data Availability Statement
Not applicable.
Acknowledgments
Copyright © IEEE. All rights reserved. Reprinted, with permission, from “Hanschek, A.J.; Bouvier, Y.E.; Jesacher, E.; Grbovic, P.J. Analysis of power distribution systems based on low-voltage DC/DC power supplies for automated guided vehicles (AGV). 2021 21st International Symposium on Power Electronics (Ee), 2021, pp. 1–6. doi:10.1109/Ee53374.2021.9628366.” [5]. Personal use of this material is permitted. However, permission to reuse this material for any other purpose must be obtained from the IEEE. The authors thank Christoph Brachmann for his help and opinions about AGV’s, Jürgen and Elisa Nawrot for transfer of some super-capacitors datasheets data, and Aleksandra Stanojević for the help in the review of the original draft.
Conflicts of Interest
The authors declare no conflict of interest.
Correction Statement
Due to an error, the incorrect Academic Editor was previously listed. This information has been updated and this change does not affect the scientific content of the article.
References
- Giasson, A.; Dokopoulos, S. Rethinking the Power Delivery Networks of Mobile Robots. IEEE Power Electron. Mag. 2020, 7, 12–18. [Google Scholar] [CrossRef]
- Ghobadpour, A.; Amamou, A.; Kelouwani, S.; Zioui, N.; Zeghmi, L. Impact of powertrain components size and degradation level on the energy management of a hybrid industrial self-guided vehicle. Energies 2020, 13, 5041. [Google Scholar] [CrossRef]
- Wieckowski, L.; Klimek, K. Development of a hybrid energy storage system for a mobile robot. In Proceedings of the 2020 International Conference Mechatronic Systems and Materials (MSM), Bialystok, Poland, 1–3 July 2020; pp. 1–6. [Google Scholar] [CrossRef]
- Grbovic, P.J. Ultra-Capacitors in Power Conversion Systems. In Ultra-Capacitors in Power Conversion Systems; John Wiley & Sons, Ltd.: Hoboken, NJ, USA, 2013; Chapter 1, 3, 5, pp. 1–21, 78–148, 216–315. [Google Scholar] [CrossRef]
- Hanschek, A.J.; Bouvier, Y.E.; Jesacher, E.; Grbović, P.J. Analysis of power distribution systems based on low-voltage DC/DC power supplies for automated guided vehicles (AGV). In Proceedings of the 2021 21st International Symposium on Power Electronics (Ee), Novi Sad, Serbia, 28–30 October 2021; pp. 1–6. [Google Scholar] [CrossRef]
- Fichtner, M.; Edström, K.; Ayerbe, E.; Berecibar, M.; Bhowmik, A.; Castelli, I.E.; Clark, S.; Dominko, R.; Erakca, M.; Franco, A.A.; et al. Rechargeable Batteries of the Future—The State of the Art from a BATTERY 2030+ Perspective. Adv. Energy Mater. 2021, 2102904. [Google Scholar] [CrossRef]
- Kampker, A.; Schnettler, A.; Vallée, D. In Elektromobilität-Grundlagen einer Zukunftstechnologie; Springer Berlin Heidelberg: Berlin/Heidelberg, Germany, 2013; Chapter 6; pp. 279–386. [Google Scholar] [CrossRef]
- Bosch, R. (Ed.) Bosch Automotive Electrics and Automotive Electronics: Systems and Components, Networking and Hybrid Drive; Springer: Berlin/Heidelberg, Germany, 2014; p. 521. [Google Scholar] [CrossRef]
- Grbović, P.J.; Delarue, P.; Le Moigne, P.; Bartholomeus, P. The ultracapacitor-based regenerative controlled electric drives with power-smoothing capability. IEEE Trans. Ind. Electron. 2012, 59, 4511–4522. [Google Scholar] [CrossRef]
- Grbovic, P.J.; Delarue, P.; Le Moigne, P. Selection and design of ultra-capacitor modules for power conversion applications: From theory to practice. In Proceedings of the Conference Proceedings—2012 IEEE 7th International Power Electronics and Motion Control Conference—ECCE Asia, IPEMC 2012, Harbin, China, 2–5 June 2012; Volume 2, pp. 771–777. [Google Scholar] [CrossRef]
- Becker, J.; Nemeth, T.; Wegmann, R.; Sauer, D. Dimensioning and Optimization of Hybrid Li-Ion Battery Systems for EVs. World Electr. Veh. J. 2018, 9, 19. [Google Scholar] [CrossRef]
- Grbović, P.J.; Delarue, P.; Le Moigne, P.; Bartholomeus, P. Modeling and control of the ultracapacitor-based regenerative controlled electric drives. IEEE Trans. Ind. Electron. 2011, 58, 3471–3484. [Google Scholar] [CrossRef]
- Bloombergnef. Battery Pack Prices Cited Below $100/kWh for the First Time in 2020, While Market Average Sits at $137/kWh. 2020. Available online: https://about.bnef.com/blog/battery-pack-prices-cited-below-100-kwh-for-the-first-time-in-2020-while-market-average-sits-at-137-kwh/ (accessed on 30 July 2021).
- Helms, H.; Kämper, C.; Biemann, K.; Lambrecht, U.; Jöhrens, J.; Meyer, K. Klimabilanz von Elektroautos. 2019. Available online: https://www.agora-verkehrswende.de/fileadmin/Projekte/2018/Klimabilanz_von_Elektroautos/Agora-Verkehrswende_22_Klimabilanz-von-Elektroautos_WEB.pdf (accessed on 30 August 2021).
- Varta. Application Specific Batteries—Standard Lithium-Ionen Batterien in 24 V und 48 V. 2022. Available online: https://www.varta-ag.com/de/industrie/produktloesungen/lithium-ionen-batterie-packs/asb (accessed on 10 January 2022).
- Forest, F.; Meynard, T.A.; Labouré, E.; Costan, V.; Sarraute, E.; Cunière, A.; Martiré, T. Optimization of the supply voltage system in interleaved converters using intercell transformers. IEEE Trans. Power Electron. 2007, 22, 934–942. [Google Scholar] [CrossRef]
- Stroe, A.I.; Stroe, D.I.; Swierczynski, M.; Teodorescu, R.; Kær, S.K. Lithium-Ion battery dynamic model for wide range of operating conditions. In Proceedings of the 2017 International Conference on Optimization of Electrical and Electronic Equipment, OPTIM 2017 and 2017 International Aegean Conference on Electrical Machines and Power Electronics, ACEMP 2017, Brasov, Romania, 25–27 May 2017; pp. 660–666. [Google Scholar] [CrossRef]
- Jang, J.; Yoo, J. Equivalent circuit evaluation method of lithium polymer battery using bode plot and numerical analysis. IEEE Trans. Energy Convers. 2011, 26, 290–298. [Google Scholar] [CrossRef]
- Shenoy, P.S.; Kim, K.A.; Johnson, B.B.; Krein, P.T. Differential Power Processing for Increased Energy Production and Reliability of Photovoltaic Systems. IEEE Trans. Power Electron. 2013, 28, 2968–2979. [Google Scholar] [CrossRef]
- Chen, H.; Kim, H.; Erickson, R.; Maksimović, D. Electrified Automotive Powertrain Architecture Using Composite DC–DC Converters. IEEE Trans. Power Electron. 2017, 32, 98–116. [Google Scholar] [CrossRef]
- Grbović, P.J.; Delarue, P.; Le Moigne, P. Boost diode rectifier for three-phase variable speed drives supplied from the single-phase mains: Analysis and design. In Proceedings of the IECON 2012—38th Annual Conference on IEEE Industrial Electronics Society, Montreal, QC, Canada, 25–28 October 2012; pp. 274–280. [Google Scholar]
- Grbović, P.J.; Delarue, P.; Le Moigne, P. A novel three-phase diode boost rectifier using hybrid half-DC-bus-voltage rated boost converter. IEEE Trans. Ind. Electron. 2011, 58, 1316–1329. [Google Scholar] [CrossRef]
- Vasic, M.; Serrano, D.; Alou, P.; Oliver, J.A.; Grbovic, P.; Cobos, J.A. Comparative analysis of two compact and highly efficient resonant switched capacitor converters. In Proceedings of the IEEE Applied Power Electronics Conference and Exposition—APEC, San Antonio, TX, USA, 4–8 March 2018; Volume 2018, pp. 2168–2174. [Google Scholar] [CrossRef]
- Zientarski, J.R.R.; Pinheiro, J.R.; Martins, M.L.D.S.; Hey, H.L. Understanding the partial power processing concept: A case-study of buck-boost dc/dc series regulator. In Proceedings of the 2015 IEEE 13th Brazilian Power Electronics Conference and 1st Southern Power Electronics Conference, COBEP/SPEC 2016, Fortaleza, Brazil, 29 November–2 December 2015. [Google Scholar] [CrossRef]
- IEEE Std 1856-2017; IEEE Standard Framework for Prognostics and Health Management of Electronic Systems. IEEE: Piscataway, NJ, USA, 2017. [CrossRef]
- Kolar, J.W.; Biela, J.; Minibock, J. Exploring the pareto front of multi-objective single-phase PFC rectifier design optimization—99.2% efficiency vs. 7kW/din3 power density. In Proceedings of the 2009 IEEE 6th International Power Electronics and Motion Control Conference, Wuhan, China, 17–20 May 2009; pp. 1–21. [Google Scholar] [CrossRef]
- Dušan, Graovac and Marco, Pürscheland Andreas, Kiep. MOSFET Power Losses Calculation Using the Data-Sheet Parameters. Available online: https://application-notes.digchip.com/070/70-41484.pdf (accessed on 10 January 2022).
- Drofenik, U.; Laimer, G.; Kolar, J.W. Theoretical converter power density limits for forced convection cooling. In Proceedings of the International Conference, Power Electronics, Intelligent motion, Power Quality, Nurnberg, Germany, 7–9 June 2005; pp. 608–619. [Google Scholar]
- Karaventzas, V.; Biela, J.; Mateos, F.R. Transient thermal models of capacitors and inductors for system optimization. In Proceedings of the 2020 22nd European Conference on Power Electronics and Applications (EPE’20 ECCE Europe), Virtual, 7–11 September 2020; pp. P.1–P.11. [Google Scholar] [CrossRef]


Publisher’s Note: MDPI stays neutral with regard to jurisdictional claims in published maps and institutional affiliations. |
© 2022 by the authors. Licensee MDPI, Basel, Switzerland. This article is an open access article distributed under the terms and conditions of the Creative Commons Attribution (CC BY) license (https://creativecommons.org/licenses/by/4.0/).