Article

Heat Transfer of Near Pseudocritical Nitrogen in Helically Coiled Tube for Cryogenic Energy Storage

1
School of Chemical Engineering, University of Birmingham, Birmingham B15 2TT, UK
2
School of Energy and Power Engineering, Nanjing University of Aeronautics and Astronautics, Nanjing 210016, China
*
Author to whom correspondence should be addressed.
Energies 2022, 15(8), 2752; https://doi.org/10.3390/en15082752
Submission received: 14 March 2022 / Revised: 30 March 2022 / Accepted: 7 April 2022 / Published: 8 April 2022
(This article belongs to the Special Issue Heat and Cold Storage for a Net-Zero Future)

Abstract

:
This paper investigates the cryogenic heat transfer phenomena of nitrogen flowing in helically coiled tubes under the combined effects of pseudocritical conditions, buoyancy, and coil curvature. The ultimate goal was to design optimum heat exchangers for liquid air energy storage. Local heat transfer coefficients were evaluated peripherally across tube cross sections. The pressure, mass flux, and heat flux effects on the heat transfer were examined. The dual effect of buoyancy and coil curvature on heat transfer coefficients was interpreted via a dimensionless number Ψ, which denotes a ratio between the two effects. Results reveal that the heat transfer coefficients increase with increasing mass flux but decreasing pressure and heat flux. The buoyancy effect dominates the heat transfer at fluid temperatures below the pseudocritical temperature (e.g., −146.3 °C at 35 bar), while the coil curvature-induced centrifugal effect dominates at higher temperatures. The heat transfer coefficients for the helical coil were approximately 13% lower compared with those in straight tube at fluid temperatures below the pseudocritical temperature, but their difference shrinks (<±6%) at higher temperatures. The reason is that the benefits of coil curvature and improved turbulent mixing on heat transfer are counteracted by the thermophysical property variation and buoyancy effect.

1. Introduction

Heat exchangers including the coil heat exchanger (CHX) are widely used in various industrial fields for energy transport including power plants, nuclear reactors, refrigeration/HVAC systems, and heat recovery [1,2]. In particular, CHXs have been considered as one of the most efficient heat exchanger configurations due to their compactness (i.e., high heat transfer area to volume ratio) and good heat transfer performance [3,4,5]. Secondary flow, induced by the centrifugal force exerting on the flowing fluid due to the curvature of coiled tube, has been found to be beneficial for fluid mixing and thus can enhance the thermal performance of a CHX under subcritical conditions [6,7,8,9]. Sreejith et al. [7] compared heat transfer performance of a helical coil heat exchanger with a straight tube heat exchanger under the same experimental conditions. It was found that the secondary flows induced by the curvature of the helical coil heat exchanger were the main factor for the enhanced heat transfer rate in relation to a straight tube heat exchanger. Results also showed increased heat exchanger effectiveness and a greater overall heat transfer coefficient in helical coil heat exchangers than in straight tube heat exchangers for all considered operating conditions. Jayakumar et al. [9] numerically investigated the heat transfer characteristics of water under turbulent regimes in vertically oriented helical coils. It was pointed out that the best heat transfer performance was at the outer side, while the worst was at the inner side of a specified coil cross section due to the skewed velocity profile induced by the centrifugal force in helically coiled tubes. Oscillatory behaviors of the local heat transfer coefficients were discovered, which were attributed to the combined effects of the centrifugal force, inertial force, and buoyancy force within the curved tubes.
Meanwhile thermal management demand keeps growing, as well as the need for cryogenic heat transfer fluid alternatives [10]. Supercritical nitrogen is one of the cryogenic heat transfer fluids that has been used in many critical applications, as it can operate below −150 °C without phase change at ~35 bar line pressures. Supercritical nitrogen is employed as heat transfer media, such as in gas liquefaction [11], cryogenic storage [12], and other applications that require cryogenic conditions such as achieving the required temperatures for superconducting transitions [13,14]. However, the number of studies on heat transfer characteristics of supercritical nitrogen is much fewer than those of supercritical water and CO2, and the database of supercritical nitrogen heat transfer is far from complete. Among the few studies [14,15,16,17], Zhang et al. [14] investigated the flow and heat transfer behaviors of supercritical N2 in a small vertical circular tube at different heat flux, mass flux, and inlet fluid temperature conditions using both experiments and numerical simulations. It was found that the local heat transfer coefficient (HTC) followed a similar trend with supercritical water and CO2 [18,19,20,21]. That is, the local HTC of N2 first increases and then deteriorates after reaching to a peak value near the pseudocritical point, mainly due to local thermophysical property variation and buoyancy effect. A similar local HTC trend of supercritical N2 internal flow heat transfer was demonstrated in a study conducted by Wang et al. [17], and a passive heat transfer enhancement technique was employed to improve the deterioration in local HTC after its peak value near the pseudocritical point. Figure 1 illustrates the thermophysical properties of N2 as a function of temperature at pressures of 35 bar and 40 bar, respectively, both beyond the critical pressure at 33.96 bar [22]. As the figure shows, dramatic changes in N2 thermophysical properties can be observed near the pseudocritical temperature, and such changes are more remarkable and associated with a narrower temperature interval at 35 bar than 40 bar. The pseudocritical temperature is approximately −146.3 °C and −143.4 °C at 35 bar and 40 bar, respectively.
In view of the local HTC deterioration of supercritical N2 in straight tube due to thermophysical property variation and buoyancy effect, it is intriguing to learn how N2 would behave near its pseudocritical point (i.e., cryogenic temperatures) when flowing through a helically coiled tube under combined effects of centrifugal force, buoyancy, main flow, and secondary flows. Unfortunately, although there are a few numerical studies on other fluids such as water and CO2, almost no experimental studies have been presented regarding supercritical nitrogen heat transfer in helical coiled tubes, mainly due to the complexity of the cryogenic operating conditions and heat transfer experiments in coils with curvature and centrifugal force. In a numerical study by Zhang et al. of supercritical CO2 heat transfer in helically coiled tube [23], the evolution of secondary flow due to the mixed effects of centrifugal force and buoyancy was discussed and demonstrated in Figure 2. A dimensionless parameter Ψ was proposed to denote the ratio between gravitational buoyancy force and overall curvature effect in terms of their dominance in the heat transfer. Consequently, a flow regime map was developed based on Ψ and the inclination angle of the centerline of the two symmetric secondary flow vortices (shown as “α” in Figure 2c). The heat transfer was dominated by natural convection, mixed convection, and forced convection in three different regions on the flow map, respectively. Zhao et al. [24] numerically investigated turbulent flow behaviors and heat transfer characteristics of supercritical water in vertical helical tubes. It was pointed out that, compared with constant property water flow, the secondary flow was stretched due to large buoyancy forces. The maximum secondary flow velocity near the bottom tube wall was 17.6% higher than that near the top wall. Additionally, the axial velocity of water was accelerated in the flow direction due to continuous heating and thereby led to increased secondary flow intensities. For turbulent convective heat transfer of CO2 in a helical tube at near-critical pressure, Xu et al. [25] found larger axial velocities at the outer-bottom location of the tube cross section and higher wall temperatures at the inner-top location. Moreover, it was noted that the non-uniformity of the HTCs over the local tube circumference was reduced because of the decreased buoyancy effect beyond the pseudocritical temperature region.
Considering the wide use of the coil heat exchanger and future demand of supercritical nitrogen as an alternative heat transfer fluid, the study of supercritical nitrogen heat transfer characteristics in helically coiled tubes is necessary. Such a heat transfer study is also essential because supercritical nitrogen operates under cryogenic temperatures, which can be used for the design of a cryogenic heat exchanger, as most previous studies focusing on supercritical CO2 and water feature much different temperature ranges. Another uniqueness of supercritical N2 heat transfer in a helically coiled tube is the dual effect of buoyancy and coil curvature-induced centrifugal force. The dual effect can neither be generated by using constant-property fluids (without dramatic thermophysical property variation) nor in straight tube heat transfer (no coil curvature). In addition, a more detailed experimental study is needed to complement the existing database of supercritical fluid heat transfer in helical coil, as many of previous studies are numerical. In the present paper, experiments were conducted in a stainless steel vertically oriented helically coiled tube test section to investigate the convective heat transfer characteristics of nitrogen flow while being heated over its pseudocritical point.

2. Experimental Methodology

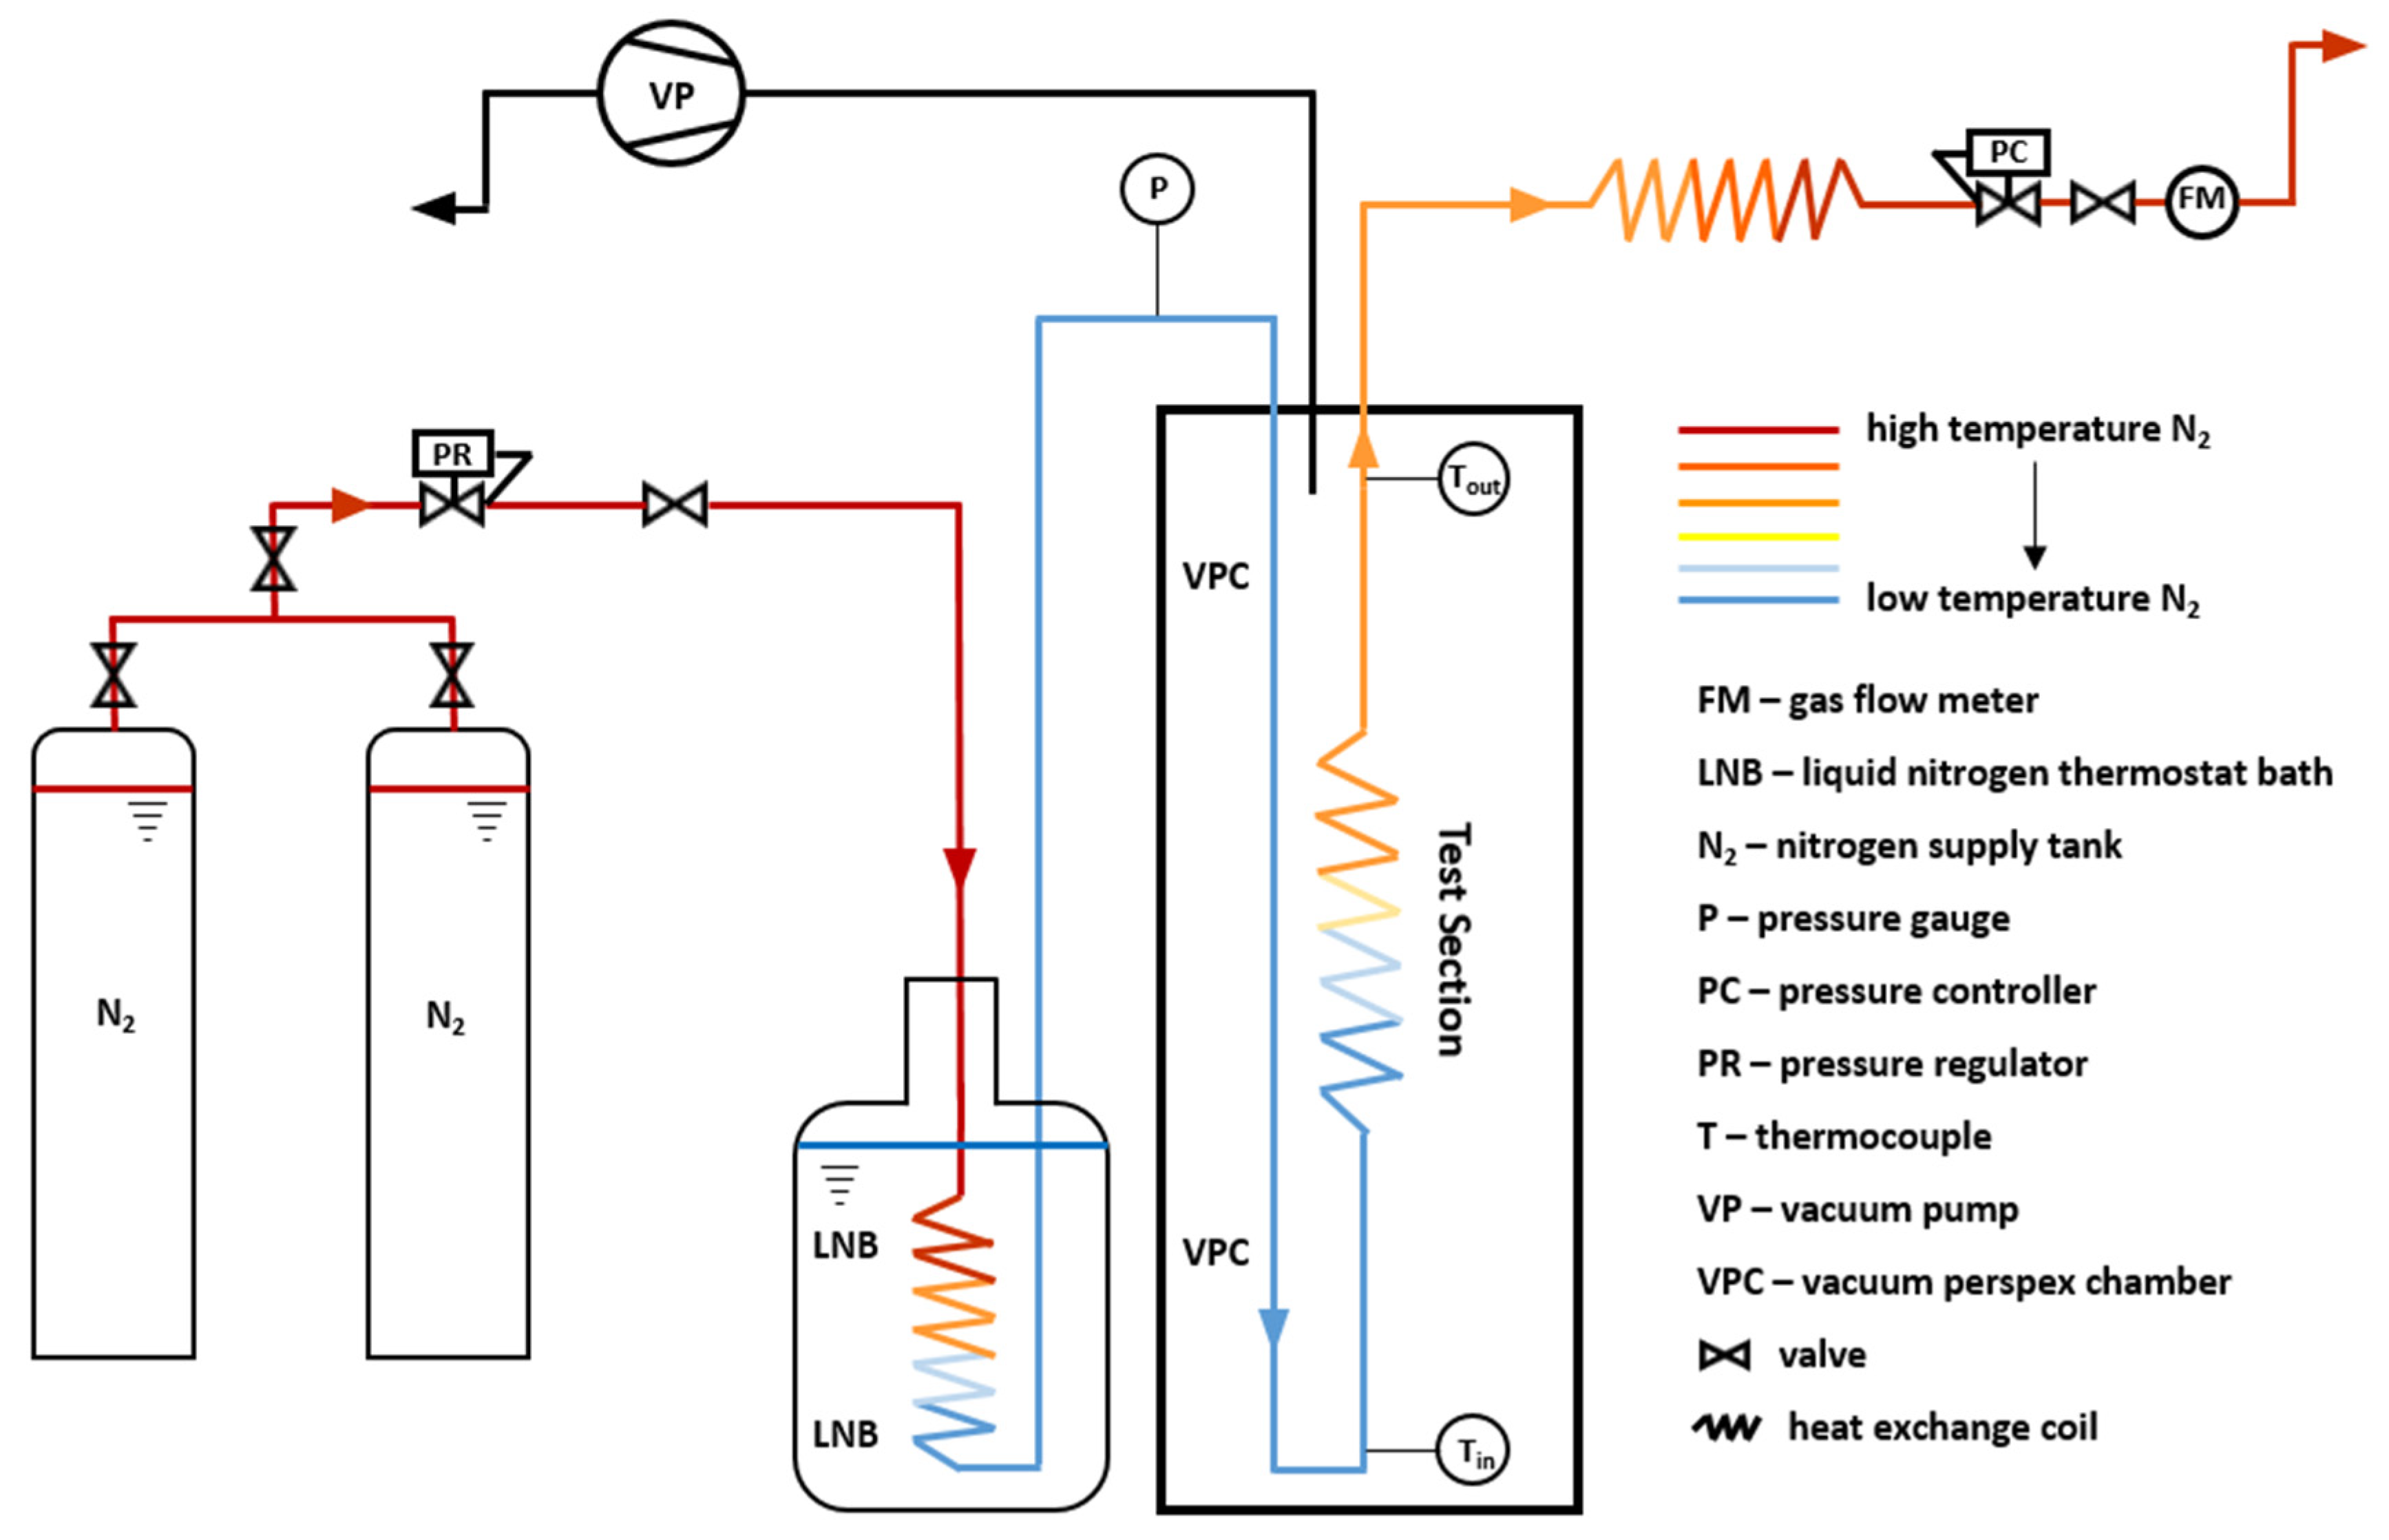
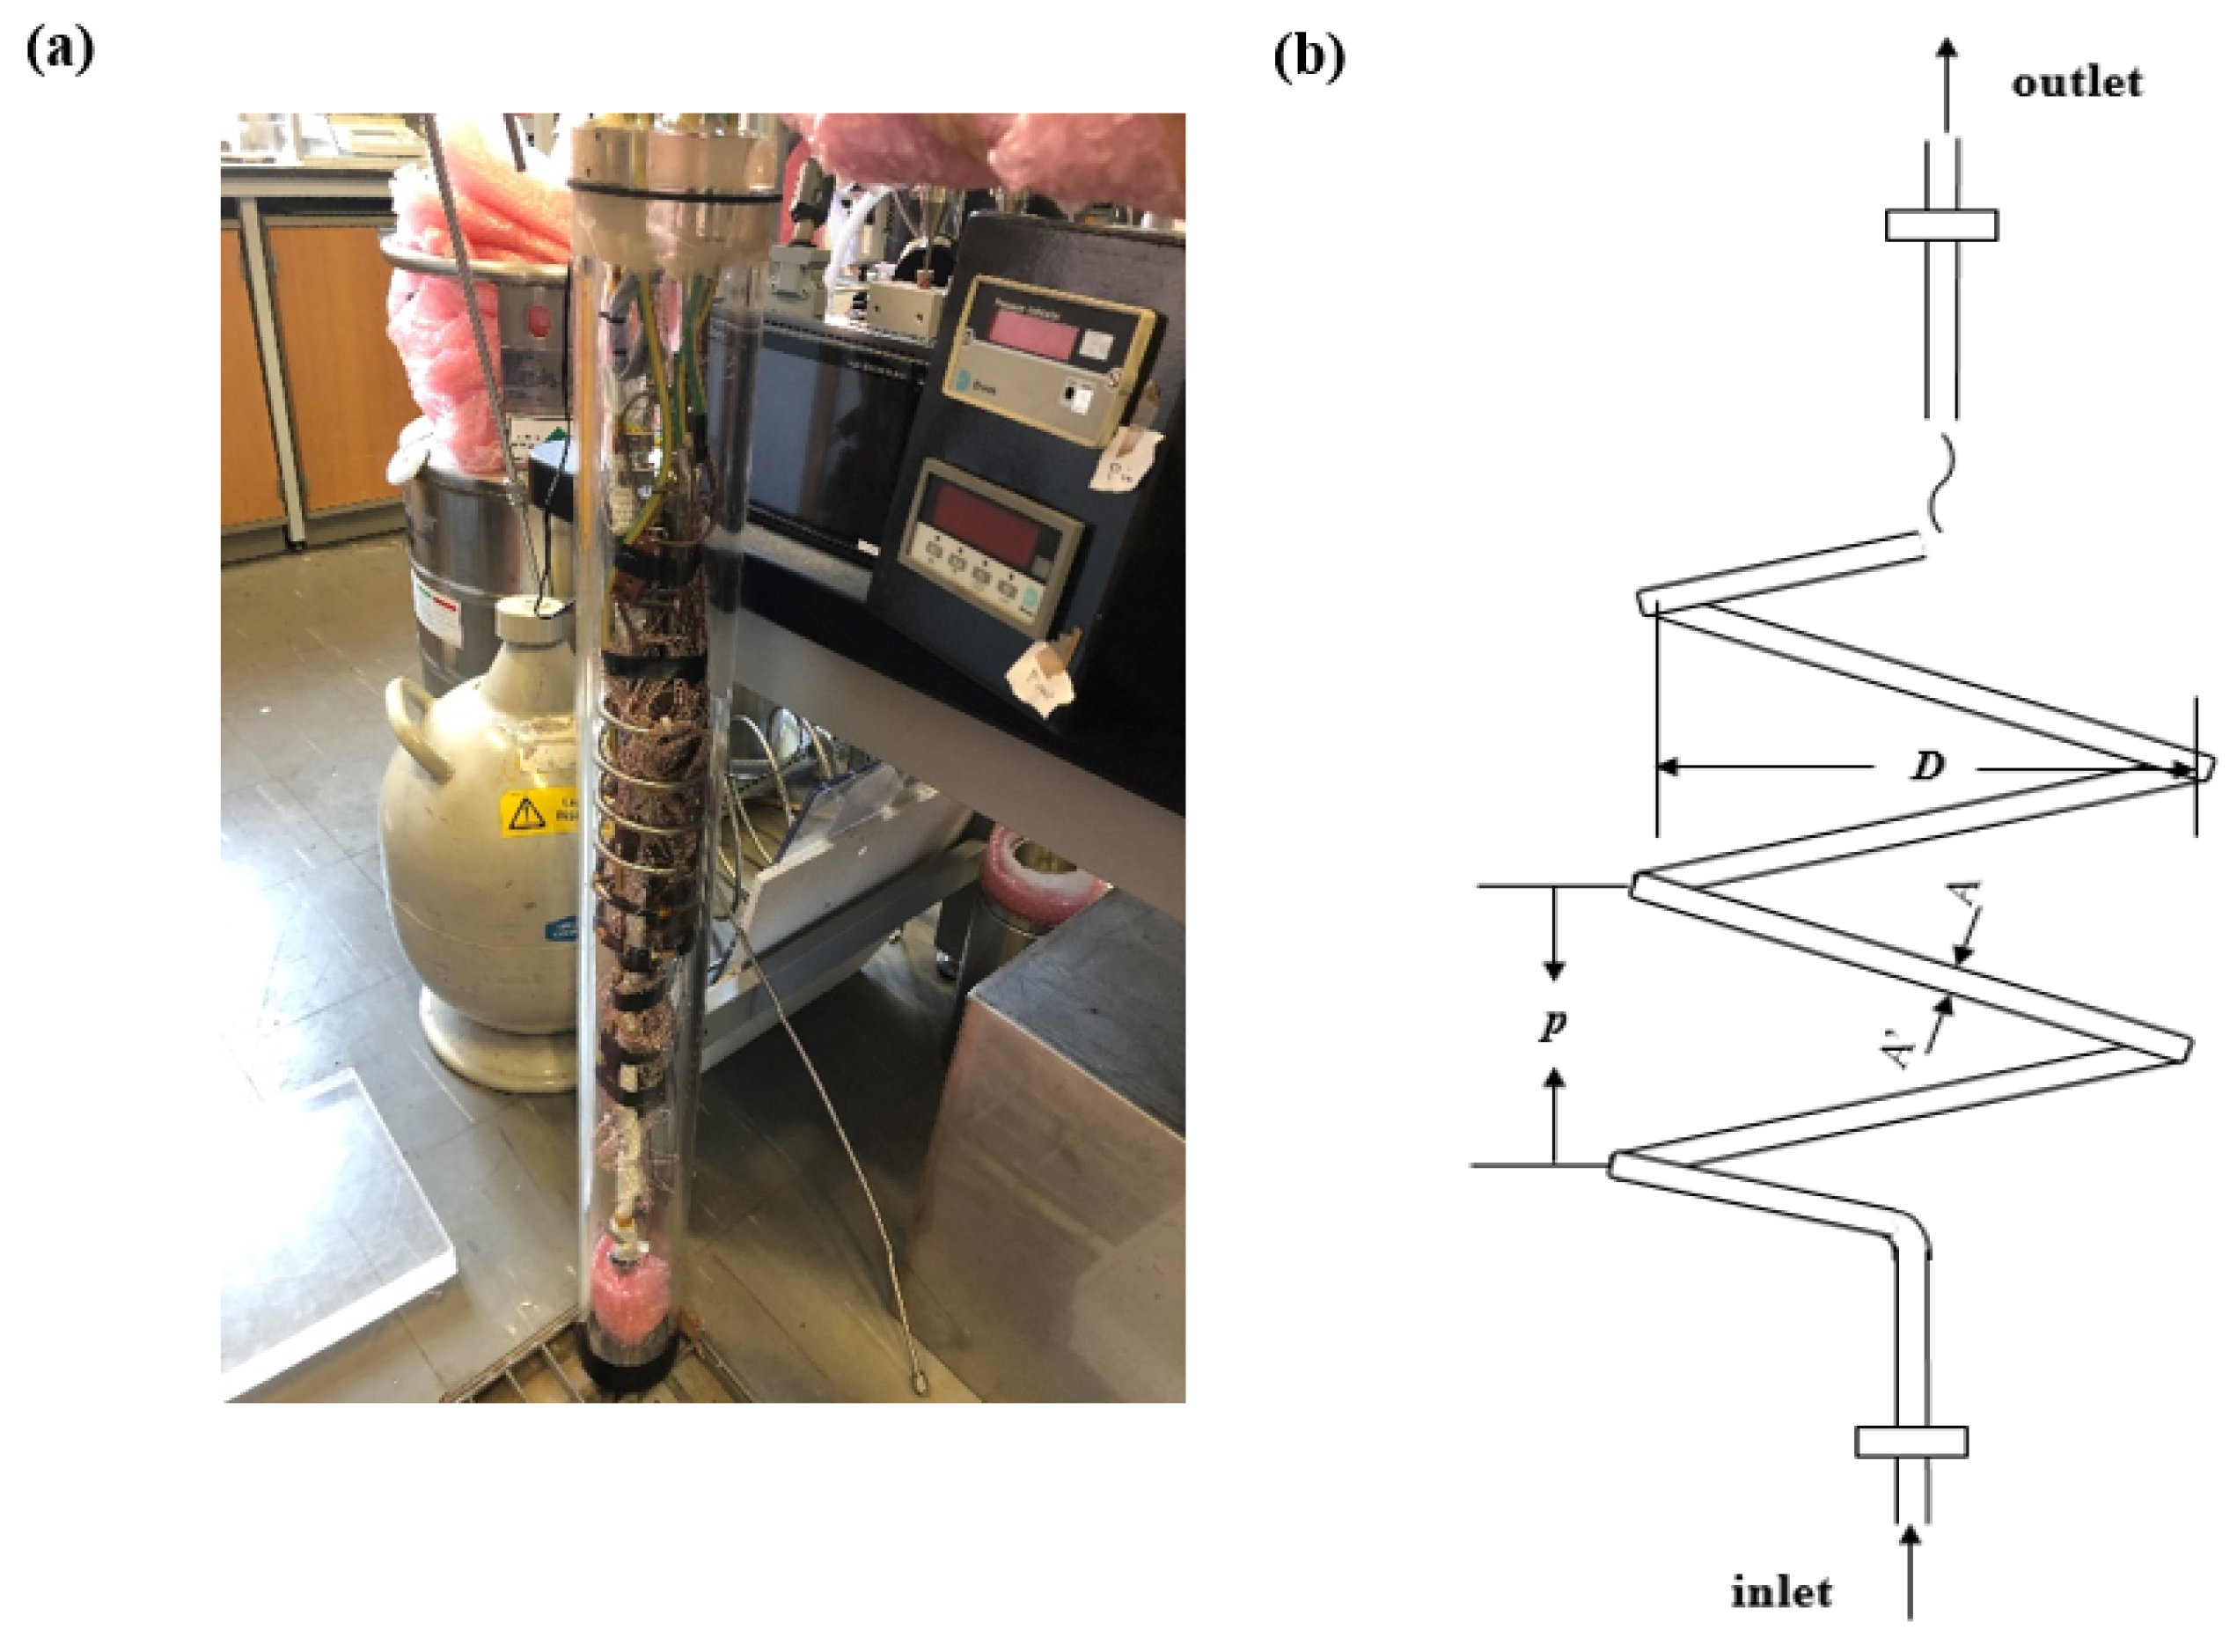
2.1. Experimental Apparatus

The heat transfer experiments were conducted in a flow loop system, as shown in Figure 3. Pressurized gas phase of N2 was supplied from two parallel connected gas cylinders. The N2 flow rate was regulated by a pressure regulator, while the flow rate reading was given via a flow meter. The system pressure was controlled using a pressure controller. A heat exchange coil was immersed in a liquid nitrogen thermostatic bath (~−190 °C) to cool N2 from gas to liquid phase. The liquid phase N2, whose temperature was a few degrees below its pseudocritical temperature at that pressure, would enter a vertically oriented helically coiled tube and be heated under constant heat flux conditions throughout the test tube. The constant heat flux conditions were attained by heating the test coil with direct electric current provided via a digital bench power supply. The entire test tube was placed in a vacuum Perspex chamber to prevent heat loss. Two Type T thermocouples were installed at the test tube inlet and outlet to measure the working fluid temperatures. The fluid temperature difference between the inlet and outlet of the test tube was deliberately controlled during experiments to fully cover the interested pseudocritical transition region of the test fluid N2.
A real picture of the helically coiled heat transfer test section is shown as Figure 4a. Figure 4b is a schematic diagram of the test tube. The stainless steel coiled tube has a tube inner and outer diameter of 4.6 and 6.4 mm and a coil curvature diameter of 71.5 mm, as well as a coil pitch of 33 mm. A direct current power supply was used to provide electrical heating to the entire length of the helical coil tube so that a constant heat flux condition was ensured on the coil tube surface. Notice that helical coil tube wall temperatures were only measured for the first 540 mm of the helical coil. According to previous supercritical nitrogen study [14,17], the 540 mm length of heating under the experimental conditions in present study is enough for nitrogen undergoing pseudocritical transition, as well as offering suitable fluid temperature ranges for studying the interested heat transfer characteristics. A cross section A-A’ along the heated test coil was selected to explain the local characterizations during heat transfer experiments, as shown in Figure 4c. As the figure demonstrates, at a certain local temperature site (e.g., A-A’), four T-type thermocouples would be embedded into the pre-manufactured grooves on the outer surface of the test coil at “top”, “bottom”, “inside”, and “outside” locations, respectively, with respect to the main flow direction. There are 9 local temperature sites across the test coil (60 mm interval), so totally 36 local temperature thermocouples. All thermocouples in the experimental system were connected to a Graphtec data logger for real-time data acquisition.

2.2. Experimental Apparatus

The heat transfer coefficient (HTC) quantifies the forced convective heat transfer rate between a heated tube wall and the heat transfer fluid. The HTC of supercritical N2 through the heated test coil is defined as follows:
h = q ( T w T b )
where q″, Tw, and Tb are the heat flux at tube wall, tube inner wall temperature, and bulk fluid temperature, respectively. Notice that local tube outer wall temperatures were measured through surface mounted thermocouples and that Tw, the tube inner wall temperatures, can be approximately calculated using the 1-D heat conduction equation,
q = k · ( T w T o u t e r ) ( Δ x )
where k, Touter, and Δx are the thermal conductivity of the tube material (~13 W/m-K for stainless steel 316), tube outer wall temperature directly measured by thermocouples, and tube wall thickness (0.9 mm), respectively.
The actual heat flux values used in Equation (3) below for data reduction always took into account the heat loss of the experimental system, which was approximately 10% of the total input power, though the heat transfer coil was placed in a vacuum environment to prevent heat loss. The system heat loss was determined through power calibration experiments by comparing the actual input power from power supply and the enthalpy difference of the test fluid between the inlet and outlet of the test tube. The enthalpy difference was experimentally acquired based on the measured inlet and outlet fluid temperatures and N2 thermophysical properties from the National Institute of Standards and Technology (NIST) database. The local bulk fluid temperature Tb was obtained by looking up the NIST N2 property table based on local N2 enthalpy, which was calculated as follows:
H l o c a l = H i n + 4 · q G · x d
where Hlocal, Hin, G, x, d is the local fluid enthalpy, fluid inlet enthalpy, fluid mass flux, axial location along the test tube length and the tube inner diameter, respectively.
Furthermore, the sensors used for the experimental measurements and their associated uncertainties are specified in Table 1. All the sensors were calibrated before the heat transfer experiments. For example, thermocouple readings were calibrated under both isothermal and heating/cooling temperature conditions. Thermocouple calibration equations were applied to each thermocouple reading for more accurate results. The uncertainty analysis of experimental results (i.e., mainly HTC values) was conducted following the multivariate propagation of error approach, as below in Equation (4). The final experimental uncertainty values were reflected against the HTC values of supercritical N2, as indicated in Appendix A, Table A1, Table A2, Table A3, Table A4, Table A5, Table A6, Table A7 and Table A8.
σ U = ( U X 1 ) 2 σ X 1 2 + ( U X 2 ) 2 σ X 2 2 + + ( U X n ) 2 σ X n 2
where:
  • U: given function of independent variables, U = U (X1, X2, ……, Xn);
  • Xn: independent variable;
  • σXn: uncertainty associated with corresponding independent variable, Xn;
  • σU: uncertainty associated with dependent variable U.

3. Results

3.1. Effects of Heating Power, Flow Rate, and Pressure on Heat Transfer

Forced convective heat transfer experiments of nitrogen undergoing pseudocritical transition were conducted in the helical coil test system. Various experimental conditions, including line pressures (35, 40 bar), constant heat fluxes (8.1, 9.3, 11.2 kW/m2), and mass fluxes (38.1, 50.8 kg/m2-s) were surveyed in order to uncover the effects of heating power, flow rate, and pressure on near pseudocritical N2 heat transfer in a helically coiled tube. The 35 bar pressure was chosen to feature the unique thermophysical property variation of nitrogen at its pseudocritical point, while the 40 bar was a case of comparison. The heat flux and mass flux values were picked based on other supercritical nitrogen studies in the literature [8,9,10] and more importantly to enable the occurrence of the interested nitrogen pseudocritical transition within the heat transfer test section. The 38.1 and 50.8 kg/m2-s mass fluxes were selected also to ensure turbulent flow conditions in the test coil, with approximate Reynolds number range of 4300 < Re < 18100.
As shown in Figure 5, for all measuring locations along the tube periphery (top, bottom, inside, outside in Figure 4), the overall N2 heat transfer coefficients (HTCs) averaged over the longitudinal length of the helical coil test tube decrease as the applied heat flux increases, at both 35 and 40 bar pressures. The HTC decline might be caused by N2 thermophysical property variation and elevated buoyancy effect due to the increased heat flux, with more fluid with lower thermal conductivity accumulated near the heated tube wall. It can also be observed from the figure that, at the same pressure, greater HTC values are achieved at higher mass fluxes because of the improved turbulent mixing and fluid–tube wall interaction. Furthermore, increasing system pressure from 35 to 40 bar leads to declines in HTC values, as illustrated in Figure 6. This is mainly because the heat capacity and thermal conductivity of N2 at 35 bar pressure, as they undergo sharp increases in values in the vicinity of pseudocritical point, are higher than those at 40 bar pressure (see Figure 1). Figure 6 also shows that the differences between HTC values of 35 bar and 40 bar are enlarged as N2 mass flow rate increases, indicating that fluid velocity and thermal responding time (the time needed to transfer a certain amount of heat)—not only the thermophysical properties—should be considered when evaluating the overall thermal performance of certain heat transfer fluids in specific applications. Furthermore, it is worth noting that the difference between inside and outside HTCs is smaller at 38.1 kg/m2-s than 50.8 kg/m2-s, especially at 40 bar pressure. The reason is that the effect of main fluid velocity shift is more significant to the outside of the tube cross section at a higher mass flux. Overall, the findings in Figure 5 and Figure 6 are consistent with the heat transfer results in the literature for supercritical N2, water, and CO2 [14,17,18,20] and thus provide validation of the experimental design and construct in the present study.

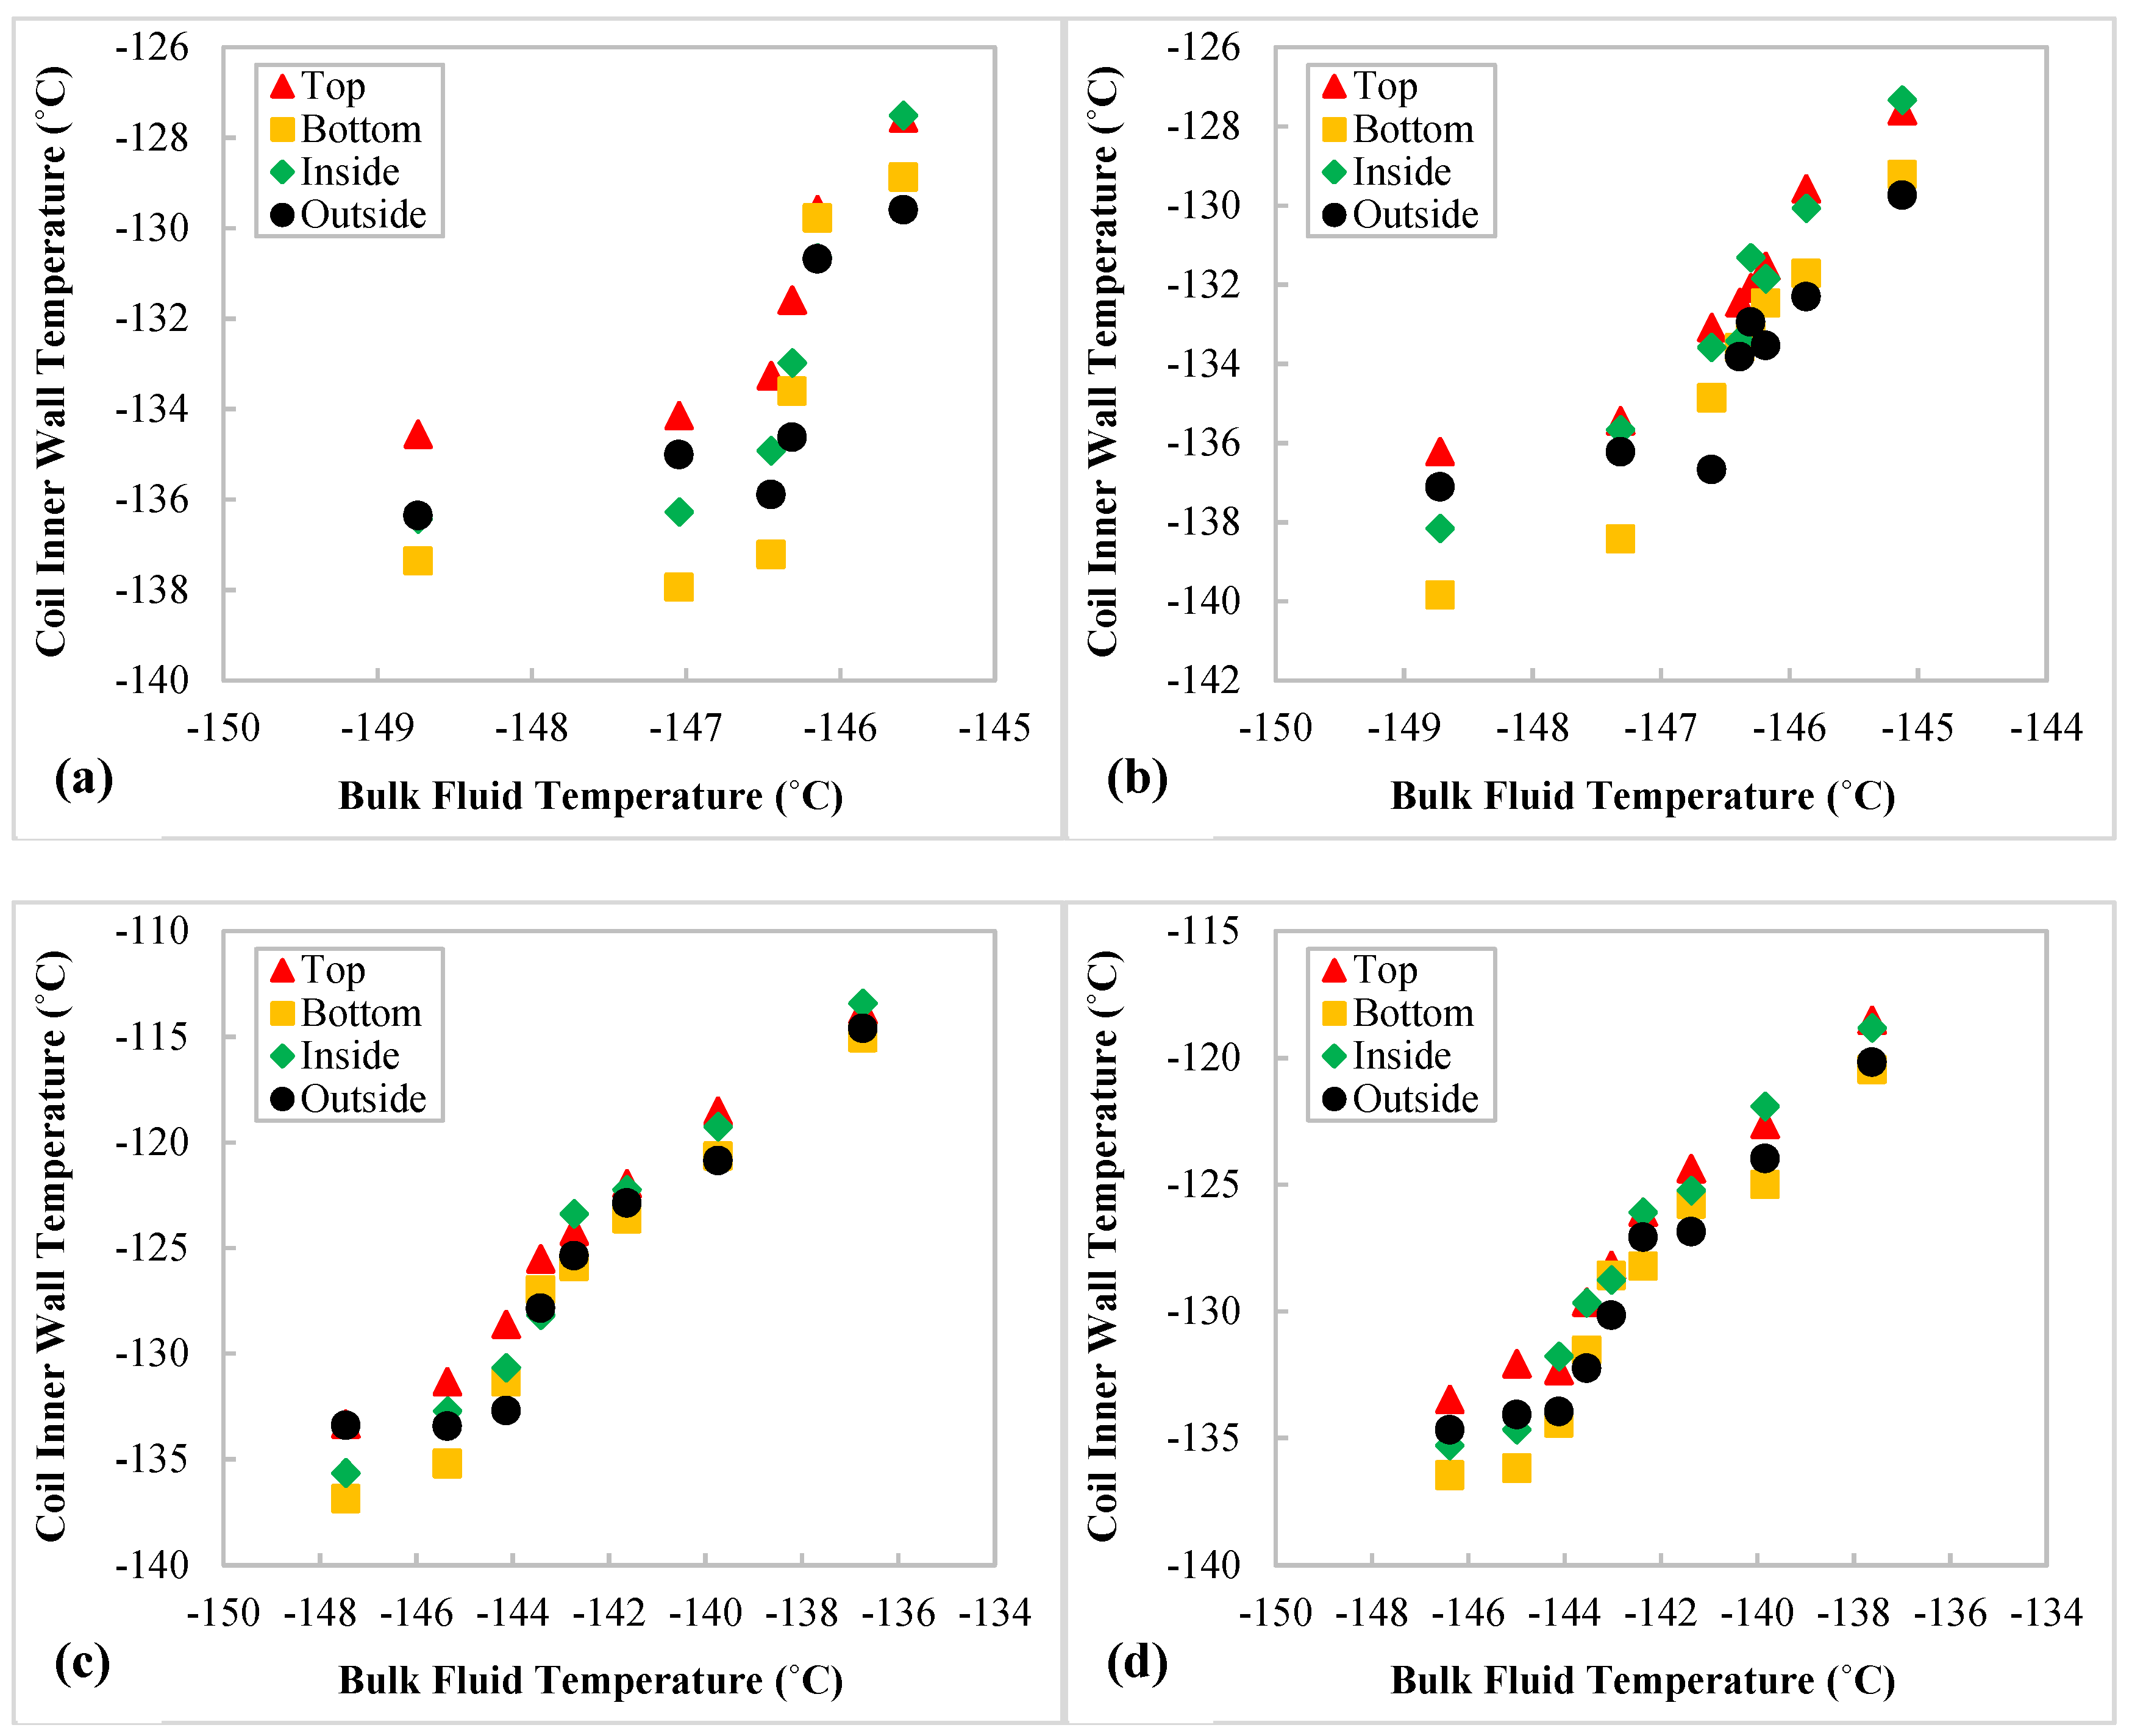
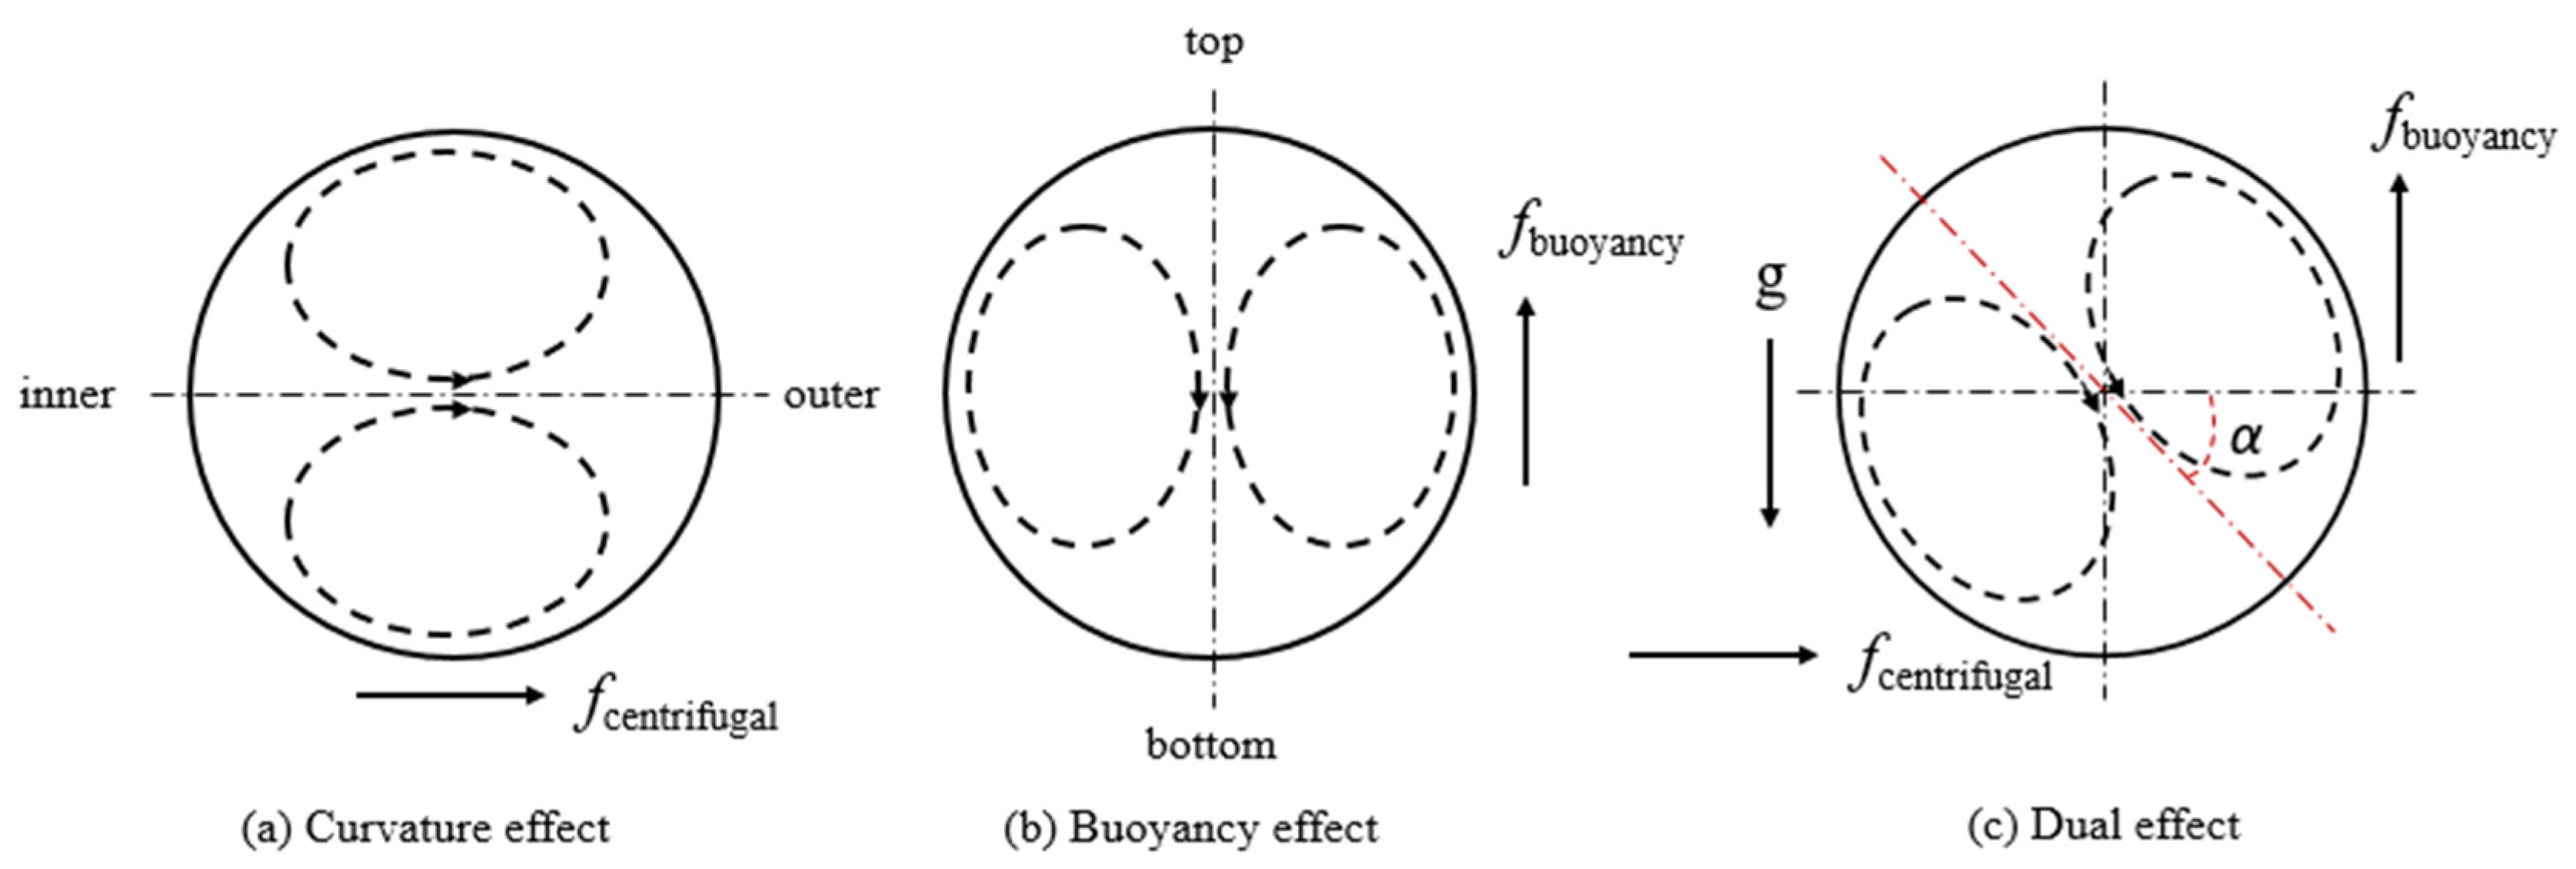
3.2. Effects of Buoyancy and Coil Curvature-Induced Centrifugal Force on Heat Transfer

One uniqueness of supercritical N2 heat transfer in a helically coiled tube is the dual effect of buoyancy and coil curvature-induced centrifugal force. The dual effect can neither be generated by using constant-property fluids (without dramatic thermophysical property variation) nor in straight tube heat transfer (no curvature). Along the cross-sectional periphery at each axial measuring location, wall temperatures and corresponding HTCs are determined at top, bottom, inside, and outside of the cross section (see Figure 4) to characterize the dual effect of buoyancy and centrifugal force on convective heat transfer since buoyance drives colder fluid to the bottom of the tube [14,15,16], and centrifugal force makes the main fluid velocity shift to the outside [7,9]. Secondary flows within the cross-sectional planes of the helical coil and their contributions to overall heat transfer are affected by the dual effect as well; for example, secondary flow vortices are rotated to a certain angle depending on the dominant force exerted on the fluid, as displayed in Figure 2 [23,24,25]. Zhao et al. [24] also found that the maximum secondary flow velocity near the bottom tube wall was 17.6% higher than that near the top wall for supercritical water in a helical coil.
Based on the local inner wall temperatures of the coiled tube (see Figure A1 for temperature profile examples), Figure 7 and Figure 8 illustrate the local HTCs of supercritical N2 passing through the heated helical coil under various flow rate and constant heat flux conditions at 35 and 40 bar pressure, respectively. The red dotted vertical line in each figure denotes the pseudocritical temperature under the corresponding pressure (−146.3 °C at 35 bar, −143.4 °C at 40 bar). According to both Figure 7 and Figure 8, local HTCs at tube bottoms are the highest but lowest at tube tops before the pseudocritical points, suggesting buoyancy is the dominant effect on heat transfer within the relevant experimental conditions as colder N2 moved to the tube bottom but hotter and more “gaseous” N2 accumulated at the top of the tube with lower thermal conductivity, density, and viscosity. The secondary flow vortices might be stretched as well, resulting in higher secondary flow velocities at the tube bottom [24]. While as N2 temperature goes higher along the coil axis and eventually passes the pseudocritical temperature, the highest HTCs are shifted towards the tube outside. This is because the main fluid velocity, which is shifted to the tube outside under coil curvature-induced centrifugal force, starts to play a more dominant role in local heat transfer due to the accelerated fluid flow beyond the pseudocritical point [24]. Another notable discovery is that the fluid temperature changes are much smaller among axial measuring locations near the pseudocritical point than the locations before and after the point in Figure 7 for 35 bar pressure, whereas the same situation is moderated in Figure 8 for 40 bar pressure. The fluid temperature results make sense because supercritical N2 experiences an extreme specific heat increase at its pseudocritical point at 35 bar while the increment of specific heat at 40 bar is small (see Figure 1). In addition, the consistencies between fluid temperature results and theoretical fluid thermophysical properties further validate the experiments in the present study.
A dimensionless number Ψ was proposed in the study by Zhang et al. of supercritical CO2 heat transfer in a heliacally coiled tube [17] to represent the ratio between buoyancy and the curvature effect on heat transfer, which is defined as follows,
Ψ = G r g [ 2 · D e * 2 · ( 2 ρ w / ρ b ) ]
G r g = g · ρ b ρ w ρ b · d 3 v 2
D e * = R e · r / R 1 + p / 2 π R
where Grg and De* are the gravitational Grashof number for buoyancy effect and the modified Dean number for curvature-induced centrifugal effect, respectively. ρw, ρb, d, g, Re, r, R, p, and v are fluid density near coil tube wall, bulk fluid density, coil tube inner diameter, gravitational acceleration, Reynolds number, tube inner radius, coil curvature radius, coil pitch, and fluid kinematic viscosity, respectively. Accordingly, Ψ was calculated based on the heat transfer results of supercritical N2 in present study to explain the corresponding HTC results as well as to provide guidance for the future design of a supercritical N2 heat exchanger. As Figure 9 shows, the Ψ values are generally lower for higher flow rate because higher flow rate leads to more curvature-induced centrifugal effect, whereas the comparison between Ψ values at higher and lower pressures is a balance between both intensified buoyance and centrifugal effects due to fluid thermophysical property variation, i.e., decreased viscosity and increased fluid velocity. Furthermore, according to the flow regime map from Zhang et al. [23] for Ψ values of supercritical CO2, the Ψ values of supercritical N2 in Figure 9 fall into the “mixed convection” region (50 > Ψ > 1), where both buoyancy and centrifugal effects contribute to the heat transfer. In addition, it can be seen from Figure 9 that the Ψ values of supercritical N2 are much greater than 1 (~10–20) at fluid temperatures below the pseudocritical temperature and rapidly drop to be close to 1 at higher temperatures due to the sharp thermophysical property change of N2 at its pseudocritical point, e.g., sharp decrease in viscosity shown in Figure 1. Therefore, the trend of Ψ values around the pseudocritical point is consistent with the local HTC results in Figure 7 and Figure 8, in which the buoyancy effect dominates the supercritical N2 convective heat transfer in the helically coiled tube at fluid temperatures below the pseudocritical temperature, but the coil curvature-induced centrifugal effect starts playing more important roles as fluid temperature increases—i.e., as the Ψ value gets close to 1.

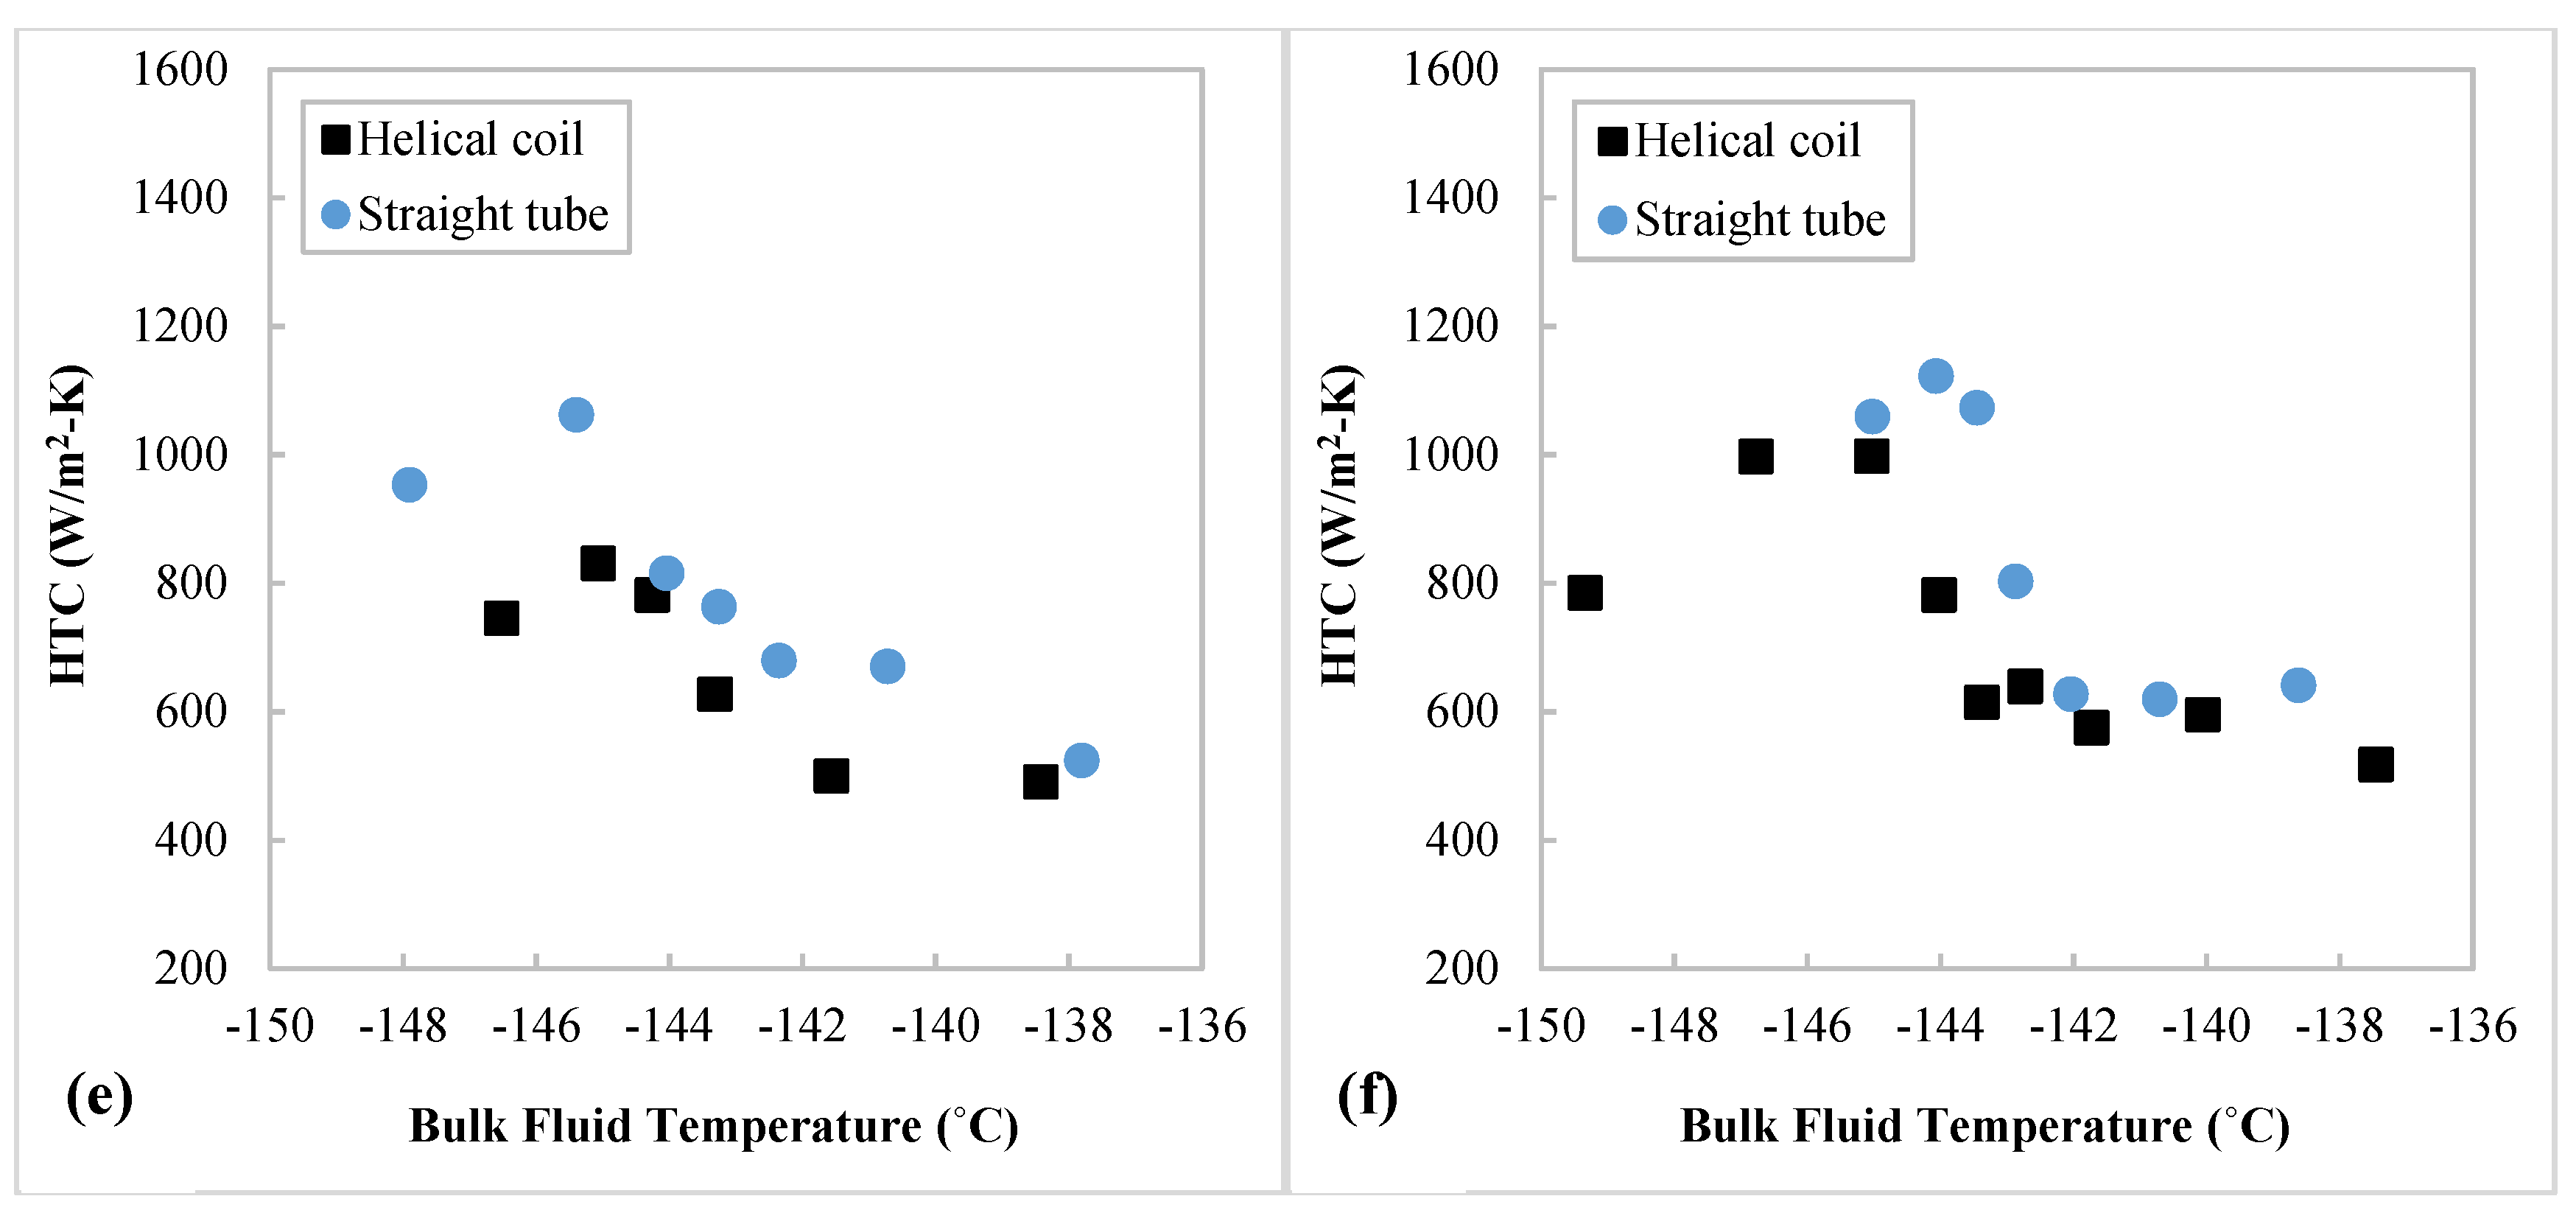
3.3. Comparison between Heat Transfer in Helically Coiled Tube and Straight Tube

For subcritical constant-property fluids—i.e., without sharp thermophysical property change when the condition varies—internal flow convective heat transfer is improved in the helically coiled tube compared with heat transfer in the straight tube due to enhanced turbulent mixing [7,8,26]. However, the comparison between helical coil and straight tube becomes more complex for supercritical fluids with dramatic thermophysical variations near pseudocritical points. For example, under the effects of thermophysical property change and buoyancy, the orientation of the test tube would have stronger impact on heat transfer in the helically coiled tube. To further evaluate the heat transfer performance of supercritical N2 in the vertical helical coil, the heat transfer results in the present study are compared with the corresponding results in a vertically oriented straight tube under the same experimental conditions, as demonstrated in Figure 10 and Figure 11 for 35 bar and 40 bar pressure, respectively. More details regarding the experimental setup for straight tube experiments can be found in [17,27]. Note the local HTC values from the bottom measuring locations in the helically coiled tube were used for the comparisons since the fluids near the coiled tube bottom may be subject to low levels of buoyancy (i.e., lighter fluid tend to move up) and centrifugal effects (i.e., main flow shift to the outside of the coil), and hence, HTCs from the coil tube bottom are the more appropriate counterparts for the local HTC values in the vertical straight tube.
It can be observed from the figures that the local HTC values of supercritical N2 in the helically coiled tube are not higher than those in the straight tube under the same experimental conditions, including pressures (35, 40 bar), heat fluxes (8.1, 9.3, 11.2 kW/m2), and mass fluxes (38.1, 50.8 kg/m2-s). Specifically, higher straight tube HTC values occur more at fluid temperatures below the pseudocritical temperature, while the HTC values move to be close with each other between straight tube and helical coil for fluid temperatures above the pseudocritical temperature. One possible reason is that the effects of sharp specific heat increase and coil curvature-induced turbulent mixing gets attenuated by the buoyancy effect as the vertical helical coil has a flow orientation in between a vertically and horizontally oriented tube; while for fluid temperatures above the pseudocritical temperature, the fluid circulation due to difference in fluid temperature is weakened as supercritical N2 becomes more “gaseous” with much lower thermal conductivity, density, and viscosity, thereby leading to reduced differences in HTC values between straight tube and helical coil. Furthermore, the HTC comparison between supercritical fluid in a straight tube and helical coil is scarce in literature and there are inconsistencies among the results of existing studies. For example, although higher HTC values were reported in a helical coil than in a straight tube for supercritical fluid [28], results from other supercritical fluid studies [23,29,30] show either lower or equal HTC values in helical coils compared with those in straight tubes. Overall, heat transfer of supercritical N2 in a helically coiled tube is a complex problem that depends on various factors such as test tube orientation, fluid temperature region, and operating pressure, so that its comparison with heat transfer results in straight tube should be further studied and discussed on a case by case basis.

4. Conclusions

In the present study, forced convective heat transfer experiments of N2 near its pseudocritical point (e.g., −146.3 °C at 35 bar) were conducted under various experimental conditions, including pressure (35, 40 bar), mass flux (38.1, 50.8 kg/m2-s), and constant heat flux (8.1, 9.3, 11.2 kW/m2). The heat transfer results were analyzed to show the effects of buoyance and curvature-induced centrifugal force, as well as different experimental conditions on the heat transfer behaviors of near pseudocritical N2 in a helically coiled tube, which is essential for the future design of cryogenic heat exchangers—e.g., in liquid air energy storage. The main concluding remarks are as follows:
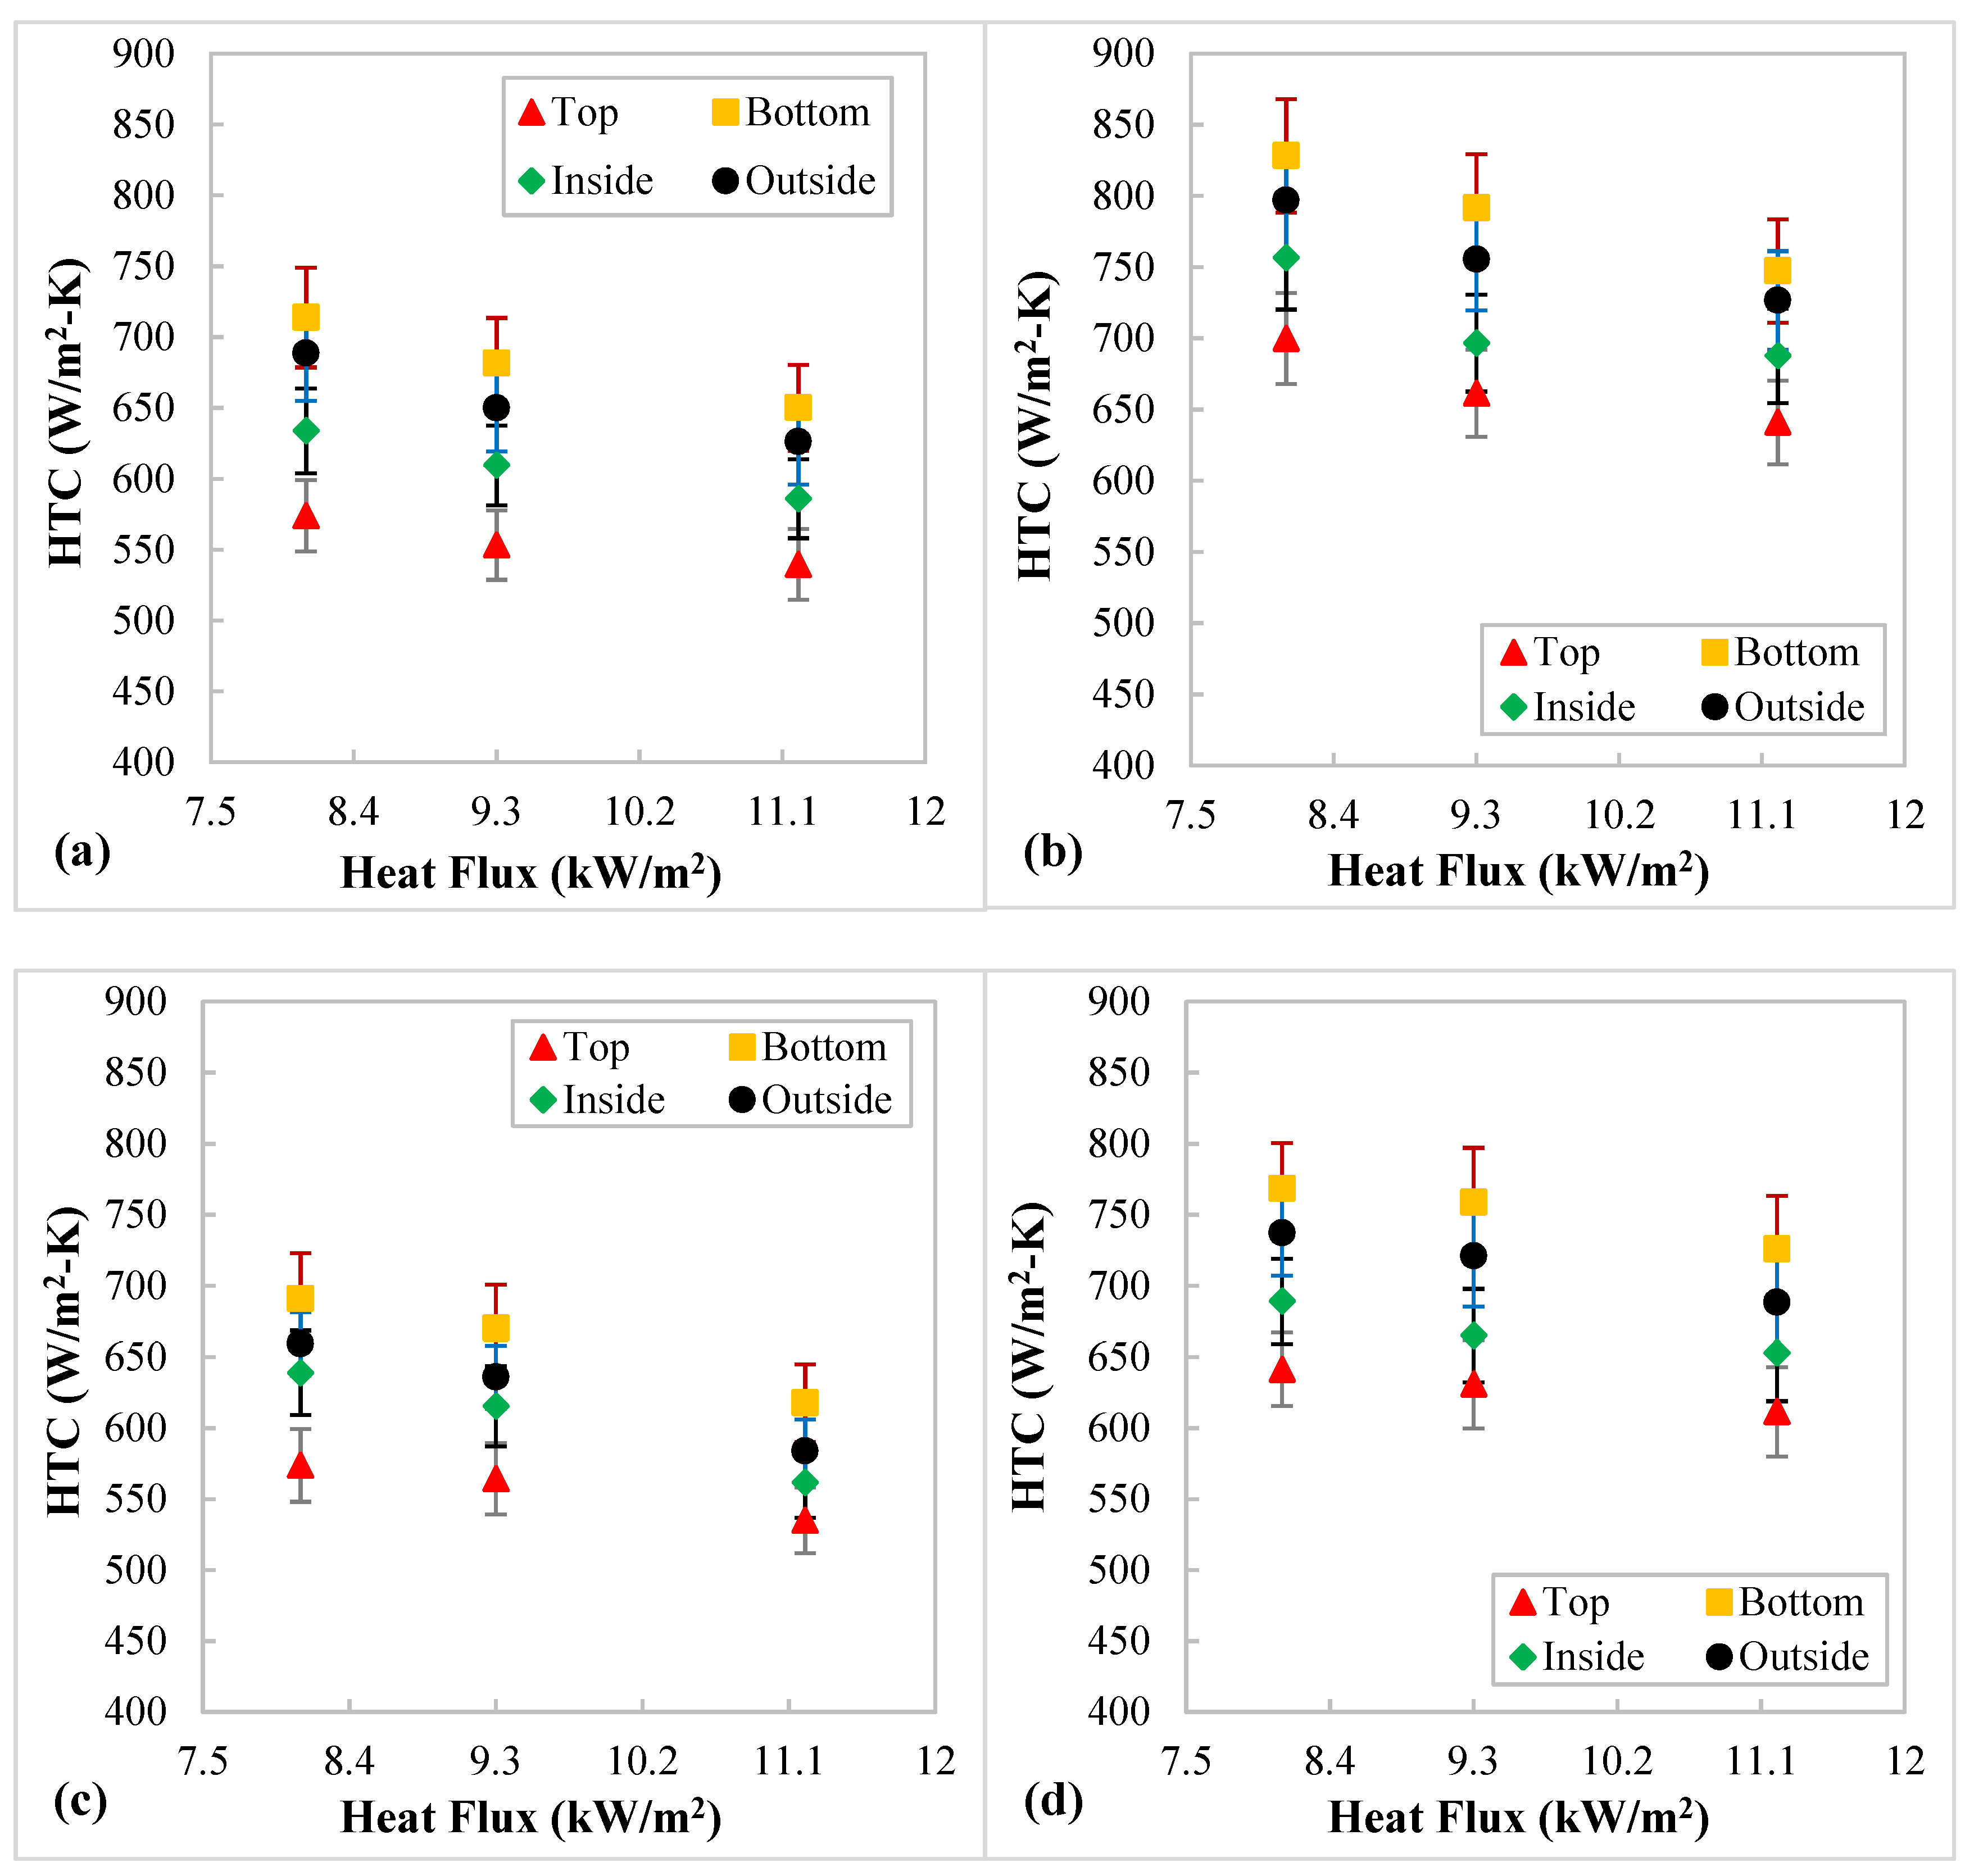
  • The heat transfer coefficients (HTCs) of near pseudocritical nitrogen increase with the increase in mass flux but decrease with the increment in heat flux and pressure in the helically coiled tube.
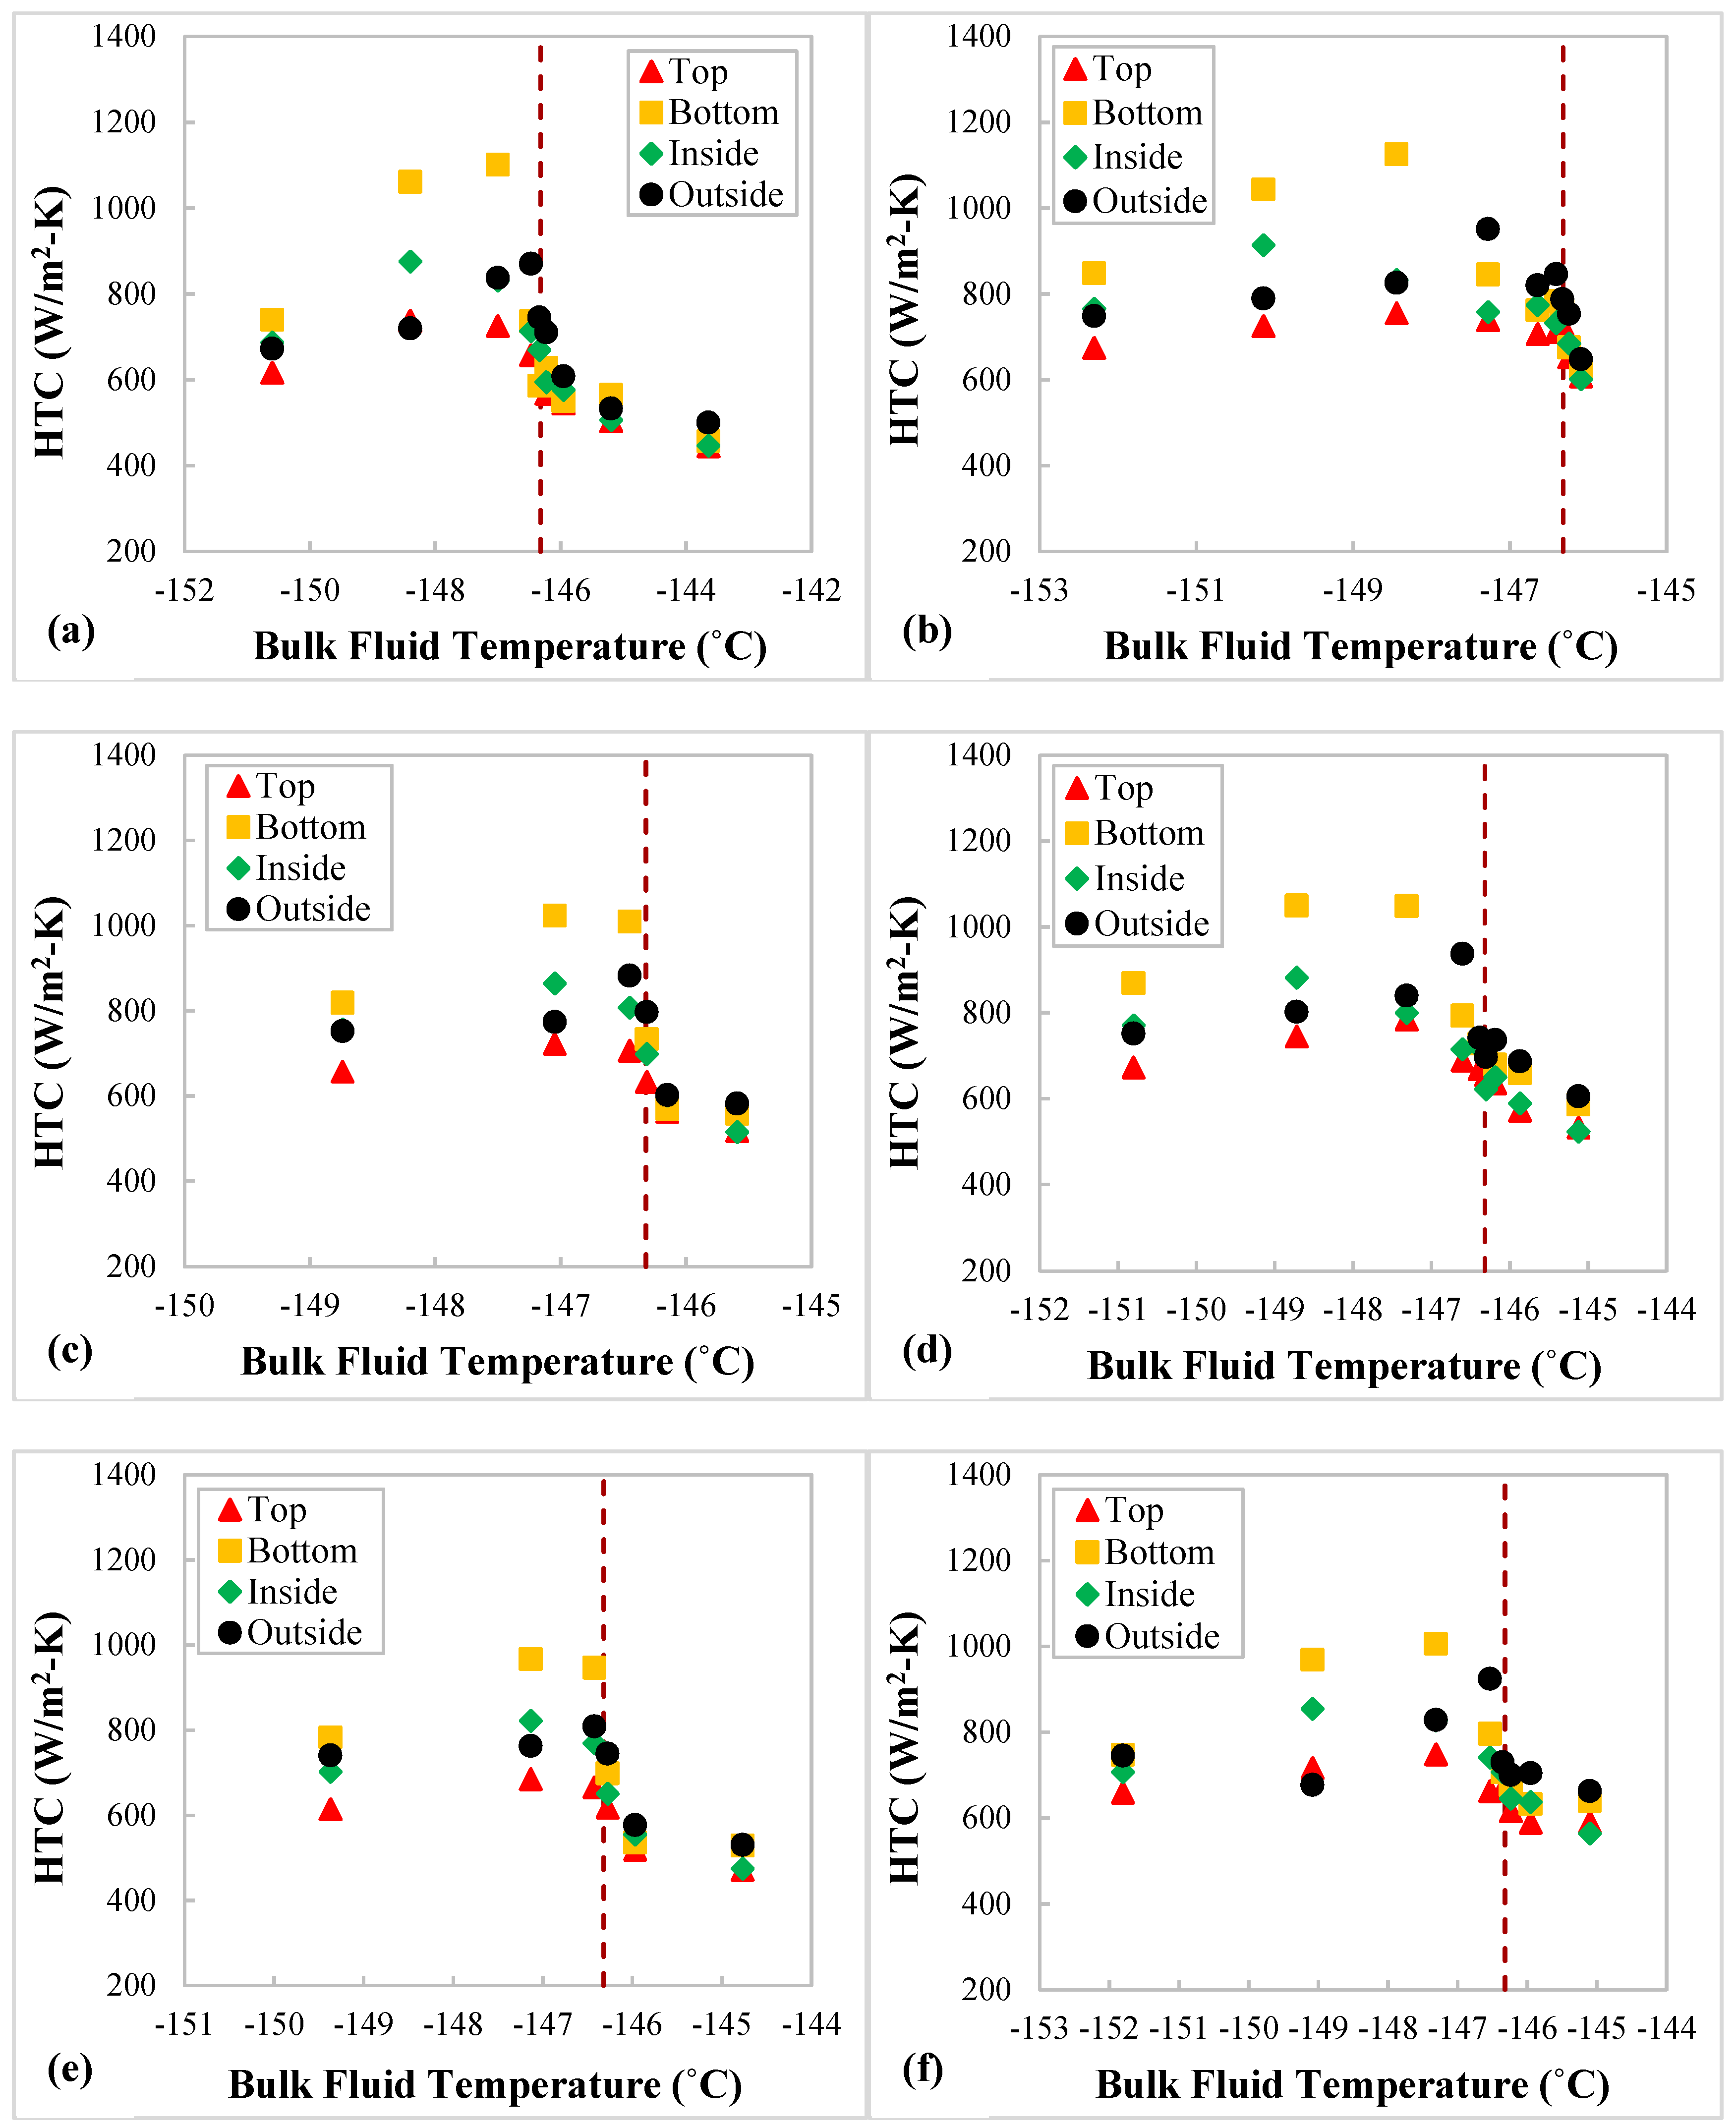
  • The local HTCs of the nitrogen follow the same trend as other supercritical fluids, such as water and CO2—that is, they first increase to a peak value in the vicinity of the pseudocritical point but then dramatically drop as the fluid temperature keeps increasing.
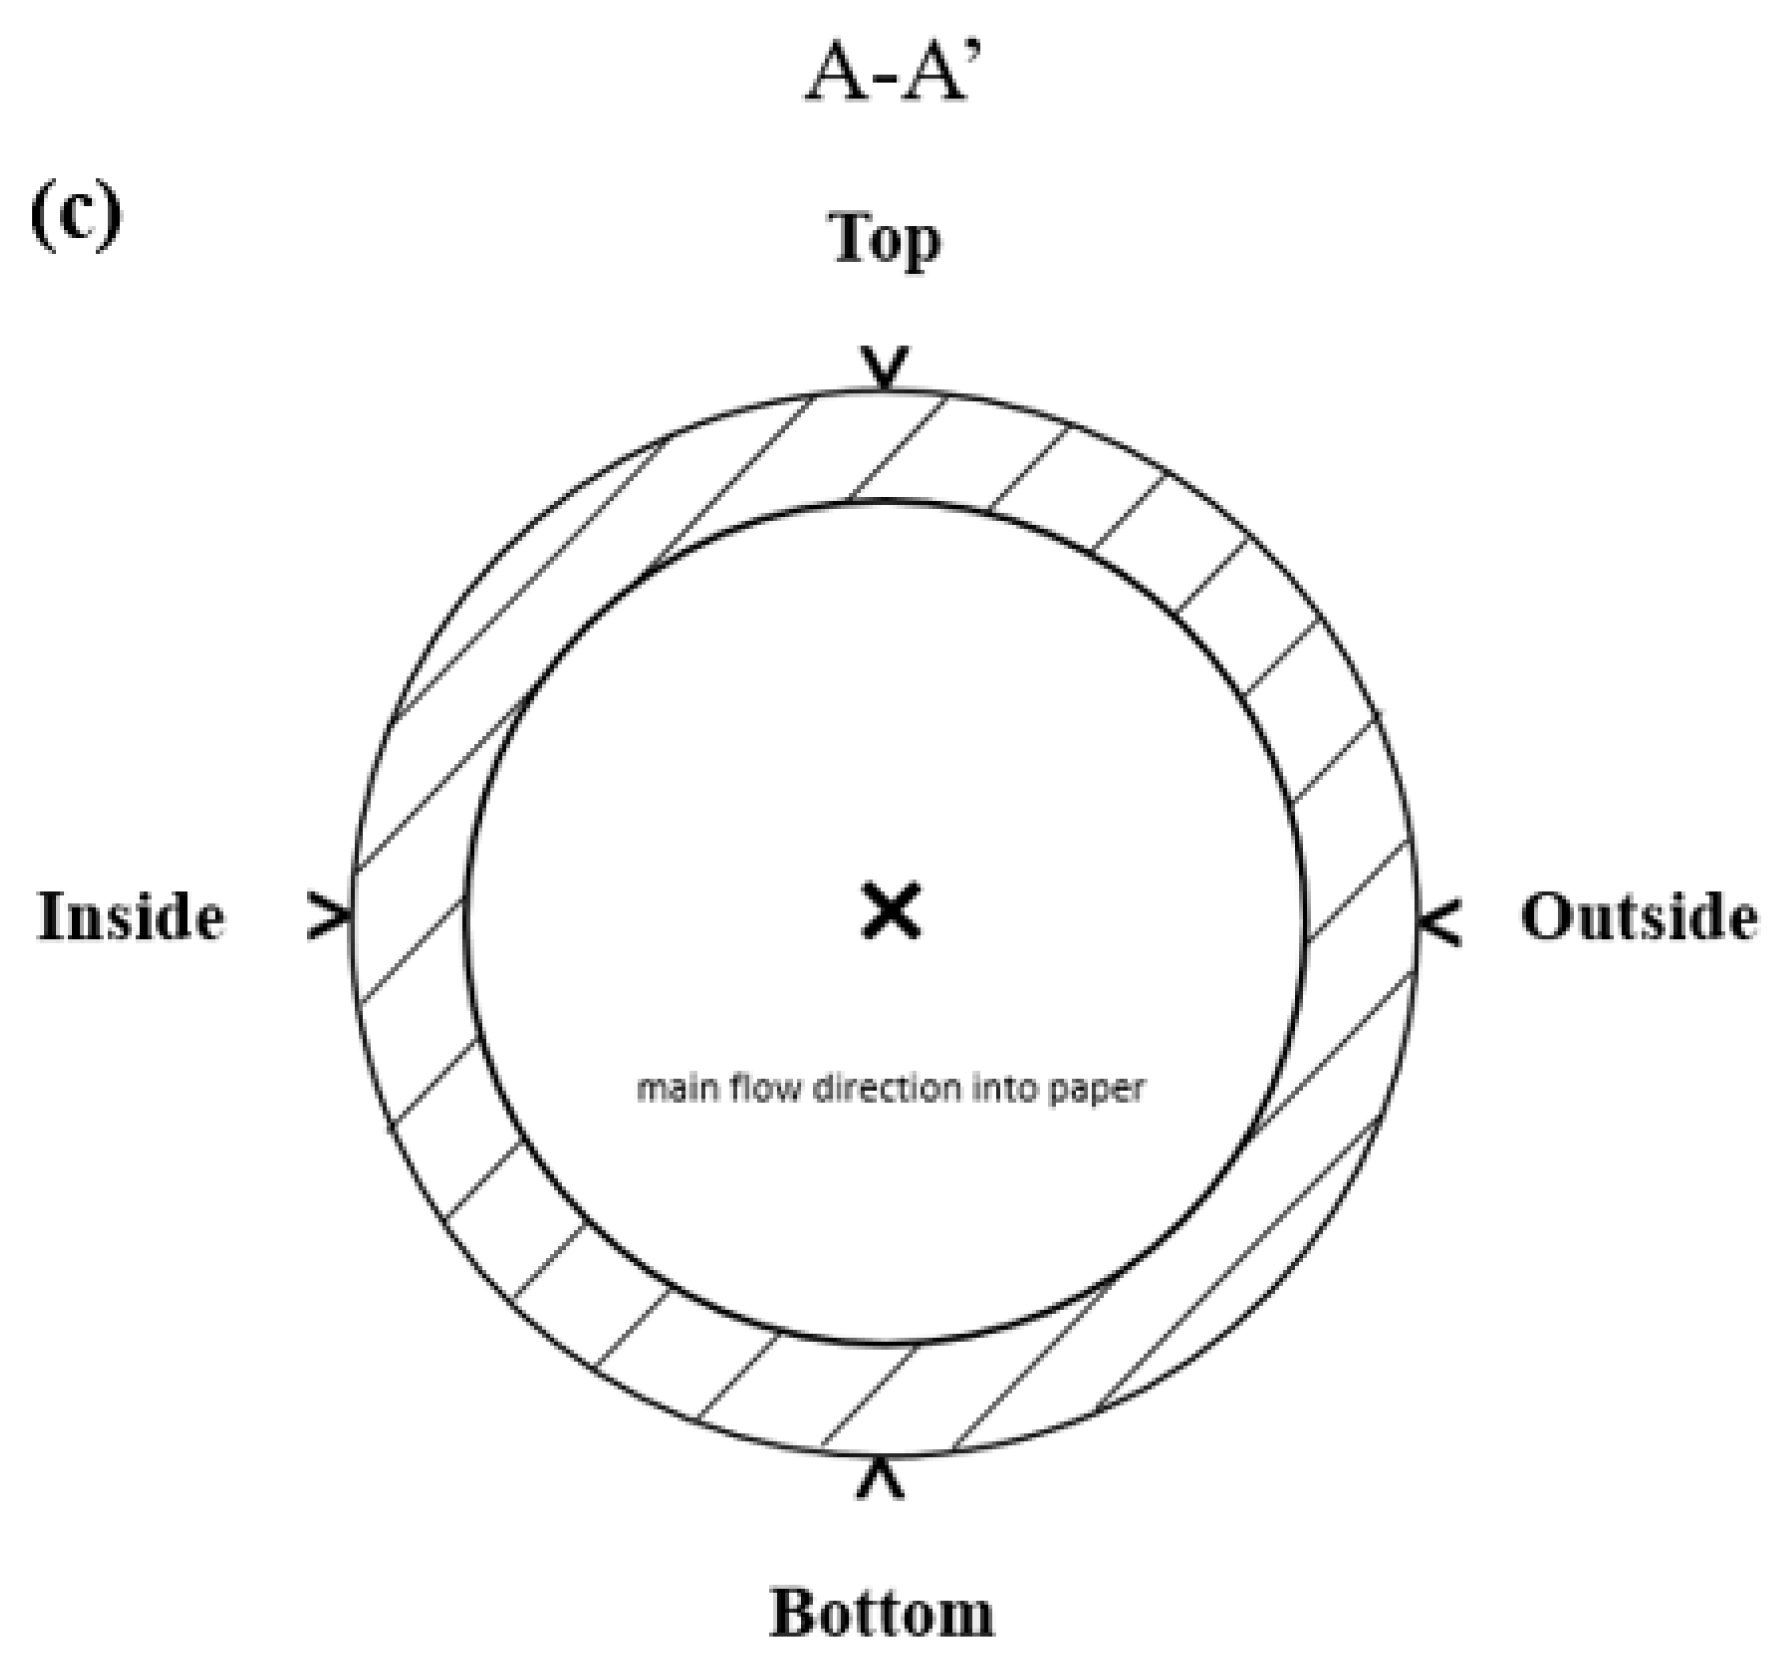
  • The local HTCs are highest at the bottom measuring position of a local coil cross section at fluid temperatures below the pseudocritical temperature featuring the buoyancy effect, but they are at the outside position for higher fluid temperatures as the fluid accelerates, and thereby the curvature-induced centrifugal effect starts to have stronger impact.
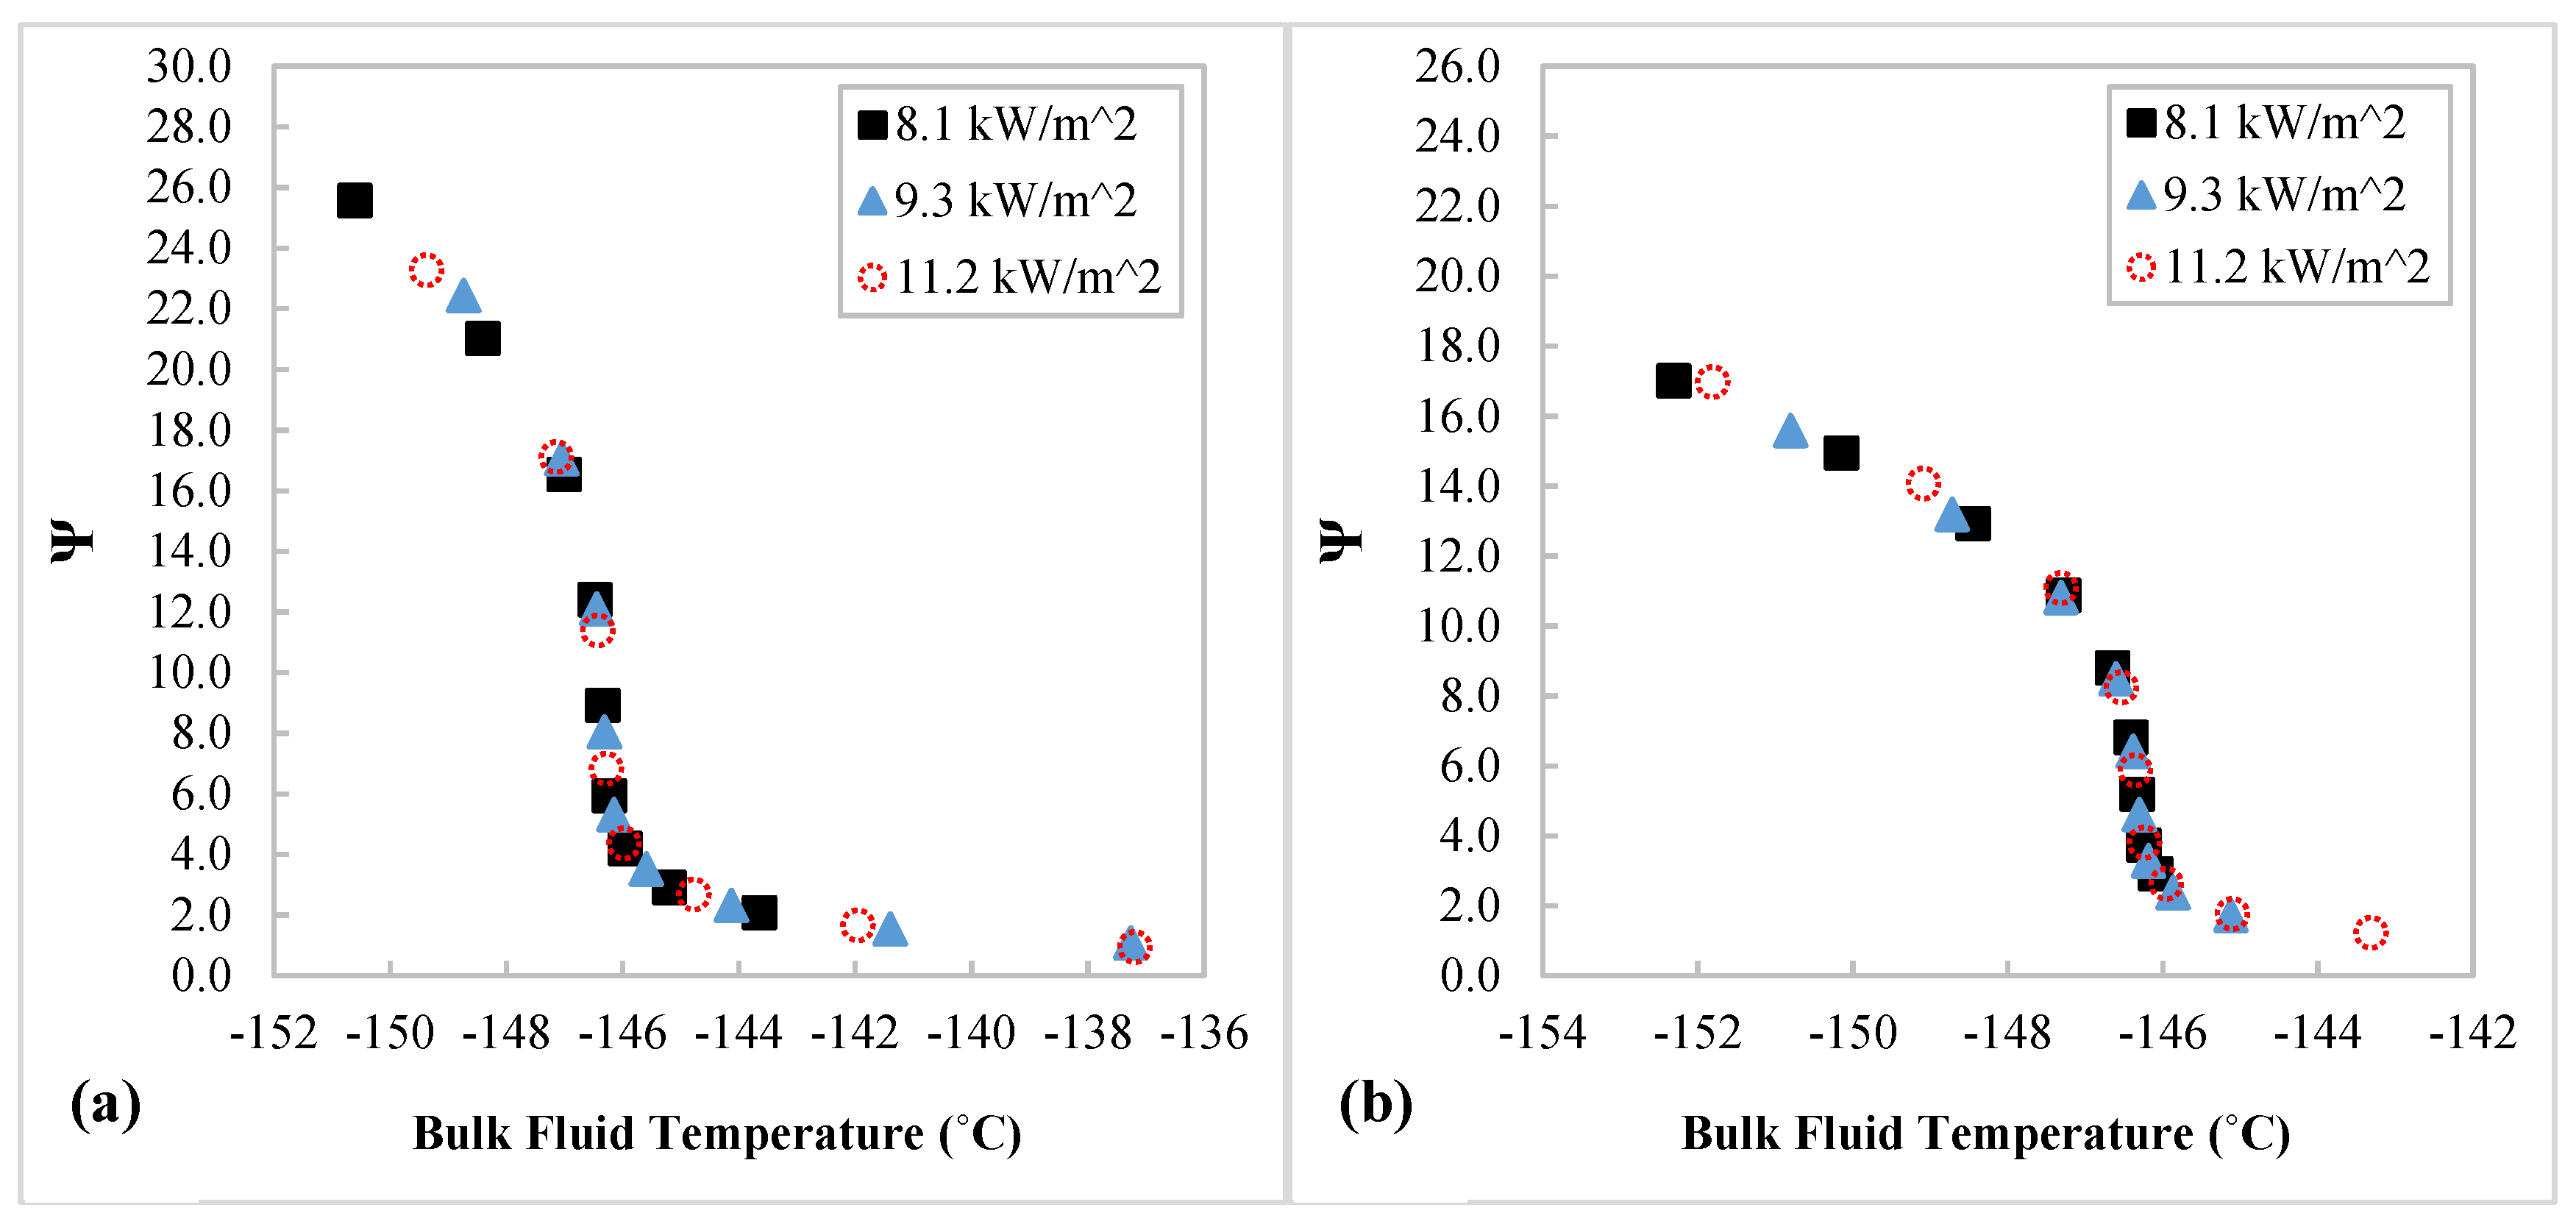
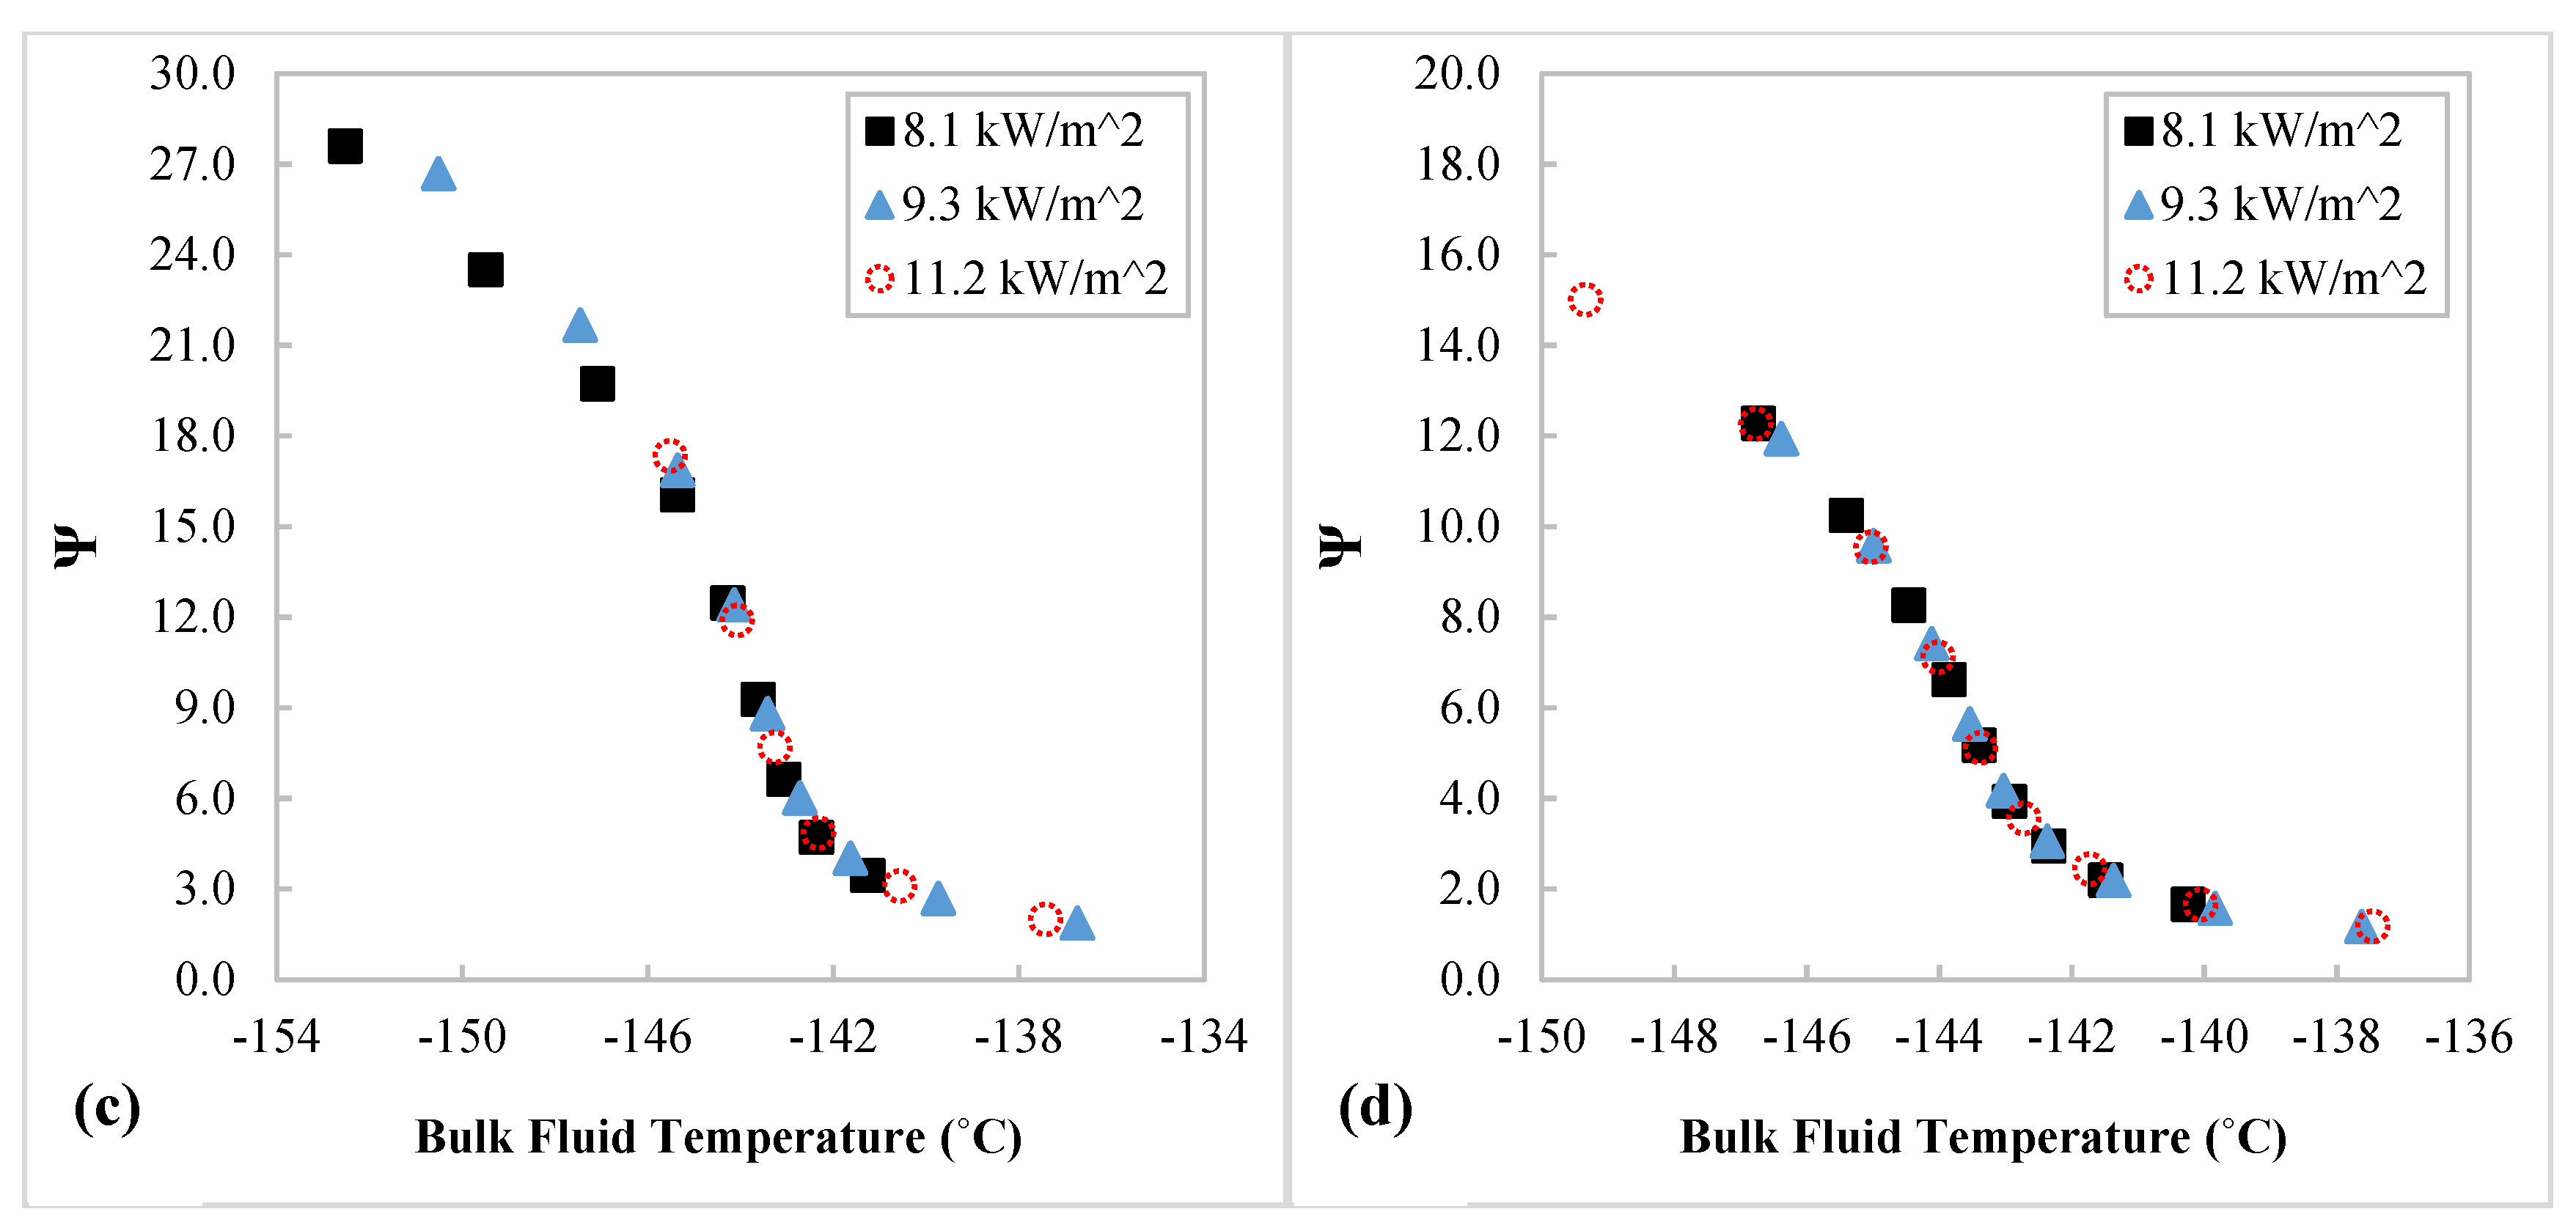
  • The values of dimensionless number Ψ, which is a ratio between the effect of buoyance and curvature, indicate the mixed convection nature of near pseudocritical N2 heat transfer in the helically coiled tube—i.e., depending on the dual effect of buoyancy and curvature. The Ψ values are much greater than 1 at fluid temperatures below the pseudocritical temperature, suggesting that the heat transfer is dominated by the buoyancy effect while the Ψ values are getting close to 1 at fluid temperatures above, showing that the coil curvature-induced centrifugal effect plays a more important role in the dual effect at higher temperatures.
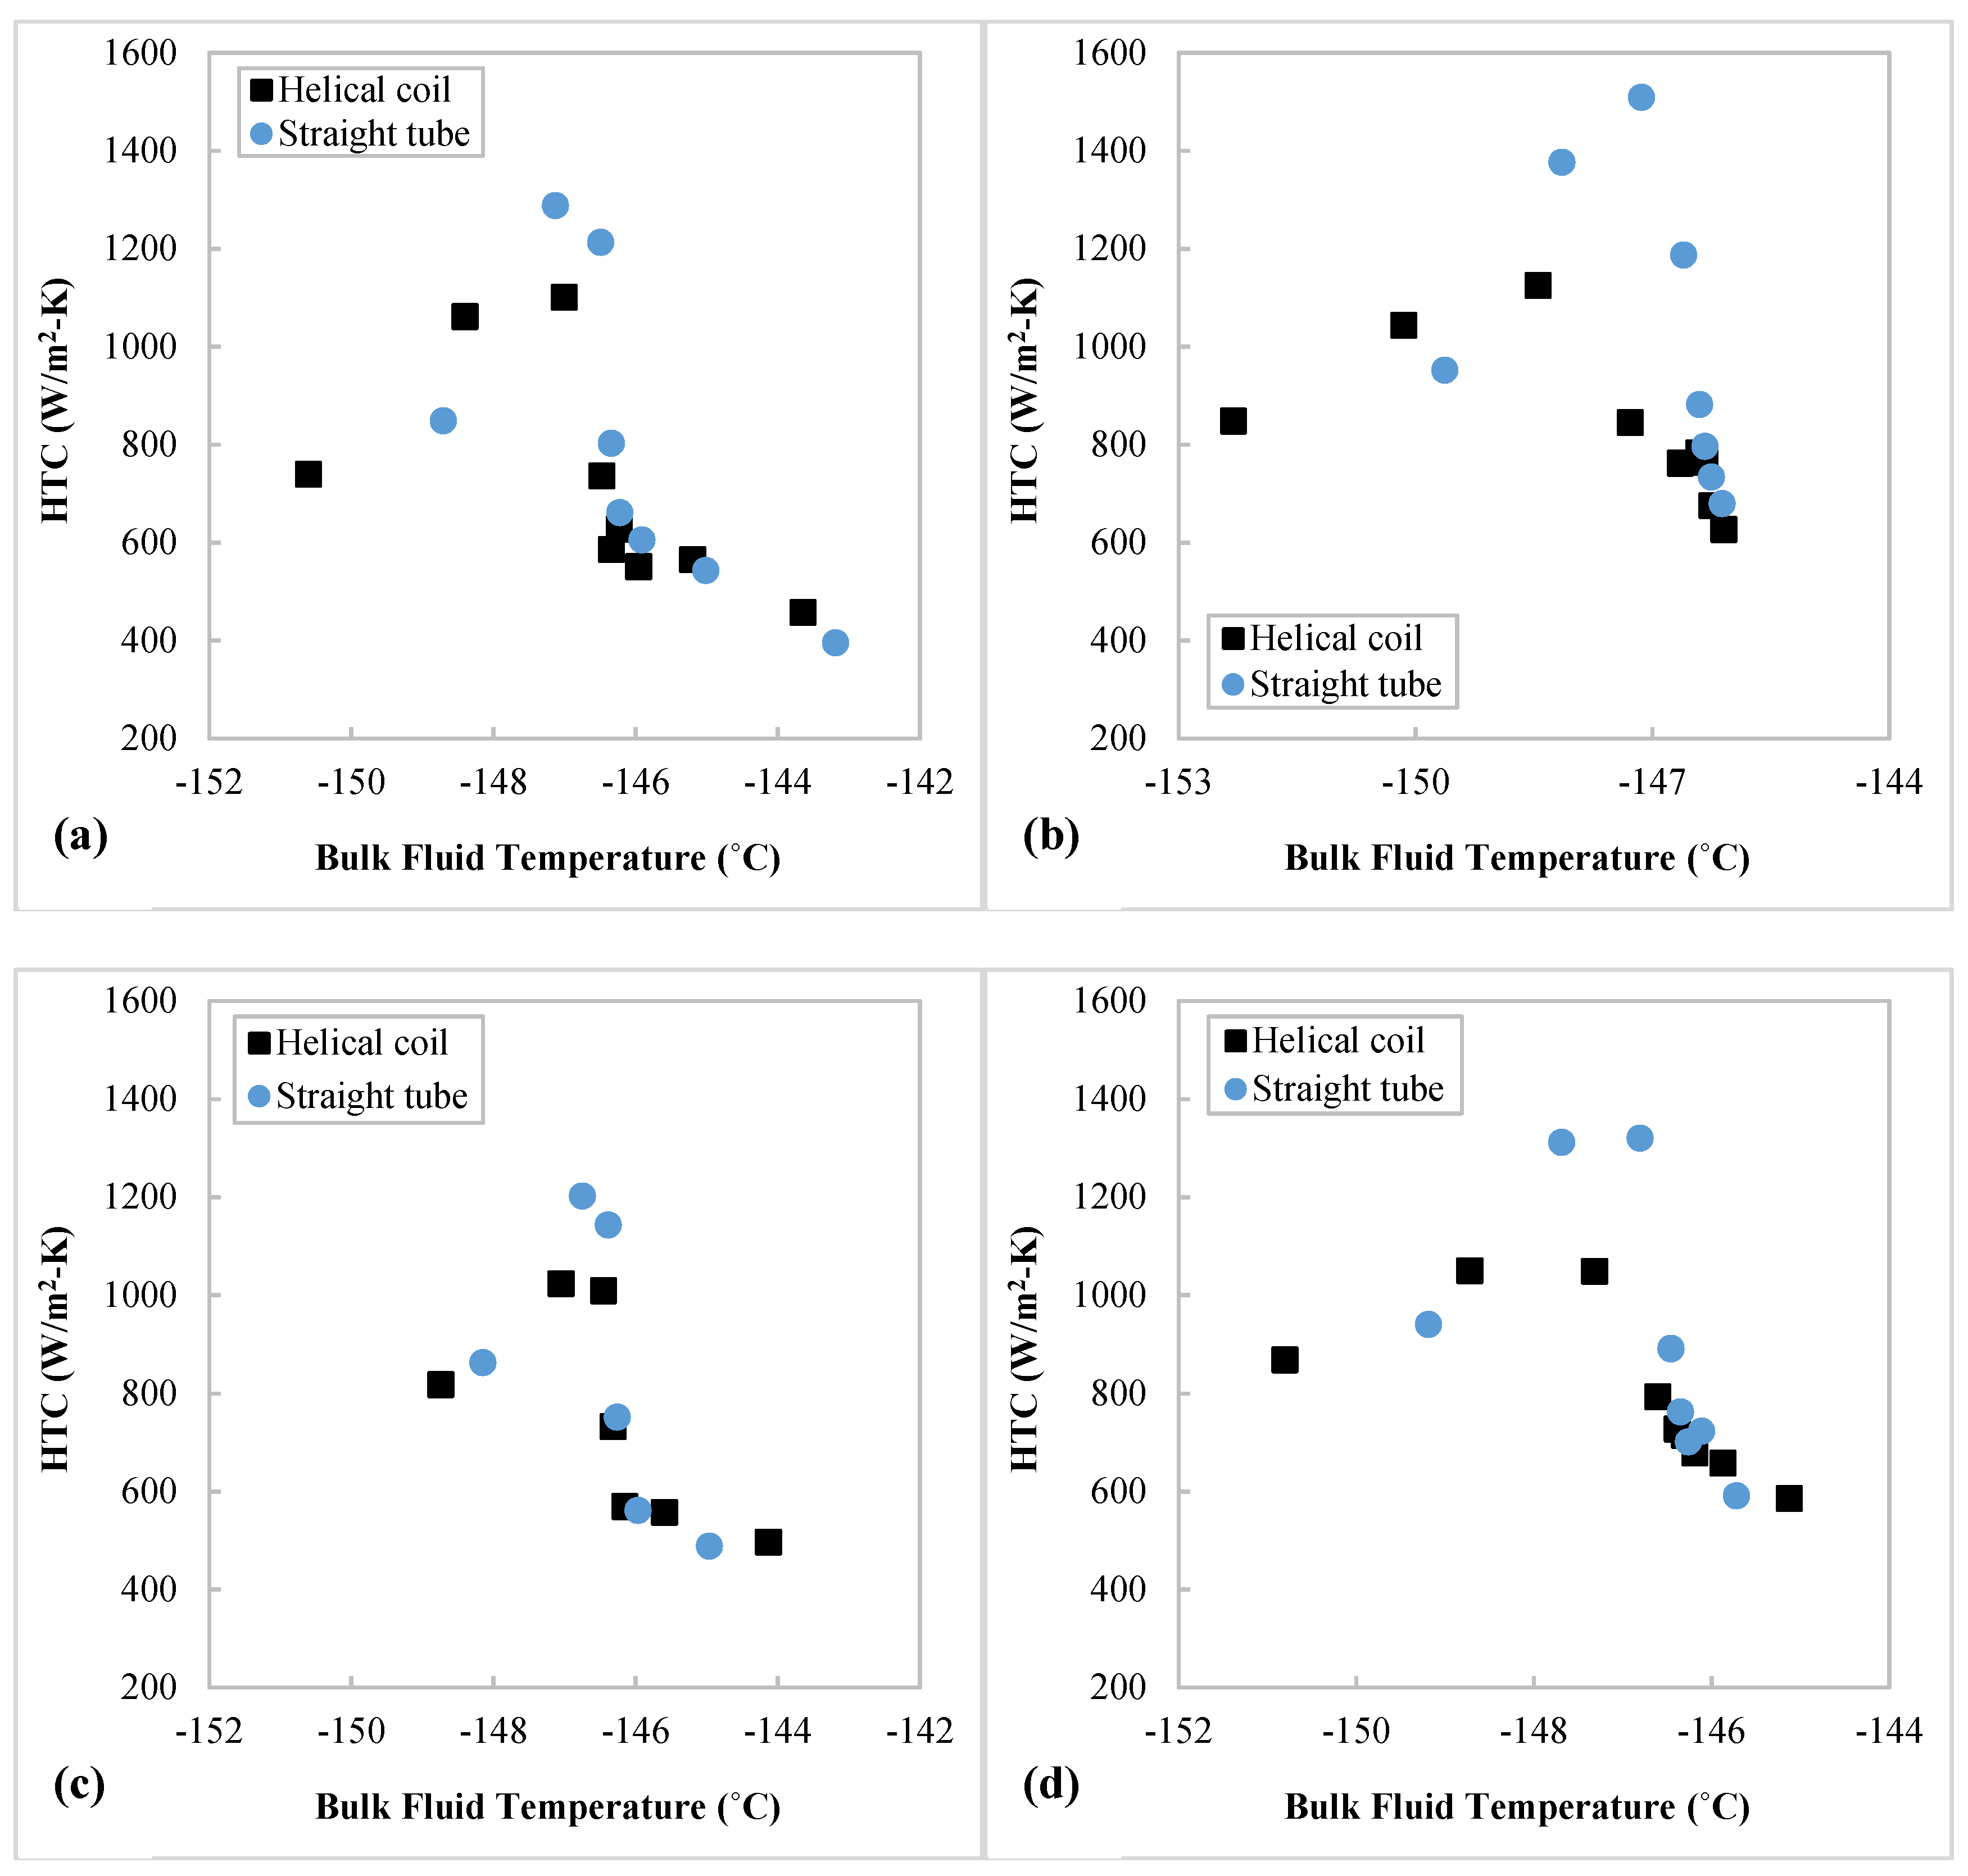
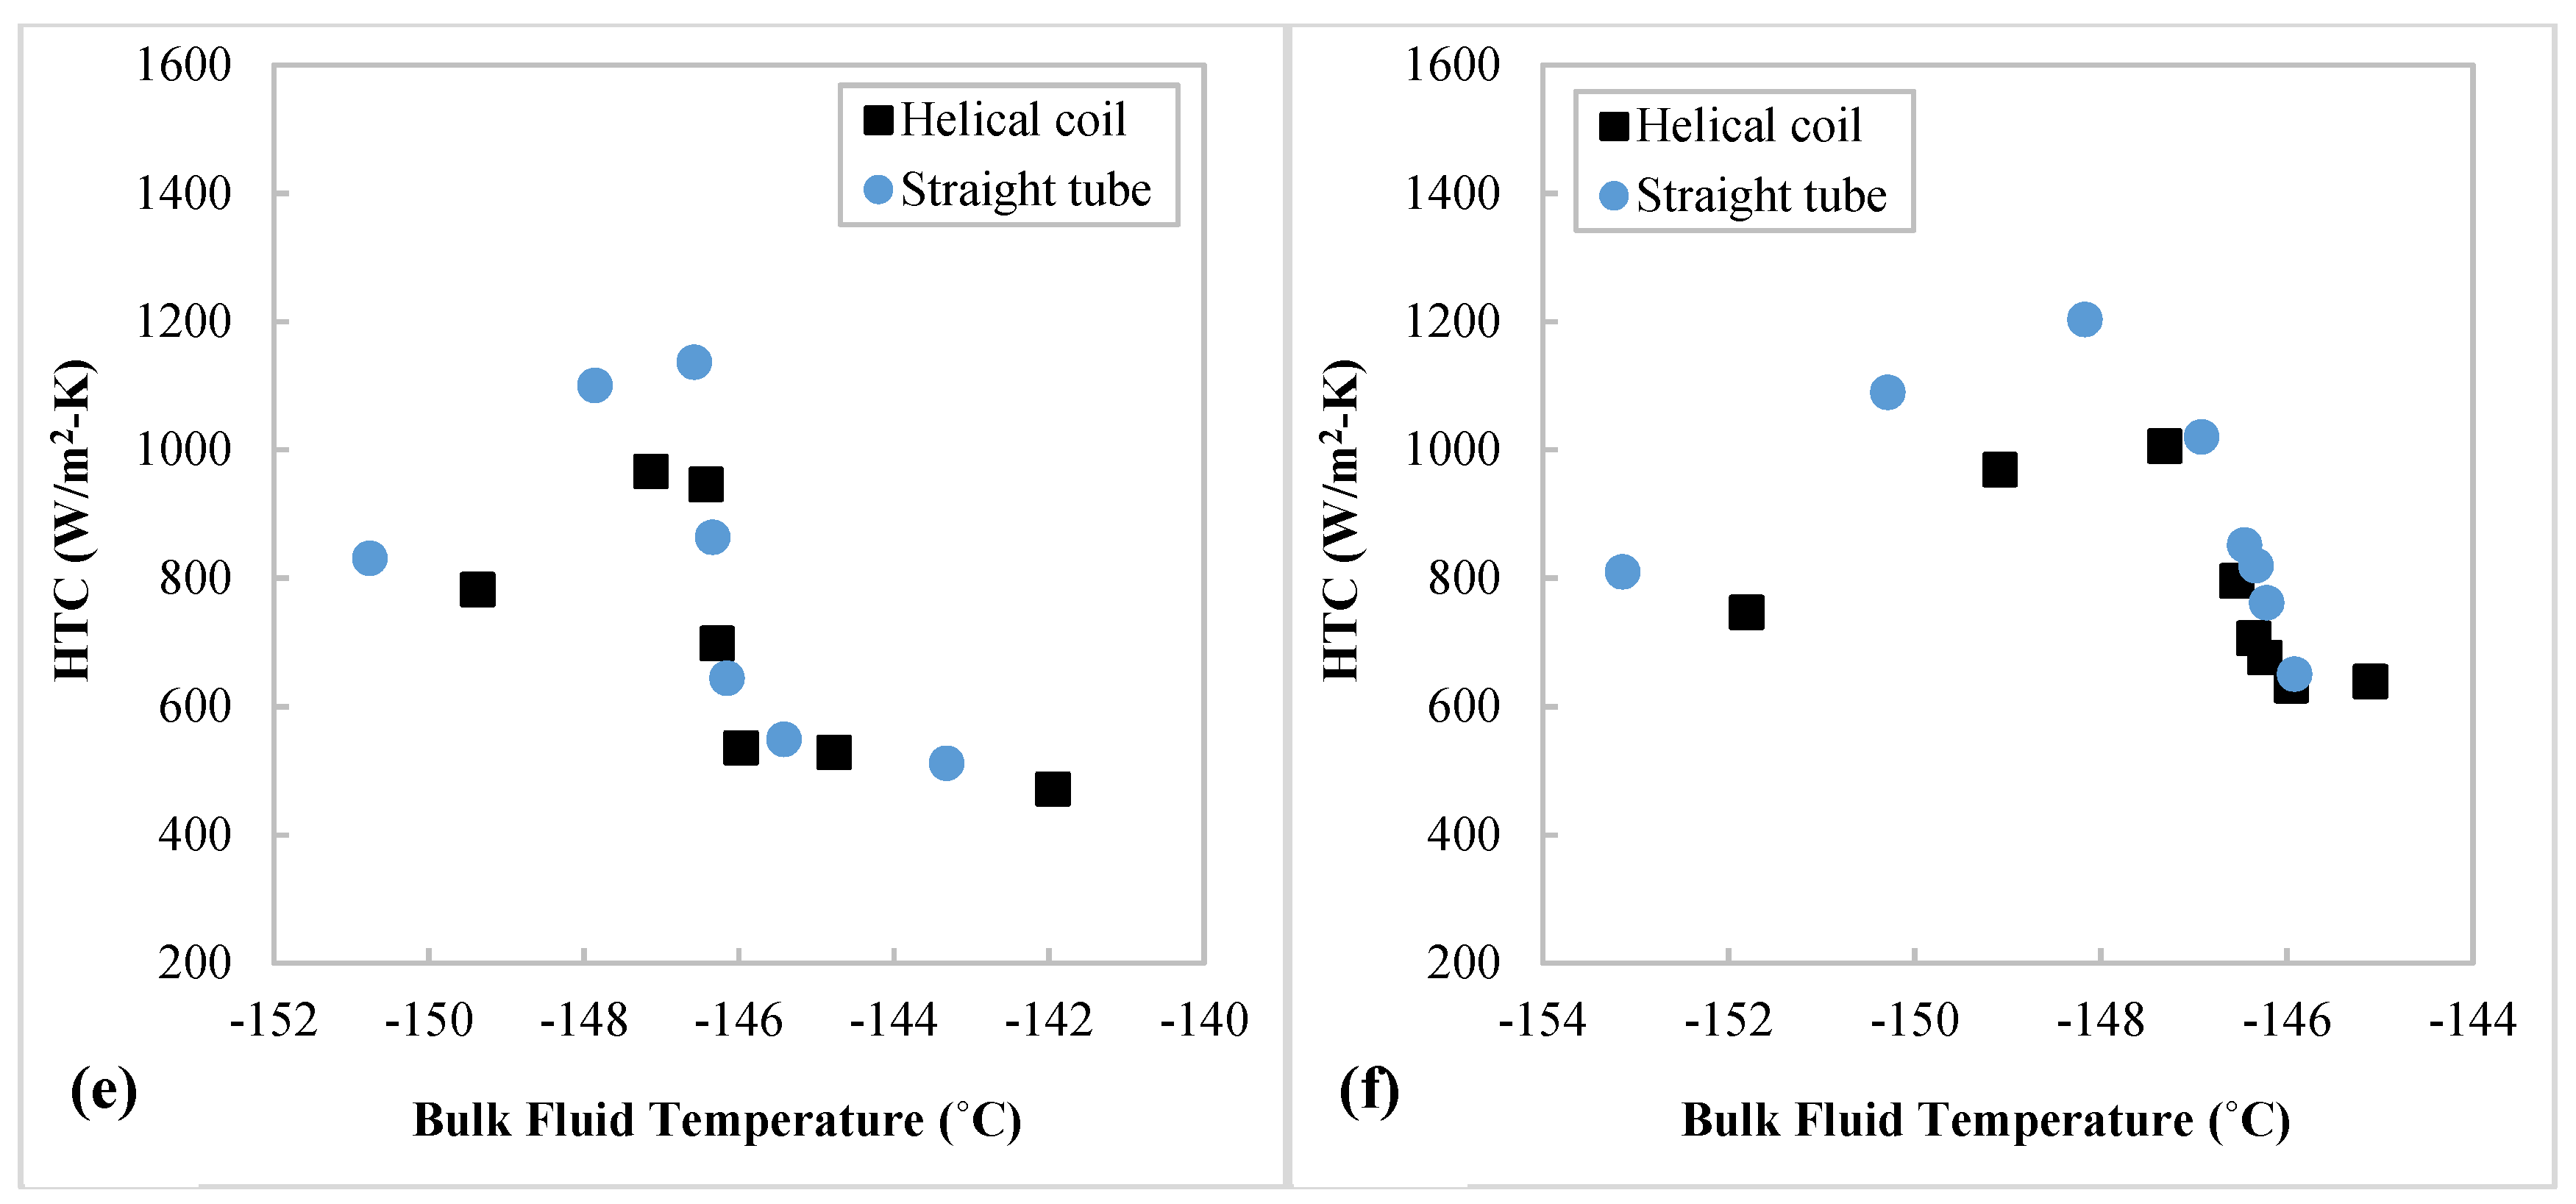
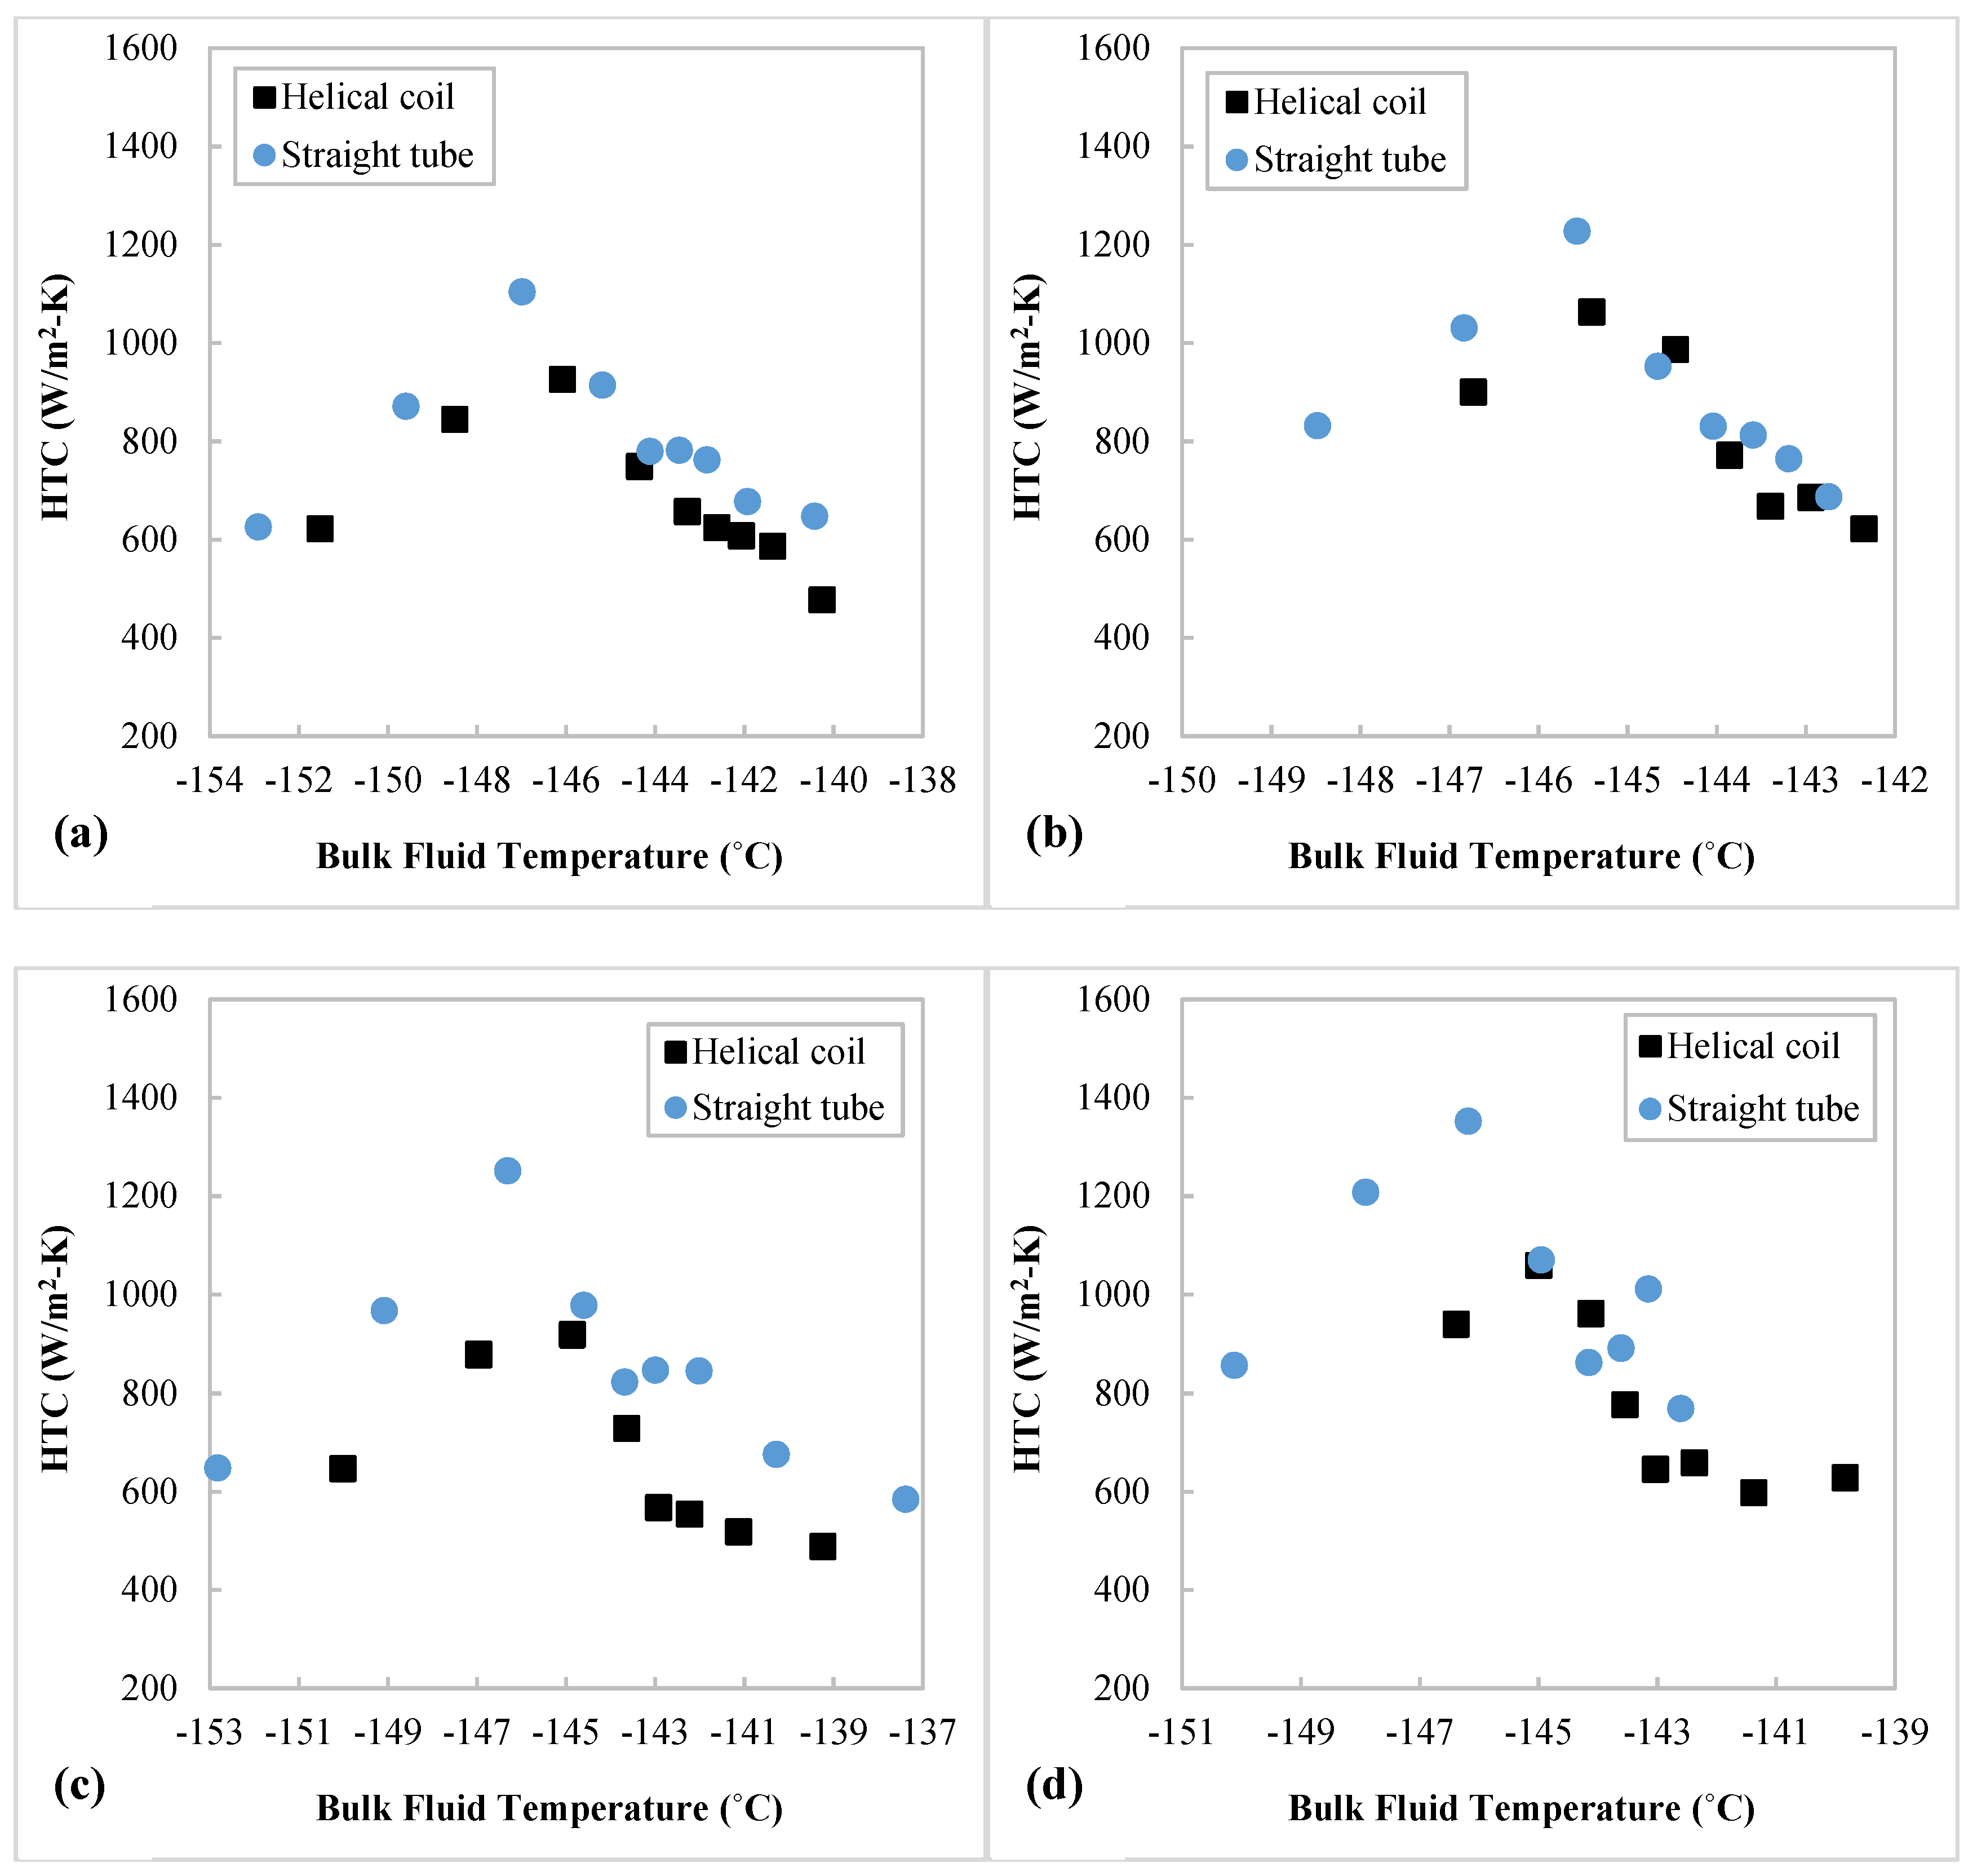
  • When compared with the HTCs of supercritical N2 in a straight tube under similar experimental conditions, the HTCs in the helical coil are ~13% lower at fluid temperatures below the pseudocritical temperature but close to the straight tube values (<±6%) at higher fluid temperatures, as the effects of curvature and improved turbulent mixing are moderated by the effect of buoyance at fluid temperatures below the pseudocritical temperature.
In the future, heat transfer experiments in different helical coil structures under more experimental conditions, including those with passive heat transfer enhancement techniques [3,26,31], are needed not only to confirm the heat transfer results of supercritical N2 in a helically coiled tube but also to complement the database for a potential universal heat transfer correlation. It is also desirable to have numerical simulations that can provide visualized in-tube flow patterns to help further explain the mechanisms behind the heat transfer findings.

Author Contributions

Conceptualization, Y.W., X.L., A.S., and Y.L.; methodology, Y.W. and T.L.; validation, Y.W. and T.L.; formal analysis, Y.W. and T.L.; data curation, Y.W. and T.L.; writing—original draft preparation, Y.W.; writing—review and editing, X.L., A.S., and Y.L.; funding acquisition, X.L., A.S., and Y.L. All authors have read and agreed to the published version of the manuscript.

Funding

This project has received funding from the European Union’s Horizon 2020 research and innovation programme under the Marie Sklodowska-Curie grant agreement No. 101007976. The authors also would like to acknowledge the financial support of the Engineering and Physical Sciences Research Council (EPSRC) of the United Kingdom (Grant Nos. EP/T022701/1 and EP/V041665/1).

Institutional Review Board Statement

Not applicable.

Informed Consent Statement

Not applicable.

Data Availability Statement

Data supporting reported results can be provided upon request.

Conflicts of Interest

The authors declare no conflict of interest.

Nomenclature

Latin symbols
Cpspecific heat, J/(kg∙K)Ttemperature, °C
dcoil tube inner diameter, mmUa given function of independent variables Xn
Dcoil curvature diameter, mmxlocal axial location, mm
De*modified Dean number Δxtube wall thickness, mm
fbbuoyancy force, NXnnth independent variable
fccentrifugal force, Nqheat flux, W/m2
ggravitational acceleration, m/s2
Gmass flux, kg/(m2∙s)Greek symbols
GrGrashof numberΨthe ratio of gravitational buoyancy to curvature effect
Grggravitational Grashof numberαthe incline angle of secondary vortices symmetric line, °
hheat transfer coefficient, W/(m2∙K) σuncertainty of a certain variable
Hspecific enthalpy, kJ/kgρdensity, kg/m3
HTCheat transfer coefficient μdynamic viscosity, Pa∙s
Hininlet specific enthalpy, kJ/kgvkinematic viscosity, m2/s
kthermal conductivity, W/(m∙K)
Llength, mSubscripts
N2nitrogenbbulk fluid
Ppressure, Palocallocal value along test tube axis
pcoil pitch, mmouterouter tube wall
Rcoil curvature radius, mmpcpseudocritical point
ReReynolds numberwtube wall

Appendix A

Figure A1. Local inner wall temperatures along the test coil at 9.3 kW/m2: (a) 35 bar, 38.1 kg/m2-s; (b) 35 bar, 50.8 kg/m2-s; (c) 40 bar, 38.1 kg/m2-s; (d) 40 bar, 50.8 kg/m2-s (refer to Figure 4c for illustration of “Top”, “Bottom”, “Inside”, “Outside” positions along the periphery of a helical coil cross section).
Energies 15 02752 g0a1
Table A1. Calculated uncertainties of HTCs measured at coil cross section top in experimental cases at 35 bar.
HTCtop Uncertainty38.1 kg/m2-s,
8.1 kW/m2
38.1 kg/m2-s,
9.3 kW/m2
38.1 kg/m2-s,
11.2 kW/m2
50.8 kg/m2-s,
8.1 kW/m2
50.8 kg/m2-s,
9.3 kW/m2
50.8 kg/m2-s,
11.2 kW/m2
Max.11.28%11.02%10.75%11.40%11.28%10.84%
Min.10.39%10.27%10.24%10.84%10.52%10.37%
Mean10.80%10.62%10.46%11.18%10.89%10.60%
Std.0.26%0.28%0.21%0.18%0.23%0.15%
Table A2. Calculated uncertainties of HTCs measured at coil cross section bottom in experimental cases at 35 bar.
HTCbottom Uncertainty38.1 kg/m2-s,
8.1 kW/m2
38.1 kg/m2-s,
9.3 kW/m2
38.1 kg/m2-s,
11.2 kW/m2
50.8 kg/m2-s,
8.1 kW/m2
50.8 kg/m2-s,
9.3 kW/m2
50.8 kg/m2-s,
11.2 kW/m2
Max.13.30%12.24%11.58%13.02%12.40%11.57%
Min.10.48%10.33%10.28%10.90%10.65%10.43%
Mean11.46%11.04%10.74%11.74%11.35%10.87%
Std.1.03%0.74%0.52%0.70%0.65%0.40%
Table A3. Calculated uncertainties of HTCs measured at coil cross section bottom in experimental cases at 35 bar.
HTCinside Uncertainty38.1 kg/m2-s,
8.1 kW/m2
38.1 kg/m2-s,
9.3 kW/m2
38.1 kg/m2-s,
11.2 kW/m2
50.8 kg/m2-s,
8.1 kW/m2
50.8 kg/m2-s,
9.3 kW/m2
50.8 kg/m2-s,
11.2 kW/m2
Max.12.01%11.53%11.12%12.07%11.77%11.16%
Min.10.41%10.29%10.24%10.90%10.55%10.36%
Mean11.09%10.79%10.57%11.45%11.09%10.74%
Std.0.54%0.46%0.33%0.32%0.39%0.27%
Table A4. Calculated uncertainties of HTCs measured at coil cross section outside in experimental cases at 35 bar.
HTCoutside Uncertainty38.1 kg/m2-s,
8.1 kW/m2
38.1 kg/m2-s,
9.3 kW/m2
38.1 kg/m2-s,
11.2 kW/m2
50.8 kg/m2-s,
8.1 kW/m2
50.8 kg/m2-s,
9.3 kW/m2
50.8 kg/m2-s,
11.2 kW/m2
Max.12.06%11.65%11.08%12.28%11.83%11.32%
Min.10.59%10.33%10.29%10.98%10.70%10.45%
Mean11.28%10.90%10.65%11.59%11.17%10.80%
Std.0.50%0.46%0.31%0.36%0.33%0.25%
Table A5. Calculated uncertainties of HTCs measured at coil cross section top in experimental cases at 40 bar.
HTCtop Uncertainty38.1 kg/m2-s,
8.1 kW/m2
38.1 kg/m2-s,
9.3 kW/m2
38.1 kg/m2-s,
11.2 kW/m2
50.8 kg/m2-s,
8.1 kW/m2
50.8 kg/m2-s,
9.3 kW/m2
50.8 kg/m2-s,
11.2 kW/m2
Max.11.12%11.00%10.73%11.12%11.44%11.13%
Min.10.45%10.31%10.22%10.45%10.52%10.39%
Mean10.83%10.64%10.40%10.83%10.92%10.70%
Std.0.23%0.26%0.18%0.23%0.31%0.24%
Table A6. Calculated uncertainties of HTCs measured at coil cross section bottom in experimental cases at 40 bar.
HTCbottom Uncertainty38.1 kg/m2-s,
8.1 kW/m2
38.1 kg/m2-s,
9.3 kW/m2
38.1 kg/m2-s,
11.2 kW/m2
50.8 kg/m2-s,
8.1 kW/m2
50.8 kg/m2-s,
9.3 kW/m2
50.8 kg/m2-s,
11.2 kW/m2
Max.12.18%11.96%11.06%12.18%12.55%11.79%
Min.10.56%10.34%10.26%10.56%10.63%10.47%
Mean11.24%10.94%10.55%11.24%11.35%10.98%
Std.0.52%0.58%0.31%0.52%0.70%0.50%
Table A7. Calculated uncertainties of HTCs measured at coil cross section inside in experimental cases at 40 bar.
HTCinside Uncertainty38.1 kg/m2-s,
8.1 kW/m2
38.1 kg/m2-s,
9.3 kW/m2
38.1 kg/m2-s,
11.2 kW/m2
50.8 kg/m2-s,
8.1 kW/m2
50.8 kg/m2-s,
9.3 kW/m2
50.8 kg/m2-s,
11.2 kW/m2
Max.11.53%11.43%10.84%11.53%11.85%11.33%
Min.10.49%10.31%10.23%10.49%10.52%10.40%
Mean11.07%10.80%10.46%11.07%11.03%10.80%
Std.0.36%0.40%0.24%0.36%0.47%0.32%
Table A8. Calculated uncertainties of HTCs measured at coil cross section outside in experimental cases at 40 bar.
HTCoutside Uncertainty38.1 kg/m2-s,
8.1 kW/m2
38.1 kg/m2-s,
9.3 kW/m2
38.1 kg/m2-s,
11.2 kW/m2
50.8 kg/m2-s,
8.1 kW/m2
50.8 kg/m2-s,
9.3 kW/m2
50.8 kg/m2-s,
11.2 kW/m2
Max.11.81%11.57%10.78%11.81%11.90%11.39%
Min.10.52%10.33%10.26%10.52%10.60%10.46%
Mean11.10%10.83%10.48%11.10%11.19%10.86%
Std.0.40%0.42%0.19%0.40%0.45%0.30%

References

  1. Fsadni, A.M.; Whitty, J.P. A review on the two-phase heat transfer characteristics in helically coiled tube heat exchangers. Int. J. Heat Mass Transf. 2016, 95, 551–565. [Google Scholar] [CrossRef]
  2. Brown, C.S.; Cassidy, N.J.; Egan, S.S.; Griffiths, D. Thermal and Economic Analysis of Heat Exchangers as Part of a Geothermal District Heating Scheme in the Cheshire Basin, UK. Energies 2022, 15, 1983. [Google Scholar] [CrossRef]
  3. Assad, M.E.H.; Nazari, M.A. Chapter 3—Heat Exchangers and Nanofluids. In Design and Performance Optimization of Renewable Energy Systems; Academic Press: London, UK, 2021; pp. 33–42. [Google Scholar] [CrossRef]
  4. Wu, Y.; Liu, B.; Zhang, H.; Zhu, K.; Kong, B.; Guo, J.; Li, F. Accuracy and efficient solution of helical coiled once-through steam generator model using JFNK method. Ann. Nucl. Eng. 2021, 159, 108290. [Google Scholar] [CrossRef]
  5. Kumar, E.P.; Solanki, A.K.; Kumar, M.M.J. Numerical investigation of heat transfer and pressure drop characteristics in the micro-fin helically coiled tubes. Appl. Therm. Eng. 2021, 182, 116093. [Google Scholar] [CrossRef]
  6. Pakdaman, M.F.; Akhavan-Behabadi, M.; Razi, P. An experimental investigation on thermo-physical properties and overall performance of MWCNT/heat transfer oil nanofluid flow inside vertical helically coiled tubes. Exp. Therm. Fluid Sci. 2012, 40, 103–111. [Google Scholar] [CrossRef]
  7. Sreejith, K.; Sreesastha Ram, T.R.; Varghese Jaivin, A.; Francis Manoj Mossas, V.J.; Nidhin, M.J.; Nithil, E.S.; Sushmitha, S. Experimental investigation of a helical coil heat exchanger. Int. J. Eng. Sci. 2015, 5, 1–5. [Google Scholar]
  8. Kong, M.; Alvarado, J.L.; Terrell, W.; Thies, C. Performance characteristics of microencapsulated phase change material slurry in a helically coiled tube. Int. J. Heat Mass Transf. 2016, 101, 901–914. [Google Scholar] [CrossRef]
  9. Jayakumar, J.; Mahajani, S.; Mandal, J.; Iyer, K.N.; Vijayan, P. CFD analysis of single-phase flows inside helically coiled tubes. Comput. Chem. Eng. 2010, 34, 430–446. [Google Scholar] [CrossRef]
  10. Haghighi, A.; Maleki, A.; Assad, M.E.H.; Chen, L.; Nazari, M.A.; Shadloo, M.S. A review on heat transfer characteristics of cryogenic heat pipes. J. Therm. Anal. Calorim. 2021. [Google Scholar] [CrossRef]
  11. Stougie, L.; Van Der Kooi, H.J. Exergy Efficient Application of LNG Cold. In Proceedings of the ECOS2010 23rd International Conference on Efficiency, Cost, Optimization, Simulation, and Environmental Impact of Energy Systems, Lausanne, Switzerland, 14–17 June 2010; Favrat, D., Maréchal, F., Eds.; 2010; Volume 2, pp. 441–446. [Google Scholar]
  12. Arif, H.; Aydelott, J.C.; Chato, D. Evaluation of Supercritical Cryogen Storage and Transfer Systems for Future NASA Missions. J. Propuls. Power 1992, 8, 332–338. [Google Scholar] [CrossRef]
  13. Dondapati, R.S. Role of Supercritical Nitrogen (SCN) on the hydraulic and thermal characteristics of futuristic High Temperature Superconducting (HTS) cables. Cryogenics 2020, 111, 103166. [Google Scholar] [CrossRef]
  14. Zhang, P.; Huang, Y.; Shen, B.; Wang, R.Z. Flow and heat transfer characteristics of supercritical nitrogen in a vertical mini-tube. Int. J. Therm. Sci. 2011, 50, 287–295. [Google Scholar] [CrossRef]
  15. Dimitrov, D.; Zahariev, A.; Kovachev, V.; Wawryk, R. Forced convective heat transfer to supercritical nitrogen in a vertical tube. Int. J. Heat Fluid Flow 1989, 10, 278–280. [Google Scholar] [CrossRef]
  16. Negoescu, C.C.; Li, Y.; Al-Duri, B.; Ding, Y. Heat Transfer Behaviour of Supercritical Nitrogen in the Large Specific Heat Region Flowing in a Vertical Tube. Energy 2017, 134, 1096–1106. [Google Scholar] [CrossRef] [Green Version]
  17. Wang, Y.; Lu, T.; Drögemüller, P.; Yu, Q.; Ding, Y.; Li, Y. Enhancing deteriorated heat transfer of supercritical nitrogen in a vertical tube with wire matrix insert. Int. J. Heat Mass Transf. 2020, 162, 120358. [Google Scholar] [CrossRef]
  18. Yamagata, K.; Nishikawa, K.; Hasegawa, S.; Fujii, T.; Yoshida, S. Forced convective heat transfer to supercritical water flowing in tubes. Int. J. Heat Mass Transf. 1972, 15, 2575–2593. [Google Scholar] [CrossRef]
  19. Mokry, S.J.; Kirillov, P.L.; Pioro, I.L.; Gospodinov, Y.K. Supercritical-water Heat Transfer in a Vertical Bare Tube. Nucl. Eng. Des. 2010, 240, 568–576. [Google Scholar] [CrossRef]
  20. Bae, Y.Y.; Kim, H.Y.; Kang, D.J. Forced and mixed convection heat transfer to supercritical CO2 vertically flowing in a uniformly-heated circular tube. Exp. Therm. Fluid Sci. 2010, 34, 1295–1308. [Google Scholar] [CrossRef]
  21. Li, Z.H.; Jiang, P.X.; Zhao, C.R.; Zhang, Y. Experimental investigation of convection heat transfer of CO2 at supercritical pressures in a vertical circular tube. Exp. Therm. Fluid Sci. 2010, 34, 1162–1171. [Google Scholar] [CrossRef]
  22. Lemmon, E.W.; Huber, M.L.; McLinden, M.O. NIST Standard Reference Database 23: Reference Fluid Thermodynamic and Transport Properties-REFPROP, Version 9.1, Created 7 May 2013, updated 19 February 2017. Available online: https://www.nist.gov/publications/nist-standard-reference-database-23-reference-fluid-thermodynamic-and-transport-0?pub_id=50520 (accessed on 16 May 2021).
  23. Zhang, S.; Xu, X.; Liu, C.; Liu, X.; Zhang, Y.; Dang, C. The heat transfer of supercritical CO2 in helically coiled tube: Trade-off between curvature and buoyancy effect. Energy 2019, 176, 765–777. [Google Scholar] [CrossRef]
  24. Zhao, H.; Li, X.; Wu, X. Numerical investigation of supercritical water turbulent flow and heat transfer characteristics in vertical helical tubes. J. Supercrit. Fluids 2017, 127, 48–61. [Google Scholar] [CrossRef]
  25. Xu, J.; Yang, C.; Zhang, W.; Sun, D. Turbulent convective heat transfer of CO2 in a helical tube at near-critical pressure. Int. J. Heat Mass Transf. 2015, 80, 748–758. [Google Scholar] [CrossRef]
  26. Wang, Y.; Alvarado, J.L.; Terrell, W., Jr. Thermal performance of helical coils with reversed loops and wire coil inserts. Int. J. Heat Mass Transf. 2020, 146, 118723. [Google Scholar] [CrossRef]
  27. Yu, Q.; Peng, Y.; Negoescu, C.C.; Wang, Y.; Li, Y. Study on Convective Heat Transfer of Supercritical Nitrogen in a Vertical Tube for Liquid Air Energy Storage. Energies 2021, 14, 7773. [Google Scholar] [CrossRef]
  28. Xu, X.; Liu, C.; Dang, C.; Wu, Y.; Liu, X. Experimental investigation on heat transfer characteristics of supercritical CO2 cooled in horizontal helically coiled tube. Int. J. Refrig. 2016, 67, 190–201. [Google Scholar] [CrossRef]
  29. Mao, Y.; Guo, L.; Bai, B.; Zhang, X. Convective heat transfer in helical coils for constant-property and variable-property flows with high Reynolds numbers. Front. Energy Power Eng. China 2010, 4, 546–552. [Google Scholar] [CrossRef]
  30. Li, Z.; Zhai, Y.; Li, K.; Wang, H.; Lu, J. A quantitative study on the interaction between curvature and buoyancy effects in helically coiled heat exchangers of supercritical CO2 Rankine cycles. Energy 2016, 116, 661–676. [Google Scholar] [CrossRef]
  31. Batista, J.; Trp, A.; Lenic, K. Heat Transfer Enhancement of Crossflow Air-to-Water Fin-and-Tube Heat Exchanger by Using Delta-Winglet Type Vortex Generators. Energies 2022, 15, 2070. [Google Scholar] [CrossRef]
Figure 1. N2 thermophysical properties in the vicinity of pseudocritical points at 35 and 40 bar pressures, respectively: (a) enthalpy and specific heat; (b) thermal conductivity; (c) density; (d) viscosity (red dotted lines indicate the pseudocritical temperatures at corresponding supercritical pressures) [22] (pseudocritical temperature is approximately −146.3 °C and −143.4 °C at 35 bar and 40 bar, respectively).
Energies 15 02752 g001
Figure 2. In-tube secondary flow pattern under effects of (a) centrifugal force, (b) buoyancy, and (c) dual effect [23].
Energies 15 02752 g002
Figure 3. Experiment set-up of near pseudocritical nitrogen heat transfer in helically coiled tube.
Energies 15 02752 g003
Figure 4. (a) Helical coil heat transfer test section within a vacuum Perspex chamber. (b) Schematic diagram displaying the helical coil structure and part of its length. (c) Test tube cross section A-A’ (main flow direction into paper, thermocouples were installed at top, bottom, outside, and inside locations along the coil cross section perimeter).
Energies 15 02752 g004aEnergies 15 02752 g004b
Figure 5. Effects of heat flux and flow rate on average heat transfer coefficients over the entire coil test section at (a) 35 bar 38.1 kg/m2-s, (b) 35 bar 50.8 kg/m2-s, (c) 40 bar 38.1 kg/m2-s, (d) 40 bar 50.8 kg/m2-s (refer to Figure 4c for illustration of “Top”, “Bottom”, “Inside”, “Outside” positions along the periphery of a helical coil cross section).
Energies 15 02752 g005
Figure 6. Effect of pressure on average heat transfer coefficients over the entire coil test section at (a) 38.1 kg/m2-s, (b) 50.8 kg/m2-s (refer to Figure 4c for illustration of “Top”, “Bottom”, “Inside”, “Outside” positions along the periphery of a helical coil cross section).
Energies 15 02752 g006
Figure 7. Local heat transfer coefficients along the test coil at 35 Bar: (a) 38.1 kg/m2-s, 8.1 kW/m2; (b) 50.8 kg/m2-s, 8.1 kW/m2; (c) 38.1 kg/m2-s, 9.3 kW/m2; (d) 50.8 kg/m2-s, 9.3 kW/m2; (e) 38.1 kg/m2-s, 11.2 kW/m2; (f) 50.8 kg/m2-s, 11.2 kW/m2 (refer to Figure 4c for illustration of “Top”, “Bottom”, “Inside”, “Outside” positions along the periphery of a helical coil cross section).
Energies 15 02752 g007
Figure 8. Local heat transfer coefficients along the test coil at 40 Bar: (a) 38.1 kg/m2-s, 8.1 kW/m2; (b) 50.8 kg/m2-s, 8.1 kW/m2; (c) 38.1 kg/m2-s, 9.3 kW/m2; (d) 50.8 kg/m2-s, 9.3 kW/m2; (e) 38.1 kg/m2-s, 11.2 kW/m2; (f) 50.8 kg/m2-s, 11.2 kW/m2 (refer to Figure 4c for illustration of “Top”, “Bottom”, “Inside”, “Outside” positions along the periphery of a helical coil cross section).
Energies 15 02752 g008
Figure 9. Dimensionless number Ψ indicating the ratio between buoyancy and coil curvature effects at (a) 35 bar 38.1 kg/m2-s, (b) 35 bar 50.8 kg/m2-s, (c) 40 bar 38.1 kg/m2-s, (d) 40 bar 50.8 kg/m2-s.
Energies 15 02752 g009aEnergies 15 02752 g009b
Figure 10. Comparisons of overall heat transfer coefficients between coiled tube and straight tube at 35 bar (a) 38.1 kg/m2-s, 8.1 kW/m2; (b) 50.8 kg/m2-s, 8.1 kW/m2; (c) 38.1 kg/m2-s, 9.3 kW/m2; (d) 50.8 kg/m2-s, 9.3 kW/m2; (e) 38.1 kg/m2-s, 11.2 kW/m2; (f) 50.8 kg/m2-s, 11.2 kW/m2.
Energies 15 02752 g010aEnergies 15 02752 g010b
Figure 11. Comparisons of overall heat transfer coefficients between coiled tube and straight tube at 40 bar (a) 38.1 kg/m2-s, 8.1 kW/m2; (b) 50.8 kg/m2-s, 8.1 kW/m2; (c) 38.1 kg/m2-s, 9.3 kW/m2; (d) 50.8 kg/m2-s, 9.3 kW/m2; (e) 38.1 kg/m2-s, 11.2 kW/m2; (f) 50.8 kg/m2-s, 11.2 kW/m2.
Energies 15 02752 g011aEnergies 15 02752 g011b
Table 1. Measured variables, instruments, and the associated uncertainties.
Measured ParametersUncertaintiesInstrumentsSpecifications (Accuracies)
Pressure±0.05 BarAlicat scientific pressure measuring and controller, PCH-100 PSIA±0.125% of read value
Power±1 WElektro-Automatik Analogue, digital bench power supply, EA-PS 9080-120-2U<0.1% of read value
<0.002 Volt
<0.08 Ampere
T±0.5 °CThermon Ltd., type-T thermocouple±0.5 °C
Flow rate±0.3 L/minOmega, FMA-A2323 digital flowmeter±1% of full scale
±0.3 SLM
L±1 mmSS316 stainless steel tube±1 mm of length
d±0.1 mmSS316 stainless steel tube±0.1 mm of diameter
Publisher’s Note: MDPI stays neutral with regard to jurisdictional claims in published maps and institutional affiliations.

