Abstract
Spiral wound tube heat exchanger (SWHE) was confirmed as the core equipment of natural gas liquefaction (LNG). However, there was rare experimental research on large-scale SWHE for LNG, and the theory of heat transfer is not perfect. To investigate the tube-side flow and heat transfer characteristics in spiral tubes, an experimental system was proposed. To ensure the accuracy of the experimental data, the heat transfer coefficients of liquid propane under different conditions were measured, and the data acquired through the experiment were compared with two classical heat transfer correlation (Dittus–Boelter and Geielinski) under the identical working conditions. The applicability of the existing correlation was analyzed using the experimental data, and a novel heat transfer correlation was developed. As indicated by the results, the deviation between the experimental system and the classical correlation under the identical working condition was lower than ±10%. Furthermore, the error comparison between the novel correlation prediction value and the experimental data was less than ±15%.
1. Introduction
As economy leapt forward, the contradiction between energy and environment became more acute. The rising living standards of residents intensified the energy consumption, especially in the construction sector. As indicated by statistics, building energy consumption in developed countries takes up 40% of the total social energy consumption, and the proportion continues to rise with the further development of urbanization [1,2]. Exploiting clean energy natural gas and vigorously developing urban gas can balance resources and environmental issues [3,4].
Natural gas (NG) refers to a type of clean energy with high calorific value, and its development aroused wide attention [5]. However, the storage and transportation of NG was always a difficult problem that restricted the popularization and utilization of industry. Natural gas exhibits some disadvantages (e.g., low density and critical temperature much lower than normal temperature). To facilitate storage and transportation, it should be cryogenic liquefied [6]. Liquefied natural gas (LNG) has the advantages of safety, cleanliness and long-distance transportation, and so, it is an ideal energy source for direct application [3]. The spiral tube of heat exchanger is the core equipment of natural gas liquefaction [7], which has the characteristics of compact structure, high heat transfer coefficient and small heat transfer temperature difference [8,9,10]. It was primarily employed in large-scale land natural gas liquefaction plant and liquefied natural gas-floating production storage and offloading. The utilization rate of spiral wound tube heat exchanger (SWHE) in large-scale natural gas liquefaction process reached over 90% [11]. Moreover, the cost of the heat exchanger accounts for nearly 10% of the total cost of the liquefaction system [11]. However, the design and manufacturing technology of large-scale SWHE in China remains relatively weak at present. Over 90% of the world’s large-scale LNG SWHE are produced by Air Products and Chemicals Inc. (APCI) of the United States and Linder of Germany. It is imperative to localize LNG SWHE, and the study of its internal flow and heat transfer mechanism is the premise and basis of localization.
The LNG SWHE refers to a special heat transfer enhancement tube with compact structure, high heat transfer efficiency and low fouling thermal resistance. It is widely used in natural gas liquefaction and other low temperature refrigeration fields [12]. The research in the tube side primarily comprised the heat transfer characteristics, pressure drop characteristics and flow pattern conversion characteristics of mixed medium in spiral tubes. Under the effect of the characteristics of high pressure, low temperature, phase transition, multicomponent flow and so forth, the experimental conditions are complicated, and there were rare experimental studies on the tube side of the LNG SWHE. Neeraas [13] performed an experimental study on the tube side; the inner diameter of the spiral tube was 14 mm, the curvature diameter reached 2 m and the inclination angle was 10°. In the study, propane, R22, propane/ethane mixture (molar ratio:1/1) and methane/propane mixture (molar ratio: 92/8–95.5/4.5) served as a working medium. The range of mass flux was 150–600 kg/(m2 s) and the pressure range was 1.2–4 MPa. However, there were still differences from the actual conditions. Shao et al. [14] completed the experimental study of condensation heat transfer of R134a in the horizontal straight tube and the spiral tube, and found that the condensation heat transfer coefficient of R134a in the spiral tube was 4% higher than in a straight tube. Boyko et al. [15,16] determined the condensation heat transfer correlation based on the experimental data by analogy analysis, which is derived from some hypotheses without introducing empirical coefficient, so it has a wide range of applications. Zheng et al. [17] conducted an experimental study on the resistance characteristics of gas-liquid two-phase flow in a spiral tube with air and water as working fluid. The correlation of friction resistance coefficient of gas–liquid two-phase flow in the spiral tube was obtained, and the calculation equation of two-phase friction resistance was developed. Li et al. [18] carried out an experimental study of oil–water gas–liquid two-phase flow pattern in the spiral tube, and gave the flow pattern diagram of gas–liquid two-phase flow.
Tian et al. [4] investigated the heat transfer and pressure drop characteristics of condensing two-phase flow in a spiral tube. As revealed by results, heat transfer coefficient and the friction pressure drop increased first and then tended to be smooth or decreased slightly at high vapor quality. Subsequently, the effect of structural parameters of parameters of the spiral tube were analyzed, and the performance evaluation criterion (PEC) was adopted to examine the effect of structural parameters. The results suggested that if inner diameter increased or helix angle decreased properly, the PEC increased, which can take on critical significance in the design of SWHE [3]. Li [19] numerically investigated the condensation heat transfer and pressure drop characteristics in terms of ethane/propane mixture upward flow in a spiral pipe. Furthermore, modified Silver’s approach was adopted to modify the mixed effects of ethane/propane mixture on heat transfer.
Song [20] et al. analyzed the condensation characteristics of R140/R170 mixture in a horizontal smooth tube. They also developed a novel frictional pressure drop correlation based on experimental data. The mean absolute relative difference was 8.63%, and the prediction effect was more accurate. Moghaddam et al. [21] investigated the condensation two-phase flow heat transfer process of R600a in a twisted enhanced tube, which was a copper tube with inner diameter of 8.1 mm and length of 1000 mm. As indicated by the results, the insertion of bonds cannot be constantly beneficial, unless only the heat transfer efficiency is considered. Given the discontinuous heat transfer coefficient in the three-phase zone of the condensation process in the condensation zone, Zhang et al. [22] explored the condensation two-phase flow process in the condenser using numerical methods. The formation and development of liquid film during condensation were analyzed. There were both single-phase convection and phase transition in the superheated condensation zone. Combined with the morphological development of the liquid film, it was helpful to understand the flow and heat transfer mechanism in the superheated zone. AlHajeri [23] et al. investigated the condensation experiment in the spiral tube with R407c working medium and further studied the correlation between the wall undercooling and the heat transfer coefficient of the refrigerator. In comparison with straight tube, the spiral wound tube exhibited an increased condensation rate with a corresponding pressure drop, which was dependent on the value of saturation temperature of the refrigerant and temperature of the coolant. Zhuang analyzed the condensation flow pattern and heat transfer coefficient in a horizontal tube using methane [24] and a methane/ethane mixture [25]. A novel discriminant of annular flow pattern was proposed, and combined with the phase equilibrium method, a novel correlation of heat transfer coefficient was developed. Solanki [26] used R600A to compare and analyze the condensation heat transfer coefficient in the smooth spiral tube and the sunken spiral tube, and they developed the correlation of heat transfer coefficient for both. For the thermodynamic problems of heat transfer coefficient, there are generally two ways: mathematical theoretical calculation [27] and experimental analysis, and the accuracy of mathematical theoretical calculation is quite different; so, this study chose the experimental method.
The above research achieved several results, whereas the actual operating conditions of LNG SWHE were not indicated, resulting in a significant deviation in the experimental results, such that they cannot directly guide the design and calculation of LNG SWHE. On that basis, an experimental system was built, and its accuracy was verified. The condensation heat transfer coefficient of methane/ethane mixture (mole ratio 0.65/0.35) in the spiral tube was investigated. Based on the experimental data, a novel correlation of heat transfer coefficient was developed and then verified, which lays an experimental foundation for the in-depth study of flow and heat transfer law of LNG SWHE.
2. Principle of Experiment System
The experiment system comprised three parts, i.e., a measuring circulation system, a cooling circulation system, as well as an external cold source system. Figure 1 presents the principle of the experimental system, and Table 1 lists the main equipment of system.
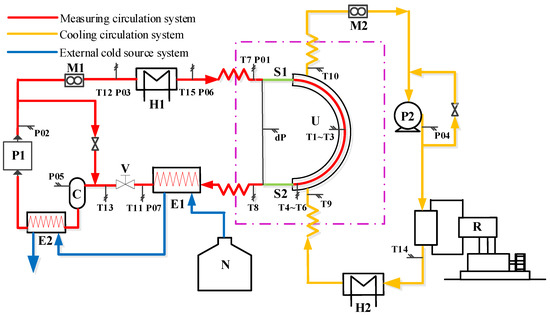
Figure 1.
Schematic diagram of the experimental system.

Table 1.
Main installation.
The working fluid in the measurement circulating system was methane/ethane mixture (molar ratio: C1/C2 = 0.65/0.35), the supercooled working medium (C1/C2) passed through the circulating pump (P1) and then entered the heater (H1). By adjusting the heating power of the H1, the evaporation of the circulating working medium can be controlled and the vapor quality of the inlet of the test sample can be regulated. The circulating medium at the outlet of the H1 was vapor–liquid two-phase, which can lead to inaccurate fluid temperature measurement under the effect of the temperature-difference between vapor phase and liquid phase. During the measurement of the temperature of vapor–liquid two-phase flow, the sample should be stirred to make sure the phase state is uniform. After stirring, the original flow pattern was destroyed, and the flow pattern of working medium was reconstructed based on the tube. After the flow pattern reconstruction, it entered the observation window (S1) and then the test sample. The working fluid was partially condensed in the test sample. After the test sample, the circulating fluid entered the observation window (S2). After passing through S2, the circulating fluid entered the liquid nitrogen heat exchanger (E1 and E2), and the two-phase flow cooled to a supercooled liquid and then to the P1 to complete the cycle.
Since the current research on single-phase flow was relatively mature, the main research object of this experiment was the gas–liquid two-phase zone. In the measuring circulation system, the regulation of flow rate was mainly realized by frequency conversion and bypass of circulation pump P1, the regulation of pressure was mainly realized by adjusting control valve (V) and the regulation of vapor quality was mainly achieved by regulating heating power of heater (H1). The system was adjusted to meet the requirements of working conditions.
Cooling circulation system: The working fluid in the cooling circulation system was isobutane, which remained in liquid phase throughout the system. First, the supercooled isobutane entered the test sample to cool refrigerant in the measurement circulating system. Before entering the test sample, the temperature of isobutane was regulated by the heater (H2) to ensure that the isobutane temperature conformed to the requirements. In the cooling circulation system, the refrigerator (R) provided cooling capacity for the system. The lowest temperature provided by the R was −140 °C, and the temperature control precision was 0.1 °C. The outside temperature of the test sample tube was controlled by the cooling circulation system to ensure that the flow pattern illustrated in the glass windows (S1/S2) was the same.
Liquid nitrogen served as the working medium in the external cold source system. After the flow of the test sample, the C1/C2 mixture refrigeration in the measuring system was a vapor–liquid two-phase. To ensure that the C1/C2 at the inlet of the P1 was liquid phase, a large amount of low-temperature cooling must be provided. Liquid nitrogen was stored in a liquid nitrogen tank (N), and the flow of liquid nitrogen into the heat exchanger E1 and E2 was controlled by the regulation of the flow control valve to provide cooling capacity for the C1/C2 working medium and supercool it.
2.1. Experimental System Device
To ensure the accuracy of the test data of the flow and heat transfer on the tube side of the LNG SWHE and improve the credibility of the experiment, the experimental bench put forward special requirements in terms of measuring point arrangement and parameter collection.
2.1.1. Temperature Measuring Point
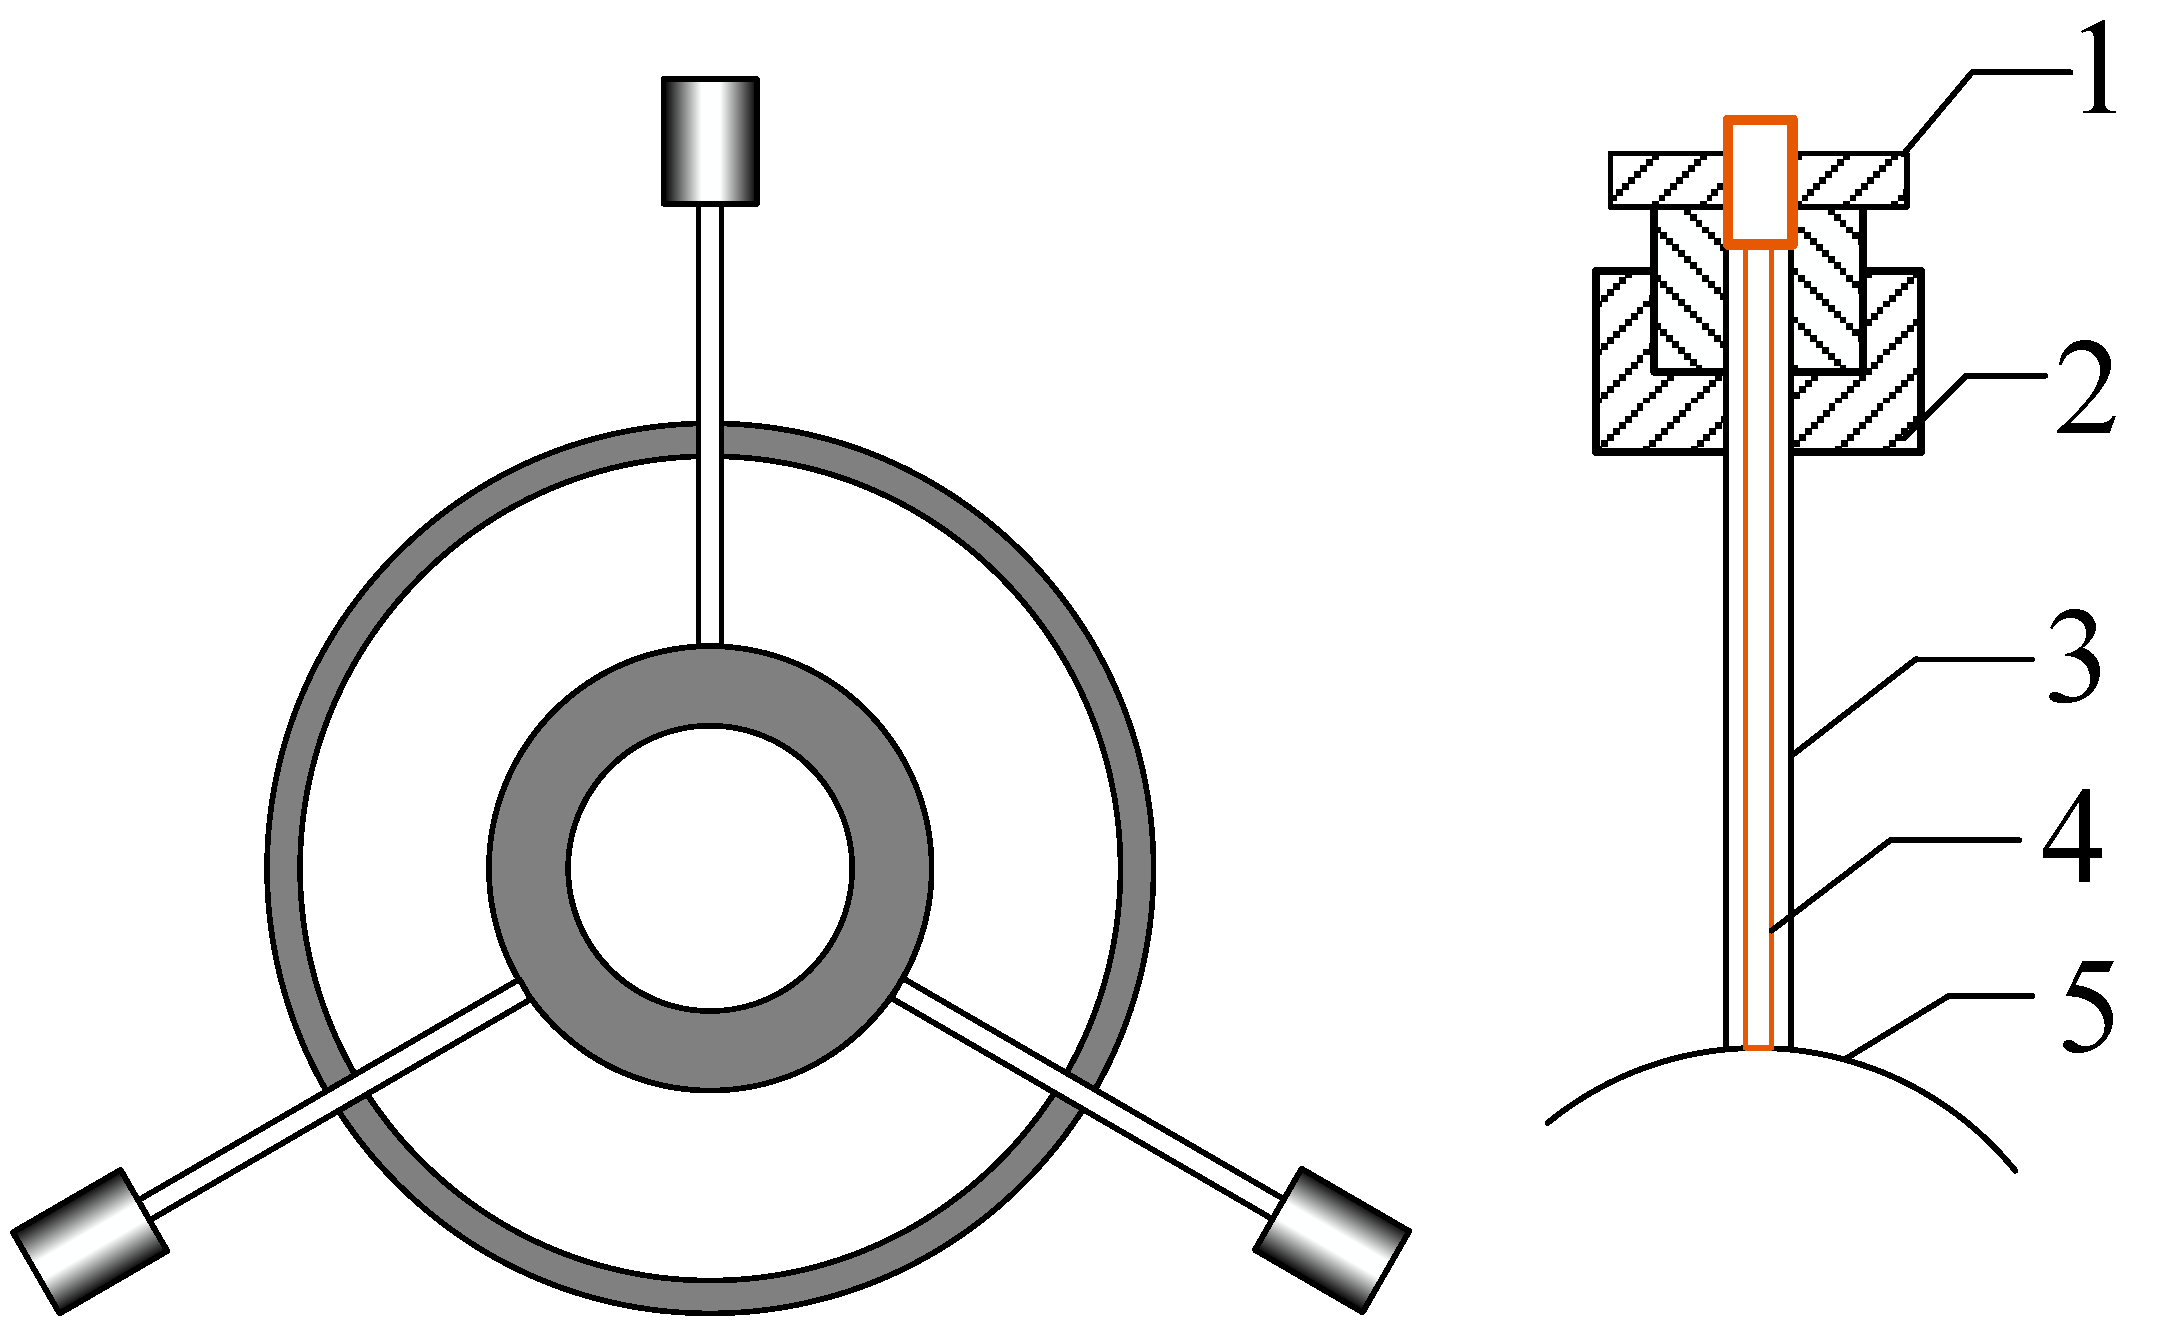
In the experiment system, T1–T6 served as the measuring points of wall temperature, T7–T15 represented the measuring point of fluid temperature. For the test sample T1–T6, the tube wall temperature was examined, T7 and T8 completed the measurement of fluid temperature. The arrangement of measuring points T1–T6 were the difficulty of this study, Figure 2 shows the arrangement of T1-T6.

Figure 2.
Layout of temperature sensor. 1—Sensor connector, 2—valve seat, 3—copper sleeve, 4—sensor probe, 5—Out wall of inner tube of test sample.
The test sample adopted a sleeve heat transfer structure, the hydrocarbon medium was circulated in the inner tube, the outer tube circulation medium was isobutane. The hydrocarbon medium flowed from bottom to top, and the isobutane flowed from top to bottom to form countercurrent heat exchange. To make the flow pattern in the test sample undisturbed, it was necessary to go through a flow pattern development section before the hydrocarbon refrigerant entered the test sample. In the experiment of this study, the flow pattern development section was an inclined straight tube with a tangent length of 1 m to the entrance of the spiral tube. To observe the flow pattern, a glass observation window (S1) was introduced between the flow pattern development section and the test sample. The observation window was made of double-layer quartz glass, thus exhibiting high pressure limit and favorable thermal insulation. to ensure that there was a certain flow pattern in the test sample, the flow pattern should be observed at the exit of the test sample. If the two were an identical flow pattern, the working fluid in the tube condensed under the certain flow pattern. On that basis, an observation window (S2) was introduced at the outlet of test sample.
2.1.2. Data Acquisition System
The experimental test data were collected using Programmable Logic Controller (PLC), the host type was CPU 224XP and the EM231 module was connected simultaneously, such that multiple groups of analog and digital data can be acquired. The temperature, pressure, pressure difference and mass flux were tested by sensors. Table 2 lists the performance parameters of the sensor.
Table 2.
Distribution of experimental deviation.
Temperature served as the main test parameter of the experiment of this study. The accuracy of the temperature sensor was given, whereas there will still be errors in the process of signal transmission. The accuracy of 15 signal transmission lines connected with the temperature sensor was determined to eliminate the influence of these errors.
The standard resistance box was selected rather than the temperature sensor to connect to the signal line. In accordance with the division value of Pt100 sensor [28], the resistance box was adjusted, and the error of the transmission line was directly determined by reading the temperature value displayed by the computer. Table 3 lists the specific test results. The helical diameter, inner diameter and helix angle of spiral tube were 2 m, 10 mm and 4°.
Table 3.
The specific error of temperature sensor signal transmission.
The transmission line resulted in systematic error to the temperature measurement system, and the maximum error was 1.4 °C and the minimum was 0 °C. In accordance with the verification results, the data of the temperature sensor transmission circuit were modified to ensure the accuracy of the experimental data.
3. Data Analysis
3.1. Process Calculation
The calculation method of vapor quality (x) of test pipe is expressed as follows:
where xin denotes the vapor quality in the inlet of the spiral tube; ig and il represent enthalpy of saturated vapor and liquid, respectively. iH1,out presents the enthalpy at the outlet of H1, which can be expressed as:
where iH1,in is the enthalpy at inlet of H1,QH1 and m represent the heating in H1 and the mass flow rate of hydrocarbon refrigerant, individually.
3.2. Accuracy Verification of Experiment System
The operation of the experiment system significantly affects the results, and the accuracy of the experiment system should be verified before the formal experiment. Propane serves as the working medium for examining the experiment system in the precision verification experiment, and the experiments were performed based on different flow rates and pressures. The heat transfer coefficient determined from the experiment was compared with that calculated by the classical heat transfer correlation in the tube under the identical working conditions, and the accuracy of the test bench was verified to ensure the accuracy of the experimental data.
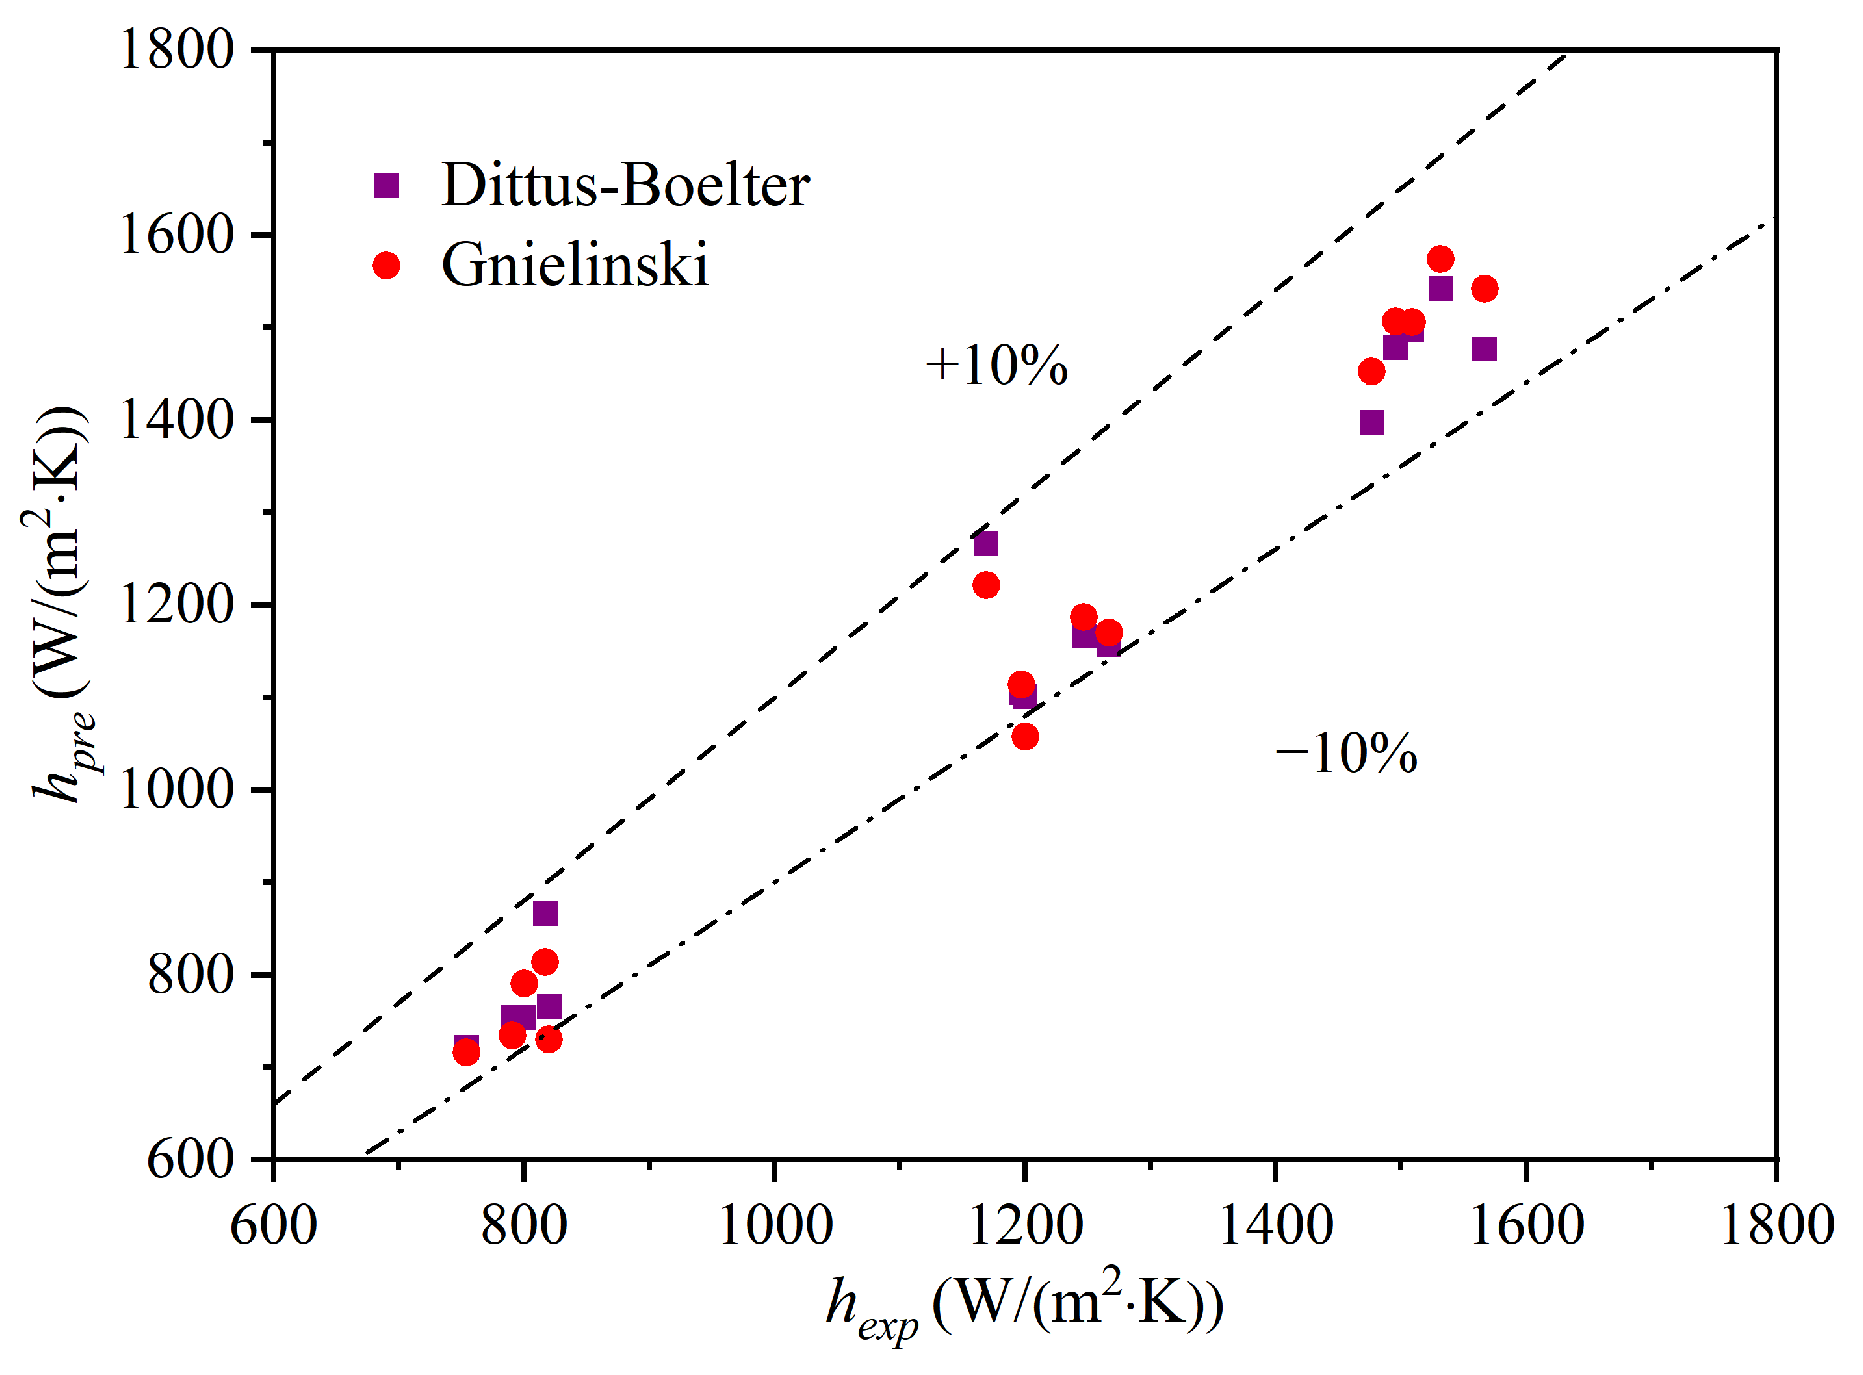
The theory of single-phase flow and heat transfer was relatively mature, and there were generally accepted and applicable correlations. The comparative correlations selected in this study comprised the Dittus–Boelter [29] correlation and the Geielinski [30] correlation.
The specific form of Dittus–Boelter correlation is written as:
The specific form of Geielinski correlation is expressed as follows:
When 0.5 < Pr < 1.5, 104 < Re < 5 × 10⁶,
When 1.5 < Pr < 500, 3000 < Re < 106,
where Nu denotes the Nusselt number, Re expresses the Reynolds number, Pr represents the Prandtl number, Prw represents the Prandtl number when the temperature of propane is the wall temperature, d is the inner diameter of the spiral tube, m. R is the helix diameter of the spiral tube.
The calculation equation of heat transfer coefficient (h) is written as:
where λ denotes the thermal conductivity of propane, W/(m·K). Table 4 lists the accuracy verification condition of the experimental system, and Figure 3 presents the deviation between the experimental value and the correlation value. As depicted in the table and figure, the deviation between the experimental and the predicted value of the correlation was less than ±10%, and the experimental data were reliable.
Table 4.
Experimental condition.
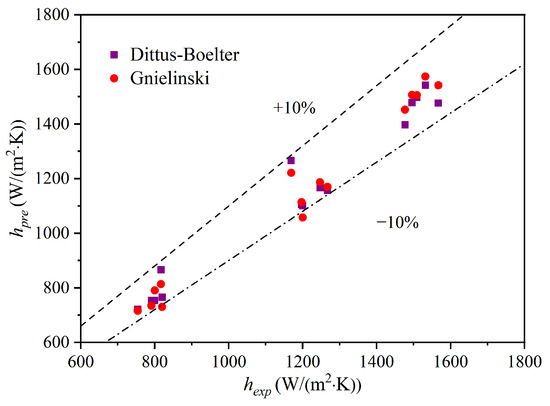
Figure 3.
Distribution of experimental deviation.
4. Experimental Results and Analysis
The experiment condition range in this study was as follows, the components of mixture refrigerant: methane/ethane = 0.65/0.35 (molar ratio), mass flux: 150–600 kg/(m2 s), vapor quality: 0–1, as well as operation pressure: 2–4 MPa. The experimental data were adopted to analyze the existing correlation heat transfer correlation, to compare the applicability of the existing correlation in the advanced LNG heat transfer equipment and to select the appropriate correlation form. This allowed us to obtain the high-precision correlation.
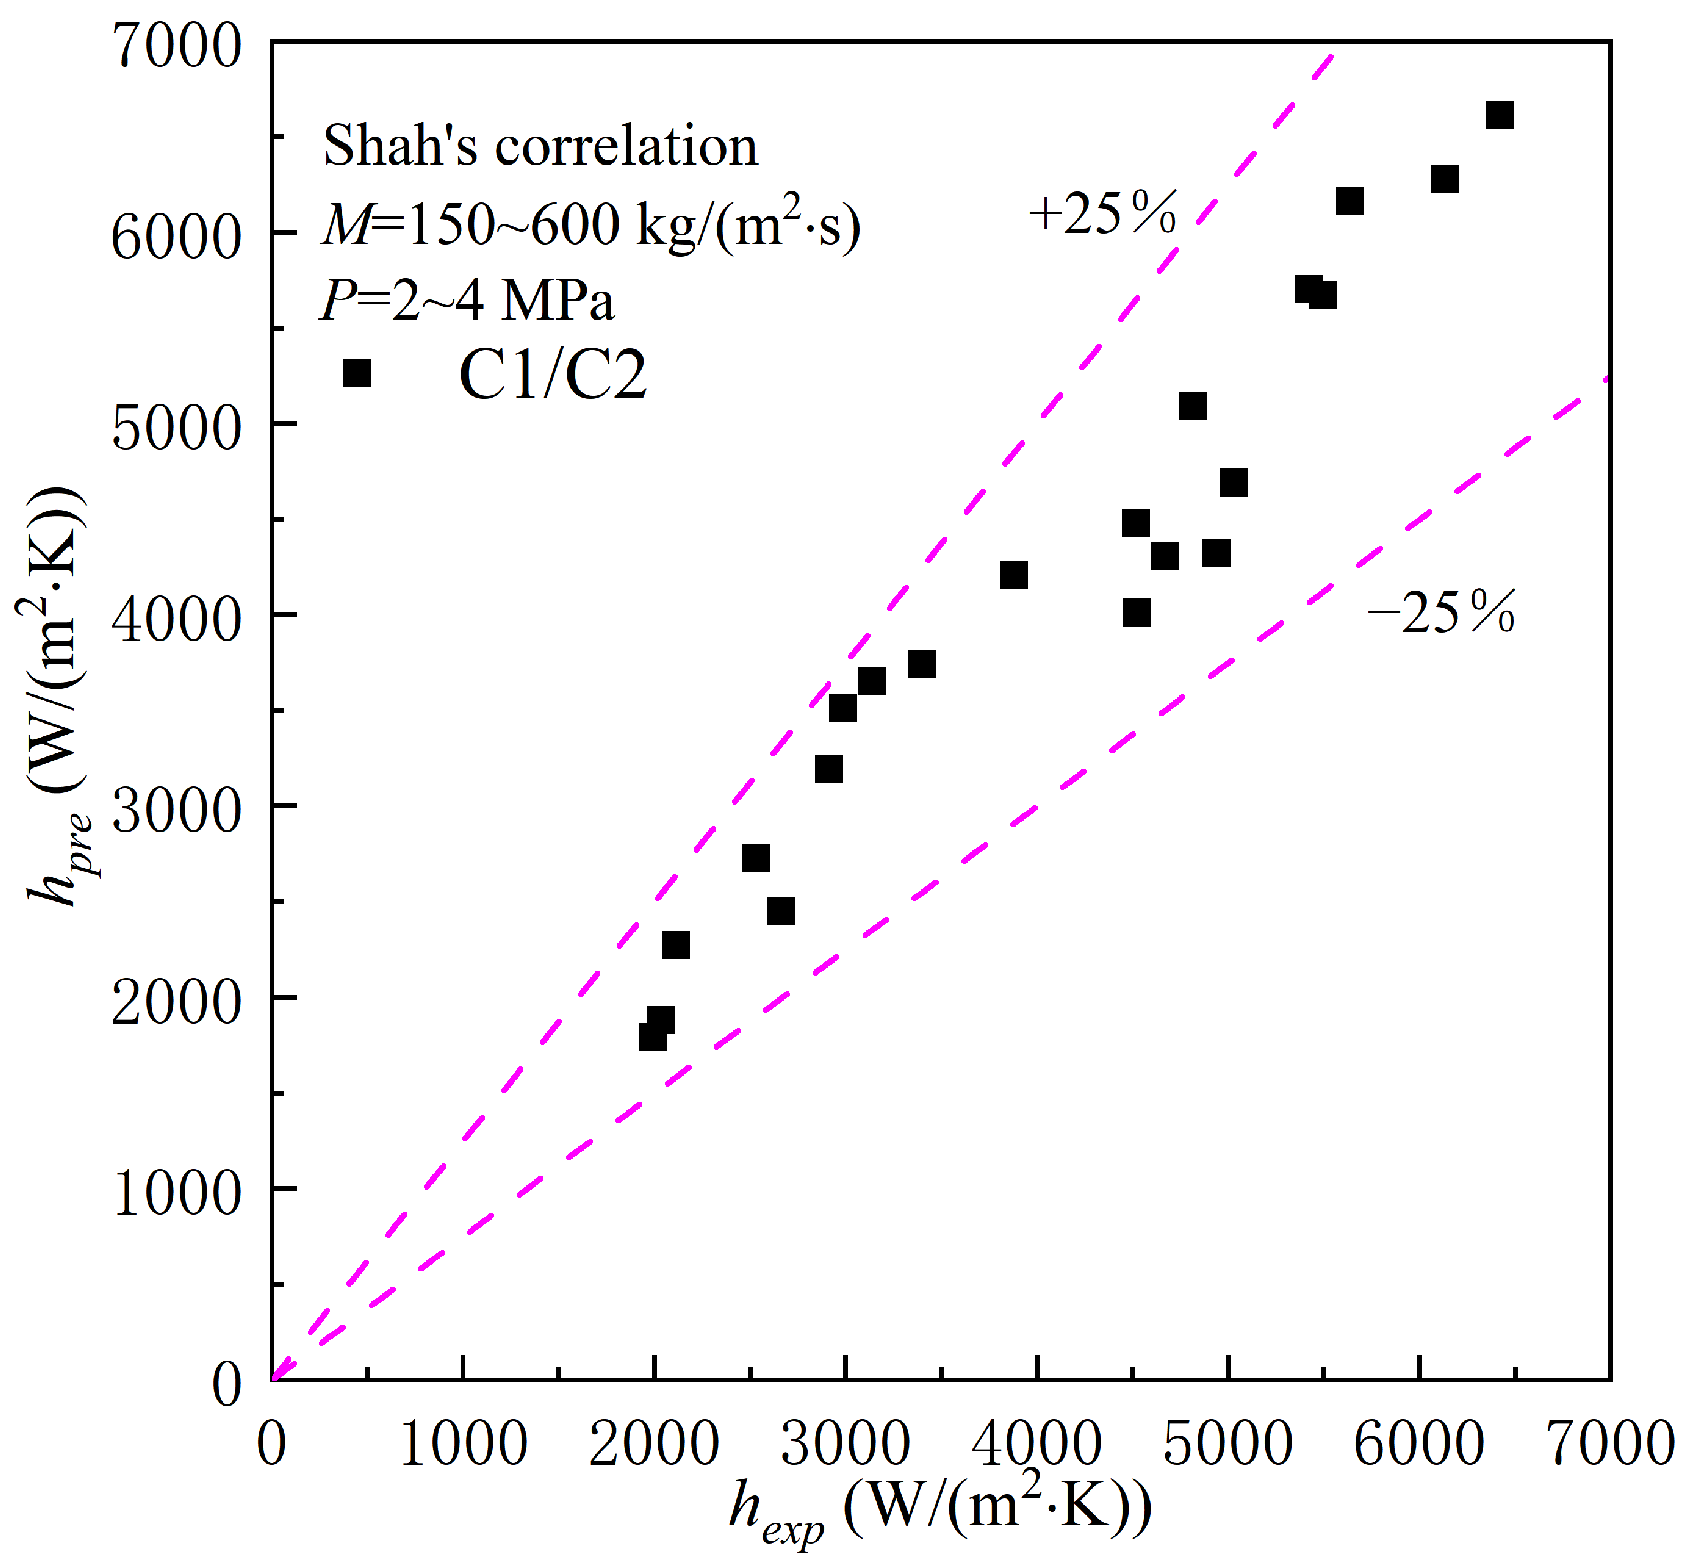
Three representative two-phase flow heat transfer correlations (i.e., Shah’s correlation, Li’s correlation and Neeraas’s correlation) were analyzed. Table 5 lists the specific form of correlations.
Table 5.
Coefficient of heat transfer correlations.
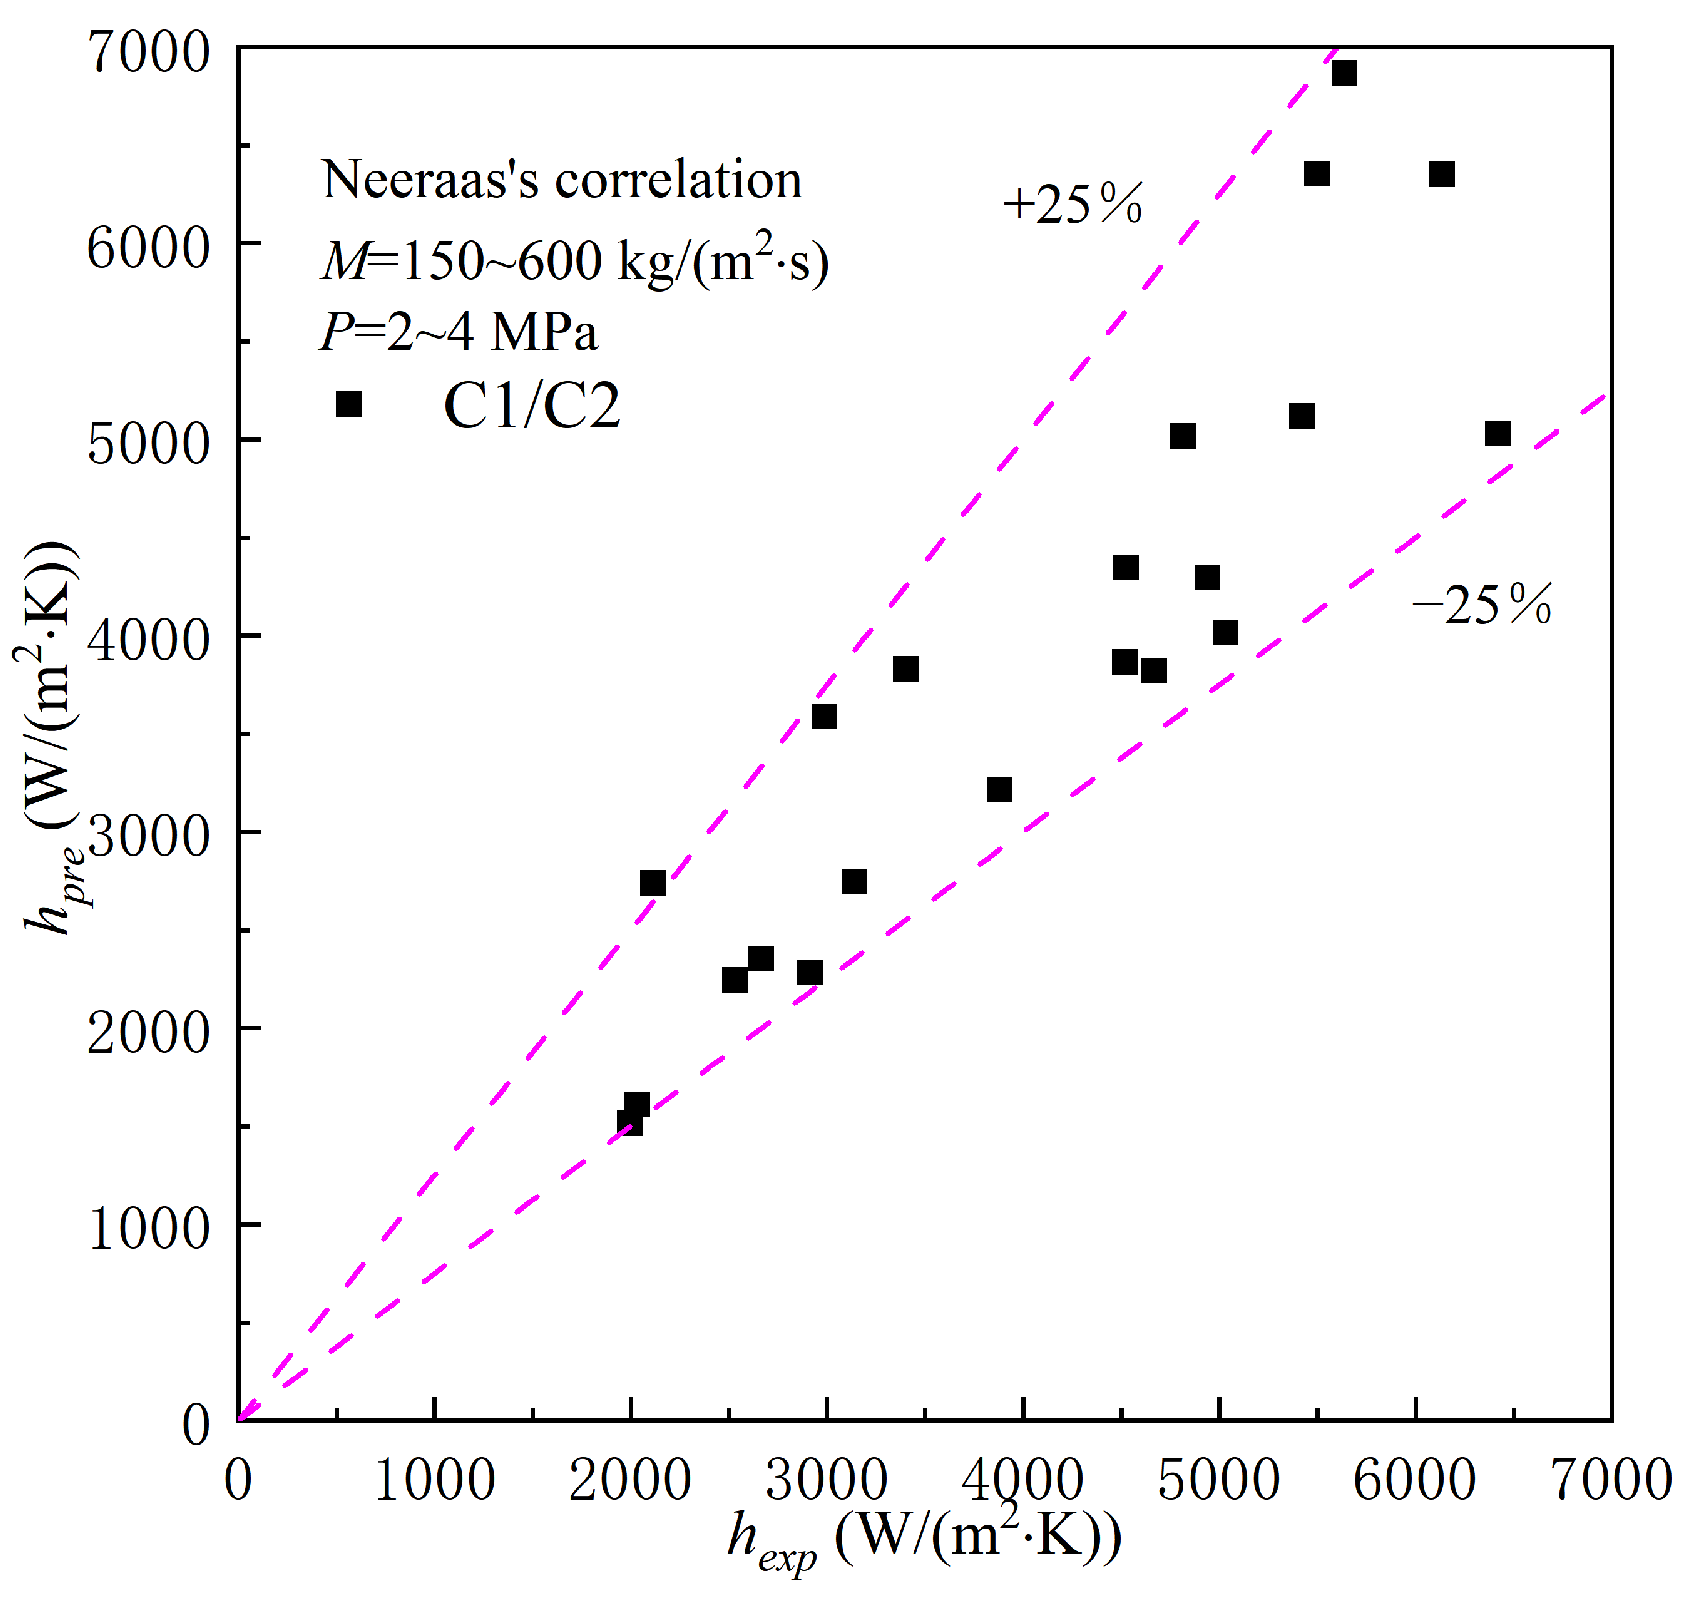
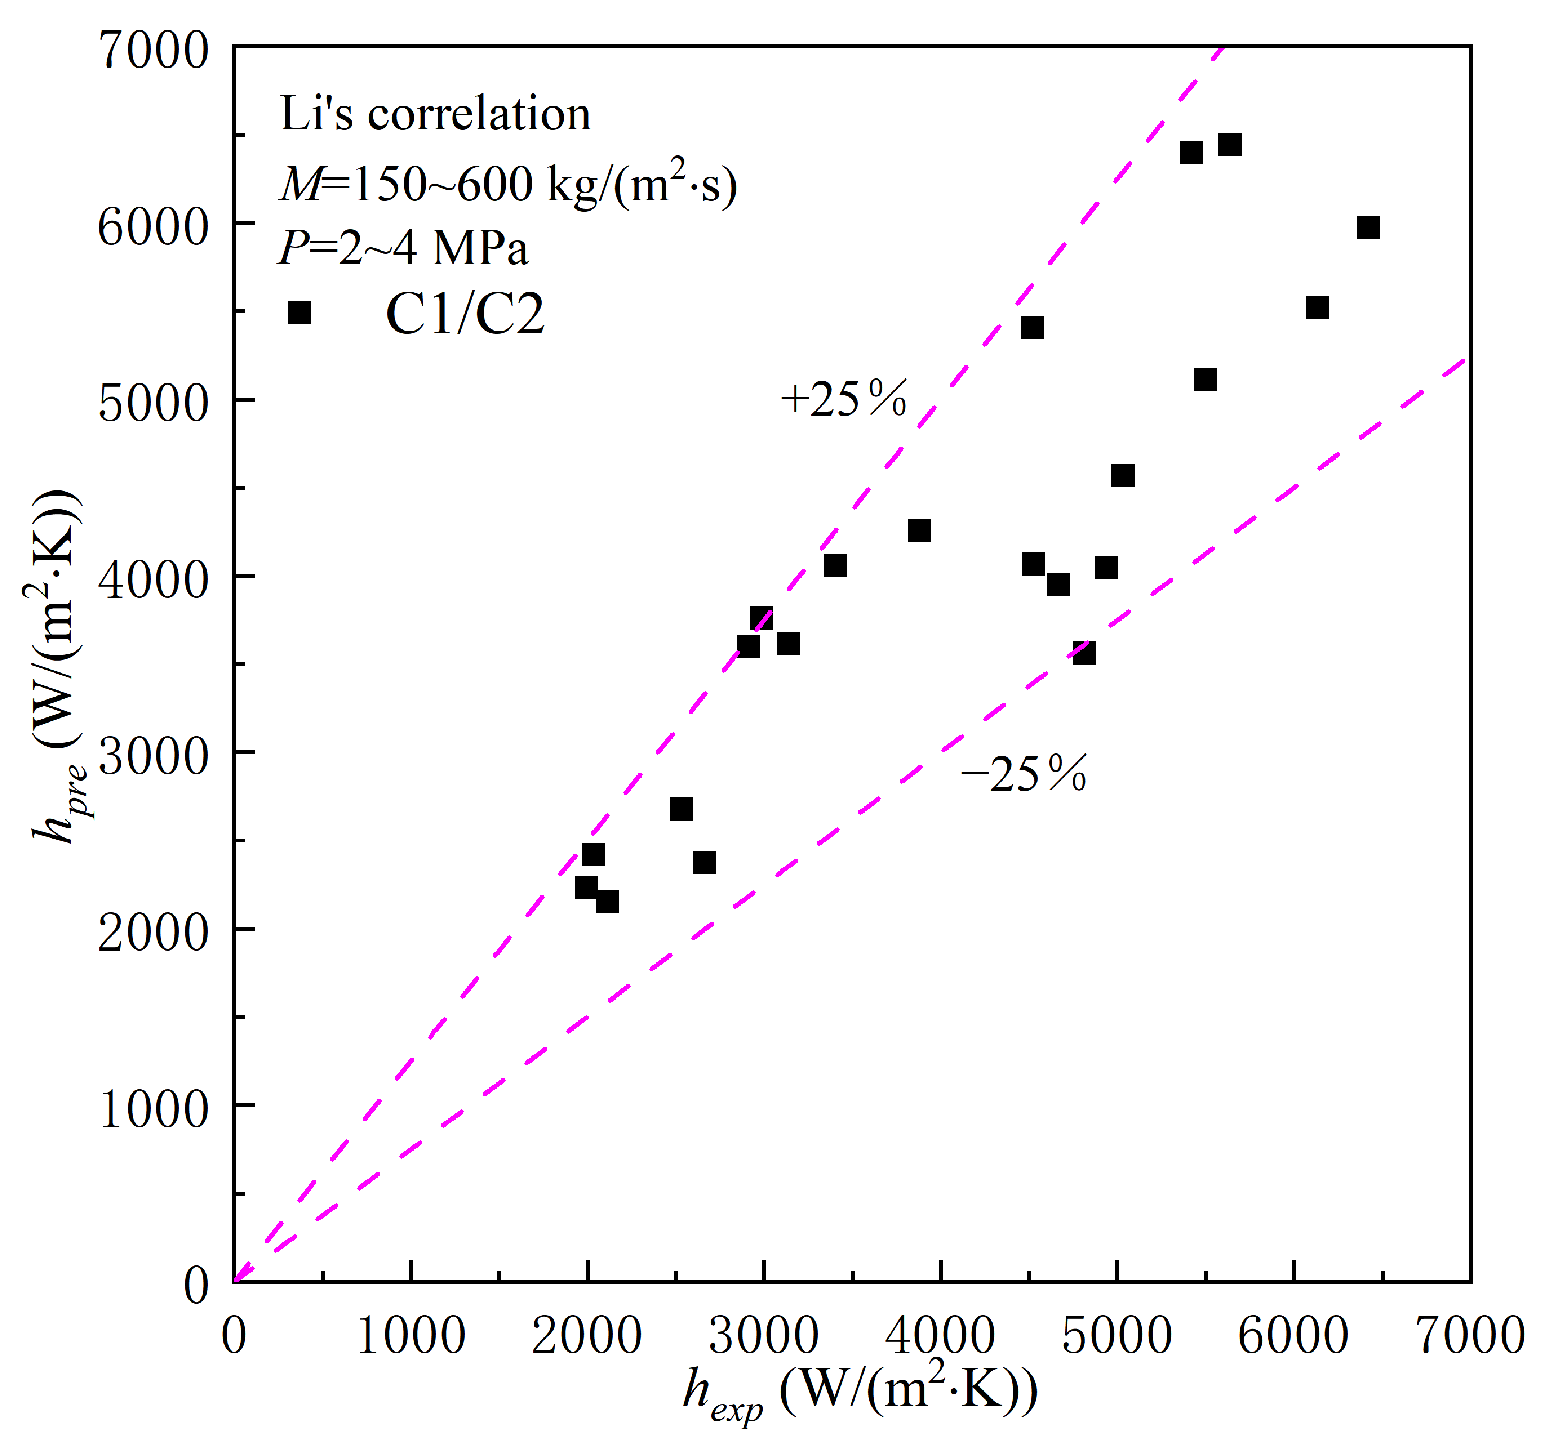
Figure 4, Figure 5 and Figure 6 presents the comparison between the experimental values and predicted values of Shah, Neeraas and Li correlations. As depicted in the figures, the overall error between the predicted value of Neeraas’s correlation and that of Li’s correlation was less than ±25%, whereas some points exceeded range. While the prediction effect of Shah correlation was the best, and all data points were in the range. Accordingly, this study chose Shah correlation as the basic form of flow pattern correlation development.
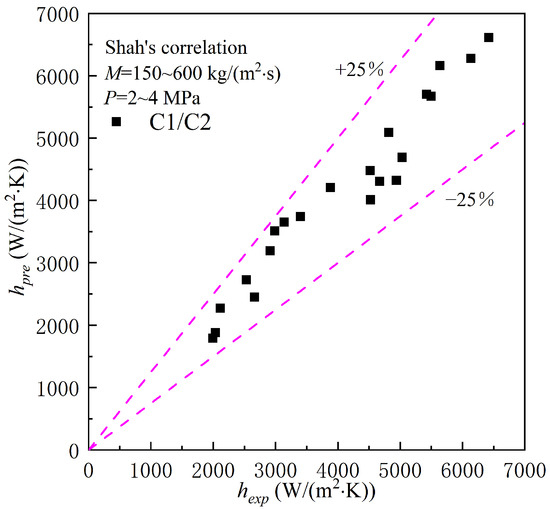
Figure 4.
Comparison of heat transfer coefficients between Shah’s correlation and experimental results.
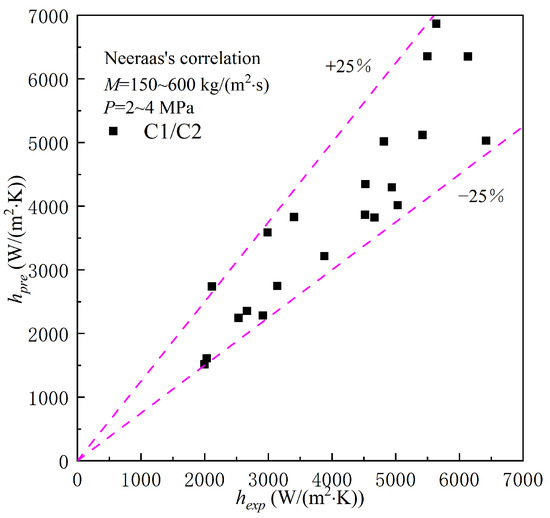
Figure 5.
Comparison of heat transfer coefficients between Neeraas’s correlation and experimental results.
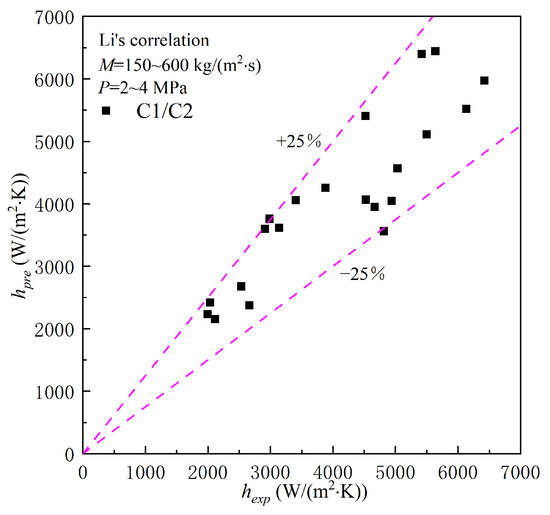
Figure 6.
Comparison of heat transfer coefficients between Li’s correlation and experimental results.
The basic form of Shah’s correlation is written as:
Using the experimental data to fit Equation (7), a novel correlation of condensation heat transfer coefficient of methane/ethane can be obtained. The specific form is as follows:
where Rel denotes the liquid phase Reynolds number, Prl represents the liquid phase Prandtl number, λl expresses the thermal conductivity of liquid phase, Pred is the critical pressure.
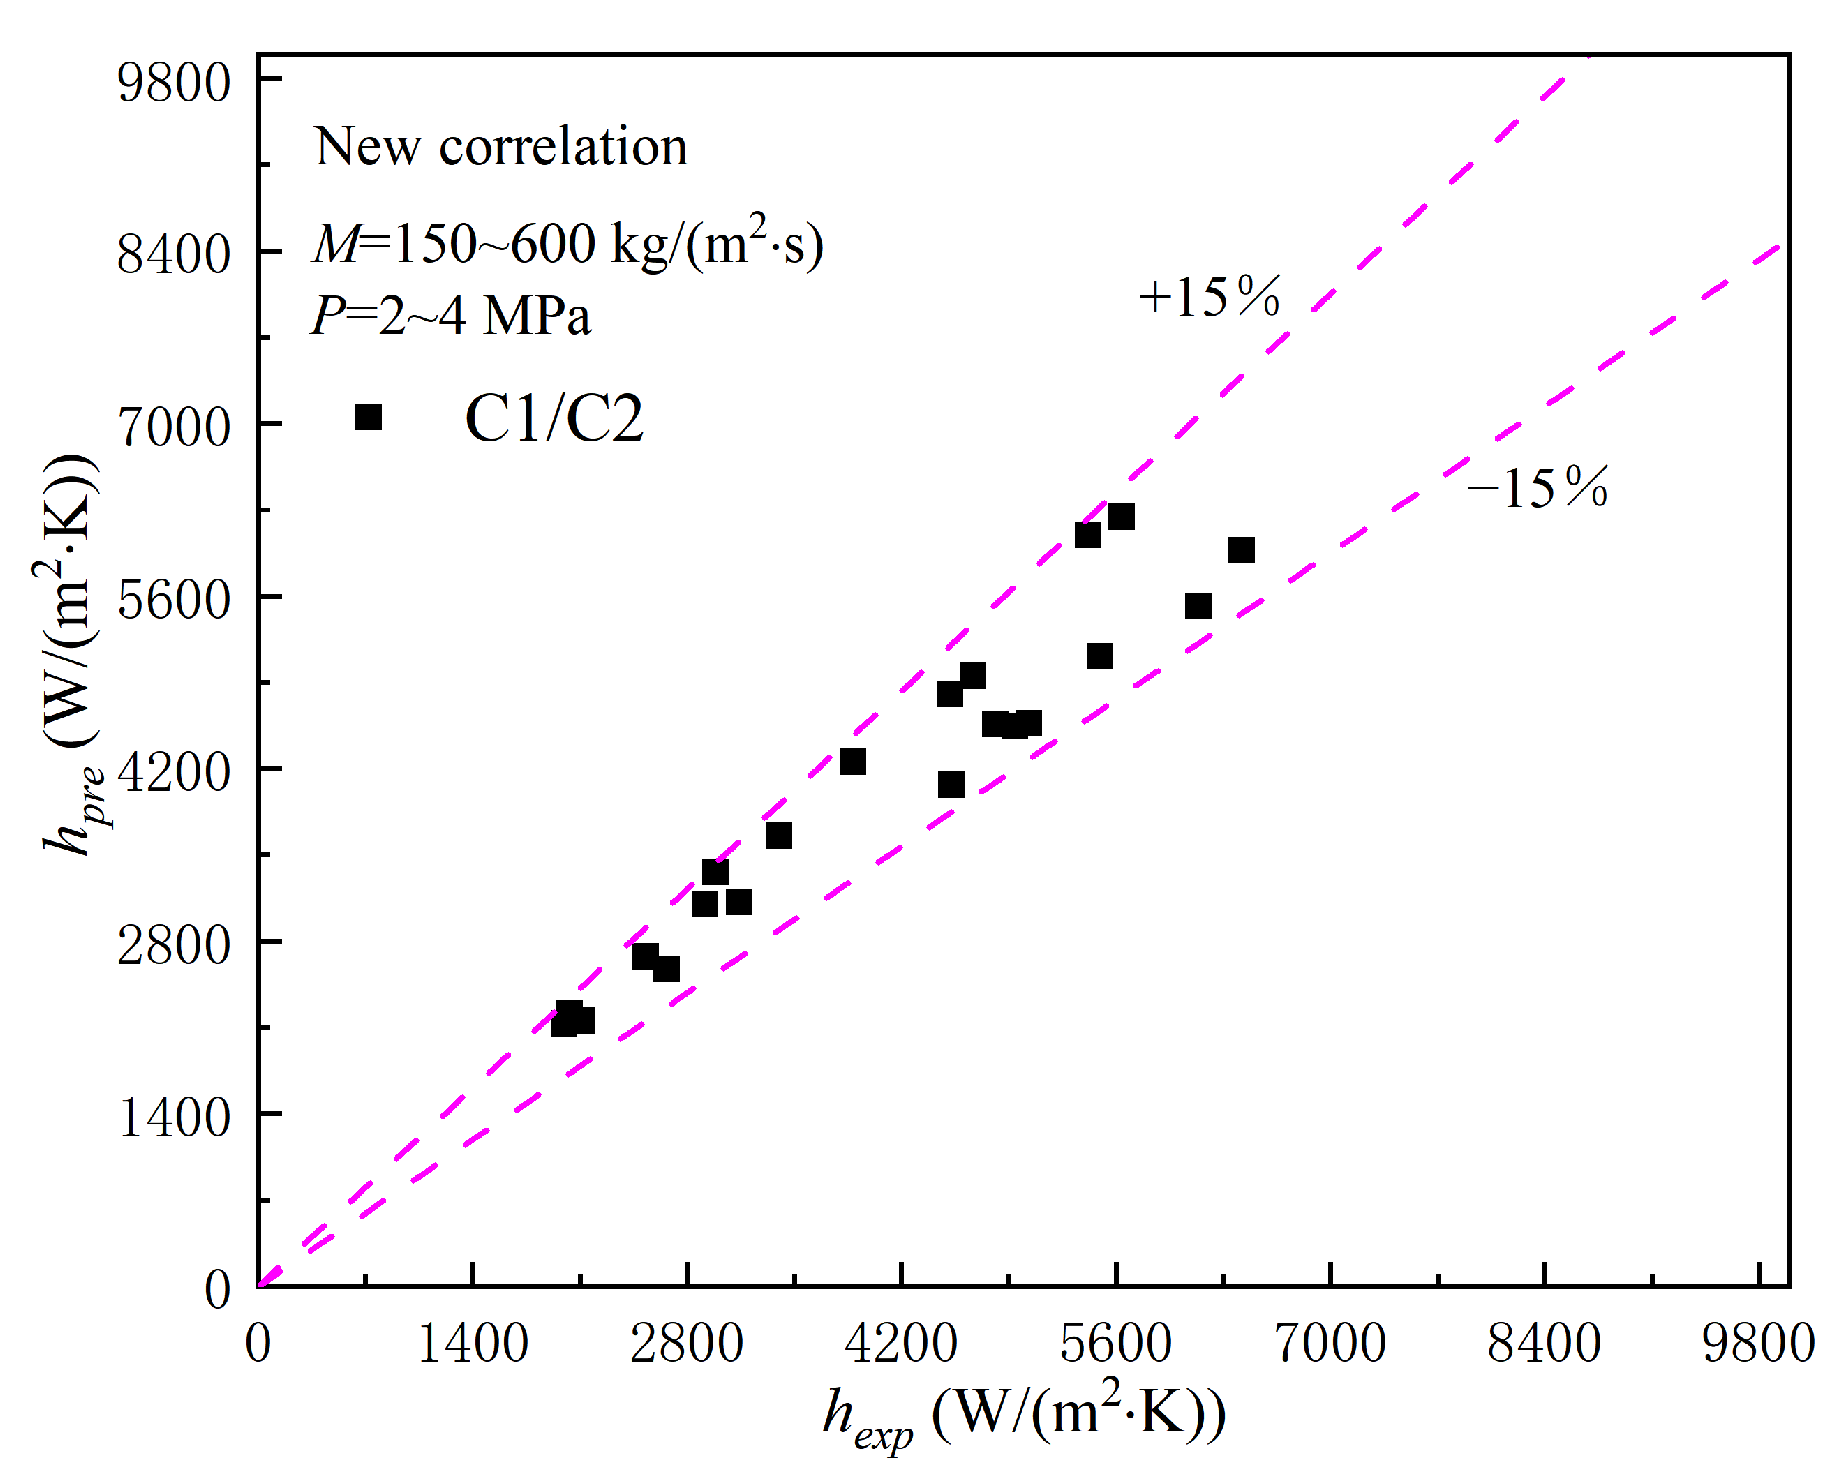
After the development of the correlation, the accuracy of the novel correlation should be verified, and the remaining experimental data were used to verify the accuracy of the developed correlation. The specific results are presented in Figure 7.
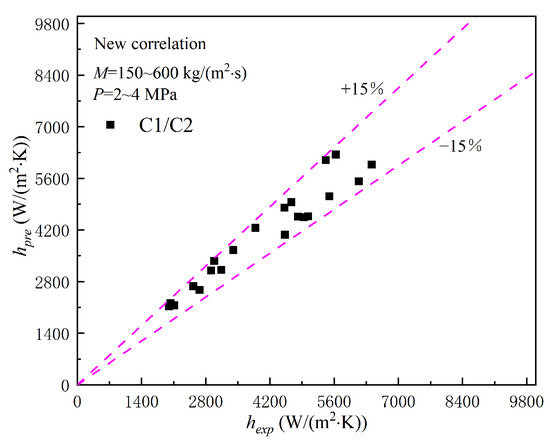
Figure 7.
Comparison of heat transfer coefficients between novel correlation and experimental.
Figure 7 shows the error between the prediction results of the novel correlation. By comparing the prediction data of the novel correlation with the experimental data, it was found that the prediction accuracy of the correlation was higher, and the data were not more than ±15%. The accuracy of the correlation can be used to guide this kind of advanced heat exchanger.
According to the experiment conditions, combined with the physical properties of the mixture queried by REFPROP, the applicable scope of the equation is as follows:
Rel ≤ 1.2 × 10⁵
1.83 ≤ Prl ≤ 2.11
0 < x < 1
1.83 ≤ Prl ≤ 2.11
0 < x < 1
5. Conclusions
To facilitate the development of LNG industry and develop high-performance natural gas liquefaction equipment, an experimental system of flow and heat transfer in mixed hydrocarbon was developed, and the accuracy of the experimental system was verified. The condensation flow and heat transfer experiments of methane/ethane (molar ratio:0.65/0.35) mixture were performed. The operating conditions were as follows: mass flux = 150–600 kg/(m2·s), vapor quality = 0–1 and operation pressure = 2–4 MPa. In accordance with the experimental data, the correlation of heat transfer coefficient in the spiral tube was investigated and then developed. The main conclusions are elucidated as follows:
- A high-precision experimental system was developed, and the deviation between the experimental and the classical heat transfer correlation was less than ±10%;
- The prediction errors of Shah, Neeraas and Li with experiment data were all within ±30%, and the accuracy of Shah correlation was the best, with all errors within ±25%, which can be used as the basic form of novel correlation development;
- Based on the experimental data, a novel correlation of heat transfer coefficient was developed. Additionally, the error comparison between the novel correlation prediction value and the experimental data was good, all the errors were lower than ±15%, such that the design requirements of advanced natural gas liquefaction equipment can be satisfied.
Author Contributions
Methodology, F.L.; Writing—original draft, F.L.; Writing—review & editing, F.L.; Project administration, J.C.; Funding acquisition, Y.J.; Resources, Y.J.; Formal analysis, W.Z.; Software, W.Z.. All authors have read and agreed to the published version of the manuscript.
Funding
This work was supported by research funds from the High Technology Ship Scientific Research Program by the Ministry of Industry and Information Technology of the People’s Republic of China (No. [2012]534).
Institutional Review Board Statement
Not applicable.
Informed Consent Statement
Not applicable.
Data Availability Statement
Data available on request due to restrictions eg privacy or ethical. The data presented in this study are available on request from the corresponding author. The data are not publicly available due to the data will be used in engineering manufacturing.
Conflicts of Interest
The authors declare no conflict of interest.
Nomenclature
| Nomenclature | |
| cp | specific heat of mixed, J/(kg·K) |
| d | inner diameter of tube, m |
| R | the curvature diameter, m |
| Fr | Froude number |
| Frso | Soliman’s modified Froude number |
| g | gravity acceleration, m/s2 |
| h | heat transfer coefficient, W/(m2·K) |
| m | mass flow rate, kg/s |
| M | mass flux, kg/(m2·s) |
| P | pressure, MPa |
| Pr | Prandtl number, Pr = μcp/λ |
| Prl | liquid turbulent Prandtl number |
| q | heat flux, W/m2 |
| Re | Reynolds number, Re = Md/μ |
| Rel | liquid Reynolds number, Rel = Md(1 − x)/μl |
| Relo | liquid only Reynolds number, Relo = Md/μl |
| T | temperature, K |
| We | Weber number, We = M2d/(σρ) |
| x | vapor quality |
| Nu | Nusselt number |
| i | enthalpy, J/kg |
| Xtt | Lockhart–Martinelli parameter |
| Greek symbols | |
| α | volume fraction or void fraction |
| β | inclination angle, ° |
| λ | thermal conductivity, W/(m·K) |
| λl | liquid thermal conductivity, W/(m·K) |
| μ | dynamic viscosity, Pa·s |
| γlg | latent heat of vaporization, J/kg |
| ρ | density, kg/m3 |
| δ | the liquid film thickness, m |
| Suberscripts | |
| exp | experiment value |
| g | vapor phase |
| l | liquid phase |
| pre | predict value |
| red | critical |
| Abbreviations | |
| C1 | methane |
| C2 | ethane |
| SWHE | spiral wound tube heat exchanger |
| NG | natural gas |
| LNG | liquid nature gas |
References
- Luo, Y.; Cheng, N.; Zhang, S.; Tian, Z.; Xu, G.; Yang, X.; Fan, J. Comprehensive energy, economic, environmental assessment of a building integrated photovoltaic-thermoelectric system with battery storage for net zero energy building. Build. Simul. 2022, 15, 1923–1941. [Google Scholar] [CrossRef]
- Luo, Y.; Hu, L.; Ochs, F.; Tosatto, A.; Xu, G.; Tian, Z.; Dahash, A.; Yu, J.; Yuan, G.; Chen, Y.; et al. Semi-analytical modeling of large-scale water tank for seasonal thermal storage applications. Energy Build. 2023, 278, 112620. [Google Scholar] [CrossRef]
- Tian, Z.; Zheng, W.; Guo, J.; Wang, Y.; Wang, Y.; Jiang, Y. Thermodynamic analysis of structural parameters during condensation in spiral tubes. Int. J. Heat Mass Transf. 2022, 189, 122677. [Google Scholar] [CrossRef]
- Tian, Z.; Zheng, W.; Li, X.; Zheng, L.; Jiang, Y. Numerical investigation on condensation heat transfer performance of mixed hydrocarbon refrigerant in spirally tubes. Int. J. Refrig. 2022, 139, 13–24. [Google Scholar] [CrossRef]
- He, T.; Karimi, I.A.; Ju, Y. Review on the design and optimization of natural gas liquefaction processes for onshore and offshore applications. Chem. Eng. Res. Des. 2018, 132, 89–114. [Google Scholar] [CrossRef]
- Gu, A.; Xue, L. Liquefied Natural Gas (Lng) Technical Manuals; China Machine Press: Beijing, China, 2010. [Google Scholar]
- Li, S.; Cai, W.; Chen, J.; Zhang, H.; Jiang, Y. Numerical study on the flow and heat transfer characteristics of forced convective condensation with propane in a spiral pipe. Int. J. Heat Mass Transf. 2018, 117, 1169–1187. [Google Scholar] [CrossRef]
- Yu, J.; Jiang, Y.; Cai, W.; Li, F. Heat transfer characteristics of hydrocarbon mixtures refrigerant during condensation in a helical tube. Int. J. Therm. Sci. 2018, 133, 196–205. [Google Scholar] [CrossRef]
- Yu, J.; Jiang, Y.; Cai, W.; Li, F. Forced convective condensation flow and heat transfer characteristics of hydrocarbon mixtures refrigerant in helically coiled tubes. Int. J. Heat Mass Transf. 2018, 124, 646–654. [Google Scholar] [CrossRef]
- Li, S.; Cai, W.; Chen, J.; Zhang, H.; Jiang, Y. Evaluation analysis of correlations for predicting void fraction of condensation hydrocarbon refrigerant upward flow in a spiral pipe. Appl. Therm. Eng. 2018, 140, 716–732. [Google Scholar] [CrossRef]
- Hui, P.; Chen, J. Application and technical analysis on the localization of spiral-wound heat exchanger in large-scale natural gas liquefaction plant. Refrig. Techonol. 2011, 3, 26–29. [Google Scholar]
- Zhang, X.; Jiang, F. Present situation of the technical research on spiral tube. Refrig. Air Cond. 2014, 28, 75–80. [Google Scholar]
- Neeraas, B.O. Condensation of Hydrocarbon Mixtures in Coil-Wound Lng Heat Exchangers. Tube-Side Heat Transfer and Pressure Drop; Norwegian Institute of Technology: Trondheim, Norway, 1993. [Google Scholar]
- Shao, L.; Han, J.T.; Su, G.P.; Pan, J.H. Condensation heat transfer of r-134a in horizontal straight and helical cooled tubes. J. Refrig. 2007, 28, 23–26. [Google Scholar]
- Boyko, L.; Kruzhilin, G. Heat transfer and hydraulic resistance during condensation of steam in a horizontal tube and in a bundle of tubes. Int. J. Heat Mass Transf. 1967, 10, 361–373. [Google Scholar] [CrossRef]
- Ananiev, E.P.; Boyko, L.D.; Kruzhilin, G. Heat transfer in the presence of steam condensation in a horizontal tube. Int. Dev. Heat Transf. 1961, 2, 290–295. [Google Scholar]
- Zheng, S.; Mu, J.; Wen, F. Resistance characteristic experiment of two-phase flow in spiral pipe. Trans. Chin. Soc. Agric. Mach. 2013, 44, 87–90. [Google Scholar]
- Li, G.; Guo, L.; Gao, H. Flow patterns of oil-water liquid-liquid two-phase flow in helically coild tubes. J. Chem. Ind. Eng. 2000, 51, 39–242. [Google Scholar]
- Li, S.; Cai, W.; Chen, J.; Zhang, H.; Jiang, Y. Numerical study on condensation heat transfer and pressure drop characteristics of ethane/propane mixture upward flow in a spiral pipe. Int. J. Heat Mass Transf. 2018, 121, 170–186. [Google Scholar] [CrossRef]
- Song, Q.; Wang, D.; Shen, J.; Zhao, Y.; Gong, M. Flow condensation pressure drop characteristics of zeotropic mixtures of tetrafluoromethane/ethane: Experimental and analytical investigation. Int. J. Heat Mass Transf. 2022, 182, 122045. [Google Scholar] [CrossRef]
- Moghaddam, H.A.; Sarmadian, A.; Asnaashari, A.; Joushani, H.A.; Islam, M.S.; Saha, S.C.; Ghasemi, G.; Shafaee, M. Condensation heat transfer and pressure drop characteristics of Isobutane in horizontal channels with twisted tape inserts. Int. J. Refrig. 2020, 118, 31–40. [Google Scholar] [CrossRef]
- Zhang, L.; Liu, J.P.; Xu, X.W. Numerical simulation of heat transfer performance of r410a in condensing-superheated zone. Int. J. Refrig. 2021, 128, 206–217. [Google Scholar] [CrossRef]
- AlHajeri, H.M.; Almutairi, A.; Al-Hajeri, M.H.; Alenezi, A.; Alajmi, R.; Koluib, A.M. Condensation Heat Transfer of R-407C in Helical Coiled Tube Heat Exchanger. Processes 2020, 8, 1157. [Google Scholar] [CrossRef]
- Zhang, L.; Liu, J.; Xu, X. Experimental investigation on flow condensation of methane in a horizontal smooth tube. Int. J. Refrig. 2017, 78, 193–214. [Google Scholar] [CrossRef]
- Zhuang, X.R.; Chen, G.F.; Guo, H.; Song, Q.L.; Tang, Q.X.; Yang, Z.Q.; Zou, X.; Gong, M.Q. Experimental investigation on flow condensation of zeotropic mixtures of methane/ethane in a horizontal smooth tube. Int. J. Refrig. 2018, 85, 120–134. [Google Scholar] [CrossRef]
- Solanki, A.K.; Kumar, R. Two-phase flow condensation heat transfer characteristic of R-600a inside the horizontal smooth and dimpled helical coiled tube in shell type heat exchanger. Int. J. Refrig. 2019, 107, 155–164. [Google Scholar] [CrossRef]
- Zenkour, A.M.; Abouelregal, A.E. State-space approach for an infinite medium with a spherical cavity based upon two-temperature generalized thermoelasticity theory and fractional heat conduction. Z. Für Angew. Math. Und Phys. 2013, 65, 149–164. [Google Scholar] [CrossRef]
- Shah, M.M. An improved and extended general correlation for heat transfer during condensation in plain tubes. HVAC&R Res. 2009, 15, 889–913. [Google Scholar]
- Dittus, F.W.; Boelter, L.M.K. Heat transfer in automobile radiators of the tubular type. Int. Commun. Heat Mass Transf. 1985, 12, 3–22. [Google Scholar] [CrossRef]
- Gnielinski, V. New equation for heat and mass transfer in turbulent pipe and channel flow. Int. Chem. Eng. 1976, 16, 359–368. [Google Scholar]
- Li, P.H.; Norris, S. Heat transfer correlations for co2 flowing condensation in a tube at low temperatures. Appl. Therm. Eng. 2016, 93, 872–883. [Google Scholar] [CrossRef]

Disclaimer/Publisher’s Note: The statements, opinions and data contained in all publications are solely those of the individual author(s) and contributor(s) and not of MDPI and/or the editor(s). MDPI and/or the editor(s) disclaim responsibility for any injury to people or property resulting from any ideas, methods, instructions or products referred to in the content. |
© 2023 by the authors. Licensee MDPI, Basel, Switzerland. This article is an open access article distributed under the terms and conditions of the Creative Commons Attribution (CC BY) license (https://creativecommons.org/licenses/by/4.0/).