3.1. SNL Test Loop Benchmarking
The data reported in the literature regarding the operation of the SNL test loop was used to benchmark the results obtained from the numerical simulation implemented in EES and assess the cycle model’s capability to describe the operation of an s-CO
2 RcBC adequately. Only nominal operating conditions were considered for comparison due to the lack of off-design experimental data in the literature. The cycle information reported in refs. [
17,
20] was configured in the EES code to model the SNL test loop.
The results obtained from the EES code were used to determine performance parameters such as cycle efficiency, cycle input heat, cycle rejected heat, turbomachinery power consumption/generation, and heat load in and pressure drop through the recuperators. These parameters were then contrasted with those reported in ref. [
20].
Table 2 summarizes the specific cycle parameters considered to validate the ability of the proposed model to describe the performance of an actual s-CO
2 cycle. For each variable in the first column of
Table 2, the second column shows the magnitude reported in ref. [
17] or ref. [
20] (either directly available or determined using the available information). Moreover, the third column shows the results obtained from the EES model, and the fourth column the associated percentage error obtained from the EES routine concerning the data from SNL as
%.
In
Table 2,
,
, and
are the pressure rise/drop through the compressor, recompressor, and turbine, respectively.
,
,
, and
are the pressure drops through the LTR cold, LTR hot, HTR cold, and HTR hot streams, respectively. Finally,
,
, and
are the pressure ratios of the compressor, recompressor, and turbine, respectively.
Some errors reported in the second, third, and fourth columns in
Table 2 are significant. The higher values correspond to the pressure drops through the recuperators, the cycle net power output, turbine power output, and cycle first-law efficiency. Since the model underestimates the pressure drop through the test loop, it overestimates the pressure drop through the turbine. The first-law efficiency of a Brayton cycle depends on the turbine power output, which depends on the enthalpy drop through the turbine, and such a drop depends on the turbine working pressure difference. Therefore, one may argue that the error in cycle net power output, turbine power output, and cycle first-law efficiency all stem from underestimating pressure drop through the recuperators.
Considering the previous discussion, it was worth verifying the model’s ability to accurately account for pressure drop in the SNL test loop recuperators. Then, the friction factor
f was scaled to match the data presented in ref. [
17], removing the effects associated with the pressure drop within the recuperators on the numerical model. The fifth, sixth, and seventh columns of
Table 2 (which are highlighted as
Scaled f) show the updated results, indicating a major improvement, where the higher percentage errors were reduced to 1.92%, 0.30%, and 3.47% for net power output, turbine power output, and first-law efficiency, respectively.
Regarding the reduction in the errors obtained by adjusting the friction coefficient, the Petukhov [
29], Blasius [
30], and both empirical correlations of ref. [
31] were implemented; however, the results showed that the errors increased. One possible explanation for such a behavior is that the relative surface roughness of the PCHEs plays an essential role in the pressure drop, and the tested correlations did not account for that. Although the surface roughness of PCHE might not be substantial (
10
m [
32]), their hydraulic diameter is small. In addition to that, the data provided by SNL correspond to experimental measurements, so they are subject to inherent uncertainties. The piping and its bends are not considered in the model, so they are possible sources of error. Moreover, there are experimental measurement uncertainties. In particular, the pressure drop through the hot side of the LTR stands out with a magnitude of
bar, which could be due to the piping and instrumentation-related issues. Furthermore, Clementoni [
17] states that leaks are an important problem of the SNL test loop, and mass losses throughout the test loop further hinder the model’s capability to describe the operation accurately.
3.3. Literature Cycle
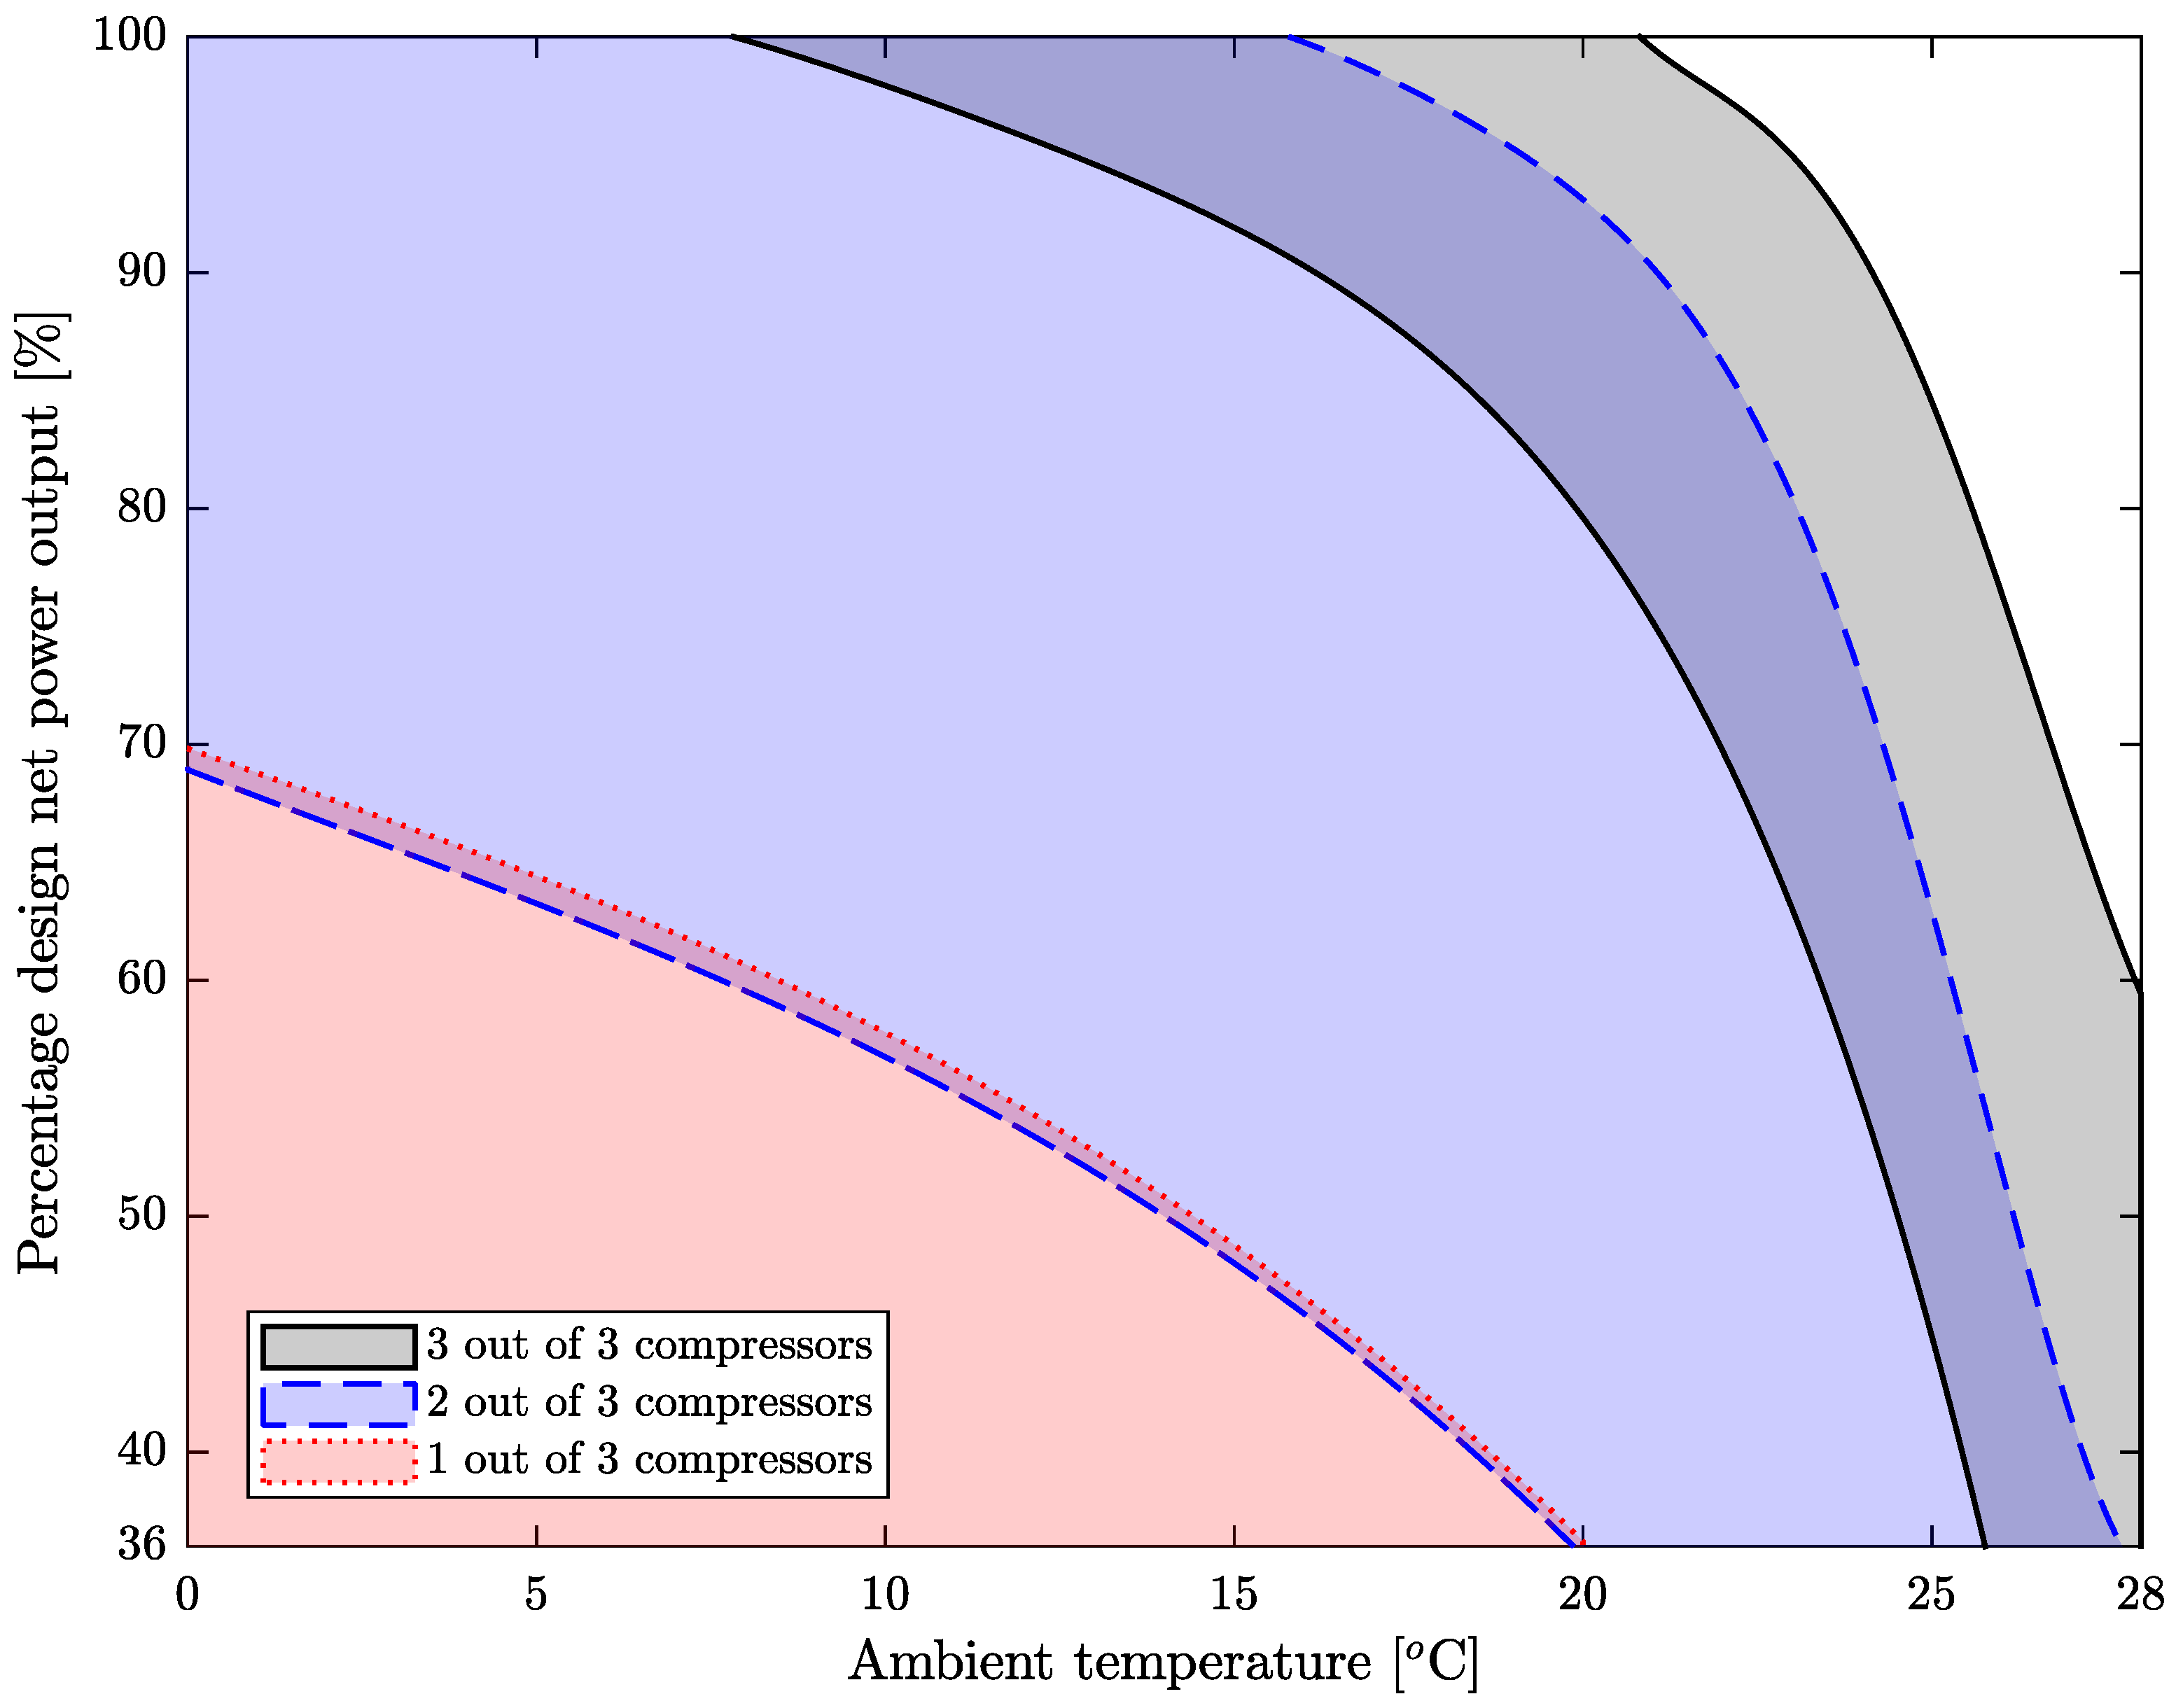
Figure 2 presents the operational ranges obtained for the literature cycle under different M out of N operation regimes as shaded regions. The x-coordinate corresponds to ambient temperature, and the y-coordinate corresponds to the percentage of the plant’s design net power output, i.e., 25
.
The gray region in
Figure 2, delimited by the continuous black lines, indicates that the operational range of the literature cycle is highly restricted. On the domain of interest, the literature cycle can only operate on a thin crescent determined by three curves. The curve that describes the bottom-left end of the operational domain corresponds to the compressors undergoing surge. Since the power output is modulated through a decrease in the working fluid mass flow rate, the compressors rapidly undergo surge due to the proximity of the design operational condition to the surge line. As the ambient temperature increases beyond the design point, the s-CO
2’s mass-specific volume increases, decreasing the mass flow rate required to turn down the power output. This is partially offset by the increase in the mass-specific volumetric flow, delaying the onset of surge in the compressors and extending the operational range downwards. On the contrary, as the ambient temperature drops, decreasing the volumetric flow also causes the compressor to undergo surge. The literature cycle cannot operate at ambient temperatures below 7 °C, even at the design mass flow rate (i.e., 255
/
).
Two different lines clearly define the right-hand side of the mid and dark-blue operational domain. The bottom one, at an ambient temperature of 28 °C, corresponds to the limit at which flow in the compressors becomes supersonic. The turbine pressure difference must be higher at higher ambient temperatures to achieve the same mass flow rate. Such a high-pressure difference can be achieved, to a certain extent, by increasing the rotational speed of the compressors; however, it is limited, since the compressor rotor tip speed eventually reaches Mach 1. Hence, the final edge of the mid- and dark-blue operational domain, i.e., the top-right end, corresponds to a new phenomenon not related to choking or supersonic flow. Specifically, operating at the top right corner requires the turbine to rotate slower while the compressor must spin faster. Since these components share a shaft in the literature cycle, a blockage occurs due to their mechanical integrity. Henceforth, this phenomenon represents a shaft blockage.
When the literature cycle operates with two of its three compressors and three of the three recompressors, the operational domain widens and shifts towards the lower left-hand corner, i.e., the blue region of
Figure 2 delimited by the dashed blue lines. The surge limitation persists, although the mass flow rate is redistributed between fewer compressors, which delays its onset and enables the cycle to operate at an ambient temperature of 0 °C. The right-hand-side edge of the operational domain corresponds to the previously mentioned shaft blockage phenomenon. The increased mass flow rate the compressors perceive when one of them is turned off decreases the pressure rise through them. Reducing the volumetric flow is required due to a decrease in the ambient temperature to provide the pressure difference required by the turbine. Therefore, the shaft blockage curve shifts to the left compared to the previous region.
The red region under the dotted red line in
Figure 2 corresponds to the one-out-of-three-compressors scenario. In this scenario, the surge limitation persists; however, since the domain of interest does not encompass power outputs smaller than 9
, it disappears as the domain edge for the last scenario. The upper-right curve corresponds to the shaft blockage phenomenon analogously to the one described for the previous configuration.
Overall, superposing the three operational ranges shows an extended operational range substantially larger than that available to the literature cycle if the M out of N strategy was not implemented. Regardless, the literature cycle cannot operate at ambient temperatures above 28 °C. There is a slight overlap between the third and second configurations; thus, the operational domain is continuous. However, the need to change between operating regimes on such a narrow band is challenging. Finally, this analysis corroborates the limits of the operational range for the literature cycle.
Combining the three previous configurations, the coupled first-law efficiency of the literature cycle over its operational range shows a maximum of 48.3% at design conditions and a minimum of 28% at off-design conditions. The first-law efficiency decreases slowly as ambient temperature decreases and faster as power output reduces, i.e., lower mass flow rate. Moreover, some discontinuities exist between the configurations’ responses, implying that a continuous change in the power block’s net power output would require a discrete change in the heat supplied to the cycle when changing between configurations. Also, when crossing the border between configurations at a constant mass flow rate, there is a discontinuity in the net power output, which brings out the importance of control ramifications.
3.4. Proposed Cycle
Figure 3 presents the operational range of the proposed cycle under different operation regimes (M out of N). The gray region delimited by the continuous black lines represents the wide domain where the proposed cycle can operate with three of its compressors on. The edge of the operational range is comprised of three curves: one at the bottom left-hand side and the other two at the right-hand end of the operational range. Comparing its operational range to the literature cycle evidences higher flexibility. As with
Figure 2, the bottom left-hand edge corresponds to the compressors undergoing surge. Since neither the compressor nor the recompressor shares a shaft with the turbine, they can adjust their shaft speeds individually and delay the onset of surge. Furthermore, the right-hand side has a short curve at the top, where the limiting factor is the mass flow rate. At the maximum mass flow rate (255
/
), the cycle’s net power output decreases as the ambient temperature increases. At higher ambient temperatures, the operational range is delimited by the onset of supersonic flow. As for the literature cycle, the pressure differential required to sustain a specific mass flow rate increases with higher ambient temperatures. The larger speeds eventually make the compressors enter a supersonic flow regime.
The blue region under the dashed blue line in
Figure 3 describes a similar condition to the one observed in
Figure 2. The cycle’s operational range exceeds the domain of interest on the left-hand side of the graph when operating with two out of its three compressors. The edge of the operational domain at the right-hand side is composed of a short curve associated with the maximum mass flow rate constraint and a long curve representing the limit of supersonic flow. Analogously to
Figure 2, with one of the compressors off, the other two receive a larger mass flow rate, reducing the pressure rise, and the compressor must spin faster to sustain the required mass flow rate through the turbine, leading to the supersonic flow. Therefore, the right-hand side limit of the operational range shifts to the left-hand side. The extensive range of the proposed cycle under the two-out-of-three configuration makes analyzing the one-out-of-three configuration unnecessary.
The coupled operational range for the proposed cycle, shown in
Figure 3 and obtained by superposing both operational ranges, indicates that the cycle can deliver power at an ambient temperature of 37 °C, albeit at little more than 50% of the design net power output. Moreover, it is observed that the overlap between the operational regions is significant (i.e., the dark-blue region).
Concerning the first-law efficiency, the minimum value observed for the proposed cycle is above 40%, exceeding the performance of the literature cycle (28%). Moreover, unlike the discontinuities found for the coupled efficiency of the literature cycle, the transition between configurations in the proposed cycle is smooth, eliminating the aforementioned control complexity. Also, the first-law efficiency varies strongly with net power output, but it varies more slowly when the ambient temperature is close to 27 °C. As for the literature cycle, the first-law efficiency varies less with respect to the ambient temperature as it decreases.
3.5. Influence of the Ambient Temperature and Net Power Output on the Cycle’s Performance
Aiming to examine the performance of both the literature and the proposed cycles,
Figure 4 shows their combined operational range at specific key points, indicated using Greek letters. Additionally, the
T–
s diagrams are plotted along with the CO
2’s saturation curve to allow visualization of the changes in the cycle performance due to variations in the ambient temperature and cycle’s net power output.
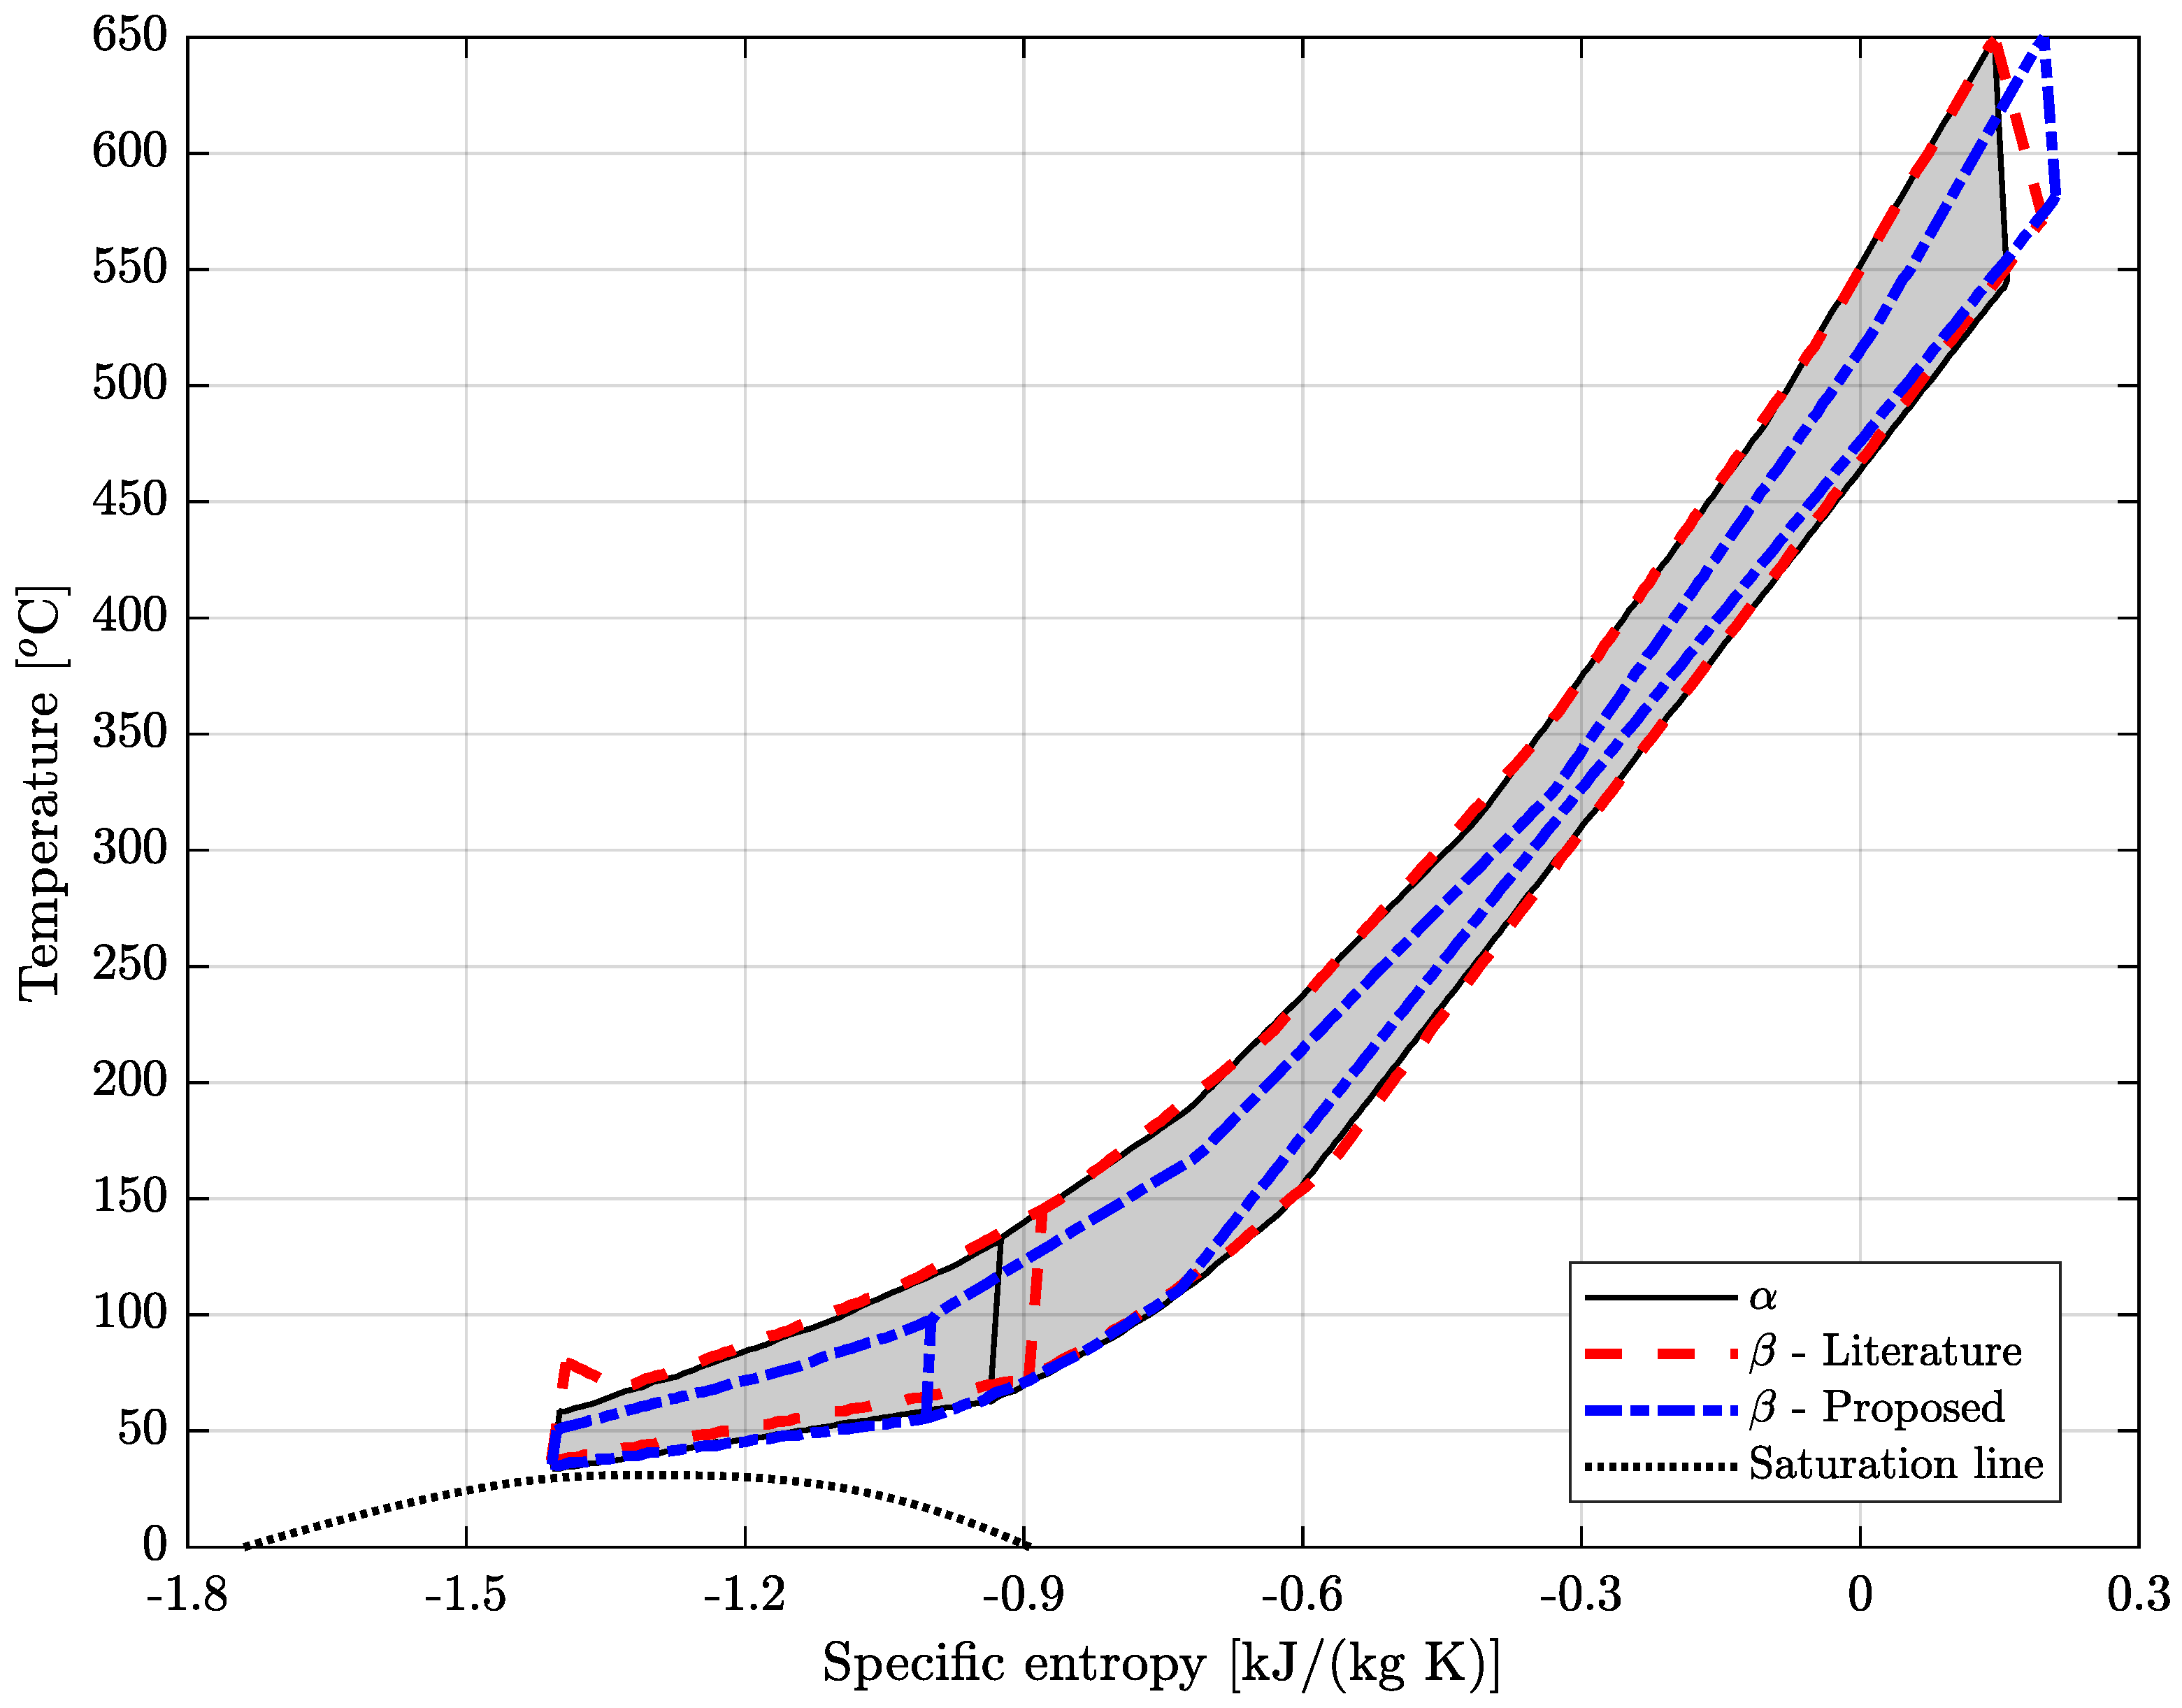
Figure 5 presents the
T–
s diagrams of the cycle under nominal operational, i.e., at point
— where the literature and the proposed cycles are identical —with the continuous black line (and shaded area), and the literature and proposed cycles at point
with the dashed red and dash-dotted blue lines, respectively. At point
, the cycle’s lowest temperature is close to the critical point, but, since the LTR outlet (i.e., where the flow splits) is further to the right side, the influence of the critical region is not significant. Due to the discretization considered by the model in the recuperators, the HTR part of the diagram does not have as many nodes as the LTR, which explains the sharp straight segments observed in that section of the diagram. Likewise, after the flow splits, the state corresponding to the cooler outlet causes a straight line at the bottom-left of the graph.
With an ambient temperature equivalent to the design ambient temperature and a power output of 9 , the literature cycle at point undergoes three important changes, as observed in the T–s diagram. The slope of the expansion curve shows an appreciable reduction in the turbine’s efficiency. The flow splitting occurs at a slightly higher temperature, shifting it to the right side along the specific entropy axis. Due to the reduced mass flow rate and the inability of the compressor to adjust its speed independently of the turbine speed, the compressor outlet pressure increases and the throttling valve reduces it, resulting in a bump at the compressor outlet.
On the other hand, the proposed cycle at shows three changes in its T–s diagram. The first change is a decrease in temperature at the splitting point, shifting it towards the left-hand side. The second change is the decrease in the cycle’s high-end pressure, as seen by the down-shifting of the top curve in the diagram. This is explained by the control strategy implemented, which considers the three-shaft layout to modulate net power output, decreasing its high-end pressure. Hence, unlike the literature cycle, there is no need for throttling valves after either the compressors or the recompressors. This reduction in the cycle’s high-end pressure, in turn, reduces the differential pressure through the turbine, reducing the enthalpy drop and, thus, the turbine power output. The third and final change is a decrease in temperature difference between streams in the HTR, explained by the discretization implemented.
Similar to
Figure 5,
Figure 6 presents the
T–
s diagrams of the cycles at point
with the continuous black line (and shaded area), the literature cycle at point
with the dashed red, and the proposed cycle at point
with the dash-dotted blue line. At point
, the cycle operates at an ambient temperature of 0 °C and with a power output of 25
.
Figure 6 shows the literature cycle’s three significant changes. As the ambient temperature decreases, so does the lower temperature in the cycle, shifting the left end of the cycle to the left. This, in turn, shifts the splitting point towards the CO
2’s critical point. No noticeable effect is observed on the
T–
s diagram regarding the heat transfer process in the LTR. The third change is analogous to what occurred in the literature cycle at point
, with a very slight bump after the compressor, signaling the action of the throttling valve.
Given the similarity between the T–s diagrams of both cycles at point , the proposed cycle’s plot is omitted. Although the proposed cycle also experiences two of the three changes mentioned in the literature cycle, it does not show the throttling valve bump after the compressor, thanks to its ability to adjust the compressor speed independently from the turbine. The similarity between both cycles also leads to their first-law efficiencies reaching close to 46% when operating at point .
At point
, the cycles remain operating at the ambient temperature of 0 °C but with a power output of 9
. For the literature cycle, the
T–
s diagram showcases the four previously mentioned changes, i.e., (i) the cycle low-end temperature shifts downwards, (ii) the splitting temperature also shifts downwards, (iii) there is a reduction in turbine efficiency, and (iv) the throttling valve after the compressor is brought into action. Similarly, in the proposed cycle at point
in
Figure 6, the low-end temperature and splitting temperature decrease, and, as before, the cycle’s high-end pressure decreases, decreasing the enthalpy drop through the turbine. When inspecting the HTR section of the diagram, the decrease in the temperature difference shows that the temperature difference is close to zero. This suggests that the discretization considered for the HTR is insufficient to describe this scenario properly.
The points
and
for the literature cycle and
and
for the proposed cycle refer to the upper limit of the ambient temperature, as shown in
Figure 4. Then,
Figure 7 presents the
T–
s diagrams of the cycles at point
with the continuous black line (and shaded area), the literature cycle at point
with the dashed red line, and the proposed cycle at point
with the dash-dotted blue line. The
key point corresponds to an ambient temperature of 28 °C and a power output of
. Three changes to the
T–
s diagram are observed at point
, the first being the increase in the cycle’s low temperature. This shifts the bottom part of the
T–
s diagram and the splitting point towards the right-hand side. The compression of the working fluid takes place towards the right of the critical point, signaling the compression of a more gas-like and compressible supercritical fluid. The third change is a decrease in turbine efficiency, evidenced by the change in slope at the top-right part of the
T–
s diagram.
The
T–
s diagram at point
refers to an ambient temperature of 28 °C and a power output of 9
. Except for a further decrease in the turbine efficiency and the curtailment of the outlet compressor pressure induced by the throttling valve, the overall behavior is similar to point
; hence, it was omitted in this section. At points
and
, the ambient temperature is 37 °C, while the power outputs are
and 9
, respectively. The diagrams at both key points are similar; hence,
Figure 7 only describes the cycle at point
. Overall, the scenarios depict the same changes: an increased ambient temperature shifts the bottom of the diagram and splitting point toward the right side, and the cycle’s high-end pressure is reduced.
3.6. Exergy Destruction
Quantifying the irreversibilities associated with the cycle off-design operation provides insight into the mechanisms responsible for decreasing its conversion efficiency. In this sense,
Figure 8 shows the destruction of physical exergy by cycle configuration and its components at different key points. Analyzing
Figure 8, it is possible to verify that the proposed cycle always destroys less exergy than the literature cycle. Moreover, the total exergy destroyed varies little with the net power output for the literature cycle, which, in all the scenarios analyzed, is higher than 8500
; however, for the proposed cycle, it reaches as low as 5000
at
. The exergy destroyed increases when decreasing the net power output for the literature cycle (points
,
, and
); the opposite effect is observed for the proposed cycle (points
,
, and
).
Since point corresponds to the design conditions, operating in such a scenario minimizes the exergy destroyed on a per-unit-power-generated basis. Operation at point is followed by the proposed cycle and then the literature cycle, with the scenarios in which the latter outputs 9 yielding the worst results.
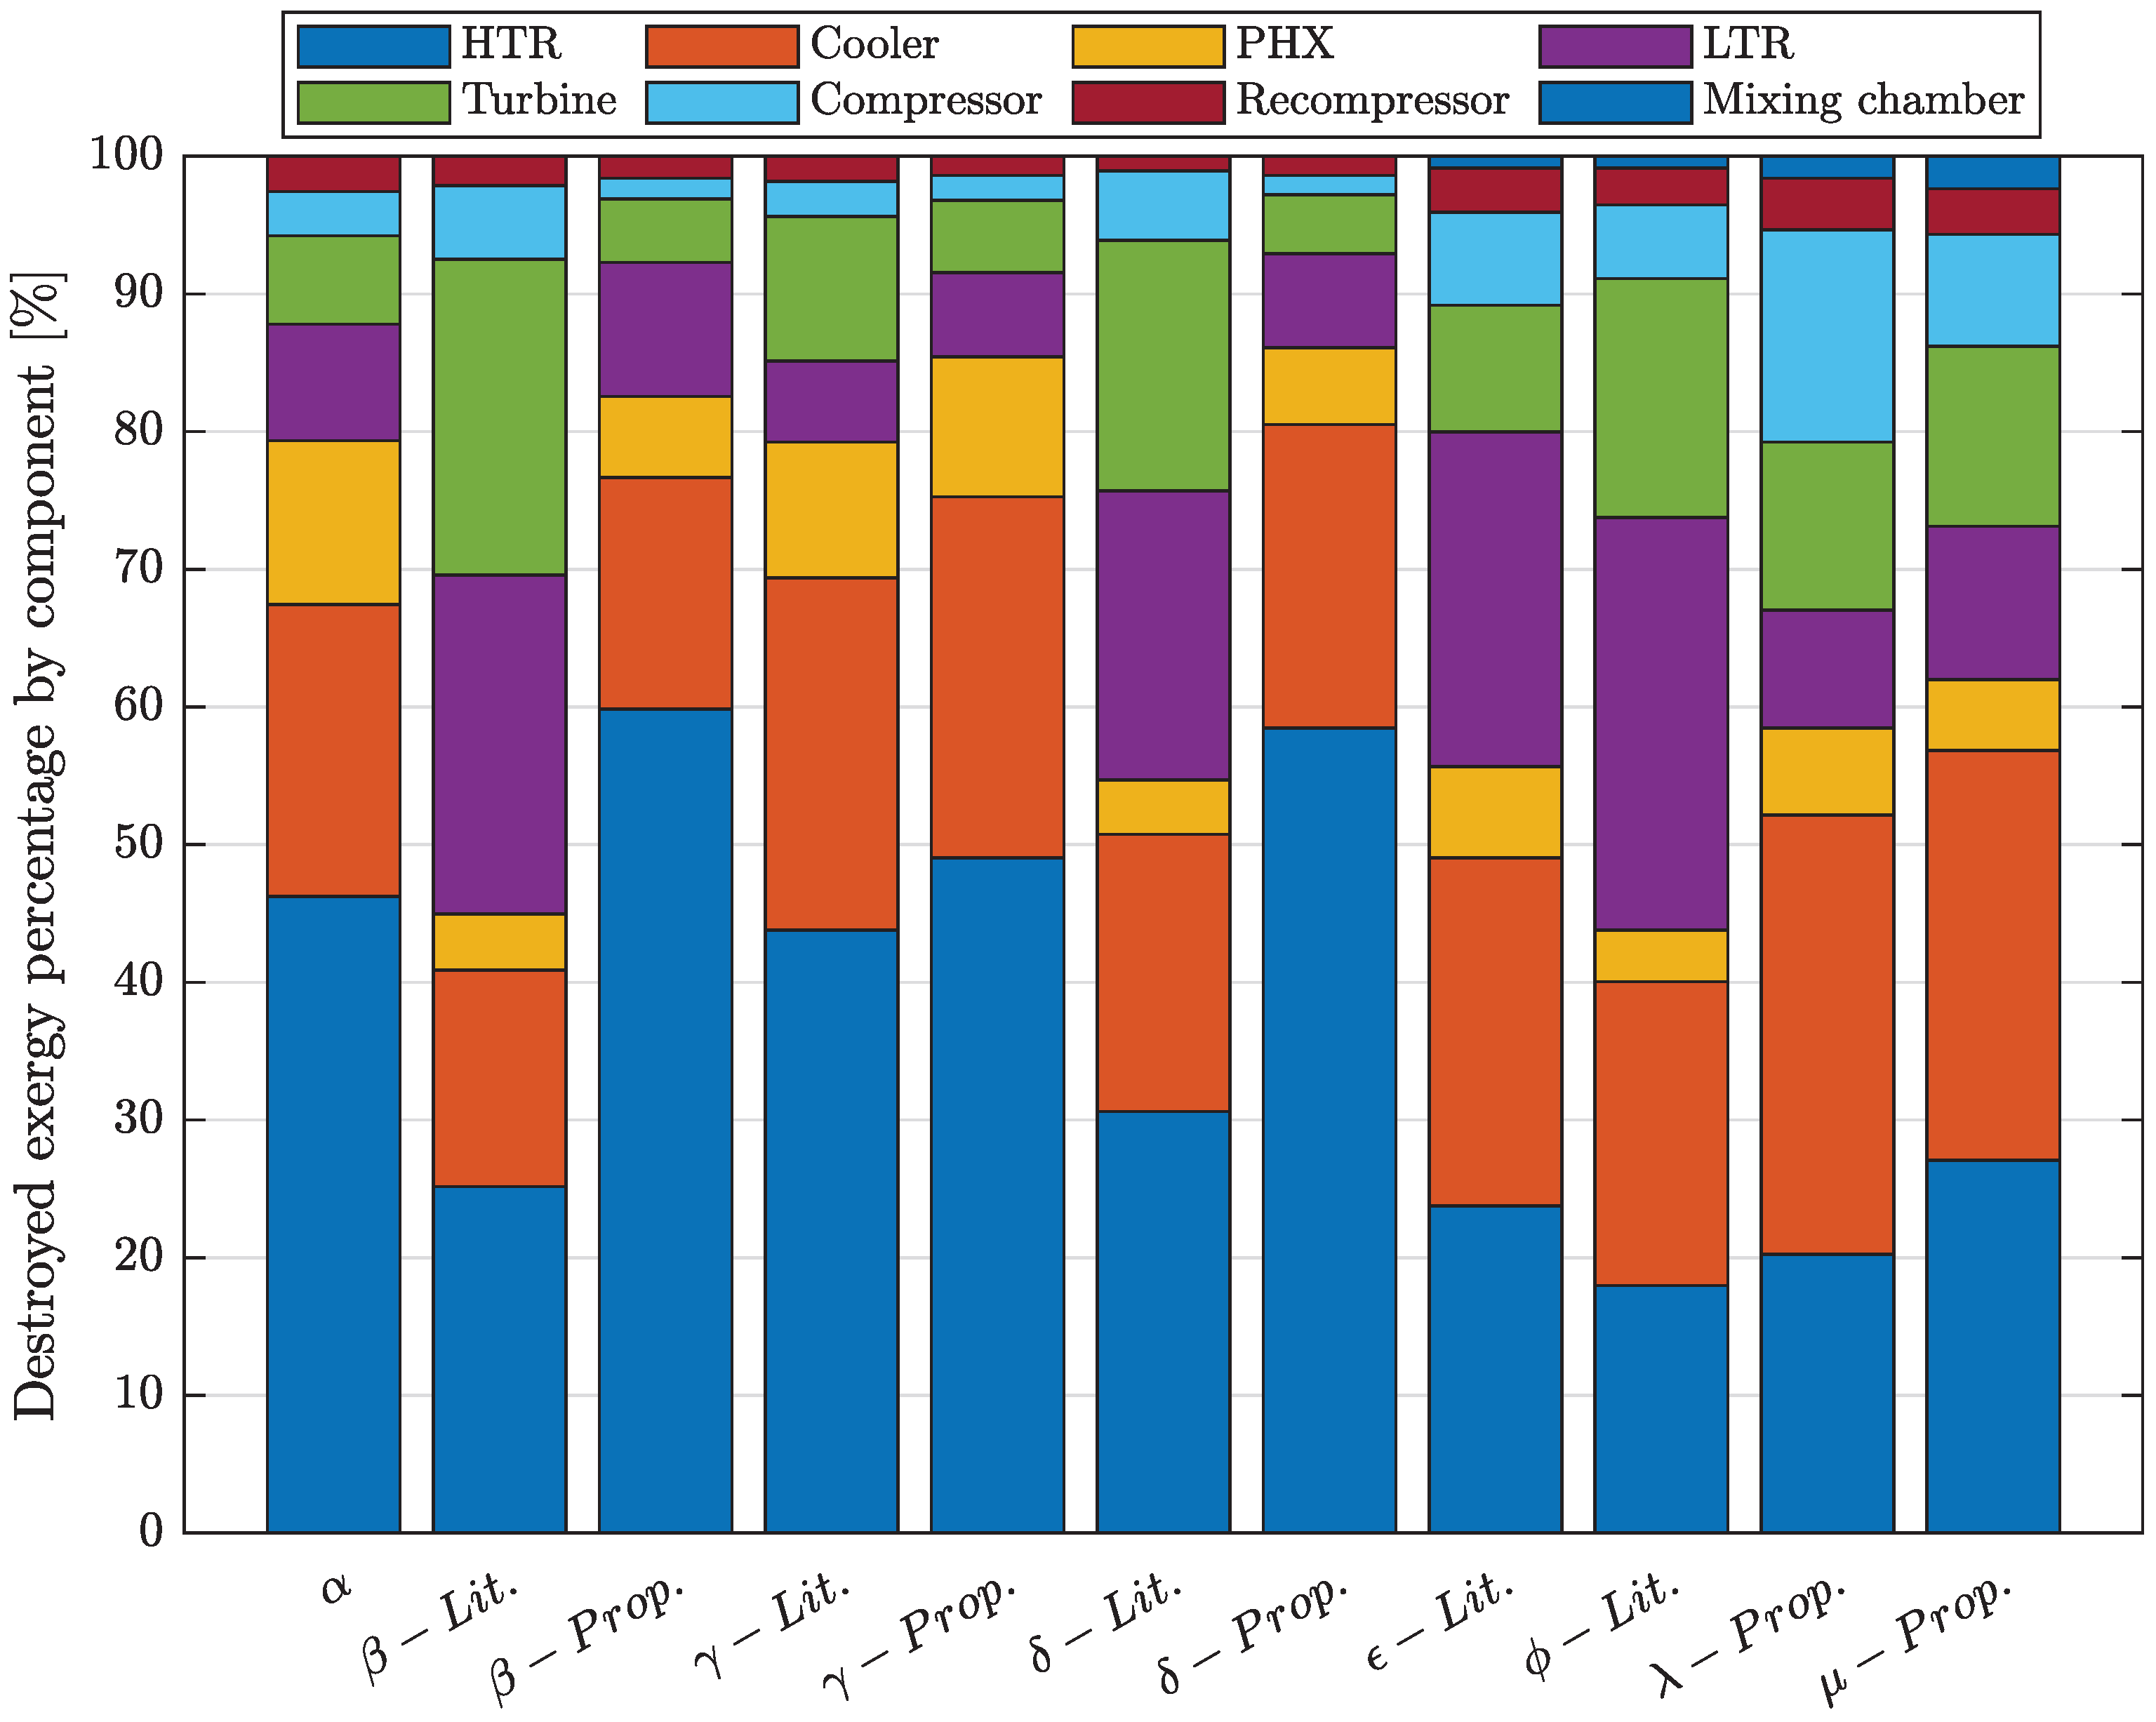
Figure 9 presents the exergy destroyed by each component normalized by the total, providing further insight into the distribution of the exergy destruction. The HTR is the component where most exergy is destroyed under nominal operation. This holds for most scenarios, except for the turbine at points
and
and the cooler at points
and
. The mixing chamber contributes noticeably percentage-wise to the proposed cycle; however, this is due to the lower total exergy destruction and not because the mixing chamber is an important source of irreversibility.


