Abstract
The launch of the national carbon emissions trading (CET) market has resulted in a closer relationship between China’s CET market and its electricity market, making it easy for risks to transfer between markets. This paper utilizes data from China’s CET market and electric power companies between 2017 and 2023 to construct the spillover index model of Diebold and Yilmaz, the frequency-domain spillover approach developed by Barun’ik and Křehl’ik, and a minimum spanning tree model. The comparison is made before and after the launch of the national CET market. Subsequently, this paper examines the market spillover effects, as well as the static and dynamic properties of network structures, considering both the time domain and frequency-domain perspectives. The research findings suggest the following: (1) There is a strong risk spillover effect between China’s CET market and the stock prices of electric power companies; (2) There is asymmetry in the paired spillover effects between carbon trading pilot markets and the national CET market, and differences exist in the impact of risk spillovers from power companies between the two; (3) The results of the MST model indicate that the risk contagion efficiency is higher in the regional CET pilot stage compared to the national CET market launch stage, with significant changes occurring in key nodes before and after the launch of the national CET market; (4) Both the dynamic spillover index and the standardized tree length results demonstrate that crisis events can worsen the risk contagion between markets. Besides offering a theoretical foundation and empirical evidence for the development of China’s CET and electricity markets, the findings of this paper can provide recommendations for financial market participants as well.
1. Introduction
The 21st century has seen an increase in extreme weather events and natural disasters due to the significant rise in greenhouse gas emissions. In order to reduce carbon emissions, countries around the world are taking steps to reduce the emissions of greenhouse gases such as carbon dioxide [1]. Numerous countries have signed international agreements such as the United Nations Framework Convention on Climate Change (UNFCCC), the Kyoto Protocol, and the Paris Agreement. Carbon emission trading is a crucial market-based mechanism for reducing carbon emissions [2]. The European carbon emissions trading (EU CET) market has emerged as the world’s largest and most active market for trading carbon emissions, and it has been implemented in four stages. Currently, the EU CET is in the fourth stage of stable operation [3]. Consequently, numerous scholars choose the EU CET as their research focus to analyze the interaction between the carbon market and other markets at various stages of development [4,5]. In contrast, China’s carbon market is relatively young, still in its initial stage of development, and its construction is not yet mature. As a result, significant differences exist between the Chinese and EU carbon markets, resulting in limited research on China’s carbon market. However, China, as the world’s largest consumer of energy and greenhouse gas emitter, recorded carbon dioxide emissions of 10.524 billion tons in 2021, accounting for 45 percent of the global total. Meanwhile, driven by China’s large industries, China’s energy demand has increased rapidly in recent years. Faced with the dual pressure of meeting international carbon emission reduction goals and achieving sustainable development of the domestic economy and environment, China has actively developed a carbon emission trading market. China also declared its carbon peaking and carbon neutrality goals at the 75th United Nations General Assembly in 2020, with the aim of reaching a carbon peak by 2030 and achieving carbon neutrality by 2060. The development of the CET market in China consists of two stages, with the regional CET pilot stage being the first stage. Starting from 2013, China has successfully implemented carbon trading pilots in eight provinces and cities, namely Shenzhen, Shanghai, Beijing, Guangdong, Tianjin, Hubei, Chongqing, and Fujian. In 2017, the development of the national CET market was formally launched. Furthermore, 16 July 2021 marked a significant turning point for the power sector as the national CET market was officially launched. China’s carbon emission trading market has experienced significant success in recent years. Some scholars believe it has become the world’s second-largest carbon trading market, surpassed only by the European Union’s carbon trading market [6], and plays an important role in the international energy trading market. China’s carbon market has developed and matured over time with the strong support of various policies. Thus, studying China’s carbon market at different stages of its development is of great practical significance.
Electric power companies, especially those involved in thermal power production, have consistently been major contributors to China’s carbon emissions [7]. In 2021, the national thermal power generation capacity reached 5770.27 billion kWh, accounting for over 71% of the total power generation capacity. The electric power sector accounted for approximately 41% of the total carbon dioxide emissions. Meanwhile, China’s power sector has shown significant potential for emission reduction. Between 2006 and 2021, the domestic power sector reduced carbon dioxide emissions by 21.51 billion tons. Promoting decarbonization growth in the power sector is a crucial step towards mitigating climate change and achieving the goals of carbon peaking and carbon neutrality. Furthermore, the power sector is the country’s primary energy provider. The demand for electricity in China will continue to increase alongside the country’s ongoing economic expansion, leading to a higher share of electricity in total energy consumption. Consequently, electric power companies have emerged as the primary targets for emission control in the CET market. China has included the electric power industry, along with over 20 other industries such as steel and cement, as a key emission unit for performance management in the pilot market. In 2017, the “Construction Plan for the National Carbon Emission Trading Market (Power Generation Industry)” was issued, clearly identifying the power generation industry as the first sector to be included in the national CET market. It included over 1700 power companies with emissions exceeding 3 billion tons.
There is a close interaction between the CET market and the electric power market. On one hand, thermal power companies participate in both the electric power market and the CET market, and their decisions regarding electricity generation and investment behavior are influenced by carbon emission limitations. Conversely, electricity and energy prices are the primary factors influencing carbon price fluctuations. Thermal power companies internalize the “negative externalities” through the purchase of carbon emission rights. Therefore, carbon price fluctuations impact power companies’ stock prices by influencing power generation costs and cash flow fluctuations. Fluctuations in the electricity market impact the carbon price, resulting in a mutually beneficial relationship between the CET market price and the stock price of electric power companies [8]. The Linkage Effect Theory states that if there is a linkage mechanism between markets, changing one market parameter will cause changes in one or more other relevant market parameters, creating an interactive linkage between markets [9]. Given the mutual penetration and integration of the CET market and the electricity market, analyzing the interactions between the CET market and the stock market of electric power companies at different stages in China is of utmost importance.
Recent academic research has focused on the relationship between the CET market and the electricity market, with insightful findings. However, most of the relevant research has primarily focused on the cost of electricity or the performance of all electric power companies [10,11,12,13,14]. But researchers have found that the impact of carbon prices varies across different businesses [12]. Some literature has explored the relationship between different power companies and the CET market at the enterprise level, considering that variations among power companies prevent the unified price index from reflecting the unique characteristics of companies and the real market situation [7,8]. However, these articles have some limitations. For example, they rely solely on a single spillover index model, which fails to accurately capture the network structure characteristics and significant risk transmission nodes of carbon power systems. Moreover, current research on the CET market in China predominantly focuses on a specific stage of market development, particularly regional CET markets. However, as a policy-driven market, the CET market is significantly influenced by institutional policies and regulations [15]. China’s CET market has experienced several policy changes during the regional CET pilot stage and the national CET market launch stage, resulting in significant differences in the market structure and mechanism compared to carbon trading pilots. Therefore, it is crucial to integrate it into the research framework. This paper supplements existing literature by focusing on three perspectives: segmentation of research objects into several listed thermal power generation enterprises, a comparative study of the development stages of different carbon markets in China, and the comprehensive application of the spillover index model and minimum spanning tree model.
Considering the aforementioned variables, the research raises key questions. What is the extent and transmission path of risk contagion between China’s CET market and thermal power companies, as well as the structural characteristics of the carbon power system network? What are the differences in performance among the various power companies in the system? How does the relationship between carbon prices and the stock prices of power companies evolve as China’s national CET market matures? Therefore, this paper examines the spillover effects of volatility and the network structure characteristics between China’s CET market and the stock prices of power companies. Based on the DY and BK spillover index models and the MST model, this paper focuses on the regional CET pilot stage from 2017 to 2021 and the ongoing national CET market launch stage from 2021 to the present.
This paper contributes to the existing literature from three perspectives. Firstly, the paper examines thermal power generation companies among listed power companies in China. It selects an adequate number of corporate samples to specifically study the correlation between carbon prices and the stock prices of 20 A-share listed thermal power companies. Secondly, the paper utilizes DY and BK spillover index models and connectivity methods to examine the time–frequency domain and dynamic volatility spillover relationships among different indicators. Additionally, the minimum spanning tree (MST) model is employed to analyze the structural characteristics of the system network, as well as the central characteristics of the CET market and various power companies. Finally, the paper compares and analyzes the differences in the interaction between the regional CET pilot stage in China and the operational stage of the national CET market, taking a comparative perspective before and after the launch of the national CET market.
The remainder of the paper is organized as follows. Section 2 is a literature review. Section 3 introduces the spillover index model and the minimum spanning tree model. Section 4 describes the basic characteristics of data selection and indicators. Section 5 is the empirical analysis results of this paper. Section 6 discusses conclusions and recommendations based on these results.
2. Literature Review
In recent years, there has been a gradual enrichment of articles on the interaction between CET markets and electricity markets. Among them, some scholars focus on the electricity price index. For example, Ref. [16] employed bivariate empirical mode decomposition (BEMD), linear and nonlinear Granger causality tests to investigate the dynamic multiscale interactions between CET and electricity markets in Europe. The study covered phases I (2005–2007), II (2008–2012), and ongoing III (2013–2016) and found a significant but asymmetric causal relationship between the markets, and the nonlinear interaction increased in significance from insignificance to significance during the three phases. Ref. [17] employed the bidimensional empirical mode decomposition-based conditional value at risk approach to examine the spillover effects between the CET market and electricity prices. The study discovered that the risks of high-frequency modes are higher than those of intermediate and low-frequency modes. The CET market exhibits a positive risk spillover on the electricity market, while the electricity market exhibits a negative risk spillover on the CET market. Ref. [18] examined the role of peak–valley prices and idiosyncratic factors in the information spillover mechanism between electricity prices and CET markets in Europe. The study employed a systematic approach. The results indicate that electricity demand plays a crucial role in the idiosyncratic information spillover channel, particularly in the risk spillover channel. Ref. [19] examined the return and volatility spillover effects between the European CET market and six electricity market electricity price indices using the vector autoregressive (VAR), Baba–Engle–Kraft–Kroner (BEKK), and generalized autoregressive conditional heteroskedasticity (GARCH) model. The findings indicate that the impact between the CET market and the electricity market primarily involves the transmission of price fluctuations rather than the direct impact of returns. Additionally, some researchers have examined the price index of electric power companies. Ref. [20] employed a multifactor market model specification and a panel quantile regression approach to investigate the impact of EU carbon prices on stock returns in carbon-intensive industries, including the power sector. The study demonstrated a long-term positive correlation between carbon prices and the stock price index of the power sector. Ref. [11] employed a multifactor market model to examine the impact and extent of carbon trading pilot price indices in Shanghai, Guangdong, Beijing, Shenzhen, and Hubei on the price indices of 10 listed Chinese electric power companies. The results indicated that carbon prices have a significant negative impact on the stock value of the entire sample of power companies, and the impact of different carbon trading pilots varies. Ref. [10] employed a multifactor market model and a panel data econometric technique to investigate the long-run relationship between EU CET market prices and the stock price index of European power companies. The study found that EU carbon prices have a statistically significant and positive long-run impact on the electric power markets of six European countries. The literature on the correlation between the CET market and the electricity market has garnered increasing attention, and some relatively mature research results have been obtained.
However, the aforementioned literature primarily employs the unified price index as a proxy variable for the overall electric power market. Only a limited number of scholars have investigated the interaction between the CET market and individual electric power companies from an enterprise perspective. Ref. [8] utilized the newly developed connectivity method proposed by Diebold and Yilmaz to examine the static, dynamic, and asymmetric information spillover effects between the returns of EU carbon prices and the stock returns of 18 leading European electricity companies from 2005 to 2018. The research findings reveal a strong information interdependence between carbon price returns and electricity stock returns. Moreover, large electric power companies tend to serve as prominent information transmitters and exert a more substantial influence on carbon power systems compared to small companies. Ref. [7] employed a connectedness network and a rolling window approach to systematically investigate the static and dynamic spillover effects between China’s local carbon emissions trading pilot market and 10 listed electric power companies from 2014 to 2019. The study demonstrates that there is typically only a weak spillover effect between China’s CET market and electric power companies, and the interaction between them may be linked to the power generation capacity or energy mix of the companies. Based on the above literature, research on the relationship between CET markets and power companies has predominantly relied on a single sample interval. Specifically, studies on China’s CET market have mainly focused on the carbon trading pilot markets, and there is a lack of literature differentiating between the regional CET pilot stage and the national CET market launch stage, which presents notable research opportunities.
Furthermore, certain scholars have explored the relationship between different markets by employing both the minimum spanning tree model and the spillover index model. For instance, Ref. [21] constructed a static dependency network and dynamic spillover change graph to examine the spillover effects between markets. They analyzed the minimum spanning tree and central indicators to investigate the dependency structure between metal and mining companies in the United States and Europe. Additionally, they conducted a subsample analysis during the European sovereign debt crisis and the epidemic lockdown period to explore the changes in companies’ risk output efficiency under varying market conditions. Similarly, Ref. [22] utilized the minimum spanning tree (MST) approach and the connectedness method to examine the risk transmission among energy futures in China. Based on the aforementioned, it can be concluded that the spillover index model is capable of reflecting the intensity and path of risk spillovers between markets. On the other hand, the minimum spanning tree model can capture the simplest and most fundamental relationship between variables through information filtering. Nevertheless, to date, no scholars have employed both methods to investigate the correlation between the CET market and the electricity market.
In response to the aforementioned gaps in existing research, three key areas are identified. Firstly, while existing research on China’s CET market and electricity market has yielded significant findings, the majority of studies focus on electricity prices or use a unified electricity company price index as the research object. In contrast, limited research explores the relationship between carbon prices and the stock prices of different electricity companies. Moreover, the electric power sector is one of the most significant sectors within the CET market, with electric power companies, particularly those engaged in thermal power generation, making up the bulk of the market. Consequently, it is crucial to investigate the interaction between the CET market and thermal power companies. Secondly, existing research often employs econometric models or focuses solely on a single spillover index model to analyze the correlation between markets, overlooking the examination of the network structure and key risk transmission nodes within carbon power systems. However, investor behavior in the market can be influenced by factors such as information dissemination and investor sentiment. Therefore, constructing networks using correlation coefficients to intuitively depict the relationships between individuals and the overall structure and nature of the network holds significant importance. Lastly, there is limited research on comparing the regional CET pilot stage with the national CET market launch stage, with most studies on China’s CET market primarily centered around carbon trading pilot markets. Given the series of policy adjustments before and after the launch of the national CET market, resulting in differences in system design and pilot markets across various aspects such as coverage, access thresholds, and quota allocation, it is crucial to conduct research that encompasses different stages, considering the dynamic evolution of the interaction between the CET market and the electricity market.
3. Method and Model
3.1. Model Selection Basis
First of all, this paper utilizes the DY spillover index model, which is based on the prediction error variance decomposition method proposed by Diebold and Yilmaz. The empirical results are measured using static spillover index tables and dynamic spillover index graphs. The aim is to analyze the spillover effect between different markets [23,24,25]. The DY spillover index model has several advantages compared to traditional models. Firstly, it eliminates the dependence of results on the order of delay. Secondly, it can reflect the intensity and path of information spillovers among multidimensional variables, identify the net disseminators of spillovers, and determine the mechanism of various assets in the process of market information transmission. Additionally, by incorporating rolling window technology, the model can generate a dynamic spillover index to track the changing dynamics of market spillover effects. Therefore, the DY spillover index model is employed in this paper to assess the risk spillover effect among variables in the carbon power system and elucidate the extent to which price fluctuations in one market affect other markets.
Secondly, during the investment process, market participants frequently focus on the cyclical factors in their investment portfolios. They assess the value of assets using expected utility, which results in heterogeneous impacts on the market’s cyclical factors. This, in turn, leads to short-term and long-term systemic spillover effects. Therefore, utilizing the DY spillover index model as a foundation, the study employs the BK spillover index model to examine the spillover effects between markets in various frequency domains. This allows for the identification of differences in the extent of short-term and long-term spillovers [26]. Specifically, short-term spillovers refer to situations where market information undergoes rapid processing, resulting in short-term impacts from spillover shocks between markets. On the other hand, long-term spillovers indicate that related shocks may arise from fundamental changes in investor expectations, thereby influencing systemic spillover effects over an extended timeframe.
Lastly, building upon the spillover index model, this paper employs the minimum spanning tree (MST) method to construct the central network, capturing the core-periphery structure of the system. MST refers to the weighted cost and minimum spanning tree among all edges in the connected graph network [27], simplifying the network’s complexity to the fullest extent [28]. By applying specific filtering rules, the MST method can reveal the most basic core relationships among variables in the system, as well as the overall structure and characteristics of the network [29]. It identifies a group of variables that play a crucial connecting role in the system and unveils potential risk transmission paths. Typically, financial risk transmission occurs from the affected market to the most closely associated market, signifying the shortest and swiftest transmission path for risk within the network [30]. Therefore, the MST method finds extensive application in the network analysis of financial market data [31,32,33].
3.2. DY Spillover Index Model
Taking the volatility as an example, the construction of the DY spillover index model can be divided into the following three steps:
The first step is to build a VAR model. The following p-order VAR model is constructed for the volatility of n markets:
where is an N-dimensional column vector of market volatility, is an -dimensional coefficient matrix, and is an N-dimensional random perturbation column vector, which satisfies the basic assumption that there is no sequence correlation, zero mean, and independent identically distributed. ∑ is an autoregressive matrix, and time . The moving average form of is further obtained as follows:
where Equation (2) is the moving average form of , and is the identity matrix. When , and when , it follows the recursive form of Equation (3).
The second step is to use the generalized variance decomposition method to deal with the impact of the predicted residual terms. In order to make the variance decomposition independent of variable ordering, consider the forward H-step prediction error variance decomposition to obtain the prediction error variance decomposition matrix, as follows:
where Equation (4) indicates that the prediction error variance of the i-th market yield is derived from the proportion of the j-th market yield, ∑ is the covariance matrix of the error vector , and is the standard error sequence of . is an N-dimensional selection vector, with the i-th element being 1 and the remaining elements being 0. At this point, for variable , the sum of the contributions of other variables to its prediction error variance is not equal to 1, so it is standardized as follows:
Therefore, we can obtain the paired spillover relationship between market and market under the H-step size.
The third step is to calculate the total spillover index, directional spillover index, and net spillover index.
(i) The total spillover index represents the contribution of mutual spillovers between N variables to the total prediction error variance. The nondiagonal elements of the prediction error variance decomposition matrix are summed and averaged as follows:
(ii) The directional spillover index measures the directional spillover of the market’s impact on all other variables, and measures the directional spillover of the market’s impact on all other variables, as follows:
(iii) The net spillover index, which measures the net spillover size of market to all other markets, is as follows:
3.3. BK Spillover Index Model
The specific steps for building a BK spillover index model can be divided into four steps:
The first step is to construct spectral density. First, construct a frequency-response function as follows:
Based on Equation (12), the spectral density of at frequency is constructed as follows:
where is obtained by the Fourier transform of . is a parameter that describes the specific distribution of the variance of on frequency i. It is a key parameter for understanding frequency dynamics.
The second step is to define a generalized causal spectrum. The generalized causal spectrum can be defined as:
where represents a portion of the spectrum of variable caused by the impact of variable at a certain frequency . can be understood as a causal relationship within the frequency.
The third step is to build a weight function. The frequency share of the variance of variable is introduced as a weight function:
where represents the power of variable j at a given frequency.
In the fourth step, the generalized variance decomposition is used to construct the frequency-domain overflow index for different frequency bands. The generalized variance decomposition over the entire frequency band is defined as:
The generalized variance decomposition over frequency band , is defined as:
The generalized variance decomposition after standardization is defined as:
The frequency-domain overflow effect on frequency band d is:
3.4. Network Analysis Method
3.4.1. Minimum Spanning Tree Model
Currently, articles that explore securities market networks primarily rely on Pearson linear correlation coefficients or enhancements thereof. Nevertheless, Pearson correlation coefficients are solely suitable for variables with a normal or elliptical distribution, and they solely capture linear correlation, making them inadequate for assessing nonlinear correlation. In reality, the distribution of financial asset returns is frequently nonlinear, time-varying, and uncertain. The copula function surpasses the constraints of the conventional Pearson linear correlation coefficient and provides a more accurate depiction of the dependency relationship among different variables. Hence, this article utilizes the copula correlation coefficient to assess the dependency structure between the CET market and various power companies.
The network analysis method provides an intuitive description of the relationships among individuals and the overall structure and properties of the network. A network consists of vertices and edges. In this case, the CET markets and power companies are treated as vertices, while the edges represent the interrelationships between them. In graph theory, trees refer to connected undirected graphs that do not contain loops. The minimum spanning tree is a tree with the lowest sum of weights among the connected edges in a graph. Constructing a financial market network using the MST method involves the following steps:
The first step is to calculate the correlation coefficient between nodes and obtain a correlation coefficient matrix C of order (N represents the number of nodes).
The second step is to perform metric distance processing on the correlation coefficient to make it conform to the three axioms of European distance: if and only if . The European distance, also known as the “Euclidean distance”, represents the true distance between two points in M-dimensional space, which connects the various markets in the MST network by converting the correlation matrix into a distance matrix [34], and is calculated as follows:
Euclidean distance, also known as the “Euclidean metric”, represents the true distance between two points in M-dimensional space, which connects the various markets in the MST network by converting the correlation matrix into a distance matrix, and its calculation formula is as follows
where is the relative distance between node i and node j, and the distance matrix D is obtained. Using the distance matrix D as the adjacency matrix, a distance network graph is generated, and an initial network graph is constructed.
The third step is to generate a minimum spanning tree using the Kruskal algorithm. The main purpose of the minimum spanning tree is to filter redundant links in the network and extract important link information in the financial market while maintaining the simplest structure of the financial market network [34]. Considering the time complexity of the algorithm, this paper chooses the Kruskal algorithm [35] to construct MST, which has the advantage that it only needs to sort the distance once to construct MST. At present, the Kruskal algorithm is widely used in related research [36,37,38], and its algorithm is as follows:
- (i)
- We sort the elements of the distance matrix D in descending order and decompose them into a sequence d;
- (ii)
- Based on the ordering of the elements of the sequence d, we select the two nodes with the smallest distance, and use line segments to connect the two nodes (not forming a ring);
- (iii)
- Repeat Step 2 until the number of edges selected is 1 less than the number of nodes, and a minimal connected subgraph, the minimum spanning tree (MST), is obtained.
In addition, in order to better study the structure of MST, we have also used standardized tree lengths to measure the degree of market integration. It is calculated as the reciprocal of the sum of all edge distances in the network:
where represents the distance between node i and node j.
3.4.2. Network Topology
For the constructed association network, three topological indicators, namely, degree centrality, closeness centrality, and betweenness centrality, will be used to determine node importance. The construction method of the three centrality indicators is as follows:
- (i)
- Degree centrality. Degree centrality is the most direct metric for characterizing node centrality in network analysis. The greater the node degree of a node, the higher the degree centrality of the node, and the more important the node is in the network. The specific expression for degree centrality is as follows:where represents the degree centrality of node i, represents the degree of node i, and represents the maximum possible degree.
- (ii)
- Closeness centrality. Closeness centrality reflects the proximity between a node and other nodes. A smaller value of this indicator means that the node does not need to rely on others to disseminate information. The specific expression for tightness centrality is as follows:where is the shortest path from node i to node j in the MST.
- (iii)
- Betweenness centrality. The betweenness centrality of node i refers to the normalized medium of node i, which refers to the proportion of the shortest paths between node j and node k that pass through node i to all the shortest paths between node j and node k. The higher the betweenness centrality, the more able it is to control other nodes, that is, nodes with a high betweenness centrality must be important nodes, playing a “bridge” role in the entire network diagram. The specific expression for the centrality of the intermediate number is as follows:where is the shortest path from j to k through i, and is the shortest path from j to k.
4. Data
4.1. Index Selection
The study period for this paper spans from 3 January 2017 to 13 January 2023 and is divided into two distinct stages: the regional CET pilot stage (3 January 2017 to 16 July 2021) and the national CET market launch stage (16 July 2021 to 13 January 2023). A total of 1463 sample observations were collected for analysis. Our empirical research relies on daily price data. Daily data are preferred over weekly or monthly data as they capture short-term fluctuations that may be missed in longer intervals. The dataset was sourced from Wind Information Co., Ltd., (WIND) (Wind Information Co., Ltd. is a leading provider of financial information services in Shanghai, China, https://www.wind.com.cn, accessed on 18 April 2023). The yield series was derived by calculating the logarithmic yield based on the original data. Subsequently, the GARCH model was employed to calculate the volatility series.
Regarding China’s CET market, the country has established eight carbon trading pilots and one national CET market. Each market operates at different times, with varying levels of market activity and information liquidity. For this study, we have selected five representative CET markets: Hubei, Guangdong, Shenzhen, Shanghai, and Beijing. This decision is based on the following reasons. Firstly, an analysis of the cumulative carbon quota trading volume from 2015 to 2022 reveals that Chongqing and Tianjin have lower total carbon quota trading volumes compared to other carbon trading pilots, particularly before the national CET market was launched. Furthermore, these two markets have significantly fewer effective trading days, often experiencing zero trading on most days. This indicates limited market liquidity and insufficient representativeness. Secondly, an examination of the daily closing prices of carbon emission rights from 2017 to the present highlights notable differences in price volatility among the carbon trading pilots. These differences primarily arise from variations in trading activity, mechanisms, and related policies within each CET market. Notably, Hubei, Guangdong, Shenzhen, Shanghai, and Beijing demonstrate relatively higher daily closing prices. Additionally, due to the late establishment of the Fujian CET market, data consistency with other CET markets cannot be maintained, and therefore, it is not considered in our analysis. Consequently, we construct a carbon price weighted index (CARBON1) using the daily trading volume of carbon trading pilots in Hubei, Guangdong, Shenzhen, Shanghai, and Beijing as weights. Furthermore, after the launch of the national CET market, the daily trading prices of national emissions permits are utilized as the proxy variable for the national CET market (CARBON2).
For electric power companies, considering that thermal power generation currently accounts for the largest proportion of total power generation in China, we have targeted the research object to thermal power generation companies. Based on their ranking for 2021 power generation among China’s 27 listed thermal power generation companies, we chose the 20 with the largest power generation capacity, including Guodian Electric Power Development Co., Ltd. (GDDL), Huaneng International Power Co., Ltd. (HNGJ), Datang International Power Generation Co., Ltd. (DTFD), Huadian International Power Co., Ltd. (HDGJ), Zhejiang Zheneng Electric Power Co., Ltd. (ZNDL), Guangdong Electric Power Development Co., Ltd.. (YDL), Beijing Jingneng Electric Power Co., Ltd. (JNDL), Jiangsu Guoxin Co., Ltd. (JSGX), Shanghai Electric Power Co., Ltd. (SHDL), Inner Mongolia Mengdian Huanneng Thermoelectric Co., Ltd. (NMHD), Shenzhen Energy Group Co., Ltd. (SZNY), Sheneng Co., Ltd. (SNGF), Jinneng Holding Shanxi Electric Power Co., Ltd. (JKDL), Jointo Energy Investment Co., Ltd.Hebei (JTNY), An Hui Wenergy Co., Ltd. (WNDL), National Energy Group Changyuan Power Co., Ltd. (CYDL), Henan Yuneng Holdings Co., Ltd. (YNKG), Guangzhou Hengyun Enterprises Holding Ltd. (SHY), Datang Huayin Electric Power Co., Ltd. (HYDL), Guangzhou Development Group Co., Ltd. (GZFZ). The basic information of the enterprise is shown in Table 1. This paper selects the daily closing price of each company’s stock as the proxy variable for electric power companies.

Table 1.
The basic information of listed electric power enterprises.
4.2. Exponential Trend
Figure A1 illustrates the changes in the weighted value index of China’s carbon trading pilots market, the national CET market price index, and the stock price index of electric power companies. Over time, all carbon markets and electricity company prices exhibit fluctuations. Comparing them to the national carbon price, which only experiences fluctuations during the early stage of the national CET market launch and remains relatively stable afterward, the weighted prices of regional CET markets display significant volatility. This indicates greater uncertainty in the regional CET market. Moreover, in July 2021, the price of regional CET markets also exhibited substantial volatility, maintaining a high price level after the increase in volatility. This can be attributed to the price stability at 40–60 yuan since the national CET market’s launch, which is twice the average price of the previous regional CET market. The participants in regional CET market trading activities are influenced by these significant price differences, leading to higher expectations for regional carbon prices. Consequently, the launch of the national CET market triggered a notable increase in regional carbon prices. Although the local and national CET markets are decoupled in terms of control objects, the correlation of carbon price signals is inevitable. Additionally, the majority of power company share prices demonstrate a significant upward trend, peaking in 2021. This can be attributed to the gradual mitigation of the impact of the COVID-19 pandemic in 2021 and the recovery of industrial and residential electricity demand. Furthermore, in July of the same year, the online trading of China’s CET market was launched, with the electric power industry being the first sector included in the national CET market. This further stimulated the stock prices of electric power companies.
4.3. Descriptive Statistics
Table A1 presents the descriptive statistical results of volatility for various indicators during the regional CET pilot stage and the national CET market launch stage. Prior to the national CET market launch, the average volatility of the regional CET market was significantly higher compared to that of electric power companies. This indicates that power company prices were relatively stable, with the smallest fluctuations observed in the stock prices of GDDL. Furthermore, the standard deviation of volatility in the regional CET market was notably the largest, suggesting substantial changes in volatility and higher market risk. After the national CET market was launched, the average volatility and standard deviation of the regional CET market remained significantly higher than other indicators. Conversely, the average volatility of the national CET market was the smallest, further supporting the earlier conclusion that local carbon price volatility exceeded that of the national CET market. Moreover, in terms of normality testing, the Jarque-Bera statistic was significant at the 1% level for all market return series, indicating the rejection of the original hypothesis of “following a normal distribution”. Regarding stationarity testing, the ADF statistics indicated that all sequences rejected the original assumption of “unit roots existence” at a 1% significance level, confirming that all market yield sequences were stationary time series. Finally, using the AIC criterion, the optimal lag order of the VAR model for volatility spillover effects was determined to be the first order, as it minimized the amount of information.
5. Empirical Analysis
5.1. Static Spillover Connectedness
By constructing a total static spillover index table, this paper analyzes the static volatility spillover effects between the national regional CET market and the national CET market and power companies before and after the launch of the national CET market, including paired spillover index, total spillover index, spillover index, spillover index, and net spillover index. Among them, the diagonal element of the matrix represents the proportion of risk borne by each market itself, and the nondiagonal element of the matrix represents the paired spillover index of the listed market to the corresponding market. The sum of nondiagonal rows is the spillover index, representing the sum of spillover effects of other markets on the row’s market. The sum of the nondiagonal columns is the spillover index, representing the sum of the spillover effects of this column of markets on other markets. The net spillover index is the difference between the spillover index and the inflow index of the listed market. Markets with a positive (negative) net spillover index are the net communicators (net recipients) of overall market spillovers. In addition, the total spillover index represents the spillover effect between the overall market. Table A2 presents the results of the static spillover analysis between the regional CET market and the stock market of electric power companies before the launch of the national CET market. On the other hand, Table A3 reports the spillover results between the regional CET market, the national CET market, and the power companies after the launch of the national CET market.
According to the total spillover index, significant system-wide spillover effects are observed in both stages, with the total spillover index surpassing 50%. This suggests that more than 50% of the changes in system variables can be attributed to changes in other variables within the system. These results align with the spillover findings between the EU carbon market and power enterprises, supporting the notion of a close interaction within the carbon power system. Following the launch of the national CET market, the total spillover index increased from 54.95% to 60.35%, indicating that the operation of the national CET market has strengthened the interdependencies within the system.
Regarding the net spillover index, prior to the launch of the national CET market, the regional CET market exhibited a net spillover index of −0.91%, indicating it was a net recipient of risk due to low carbon prices and lenient quota allocation policies. However, after the national CET market was launched, the net spillover index of the regional CET market turned positive at 2.72%, suggesting its role as a risk propagator. This shift may be attributed to the fluctuating upward trend in the weighted price of the regional CET market, which heightened its risk transmission. Additionally, the net spillover index of the national CET market was −21.29%, implying that information spillover from the electricity market to the carbon market cannot be overlooked by investors in the carbon market. This finding is supported by previous research indicating that emissions trading prices have little effect on electricity prices [8]. It implies that the national CET market has not yet exerted a significant impact on power companies, but fluctuations in power company stock prices can provide some reference information for changes in the national carbon price. This is because national carbon price fluctuations mainly occurred during the initial three months of the national CET market’s launch and the performance period. Since 2022, the national CET market has exhibited relatively low liquidity and inactive market characteristics, making it more susceptible to systemic risk compared to the regional CET market. Moreover, the net spillover directions of the eight power companies have significantly changed before and after the launch of the national CET market. Notably, GDDL and CYDL transitioned from risk recipients to risk exporters, while HNGJ, SHDL, JKDL, WNDL, HYDL, and GZFZ experienced inverse changes in spillover directions.
Regarding the paired spillover index results, the spillover effect of the regional CET market on the national CET market was 3.83% after the launch of the national CET market, which exceeded the spillover effect of the national CET market on the regional CET market (1.40%). This difference can be attributed to the use of the trading volume of the five regional CET markets to weight the regional carbon price index in this study. This weighted indicator provides insight into the overall direction of regional carbon prices in China. Consequently, if carbon emission prices rise in the majority of segmented submarkets, the national carbon emission price will also increase. However, the rise in national carbon emission prices may not necessarily translate to each regional submarket, as the carbon emission prices in different regional markets may be significantly influenced by local supply and demand factors. This indicates that risk spillovers between national and regional carbon emission markets exhibit some level of asymmetry. Furthermore, heterogeneity is also observed in the paired spillover effects between power companies and the CET market. Particularly, among the risk spillovers from power companies to the CET market, 13 out of 20 companies exhibit a stronger spillover effect on the national CET market compared to the regional CET market. While spillovers from the CET market to power companies demonstrate that 14 companies are more affected by spillovers from the regional CET market than the national CET market. Moreover, the system spillover effect on the national CET market reaches 30.96%, significantly surpassing that of the regional CET market (11.64%), while the spillover index of the regional CET market is 14.37%, exceeding that of the national CET market (9.67%). These findings further emphasize that the national CET market exhibits weaker risk transmission to the system compared to the regional CET market, and it is more prone to accepting systemic risks.
5.2. Frequency-Domain Spillover and Network Connectedness
To investigate the risk spillover effects between China’s CET market and power companies in different frequency domains, as well as the heterogeneity of influencing factors for risk transmission across various indicators at different stages, the original sequence is decomposed into high-frequency and low-frequency components. The high-frequency band represents a period of 1 to 5 days, the intermediate-frequency band represents 5 to 30 days, and the low-frequency band represents 30 days or more. The optimal delay order for VaR remains as order 1. Additionally, this paper views the sample market as a node in the network and views the spillover relationship between two indicators as the edge of the network in order to identify the characteristics of the risk spillover network in the system. The egress and ingress of nodes are measured using the paired spillover index computed by the DY or BK model. The following figures illustrate the interactive connectivity between variables, providing detailed information about the roles played by different markets in the risk transfer process and the intensity of risk transmission. In the figures, the green node represents the net transmitter of risk, and the red node represents the net receiver of risk. The darker the color of the line between nodes indicates the stronger the risk spillover effect between markets, with yellow indicating weak spillovers, purple indicating moderate spillovers, and blue indicating strong spillovers.
First, the results from Figure 1 and Figure 2 indicate that the long-term spillover effects in the system are stronger than the medium-term and short-term spillover effects at different stages. This suggests that spillover effects in the time domain are primarily driven by long-term dynamics, with spillovers between variables occurring predominantly over the long term. Furthermore, in different frequency domains, the spillover effect between regional CET markets and power companies is found to be weak. These findings align with previous research [7], which also identified a weak bidirectional spillover between the carbon market and the electricity market.
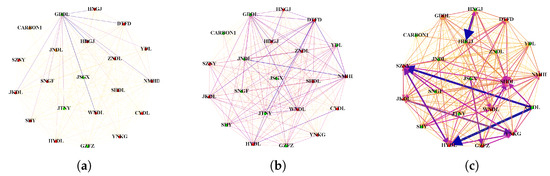
Figure 1.
Network connectedness before the launch of the national carbon market: (a) short term; (b) medium term; (c) long term.
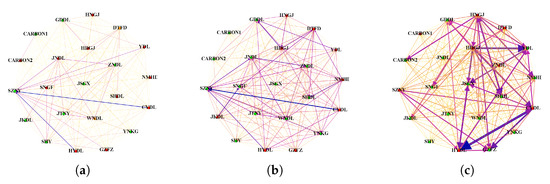
Figure 2.
Network connectedness after the launch of the national carbon market: (a) short term; (b) medium term; (c) long term.
In terms of the connectivity network results before the launch of the national CET market, the regional CET market acts as a net recipient of risk spillover across different frequencies, mainly receiving risk inputs from the system. This indicates that during this stage, the regional CET market has a limited impact on various power companies, while power companies are more likely to transmit risks to the CET market. Following the launch of the national CET market, the net spillover index of the regional CET market is negative in the short and medium term, but becomes positive in the long term, transforming into a net exporter of risk. In the case of the regional CET market, the volatility of prices has a minimal impact on other listed power companies in the short and medium term, but in the long term, carbon prices drive up power generation costs and electricity prices, making the CET market a risk spillover party. Additionally, in the medium and long term, risks are mainly transmitted from the regional CET market to the national CET market, providing further confirmation of previous conclusions.
5.3. Dynamic Spillover Result
5.3.1. Total Spillover Change
Due to the limitations of static spillover indices in capturing temporal variability, the impact of special events on spillover effects may be overlooked. To address this, we employ a rolling time window approach with a length of 100 days and a forward prediction step of 10 to capture the dynamic spillover effect between the CET market and power companies. Given the relatively short operating time of the national CET market, we use local regional CET market indicators as representatives to analyze the dynamic trend of the system spillover index from 3 January 2017 to 13 January 2023.
The results in Figure 3 reveal that the dynamic total spillover index of China’s CET market and power companies fluctuated significantly throughout the sample period, exhibiting prominent time-varying characteristics. The total spillover index consistently maintained a high level, surpassing 60%. Furthermore, it is evident that the occurrence of special events amplified the degree of spillovers between markets. Specifically, the total spillover index experienced a significant increase, peaking at over 80%, during the Sino–US trade war in 2018, the COVID-19 pandemic in 2020, and the Russia–Ukraine war in 2022. These findings demonstrate that the abnormal volatility of financial market will increasing the uncertainty and infectivity of the market, and then the resulting negative sentiment will intensify dynamic risk spillovers within corresponding submarkets. As the effects of the Sino–US trade war and the pandemic gradually diminished in China, the correlation between markets gradually returned to normal levels This further underscores the contagious nature of major emergencies across different financial submarkets.
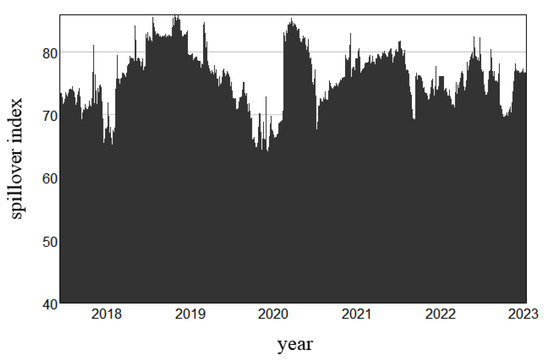
Figure 3.
Total dynamics spillover of carbon pilot market. (Note: The ordinate indicates the total spillover index result of the carbon power system, and the abscissa indicates the year.)
5.3.2. Paired Net Spillover Changes between Carbon Markets
To further examine the dynamic changes in the interaction between the local regional CET market and the national CET market, we implemented a rolling window analysis with a length of 100 days and a forward prediction step of 10. This analysis allowed us to observe the trend of the net spillover index from the local regional CET market to the national CET market from 16 July 2021 to the present. A positive (negative) spillover index indicates that the regional CET market acts as a net exporter (recipient) of risk to the national CET market. The results depicted in the Figure 4 reveal predominantly negative paired net spillovers from the local regional CET market to the national CET market, providing further support for our earlier finding that the local regional CET market poses a greater risk to the national CET market.
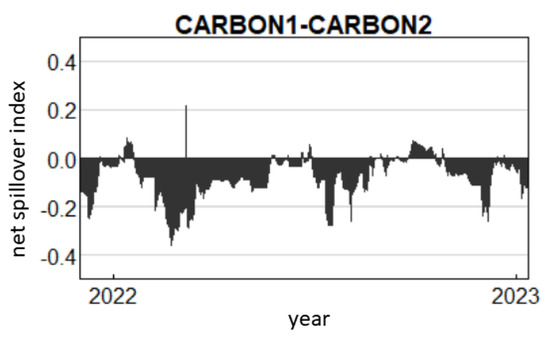
Figure 4.
Paired net spillover of carbon pilot market to national carbon market. (Note: The ordinate indicates the pairwise net spillover index of the local carbon pilot market to the national carbon market, and the abscissa indicates the year.)
5.4. Minimum Spanning Tree Result Analysis
5.4.1. Minimum Spanning Tree
As correlation plays a crucial role in assessing risk contagion among variables, this study employs the minimum spanning tree (MST) model to filter network information, eliminating subjective interference and highlighting the transmission path of price shocks and the fundamental relationships. To construct a correlation coefficient matrix for both the regional CET pilot stage and the national CET market launch stage, the copula function is utilized. Subsequently, an undirected weighted MST network is constructed to emphasize central differences in the network structure across different stages, providing insights into the network’s structure, risk transmission paths, and key markets involved in financial risk transmission.
In undirected networks, the importance of a node is measured by its degree, indicating the degree of connection to other nodes and its centrality within the network. As depicted in the Figure 5, only a small number of nodes exert influence and govern the entire network, while the majority of nodes are grouped around these key nodes and dispersed at the network’s periphery. This characteristic resembles a scale-free network, with the degree distribution following a power-law distribution. A lower number of connections per node implies a more stable structure. Specifically, at different stages, both the local regional CET market and the national CET market reside at the periphery of the spanning tree within the system, indicating a relatively weak risk contagion between the CET market and electric power enterprises, which further supports the earlier findings regarding spillover effects. In the regional CET pilot stage, YDL, SZNY, and JKDL hold the highest node degrees, each scoring 4, signifying their crucial positions in the network. In the national CET market launch stage, NMHD, SNGF, GZFZ, HNGJ, JNDL, and YNKG possess the highest node degrees, with a degree of 3. It is worth noting that while the system’s risk transmission paths undergo significant changes at various points, the CET market consistently maintains a high level of independence. Furthermore, before the launch of the national CET market, tier 1 nodes accounted for 42.86% of the network, whereas after the launch, their proportion decreased to 36.37%, indicating that during the regional CET pilot stage, the carbon power system exhibited a larger network size, a more unstable structure, and higher susceptibility to the impact of influential markets, resulting in easier risk propagation throughout the network.
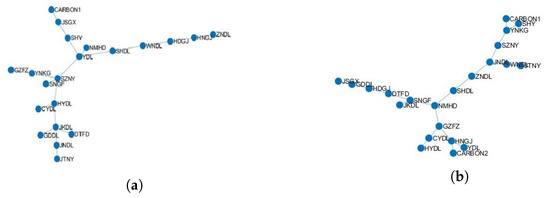
Figure 5.
Minimum spanning tree: (a) regional CET pilot stage; (b) national CET market launch stage.
5.4.2. Dynamically Normalize Tree Length
We proceed with a detailed analysis of the MST structure using dynamic correlation coefficients obtained from time-varying copula models. By evaluating its time-varying characteristics, we can observe the evolution of risk within the network. The standardized tree length, which reflects the compactness of the network, is a useful measure of the network structure. A higher value indicates looser connections between nodes, resulting in slower risk or information propagation within the network, and vice versa. The red line represents the cut-off line for the launch of the national carbon market.
As illustrated in Figure 6, the standardized tree length of the system decreases under the influence of major events such as the Sino–US trade war in 2018, the COVID-19 epidemic in 2020, and the Russia–Ukraine war in 2022. This suggests that as risk increases, the network connections become tighter, facilitating the spread of risk among nodes. This finding aligns with the conclusions drawn from the dynamic spillover index. Although the rolling normalized length and network overflow index have different definitions and values, they serve as informative indicators reflecting the overall connectivity level within the system, and thus yield consistent results. Furthermore, a noticeable fluctuation in the standardized tree length is observed during the China regional CET pilot stage, characterized by several extremely low values. In contrast, the standardized tree length exhibits greater stability and maintains a relatively high level during the operation of the national CET market. This further confirms that the transmission of systemic risk is stronger in the regional CET pilot stage compared to the national CET market operation stage.
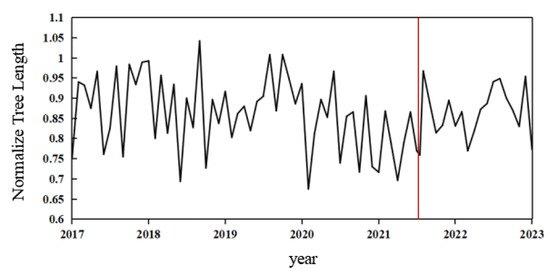
Figure 6.
Dynamically normalize tree length. (Note: The ordinate represents the normalize tree length results of the system, and the abscissa represents the year.)
5.4.3. Network Topological Property
To delve deeper into the identification of key variables in the network structure, we utilized three widely used centrality measures in academic research: degree centrality, proximity centrality, and intermediate centrality. Table 2 and Table 3 present the summary statistical data for each centrality indicator.
Table 2.
Summary statistics for centrality measures before the launch of the national carbon market.
Table 3.
Summary statistics for centrality measures after the launch of the national carbon market.
Prior to the launch of the national CET market, YDL and SZNY exhibited the highest degree centrality, closeness centrality, and betweenness centrality within the system. These two power companies held pivotal positions in the network, indicating their significant influence on risk contagion during this stage. This can be attributed to their focus on Guangdong and Shenzhen, where the CET markets were highly active, leading to fluctuations in the stock prices of these listed power companies. However, after the launch of the national CET market, notable changes occurred in the central nodes. Among them, NMHD emerged as the most central node, occupying a key position in the network. In contrast, the centrality of YDL and SZNY decreased significantly. This shift can be explained by the fact that Inner Mongolia, being rich in energy resources with relatively low energy prices and a lower technological level, has greater potential to adopt new technologies for emission reduction. As a result, it may become a major seller of carbon quotas, positioning it as a key player in the network due to lower marginal emission reduction costs and higher initial carbon emission quotas.
Furthermore, examining the centrality results of the local regional CET market and the national CET market, both displayed weaker degrees of centrality. However, the closeness centrality of the national CET market (0.1858) surpassed that of the local regional CET market (0.1556), indicating stronger risk transmission efficiency between the national CET market and power companies. This finding further validates the aforementioned spillover results.
To visually illustrate the changes in centrality before and after the launch of the national CET market, we created a radar chart displaying the tightness centrality of each variable during the two stages. As depicted in Figure 7, the centrality of different variables was generally higher during the regional CET pilot stage compared to the national CET market launch stage. This suggests an expansion in the risk transmission path of the entire system, accompanied by a decline in risk transmission efficiency following the introduction of the national CET market.
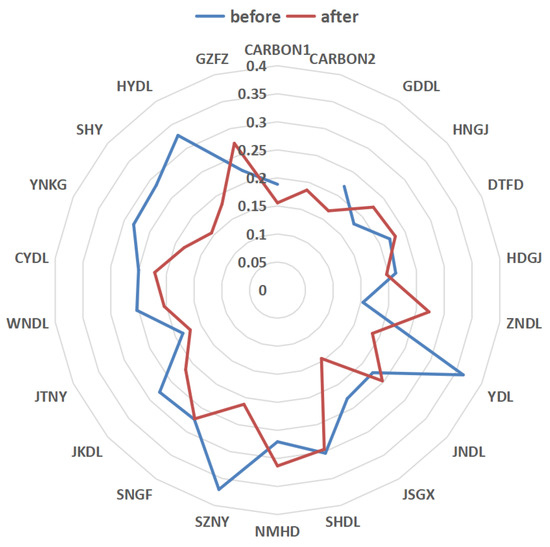
Figure 7.
Comparison of the closeness centrality of variables before and after the launch of the national carbon market.
5.5. Robustness Test
To ensure the reliability of the above results, referring to the methods of Diebold and Yilmaz [23], the prediction step size was changed to 5 and 2 days, and the scroll window was adjusted to 150 and 200 days. Figure 8 and Figure 9 show the time-varying overflow graph of the total overflow index under different prediction days and window combinations. It can be seen that the total spillover index has a consistent pattern across all situations, indicating that the results are robust for different prediction ranges and window lengths. Furthermore, we employed the Kendall correlation coefficient as an alternative to the copula correlation coefficient used in this study. By reconstructing the minimum spanning tree (MST) based on the Kendall correlation coefficient, the results shown in Figure 10 align with the previous analysis. This further validates the stability and reliability of the empirical results.
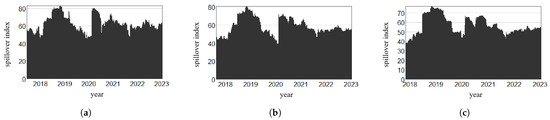
Figure 8.
Robustness checks by applying the 2-day forecast horizon: (a) 100-day rolling windows; (b) 150-day rolling windows; (c) 200-day rolling windows.
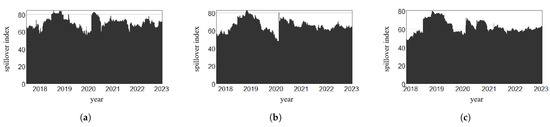
Figure 9.
Robustness checks by applying the 5-day forecast horizon: (a) 100-day rolling windows; (b) 150-day rolling windows; (c) 200-day rolling windows.
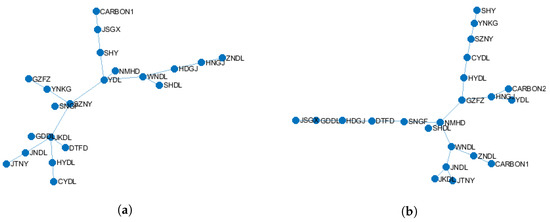
Figure 10.
Minimum spanning tree of calculated by Kendall correlation coefficient: (a) regional CET pilot stage; (b) national CET market launch stage.
6. Conclusions and Policy Implications
6.1. Conclusions
In response to the significant global carbon emission problem, China has proactively developed carbon emission trading markets. The launch of the national carbon emission trading market on 16 July 2021 has strengthened the relationship between China’s carbon emission trading market and the power market, facilitating the transfer of risks within the system. Consequently, it holds immense significance to investigate the interaction between the carbon market and power enterprises across various stages.
Therefore, utilizing the time–frequency domain spillover index model and the minimum spanning tree model, this paper examines the effects of volatility spillover and network structure characteristics between China’s CET market and electric power companies during the regional CET pilot stage and the national CET market launch stage. Furthermore, it explores the mechanism of risk transmission between markets. The main findings can be summarized as follows.
Firstly, in terms of the spillover index model results, the time domain analysis reveals a significant interaction between the CET market and power companies, as indicated by the high total spillover index of carbon power systems. The net spillover analysis indicates that the net spillover index of the local regional CET market shifted from negative to positive after the launch of the national CET market, transitioning from being a risk recipient to a risk exporter. However, the net spillover index of the national CET market is notably negative, indicating that it receives risk spillovers from power companies. It is evident that there are asymmetries in pairwise spillovers between markets when comparing the differences between the local regional CET market and the national CET market, with risks primarily transmitted from the local regional CET market to the national CET market. Simultaneously, the risk spillovers from electric power companies to the national CET market are stronger than those to the local regional CET market, while the risk spillovers from the national CET market are weaker than those from the regional CET market. The frequency-domain analysis demonstrates that long-term spillovers are the predominant driver of spillovers, indicating that spillover effects between variables mainly occur in the long term. Moreover, prior to the launch of the national CET market, local regional CET markets were all net risk recipients in different frequency domains. However, after the launch of the national CET market, the net spillover direction of the CET market changed with the frequency domain. Lastly, the dynamic spillover analysis reveals that crisis events such as the Sino–US trade war and the COVID-19 epidemic amplify risk contagion between markets.
Secondly, regarding the MST model results, the minimum spanning tree analysis conducted before and after the launch of the national CET market reveals that both the local regional CET market and the national CET market are positioned at the periphery of the network, indicating relatively weak interactions with power companies. Furthermore, the risk transmission path undergoes changes at different stages, with higher risk transmission efficiency observed during the regional CET pilot stage compared to the operational stage of the national CET market. The results of the dynamic standardized tree length demonstrate that the occurrence of crisis events leads to a reduction in the standardized tree length of the system, exacerbating risk transmission. Additionally, after the launch of the national CET market, the standardized tree length stabilizes at a high level, indicating a weakening of risk transmission. The analysis of network topology properties reveals that the key nodes in the system during the regional CET pilot stage are YDL and SZNY, whereas after the launch of the national CET market, the key nodes become NMHD. Moreover, the national CET market exhibits a higher level of centrality compared to the local regional CET market, indicating a relatively closer correlation with power companies.
6.2. Policy Implication
The research findings of this paper can serve as a theoretical and empirical basis for the development of the CET market, the electricity market, and the investment behavior of financial market participants in China. First, policymakers should focus on enhancing the coordinated development between the national CET market and the electricity market. This is particularly important during the launch of the national CET market, as it is crucial to understand the relationship and distinctions between the national CET market and local regional CET markets. Furthermore, it is important to promote the full implementation of regional and national carbon price signals. This will help reduce the cost of power system transformation, enhance production efficiency, and strengthen the impact of carbon emission reduction. Secondly, in terms of electric power enterprise development, it is important to address the short-term impact of carbon price fluctuations on production costs. This can be done by timely adjusting the allocation of carbon assets and preventing the risks associated with carbon price fluctuations. In the long run, as the CET market matures and the value of carbon assets increases, power companies should actively promote technological progress and optimize the power generation structure. This will reduce the reliance on carbon prices for power generation costs and mitigate the risks arising from carbon price fluctuations. Thirdly, regarding the development of the CET market, it is crucial to consider the role of thermal power companies as an important component with a significant impact. Attention should be given to the influence of power company stock prices on carbon pricing. It is important to clarify the information transmission mechanism of the carbon power system, monitor the power industry’s development, and focus on enterprises in key positions within the system to mitigate the risk of transmission to the CET market. Additionally, it is necessary to prevent the risk of carbon price collapse caused by risk spillover effects and implement appropriate price stabilization mechanisms to intervene in carbon prices. Lastly, when making strategic decisions, investors in power companies and carbon finance markets should consider the interaction between the CET market and power companies, as well as between regional CET markets and the national CET market. They should analyze the risk transmission mechanism between markets and mitigate investment risks by diversifying their investment portfolios.
Author Contributions
Conceptualization, J.D., Y.Z. (Yujie Zheng) and Y.Z. (Yun Zhang); Methodology, J.D., Y.Z. (Yujie Zheng) and Y.Z. (Yun Zhang); Software, J.D., Y.Z. (Yujie Zheng) and Y.Z. (Yun Zhang); Validation, J.D., Y.Z. (Yujie Zheng) and Y.Z. (Yun Zhang); Formal analysis, Y.Z. (Yujie Zheng); Investigation, Y.Z. (Yujie Zheng); Resources, J.D. and H.P.; Data curation, Y.Z. (Yujie Zheng); Writing—original draft, Y.Z. (Yujie Zheng); Writing—review & editing, J.D. and Y.Z. (Yun Zhang); Visualization, J.D., Y.Z. (Yujie Zheng) and Y.Z. (Yun Zhang); Supervision, J.D. and H.P.; Project administration, J.D. and C.L.; Funding acquisition, J.D. and C.L. All authors have read and agreed to the published version of the manuscript.
Funding
This research was funded by Fundamental Research Funds for the Central Universities (No. 2023SKQ03), Business entrusted project of National Forestry and Grassland Administration (No. 2023-JXPJ-02).
Data Availability Statement
Data will be made available on request.
Conflicts of Interest
The authors declare no conflict of interest.
Appendix A

Figure A1.
Carbon price and power company share price trend graph.
Figure A1.
Carbon price and power company share price trend graph.

Table A1.
Summary descriptive statistics of regional CET pilot stage.
Table A1.
Summary descriptive statistics of regional CET pilot stage.
| CARBON1 | GDDL | HNGJ | DTFD | HDGJ | ZNDL | YDL | JNDL | JSGX | SHDL | NMHD | SZNY | SNGF | JKDL | JTNY | WNDL | CYDL | YNKG | SHY | HYDL | GZFZ | |
|---|---|---|---|---|---|---|---|---|---|---|---|---|---|---|---|---|---|---|---|---|---|
| Mean | 21.7 | 0.97 | 1.85 | 1.72 | 1.67 | 1.22 | 1.52 | 1.46 | 2.32 | 1.57 | 1.54 | 2.11 | 1.21 | 2.11 | 2.61 | 1.62 | 2.61 | 2.8 | 2.49 | 3.02 | 1.57 |
| Maximum | 73.89 | 7.04 | 4.02 | 5.64 | 3.58 | 2.79 | 4.69 | 8.66 | 6.94 | 3.92 | 3.42 | 10.75 | 3.27 | 8.59 | 8.8 | 4.39 | 11.66 | 11.13 | 8.37 | 11.73 | 5.21 |
| Minimum | 6.21 | 0 | 0.84 | 1.04 | 0.76 | 0.77 | 0.84 | 0.9 | 1.36 | 0.96 | 1.03 | 0.99 | 0.79 | 1.12 | 1.52 | 0.91 | 1.05 | 1.3 | 1.14 | 1.45 | 0.84 |
| Std. Deviation | 13.32 | 0.69 | 0.56 | 0.66 | 0.52 | 0.35 | 0.65 | 0.74 | 0.86 | 0.48 | 0.4 | 1.42 | 0.35 | 1.13 | 1.05 | 0.55 | 1.81 | 1.71 | 1.15 | 1.72 | 0.67 |
| Kurtosis | 1.01 | 2.44 | 0.78 | 2.06 | 0.42 | 1.5 | 1.83 | 4.61 | 2.08 | 1.83 | 1.63 | 2.71 | 1.79 | 2.62 | 2.3 | 1.5 | 2.31 | 2.19 | 1.69 | 2.09 | 2.12 |
| Skewness | 3.56 | 14.24 | 3.81 | 8.35 | 2.73 | 5.46 | 6.66 | 32 | 8.82 | 7.4 | 6.13 | 11.93 | 7.25 | 11.17 | 9.52 | 6.31 | 8.86 | 7.91 | 6.17 | 8.02 | 8.6 |
| J-B | 203.36 *** | 6657.88 *** | 143.07 *** | 2089.01 *** | 36.11 *** | 696.64 *** | 1226.74 *** | 42236.04 *** | 2303.76 *** | 1487.90 *** | 939.02 *** | 4994.20 *** | 1411.47 *** | 4305.23 *** | 2909.94 *** | 911.75 *** | 2542.33 *** | 1979.50 *** | 979.12 *** | 1956.05 *** | 2256.91 *** |
| ADF | −8.36 *** | −14.05 *** | −3.18 *** | −5.52 *** | −3.79 *** | −4.95 *** | −5.79 *** | −6.38 *** | −6.05 *** | −4.36 *** | −5.87 *** | −3.17 *** | −5.88 *** | −6.38 *** | −5.96 *** | −4.90 *** | −3.15 *** | −4.67 *** | −5.12 *** | −4.50 *** | −5.95 *** |
Notes: Jarque-Bera tests for the null hypothesis of a normal distribution. ADF tests the estimates of the Augmented Dikey Fuller unit roots tests; *** denote significance at the 1% level.
Table A2.
Index table of spillover before the launch of the national carbon market.
Table A2.
Index table of spillover before the launch of the national carbon market.
| CARBON1 | GDDL | HNGJ | DTFD | HDGJ | ZNDL | YDL | JNDL | JSGX | SHDL | NMHD | SZNY | SNGF | JKDL | JTNY | WNDL | CYDL | YNKG | SHY | HYDL | GZFZ | FROM | |
|---|---|---|---|---|---|---|---|---|---|---|---|---|---|---|---|---|---|---|---|---|---|---|
| CARBON1 | 92.01 | 0.07 | 0.36 | 0.59 | 0.57 | 0.07 | 1.25 | 0.02 | 0.91 | 0.04 | 0.13 | 0.16 | 0.1 | 0.04 | 0.56 | 0.05 | 0.08 | 0.07 | 0.1 | 2.31 | 0.52 | 7.99 |
| GDDL | 0.5 | 41.49 | 4.25 | 4.99 | 5.33 | 3.92 | 2.52 | 2.05 | 1.52 | 2.65 | 4.01 | 1.3 | 2.3 | 4.05 | 3.25 | 5.87 | 1.4 | 1.5 | 3.16 | 2.53 | 1.41 | 58.51 |
| HNGJ | 0.06 | 5.54 | 42.35 | 7.35 | 20.63 | 2.51 | 0.67 | 1.11 | 0.19 | 2.61 | 1.41 | 0.93 | 0.99 | 3.38 | 2.9 | 4.3 | 0.37 | 0.39 | 0.64 | 0.57 | 1.11 | 57.65 |
| DTFD | 0.15 | 4.37 | 5.43 | 37.84 | 4.82 | 3.7 | 0.95 | 1.79 | 1.34 | 5.53 | 5.47 | 2.36 | 0.75 | 9.24 | 1.29 | 2.9 | 1.17 | 0.8 | 1.25 | 6.89 | 1.97 | 62.16 |
| HDGJ | 0.2 | 4.97 | 14.73 | 5.92 | 36.92 | 2.81 | 3.02 | 1.8 | 0.64 | 3.87 | 3.22 | 1.16 | 1.33 | 2.9 | 2.14 | 6.57 | 1.66 | 0.47 | 2.6 | 1.23 | 1.83 | 63.08 |
| ZNDL | 0.04 | 5.52 | 4.08 | 6.16 | 3.73 | 39.18 | 2.91 | 3.09 | 3.26 | 5.41 | 3.13 | 2.88 | 4.44 | 3.46 | 1.83 | 5.7 | 0.49 | 1.15 | 1.36 | 0.95 | 1.24 | 60.82 |
| YDL | 0.81 | 4.07 | 1.61 | 2.92 | 3.71 | 2.38 | 32.6 | 1.59 | 1.05 | 4.16 | 7.2 | 4.44 | 2.12 | 2.44 | 4.36 | 5.54 | 1.75 | 1.46 | 7.36 | 3.77 | 4.66 | 67.4 |
| JNDL | 0.07 | 4.48 | 1.98 | 6.65 | 2.34 | 5.25 | 3.67 | 31.65 | 0.34 | 3.44 | 9.39 | 5.46 | 1.35 | 3.41 | 4.4 | 6.67 | 1.34 | 0.67 | 2.72 | 2.74 | 1.99 | 68.35 |
| JSGX | 0.08 | 2.6 | 0.42 | 1.76 | 1.11 | 4.31 | 3.89 | 0.3 | 51.33 | 3.24 | 3.88 | 1.35 | 1.72 | 1.93 | 1.62 | 3.49 | 1.2 | 4.36 | 4.27 | 0.32 | 6.79 | 48.67 |
| SHDL | 0.01 | 4.64 | 1.25 | 2.41 | 2.79 | 2.19 | 2.32 | 0.9 | 1.82 | 49.12 | 2.7 | 6.79 | 1.33 | 5 | 1.71 | 5.19 | 2.13 | 0.45 | 1.9 | 3.66 | 1.69 | 50.88 |
| NMHD | 0.3 | 3.49 | 1.56 | 7.57 | 2.82 | 2.03 | 5 | 2.95 | 0.58 | 3.41 | 38.61 | 2.34 | 1.34 | 3.89 | 1.87 | 6.47 | 3.34 | 0.82 | 4.69 | 4.55 | 2.37 | 61.39 |
| SZNY | 0.15 | 3.77 | 0.84 | 3.87 | 0.86 | 1.39 | 2.82 | 0.28 | 0.67 | 6.8 | 3.69 | 43.49 | 0.87 | 5.3 | 1 | 2.68 | 3.73 | 3.69 | 2.44 | 10.31 | 1.36 | 56.51 |
| SNGF | 0.92 | 6.07 | 1.15 | 2.21 | 2.59 | 5.32 | 3.72 | 3.61 | 1.97 | 2.33 | 4.96 | 5.41 | 39.19 | 1.17 | 3.34 | 5.02 | 1.64 | 2.19 | 3.29 | 2.16 | 1.73 | 60.81 |
| JKDL | 0.89 | 5.01 | 2.26 | 5.21 | 2.3 | 1.73 | 1.94 | 2.75 | 0.37 | 4.76 | 3.57 | 4.2 | 0.63 | 39.04 | 1.4 | 4.29 | 1.09 | 7.55 | 1.74 | 5.89 | 3.38 | 60.96 |
| JTNY | 0.31 | 2.54 | 2.1 | 7.37 | 2.02 | 2.02 | 1.28 | 2.21 | 1.6 | 2.55 | 3.51 | 1.09 | 2.42 | 4.23 | 47.43 | 6.87 | 0.84 | 0.79 | 1.55 | 6.25 | 1.02 | 52.57 |
| WNDL | 0.1 | 5.83 | 3.65 | 3.2 | 5.24 | 3.49 | 4.1 | 1.23 | 0.85 | 6.83 | 3.81 | 2.3 | 3.23 | 4.4 | 5.01 | 34.73 | 2.07 | 1.36 | 3.61 | 1.61 | 3.37 | 65.27 |
| CYDL | 0.01 | 2.04 | 0.7 | 1.86 | 1.6 | 0.7 | 1.08 | 0.93 | 0.45 | 7.33 | 3.66 | 7.91 | 0.53 | 2.76 | 0.53 | 2.2 | 41.05 | 2.26 | 2.12 | 19.67 | 0.62 | 58.95 |
| YNKG | 0.26 | 4.08 | 0.39 | 2.23 | 1.34 | 2.37 | 0.46 | 1.98 | 1.27 | 1.87 | 5.5 | 3.9 | 1.39 | 3.48 | 1.18 | 2.26 | 1.5 | 53.85 | 2.1 | 5.16 | 3.44 | 46.15 |
| SHY | 1.94 | 3.1 | 0.28 | 1.27 | 1.8 | 2.21 | 4.41 | 1.28 | 0.67 | 4.17 | 7.09 | 4.16 | 2.88 | 2.16 | 2.76 | 6.15 | 1.13 | 2.02 | 43.2 | 2.91 | 4.39 | 56.8 |
| HYDL | 0.16 | 2.24 | 0.87 | 5.06 | 0.69 | 0.69 | 0.51 | 0.41 | 0.08 | 3.71 | 2.72 | 7.93 | 0.29 | 7.2 | 0.89 | 0.98 | 5.61 | 4.15 | 1.98 | 52.4 | 1.41 | 47.6 |
| GZFZ | 0.1 | 3.46 | 0.58 | 2.02 | 1.05 | 1.52 | 2.36 | 0.42 | 0.91 | 4.04 | 2.45 | 2.43 | 1.05 | 2.77 | 2.1 | 3.11 | 0.39 | 4.95 | 3.33 | 2.43 | 58.53 | 41.47 |
| TO | 7.08 | 77.9 | 48.48 | 80.6 | 67.32 | 50.62 | 48.86 | 30.68 | 20.51 | 78.77 | 81.5 | 68.51 | 31.06 | 73.21 | 44.15 | 86.3 | 32.9 | 41.11 | 52.21 | 85.91 | 46.31 | TCL |
| NET | −0.91 | 19.39 | −9.17 | 18.44 | 4.24 | −10.2 | −18.54 | −37.67 | −28.16 | 27.89 | 20.11 | 12 | −29.75 | 12.25 | −8.42 | 21.03 | −26.04 | −5.04 | −4.59 | 38.3 | 4.83 | 54.95 |
Table A3.
Index table of spillover after the launch of the national carbon market.
Table A3.
Index table of spillover after the launch of the national carbon market.
| CARBON1 | CARBON2 | GDDL | HNGJ | DTFD | HDGJ | ZNDL | YDL | JNDL | JSGX | SHDL | NMHD | SZNY | SNGF | JKDL | JTNY | WNDL | CYDL | YNKG | SHY | HYDL | GZFZ | FROM | |
|---|---|---|---|---|---|---|---|---|---|---|---|---|---|---|---|---|---|---|---|---|---|---|---|
| CARBON1 | 88.36 | 1.4 | 1 | 0.46 | 0.44 | 0.08 | 0.4 | 0.18 | 0.26 | 0.24 | 0.77 | 1.5 | 0.12 | 0.54 | 0.4 | 0.51 | 0.58 | 0.31 | 0.4 | 0.62 | 0.4 | 1.03 | 11.64 |
| CARBON2 | 3.83 | 69.04 | 4.89 | 3.82 | 1.67 | 0.77 | 0.13 | 2.02 | 2.1 | 0.07 | 0.21 | 0.63 | 0.16 | 2.57 | 2.87 | 1.24 | 1.57 | 0.11 | 0.25 | 0.05 | 0.51 | 1.48 | 30.96 |
| GDDL | 1.02 | 2.1 | 40.01 | 10.86 | 1.48 | 13.87 | 0.08 | 8.45 | 0.49 | 2.64 | 0.46 | 0.04 | 2.84 | 0.17 | 1.53 | 1.37 | 0.22 | 4.91 | 0.13 | 0.51 | 5.96 | 0.87 | 59.99 |
| HNGJ | 1.5 | 0.07 | 7.16 | 43.83 | 5.9 | 16.4 | 0.57 | 5.47 | 0.06 | 0.18 | 8.23 | 3 | 0.31 | 2.19 | 0.4 | 1.2 | 0.08 | 0.83 | 1.21 | 0.02 | 1.11 | 0.28 | 56.17 |
| DTFD | 0.23 | 0 | 3.8 | 7.46 | 28.92 | 10.36 | 2.71 | 0.93 | 3.14 | 1.52 | 6.68 | 8.41 | 3.94 | 8.38 | 2.6 | 2.11 | 3.46 | 0.13 | 2.44 | 0.56 | 0.11 | 2.12 | 71.08 |
| HDGJ | 0.06 | 0.22 | 8.9 | 15.27 | 7.31 | 38.31 | 0.26 | 5.53 | 0.13 | 2.23 | 4.1 | 1.97 | 0.24 | 2 | 2.38 | 0.01 | 1.83 | 3.71 | 0.06 | 0.23 | 5.16 | 0.08 | 61.69 |
| ZNDL | 0.43 | 0.33 | 0.86 | 0.59 | 3.93 | 2.94 | 33.28 | 0.61 | 10.84 | 2.57 | 3.9 | 7.3 | 6.93 | 3.21 | 4.02 | 5.36 | 4.1 | 2.32 | 1.83 | 0.83 | 1.19 | 2.61 | 66.72 |
| YDL | 0.21 | 0.25 | 6.07 | 7.51 | 1.46 | 7.67 | 2.72 | 26.34 | 3.29 | 0.59 | 0.14 | 0.04 | 7.07 | 0.01 | 0.51 | 5.98 | 2.5 | 11.54 | 1.27 | 2.99 | 11.63 | 0.23 | 73.66 |
| JNDL | 1.09 | 0.01 | 0.73 | 1.61 | 5.9 | 1.72 | 7.96 | 1.64 | 25.07 | 0.78 | 2.8 | 5.37 | 9.97 | 6.41 | 3.56 | 4.71 | 7.98 | 4.1 | 1.55 | 1.74 | 2.44 | 2.86 | 74.93 |
| JSGX | 0.03 | 0.06 | 3.67 | 0.61 | 1.1 | 2.93 | 4.74 | 2.94 | 0.73 | 61.77 | 0.83 | 0.15 | 1.04 | 0.36 | 0.79 | 1.54 | 2.96 | 5 | 4.15 | 0.49 | 3.47 | 0.65 | 38.23 |
| SHDL | 0.13 | 2.41 | 1.18 | 10.43 | 10.31 | 11.69 | 2.02 | 1.18 | 1.55 | 1.57 | 26.6 | 13.43 | 3.3 | 2.85 | 3.36 | 0.23 | 2.13 | 0.14 | 0.68 | 0.47 | 0.08 | 4.23 | 73.4 |
| NMHD | 1.01 | 0.35 | 1.1 | 3.81 | 5.23 | 7 | 5.22 | 0.72 | 3.07 | 2.6 | 2.58 | 36.43 | 3.64 | 5.78 | 3.63 | 3.36 | 7.83 | 0.18 | 0.21 | 0.25 | 0.1 | 5.9 | 63.57 |
| SZNY | 0.86 | 0.04 | 1.41 | 0.7 | 2.23 | 0.29 | 7.35 | 4.71 | 7.4 | 1.07 | 3.02 | 2.66 | 24.51 | 3.08 | 2.43 | 5.03 | 3.47 | 12.79 | 2.8 | 1.95 | 9.15 | 3.05 | 75.49 |
| SNGF | 0.63 | 0.07 | 0.47 | 5.55 | 10.9 | 4.69 | 2.87 | 0.12 | 4.22 | 0.29 | 5.18 | 6.96 | 5.26 | 24.81 | 10.54 | 2.45 | 6.83 | 0.24 | 2.18 | 3.15 | 0.04 | 2.55 | 75.19 |
| JKDL | 0.14 | 0.3 | 2.5 | 6.17 | 4.57 | 5.15 | 2.48 | 0.12 | 2.84 | 0.12 | 2.24 | 5.48 | 2.32 | 6.7 | 45.55 | 1.65 | 2.93 | 0.34 | 2.3 | 1.06 | 0.14 | 4.88 | 54.45 |
| JTNY | 0.14 | 0.05 | 1.06 | 0.82 | 4.16 | 1.05 | 6.69 | 2.61 | 4.86 | 0.92 | 0.76 | 4.35 | 7.45 | 5.4 | 2.13 | 37.6 | 9.78 | 3.31 | 0.33 | 0.88 | 2.06 | 3.6 | 62.4 |
| WNDL | 0.29 | 0.14 | 1.5 | 2.98 | 8.76 | 3.69 | 4.58 | 0.64 | 7.46 | 0.54 | 4.97 | 6.32 | 4.75 | 7.56 | 2.92 | 6.87 | 28.6 | 0.54 | 0.26 | 0.51 | 0.71 | 5.43 | 71.4 |
| CYDL | 0.18 | 0.02 | 2.64 | 0.51 | 0.01 | 5.89 | 3.02 | 10.24 | 3.42 | 1.4 | 0.94 | 0.32 | 14.82 | 0.07 | 0.21 | 4.7 | 0.26 | 30.38 | 1.94 | 1.9 | 16.43 | 0.71 | 69.62 |
| YNKG | 1.34 | 0.1 | 0.48 | 0.08 | 0.22 | 0.2 | 7.37 | 3.42 | 4.92 | 0.91 | 0.22 | 5.85 | 9.79 | 0.82 | 3.66 | 3.76 | 0.75 | 6.42 | 39.89 | 2.16 | 6.31 | 1.33 | 60.11 |
| SHY | 0.25 | 0.28 | 0.41 | 0.82 | 1.73 | 0.17 | 1.69 | 2.05 | 2.81 | 0.89 | 3.23 | 1.45 | 2.99 | 3.78 | 3.41 | 2.67 | 0.41 | 1.62 | 4.64 | 61.38 | 0.76 | 2.56 | 38.62 |
| HYDL | 0.17 | 0.01 | 3.09 | 0.86 | 0.4 | 7.54 | 1.91 | 10.78 | 2.32 | 1.9 | 0.79 | 0.02 | 13.51 | 0.02 | 0.23 | 3.17 | 0.55 | 27.21 | 1.14 | 1.34 | 22.57 | 0.45 | 77.43 |
| GZFZ | 0.84 | 1.46 | 1.05 | 2.51 | 4.05 | 2.05 | 1.83 | 0.2 | 2.19 | 0.1 | 4.49 | 12.95 | 7.81 | 2.1 | 2.52 | 2.26 | 4.13 | 2.5 | 2.16 | 1.46 | 2.38 | 38.96 | 61.04 |
| TO | 14.37 | 9.67 | 53.97 | 83.43 | 81.75 | 106.16 | 66.62 | 64.54 | 68.12 | 23.14 | 56.56 | 88.2 | 108.25 | 63.99 | 54.08 | 60.17 | 64.34 | 88.25 | 31.94 | 23.18 | 70.16 | 46.91 | 1327.79 |
| NET | 2.72 | −21.29 | −6.02 | 27.25 | 10.68 | 44.46 | −0.1 | −9.12 | −6.81 | −15.09 | −16.84 | 24.63 | 32.76 | −11.19 | −0.37 | -2.23 | −7.06 | 18.63 | -28.18 | −15.44 | −7.27 | −14.13 | 60.35 |
References
- Can, M.; Ben Jebli, M.; Brusselaers, J. Can green trade save the environment? Introducing the Green (Trade) Openness Index. Environ. Sci. Pollut. Res. 2022, 29, 44091–44102. [Google Scholar] [CrossRef] [PubMed]
- Cheng, Q.; Qiao, H.; Gu, Y.; Chen, Z. Price Dynamics and Interactions between the Chinese and European Carbon Emission Trading Markets. Energies 2023, 16, 1624. [Google Scholar] [CrossRef]
- Yu, H.; Wang, H.; Liang, C.; Liu, Z.; Wang, S. Carbon market volatility analysis based on structural breaks: Evidence from EU-ETS and China. Front. Environ. Sci. 2022, 10, 973855. [Google Scholar] [CrossRef]
- Liu, J.; Hu, Y.; Yan, L.Z.; Chang, C.P. Volatility spillover and hedging strategies between the European carbon emissions and energy markets. Energy Strategy Rev. 2023, 46, 101058. [Google Scholar] [CrossRef]
- Gargallo, P.; Lample, L.; Miguel, J.A.; Salvador, M. Dynamic risk management in European energy portfolios: Evolution of the role of clean and carbon markets. Energy Rep. 2022, 8, 15654–15668. [Google Scholar] [CrossRef]
- Hui-Yuan, Q. Background, Status and Development Suggestion of China’s Carbon Trading Market. China Environ. Prot. Ind. 2017. [Google Scholar]
- Li, Y.; Nie, D.; Li, B.; Li, X. The Spillover Effect between Carbon Emission Trading (CET) Price and Power Company Stock Price in China. Sustainability 2020, 12, 6573. [Google Scholar] [CrossRef]
- Ji, Q.; Xia, T.; Liu, F.; Xu, J.H. The information spillover between carbon price and power sector returns: Evidence from the major European electricity companies. J. Clean. Prod. 2019, 208, 1178–1187. [Google Scholar] [CrossRef]
- Hirschman, A.O. The Strategy of Economic Development; Technical Report; Yale University Press: New Haven, CT, USA, 1958. [Google Scholar]
- García, A.; García-Álvarez, M.T.; Moreno, B. The impact of EU allowance prices on the stock market indices of the European power industries: Evidence from the ongoing EU ETS phase III. Organ. Environ. 2021, 34, 459–478. [Google Scholar] [CrossRef]
- Zhang, F.; Fang, H.; Wang, X. Impact of carbon prices on corporate value: The case of China’s thermal listed enterprises. Sustainability 2018, 10, 3328. [Google Scholar] [CrossRef]
- Tian, Y.; Akimov, A.; Roca, E.; Wong, V. Does the carbon market help or hurt the stock price of electricity companies? Further evidence from the European context. J. Clean. Prod. 2016, 112, 1619–1626. [Google Scholar] [CrossRef]
- Mo, J.L.; Zhu, L.; Fan, Y. The impact of the EU ETS on the corporate value of European electricity corporations. Energy 2012, 45, 3–11. [Google Scholar] [CrossRef]
- Oberndorfer, U. EU emission allowances and the stock market: Evidence from the electricity industry. Ecol. Econ. 2009, 68, 1116–1126. [Google Scholar] [CrossRef]
- Deeney, P.; Cummins, M.; Dowling, M.; Smeaton, A.F. Influences from the European Parliament on EU emissions prices. Energy Policy 2016, 88, 561–572. [Google Scholar] [CrossRef]
- Zhu, B.; Han, D.; Chevallier, J.; Wei, Y.M. Dynamic multiscale interactions between European carbon and electricity markets during 2005–2016. Energy Policy 2017, 107, 309–322. [Google Scholar] [CrossRef]
- Zhu, B.; Huang, L.; Yuan, L.; Ye, S.; Wang, P. Exploring the risk spillover effects between carbon market and electricity market: A bidimensional empirical mode decomposition based conditional value at risk approach. Int. Rev. Econ. Financ. 2020, 67, 163–175. [Google Scholar] [CrossRef]
- Yang, L. Idiosyncratic information spillover and connectedness network between the electricity and carbon markets in Europe. J. Commod. Mark. 2022, 25, 100185. [Google Scholar] [CrossRef]
- Zhao, Y.; Zhou, Z.; Zhang, K.; Huo, Y.; Sun, D.; Zhao, H.; Sun, J.; Guo, S. Research on spillover effect between carbon market and electricity market: Evidence from Northern Europe. Energy 2023, 263, 126107. [Google Scholar] [CrossRef]
- Zhu, H.; Tang, Y.; Peng, C.; Yu, K. The heterogeneous response of the stock market to emission allowance price: Evidence from quantile regression. Carbon Manag. 2018, 9, 277–289. [Google Scholar] [CrossRef]
- Rehman, M.U.; Shahzad, S.J.H.; Ahmad, N.; Vo, X.V. Dependence among metals and mining companies of the US and Europe during normal and crises periods. Resour. Policy 2021, 73, 102199. [Google Scholar] [CrossRef]
- Ouyang, R.; Zhuang, C.; Wang, T.; Zhang, X. Network analysis of risk transmission among energy futures: An industrial chain perspective. Energy Econ. 2022, 107, 105798. [Google Scholar] [CrossRef]
- Diebold, F.X.; Yilmaz, K. Measuring financial asset return and volatility spillovers, with application to global equity markets. Econ. J. 2009, 119, 158–171. [Google Scholar] [CrossRef]
- Diebold, F.X.; Yilmaz, K. Better to give than to receive: Predictive directional measurement of volatility spillovers. Int. J. Forecast. 2012, 28, 57–66. [Google Scholar] [CrossRef]
- Diebold, F.X.; Yılmaz, K. On the network topology of variance decompositions: Measuring the connectedness of financial firms. J. Econom. 2014, 182, 119–134. [Google Scholar] [CrossRef]
- Baruník, J.; Kočenda, E.; Vácha, L. Asymmetric connectedness on the US stock market: Bad and good volatility spillovers. J. Financ. Mark. 2016, 27, 55–78. [Google Scholar] [CrossRef]
- Mantegna, R.N.; Stanley, H.E. Introduction to Econophysics: Correlations and Complexity in Finance; Cambridge University Press: Cambridge, MA, USA, 1999. [Google Scholar]
- Siudak, D. A network analysis of the value migration process on the financial market. The effect of value migration network structure on stock returns. Expert Syst. Appl. 2022, 191, 116129. [Google Scholar] [CrossRef]
- Zeng, Z.J.; Xie, C.; Yan, X.G.; Hu, J.; Mao, Z. Are stock market networks non-fractal? Evidence from New York Stock Exchange. Financ. Res. Lett. 2016, 17, 97–102. [Google Scholar] [CrossRef]
- Jin, Y.; Zhang, A.; Liu, B. Risk spillover networks in financial markets: Evidence from emerging markets. Manag. Decis. Econ. 2023. [Google Scholar] [CrossRef]
- Wang, G.J.; Xie, C.; Chen, S. Multiscale correlation networks analysis of the US stock market: A wavelet analysis. J. Econ. Interact. Coord. 2017, 12, 561–594. [Google Scholar] [CrossRef]
- Zhao, B.; Yang, W.; Wen, J.; Zhang, W. The financial market in China under the COVID-19. Emerg. Mark. Financ. Trade 2022, 58, 3726–3738. [Google Scholar] [CrossRef]
- Karim, S.; Naeem, M.A.; Hu, M.; Zhang, D.; Taghizadeh-Hesary, F. Determining dependence, centrality, and dynamic networks between green bonds and financial markets. J. Environ. Manag. 2022, 318, 115618. [Google Scholar] [CrossRef] [PubMed]
- Mantegna, R.N. Hierarchical structure in financial markets. Eur. Phys. J. B Condens. Matter Complex Systems 1999, 11, 193–197. [Google Scholar] [CrossRef]
- Kruskal, J.B. On the shortest spanning subtree of a graph and the traveling salesman problem. Proc. Am. Math. Soc. 1956, 7, 48–50. [Google Scholar] [CrossRef]
- Deng, J.; Xu, Z.; Xing, X. Dynamic spillovers between clean energy and non-ferrous metals markets in China: A network-based analysis during the COVID-19 pandemic. Resour. Policy 2023, 83, 103575. [Google Scholar] [CrossRef]
- Samitas, A.; Kampouris, E.; Polyzos, S. Covid-19 pandemic and spillover effects in stock markets: A financial network approach. Int. Rev. Financ. Anal. 2022, 80, 102005. [Google Scholar] [CrossRef]
- Aslam, F.; Mohmand, Y.T.; Ferreira, P.; Memon, B.A.; Khan, M.; Khan, M. Network analysis of global stock markets at the beginning of the coronavirus disease (Covid-19) outbreak. Borsa Istanb. Rev. 2020, 20, S49–S61. [Google Scholar] [CrossRef]


Disclaimer/Publisher’s Note: The statements, opinions and data contained in all publications are solely those of the individual author(s) and contributor(s) and not of MDPI and/or the editor(s). MDPI and/or the editor(s) disclaim responsibility for any injury to people or property resulting from any ideas, methods, instructions or products referred to in the content. |
© 2023 by the authors. Licensee MDPI, Basel, Switzerland. This article is an open access article distributed under the terms and conditions of the Creative Commons Attribution (CC BY) license (https://creativecommons.org/licenses/by/4.0/).